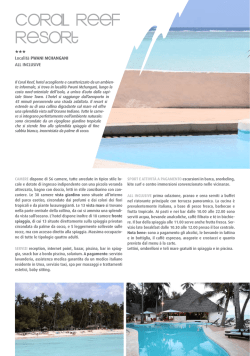
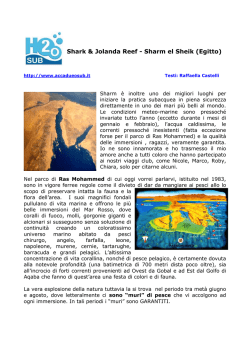
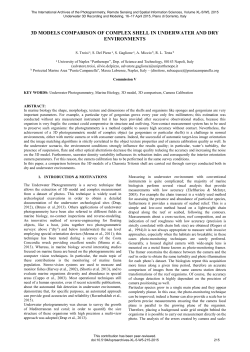
The International Archives of the Photogrammetry, Remote Sensing and Spatial Information Sciences, Volume XL-5/W5, 2015
Underwater 3D Recording and Modeling, 16–17 April 2015, Piano di Sorrento, Italy
UTILIZING UNDERWATER THREE-DIMENSIONAL MODELING TO ENHANCE
ECOLOGICAL AND BIOLOGICAL STUDIES OF CORAL REEFS
J. H. R. Burns a, *, D. Delparte b, R. D. Gates c, M. Takabayashi d
a
Department of Biology, College of Natural Sciences, University of Hawai‘i at Mānoa, 2538 McCarthy Mall, Edmondson Hall
Room 216, Honolulu, HI 96822, USA - [email protected]
b
Department of Geosciences, Idaho State University, 921 S. 8th Ave., STOP 8072. Pocatello, ID 83209, USA – [email protected]
c
Hawai‘i Institute of Marine Biology, University of Hawai‘i at Mānoa, PO Box 1346, Kaneohe, HI 96722, USA –
[email protected]
d
Marine Science Department, University of Hawai‘i at Hilo, 200 W. Kawili St., Hilo, HI 96720, USA – [email protected]
Commission V
KEY WORDS: Coral Reefs, Coral Ecology, Habitat, Photogrammetry, Structure-from-Motion, Structural Complexity, 3D
topographic reconstruction, 3D underwater modeling
ABSTRACT:
The structural complexity of coral reefs profoundly affects the biodiversity, productivity, and overall functionality of reef
ecosystems. Conventional survey techniques utilize 2-dimensional metrics that are inadequate for accurately capturing and
quantifying the intricate structural complexity of scleractinian corals. A 3-dimensional (3D) approach improves the capacity to
accurately measure architectural complexity, topography, rugosity, volume, and other structural characteristics that play a significant
role in habitat facilitation and ecosystem processes. This study utilized Structure-from-Motion (SfM) photogrammetry techniques to
create 3D mesh models for several Hawaiian corals that represent distinct morphological phenotypes. The orthophotos and digital
elevation models generated from the SfM process were imported into geospatial analysis software in order to quantify several
metrics pertaining to 3D complexity that are known to affect ecosystem biodiversity and productivity. The 3D structural properties of
the reconstructed coral colonies were statistically analyzed to determine if the each species represents a unique morpho-functional
group. The SfM reconstruction techniques described in this paper can be utilized for an array of research purposes to improve our
understanding of how changes in coral composition affect habitat structure and ecological processes in coral reef ecosystems.
1. INTRODUCTION
Reef forming corals provide the structural foundation of highly
diverse and productive coral reef ecosystems. Coral reefs are
among the most ecologically and economically productive
ecosystems on the planet, supporting an estimated eukaryotic
species richness ranging from 650,000 to over 9 million (ReakaKudla 1997), and generating an estimated US$375 billion each
year through recreation, tourism, waste treatment, and
production of raw materials (Costanza et al. 1997, HoeghGuldberg et al. 2007). Coral reefs have experienced severe
declines in integrity due to increased intensity and frequency of
environmental stress associated with global climate change and
local anthropogenic disturbances (Harvell et al. 1999, HoeghGuldberg et al. 2007). Loss of corals detrimentally affects an
array of ecological processes and can result in phase shifts from
coral to algal dominated states. Degradation and recovery of
corals are typically measured through two-dimensional (2D)
assessments of coral cover; however, this metric fails to capture
changes occurring in architectural complexity (Alvarez-Filip et
al. 2011). Precisely quantifying the structural characteristics of
corals is essential for assessing how mortality or shifts in
composition affect critical ecosystem services.
The importance of the three-dimensional (3D) structure and
topographic complexity of coral reefs to the ecological function
of these ecosystems has been recognized for a number of
decades (Risk 1972, Luckhurst and Luckhurst 1978). Structural
complexity in ecosystems creates an assortment of microhabitat
types and has been shown to support greater diversity and
abundance of associated organisms (MacArthur and MacArthur
1961, Crowder and Cooper 1982, Graham and Nash 2013). In
an ecological context, it has been suggested that the two
primary variables driving coral reef resilience are reef
framework and reef-building capacity, both of which can be
quantified with 3D measures of topographic structure (Done
1997, Fisher et al. 2007). The increase in disturbance and
degradation of these environments has made accurate
quantification of structural complexity increasingly important.
Unfortunately, the cost and technical difficulty of collecting
accurate 3D information from underwater environments has
limited the ability to decipher specific structural elements
responsible for driving ecological processes. Developing a
feasible and accurate approach for 3D reconstruction will allow
for determining how disturbance, mortality, and phase shifts
affect the biodiversity and productivity of coral reef ecosystems.
Creating 3D reconstructions of natural environments has
historically been a challenging and costly undertaking.
However, advancements in both computer technologies and
computer vision algorithms now make it possible to efficiently
reconstruct the 3D geometry of fixed objects. Structure-fromMotion is a recently developed photogrammetric technology
that provides a simple and low-cost method for high-resolution
3D topographic reconstruction. SfM determines the geometry of
the photographed scene, camera positions and geometry without
the need for a network of targets with known 3D positions
(Snavely et al. 2008, Westoby et al. 2012). Camera pose and 3D
geometry are reconstructed simultaneously by automatically
matching invariant features among overlapping images (Snavely
et al. 2008, Westoby et al. 2012). The features are tracked
throughout the image processing to develop initial estimates of
object coordinates, which are then further refined with highly
redundant bundle adjustments (Snavely et al. 2008, Westoby et
This contribution has been peer-reviewed.
doi:10.5194/isprsarchives-XL-5-W5-61-2015
61
The International Archives of the Photogrammetry, Remote Sensing and Spatial Information Sciences, Volume XL-5/W5, 2015
Underwater 3D Recording and Modeling, 16–17 April 2015, Piano di Sorrento, Italy
al. 2012). The end result of the process is a dense 3D point
cloud of identifiable features in a relative coordinate system.
Once georeferenced, this point cloud can be used to quantify 3D
characteristics of the reconstructed scene (Fonstad et al. 2013).
Automating the process of detecting invariant features to 3D
reconstruction of scene geometry makes SfM more efficient and
cost-effective than traditional photogrammetric methodologies.
Several studies have validated the accuracy of SfM products for
high-resolution 3D topographic analyses, and in some cases
found SfM to be comparable to more expensive LIDAR
techniques (Delparte et al. 2014, Javernick et al. 2014).
The SfM technology is capable of producing multiple 3D
products that can be analyzed with terrain analysis tools.
Digital elevation models (DEMs) can be exported into
geospatial software in order to quantify 3D topographical
features that are relevant to ecosystem function. This process
enables quantification of intricate 3D features such as surface
complexity (3D/2D surface area), slope, volume and curvature.
These metrics are known to be important predictors of
organismal abundance, biomass and diversity, and also affect
benthic current velocities associated with the food particle
supply for suspension feeding corals (Kostylev et al. 2005,
Guinan et al. 2009, Pittman et al. 2009, Pittman and Brown
2011). The ability to characterize these topographic features
will greatly enhance both biological and ecological
investigations of coral reef ecosystems.
information derived from the camera metadata. Once the photos
were uploaded the software aligned the images using algorithms
capable of detecting invariant features that overlap among the
sequential images. The invariant features were used to develop
geometrical projective matrices and determine the position and
orientation of the camera for each corresponding image
(Verhoeven et al. 2012; Westoby et al. 2012). 3D geometry was
constructed on the 2D image plan using the extrinsic parameters
calculated during the photo alignment process in conjunction
with the intrinsic parameters and focal properties obtained from
the image metadata (Stal et al. 2012). The photo alignment
process used iterative bundle adjustments to create a sparse 3D
point cloud that represents the projection and intersection of
pixel rays from the different positions and orientation of the
images in a 3D space. Digital markers were manually annotated
onto all of the GCPs, and the location of each marker was
reviewed and corrected in all photos containing the GCPs. The
known x,y,z values for each GCP were inputted into the
software to optimize alignment of the images and ensure
accurate interior and exterior orientation of the resulting model.
Once the photo alignment was optimized a dense point cloud
could was generated. The dense point was used to build a
continuous mesh surface, which was triangulated and rendered
with the high-resolution imagery to create a textured digital
surface model for each colony.
This objective of this study was to develop a process for
combining 3D data derived from SfM photogrammetry with
geospatial software tools in order to quantify 3D topographic
characteristics of individual coral colonies. This technique
enables the extraction and quantification of 3D structural
features that are biologically and ecologically relevant to coral
reef ecosystems. We utilized this approach to compare four
dominant morphologies exhibited by four species of Hawaiian
corals. The approach presented here can be applied to larger
studies in order to distinguish key morpho-functional groups of
corals that promote architectural complexity and drive
ecological processes in reef ecosystems.
2. METHODS
2.1 Photographing coral colonies
Images were collected at Waiʻōpae tide pools (19°29’55” N
154°49’06” W), southeast Hawaiʻi Island. Several ground
control points (GCPs) and scale markers were placed around
each photographed colony at known spatial locations and depths
to accurately georeference and ground-truth the resulting
models. Photographs were taken continuously from both planar
and oblique angles to collect images that captured the entire
colony surface area with an overlap of 70-80%. All photos were
taken using a Canon 5D Mark III digital SLR camera with a
14mm non-distortion lens (Canon USA Inc.) in an Ikelite
housing (Ikelite Underwater Systems). Three colonies of each
species (a total of twelve colonies) were photographed, each
representing a unique morphology (Porites lobata –
massive/lobate, Porites compressa – branching, Montipora
capitata – plating, Montipora flabellata – encrusting).
2.2 3D reconstructions
3D colony reconstructions were rendered using Agisoft
PhotoScan (Agisoft LLC.) modeling software. All images were
uploaded into the software, and PhotoScan performed camera
calibration using Brown's distortion model with focal
Figure 1. Example 3D models of the four coral morphologies
analyzed in this study; a) massive – Porites lobata, b) branching
– Porites compressa, c) encrusting – Montipora flabellata, d)
plating – Montipora capitata.
2.3 Quantification of 3D features
3D characteristics were quantified using 3D spatial analysis
tools in ArcGIS (ArcMap 10.1, Environmental Systems
Resource Institute) topographic software. Both an orthophoto
and a digital elevation model (DEM) were exported from
Photoscan and uploaded into ArcMap for each reconstructed
coral colony. The DEM cell size was set to 0.1-cm so intricate
differences in 3D features could be detected among the
colonies. The orthophoto was layered on top of the DEM, and
each colony was digitized using the editor function within
ArcMap. Once annotated, 3D metrics were computed using
several 3D spatial analysis tools. ‘Surface rugosity’ was
quantified as the contour distance (accounting for changes in
This contribution has been peer-reviewed.
doi:10.5194/isprsarchives-XL-5-W5-61-2015
62
The International Archives of the Photogrammetry, Remote Sensing and Spatial Information Sciences, Volume XL-5/W5, 2015
Underwater 3D Recording and Modeling, 16–17 April 2015, Piano di Sorrento, Italy
vertical surfaces along the colony surface) divided by the linear
distance between two nodes. The path distance tool was used to
quantify a mean surface rugosity value from four rugosity
planes that were digitized on each coral colony (twelve total for
each species). The surface information tool was used to quantify
the 2D and 3D surface area for each coral colony. A mean ratio
of 3D/2D surface area was calculated for each colony as a
representation of ‘surface complexity’. The slope tool was used
to determine the maximum rate of elevational change from each
cell to its neighbors, in a 3x3 cell window, in units of degrees.
The value of the slope plane is calculated with the average
maximum technique, with small values reflecting flat terrain
and large values indicating steep terrain (Burrough and
McDonell 1998). The values were computed as percent slope,
which is tangent of θ (rise/run) multiplied by 100. A slope angle
of 45 degrees, with the rise equal to run, has a percent slope
value of 100 and as the angle approaches vertical the percent
slope value approaches infinity. The curvature tool was used to
quantify the second derivative of slope across the DEM surface
in order to identify areas of rapid change in slope or aspect. The
curvature of the surface is calculated on a cell-by-cell basis for
the entire DEM. For each cell, a fourth-order polynomial of the
form:
Z = Ax ²y ² + Bx ²y + Cxy ² + Dx ² + Ey ² + Fxy + Gx + Hy + I
capitata and M. flabellata). Percent slope was also significantly
greater (ANOVA, F = 24.49, p<0.01, Figure 2) in the corals
exhibiting massive and branching morphologies (P. lobata and
P. compressa) compared to the encrusting and plating
morphologies (M. capitata and M. flabellata).
The mean values of combined, profile, and planform curvature
varied among the coral morphologies (Figure 2). P. lobata and
P. compressa, coral species with branching and massive
morphologies, exhibited greater values of both planform and
profile curvature.
(1)
is fit to a surface composed of a 3 x 3 cell window. Values were
quantified for combined curvature, planform curvature, and
profile curvature. Combined curvature provides a value that is
representative of all directional changes in slope or aspect
within the analyzed cell windows, thus large values of
combined curvature are indicative of complex terrain. Profile
curvature only analyzes changes in slope or aspect parallel to
the direction of maximum slope, while planform curvature
analyzes changes in the perpendicular direction of maximum
slope. The positive or negative values of planform and profile
curvature represent either upwardly concave or convex surface
(Figure 2).
2.4 Statistical Analysis
Data generated from the topographic analyses were
transformed, if necessary, using log transformations, to meet the
assumptions of normality and equal variance necessary for use
of parametric statistical tests. Values for the spatial metrics
described above were analyzed using univariate analysis of
variance (ANOVA), and Tukey’s HSD post hoc tests were used
to determine statistical differences (α = 0.05) among the
quantified spatial metrics. All statistical tests were run using
Minitab 15 (Minitab Inc.) software.
3. RESULTS
The ground sample distance (resolution/pixel) of the resulting
3D models ranged from 0.000310 – 0.000344-m/pix with an
error of 1.74 – 2.98 pix, thus our designated DEM cell size of
0.1-cm was within the range of accuracy of the model. 100% of
the images were matched for each colony reconstruction.
Surface rugosity differed significantly among the coral colonies
(ANOVA, F = 4.48, p<0.01, Figure 2), with the massive
morphology (P. lobata) exhibiting greater mean values of
rugosity than the encrusting morphology (M. flabellata).
Surface complexity was significantly greater (ANOVA, F =
18.11, p<0.01, Figure 2) in the corals exhibiting massive and
branching morphologies
(P. lobata and P. compressa)
compared to the encrusting and plating morphologies (M.
Figure 2. Statistical comparisons among mean values of 3D
metrics. . α, β, and γ demark groupings identified as
significantly different based on statistical analyses (ANOVA,
p<0.01).
4. CONCLUSIONS
The field of coral reef ecology has recognized complexity to be
a critical component of ecosystem diversity and productivity
(Goreau 1959, Knudby and LeDrew 2007, Walker et al. 2009,
Dustan et al. 2013), yet there are few methods capable of
quantifying intricate 3D features of underwater environments.
This contribution has been peer-reviewed.
doi:10.5194/isprsarchives-XL-5-W5-61-2015
63
The International Archives of the Photogrammetry, Remote Sensing and Spatial Information Sciences, Volume XL-5/W5, 2015
Underwater 3D Recording and Modeling, 16–17 April 2015, Piano di Sorrento, Italy
Obtaining accurate 3D measurements of coral surfaces has only
been limited to techniques using complex, bulky, and expensive
equipment, thus highlighting a clear need for non-invasive
methods to measure 3D surface area and complexity for corals
in situ (Bythell et al. 2001). This study describes the application
of a novel technique for combining 3D products generated from
Structure for Motion (SfM) photogrammetry with geospatial
software tools for characterizing 3D attributes of coral colonies.
The methods presented here provide a cost- and time-effective
approach to reconstruct coral colonies and quantify intricate 3D
features associated with specific coral morphologies.
Our aim was to develop a process to quantify 3D metrics that
are known to affect habitat complexity and ecosystem
processes. Surface rugosity, surface complexity, slope, and
curvature have been shown to drive vegetation distribution on
terrestrial landscapes and influence the distribution, biomass
and diversity of vertebrate and invertebrate species in marine
systems (Friedlander and Parrish 1998, Kostylev et al. 2005,
Guinan et al. 2009, Pittman et al. 2009, Pittman and Brown
2011). We quantified these metrics for four coral species found
commonly in Hawaiʻi that represent distinct morphological
phenotypes (Porites lobata – massive/lobate, Porites compressa
– branching, Montipora capitata – plating, Montipora flabellate
– encrusting). The resulting data showed the branching and
massive corals to exhibit the greatest levels of surface rugosity,
surface complexity, and slope (Figure 2). These morphologies
also exhibited larger values of profile and planform curvature,
and thus are likely to provide more complex habitat than the
plating and encrusting morphologies. The negative values of
both profile and planform curvature indicate the coral surface
provides a juxtaposition of both concave and convex shape,
which may facilitate more functional habitat for organisms that
use coral as shelter. The architectural complexity of ecosystems
often drives ecological services, and is frequently defined or
provided by foundation taxa that disproportionately influence
ecosystem structure, function and stability (MacArthur 1984,
Bruno and Bertness 2001, Alvarex-Filip et al. 2011). Corals
serve as foundation taxa for coral reef ecosystems, and different
species can disproportionately contribute to architectural
complexity (Alvarez-Filip et al. 2011). Unfortunately, there are
few studies that have directly distinguished, or comprehensively
examined, morpho-functional groups and their role in habitat
facilitation on coral reefs. It is important to identify the
structural features associated with specific coral species and
morphologies in order to determine if distinct morphofunctional groups exist, and to what degree they drive
ecosystem diversity and productivity. Understanding the
intricate differences in the architectural complexity provided by
morpho-functional groups of corals can also elucidate how
shifts in coral composition may affect ecosystem structure and
function. Quantifying the relative contribution of specific coral
species and morphologies to the architectural complexity of
coral reefs is of particular importance for understanding the
trajectory of coral reefs under changing environmental
conditions (Alvarez-Filip et al. 2011).
Developing 3D reconstructions of corals can also serve as a
valuable tool for tracking growth rates and assessing the
impacts of short-term environmental perturbations. The
complex branching, plating and corymbose coral morphologies
have been found to be generally more susceptible to disturbance
than slow-growing corals that exhibit massive morphologies
(Gates and Ainsworth 2011, van Woesik et al. 2011). Utilizing
the technique presented here can enable comparison of 3D
growth rates over time, and also assess structural changes
occurring in relation to disturbance events such as coral
bleaching, disease outbreaks, and severe storms.
Combining 3D products derived from SfM photogrammetry
with geospatial analysis tools has wide applications in coral reef
research and management. Furthermore, this method provides
high-resolution visual tools for assessing changes over time,
such as the orthophoto and photo-mosaic, and the point clouds
can be compared across temporal scales in order to precisely
quantify changes occurring in the volumetric and structural
properties of corals. This technique is critical for accurately
investigating parameters such as coral biomass and habitat
availability for reef fishes and invertebrates, all of which plays a
vital role in coral reef productivity (Luckhurst and Luckhurst
1978, Abdo et al. 2006, Wilson et al 2007). We hope the
methodology presented in this study can serve as a platform for
future studies to accurately quantify intricate 3D characteristics
of corals and coral reefs to improve our collective
understanding of these valuable ecosystems.
5. ACKNOWLEDGEMENTS
This research was funded by the National Science Foundation
Center for Research Excellence in Science and Technology
Grant No. 0833211 to MT for the Center in Tropical Ecology
and Evolution in Marine and Terrestrial Environments. This
publication was developed under STAR Fellowship Assistance
Agreement no. FP-91768001-0 awarded by the U.S.
Environmental Protection Agency (EPA). It has not been
formally reviewed by the EPA. The views expressed in this
publication are solely those of the authors and EPA does not
endorse any products or commercial services mentioned in this
publication. Funding was also provided by both ESPCoR
Hawai‘i (EPS-0903833) and Idaho (EPS-0814387) Track-I
research grants, and the UH Manoa Edmonson Grant. We thank
the University of Hawai‘i at Hilo Spatial Data Analysis and
Visualization (SDAV) laboratory, and the Idaho National
Laboratories for logistical support and funding involved with
fieldwork and image analysis. We also thank Kanoe Steward for
assistance with fieldwork.
6. REFERENCES
Abdo, D.A., J.W. Seager, E.S. Harvey, J.I. McDonald, G.A.
Kendrick, and M.R. Shortis., 2006. Efficiently measuring
complex sessile epibenthic organisms using novel
photogrammetric technique. Journal of Experimental Marine
Biology and Ecology 339:120-133
Alvarez-Filip, L., N.K. Dulvy, I.M. Cote, A.R. Watkinson, and
J.A. Gill., 2011. Coral identify underpins architectural
complexity on Caribbean reefs. Ecological Applications
21(6):2223-2231
Bruno, J.F., and M. D. Bertness., 2001. Habitat modification
and facilitation in benthic marine communities. Pages 201-218
in M. D. Bertness, S. D. Gaines, and M.E. Hay, editors. Marine
community ecology. Sinauer, Sunderland, Massachusetts, USA.
Burrough, P.A., and R.A. McDonell., 1998. Principles of
geographical information systems. Oxford Unversity Press,
New York. 190 pp
Bythell, J.C., P. Pan, and J. Lee., 2001. Three-dimensional
morphometric measurements of reef corals using underwater
photogrammetry techniques. Coral Reefs 20:193-199
This contribution has been peer-reviewed.
doi:10.5194/isprsarchives-XL-5-W5-61-2015
64
The International Archives of the Photogrammetry, Remote Sensing and Spatial Information Sciences, Volume XL-5/W5, 2015
Underwater 3D Recording and Modeling, 16–17 April 2015, Piano di Sorrento, Italy
Costanza, R., R. d’Arge, R. de Groot, S. Farber, M. Grasso, B.
Hannon, K. Limburg, S. Naeem, R.V. O’Neill, J. Paruelo, R.G.
Raskin, P. Sutton, and M. van den Belt., 1997. The value of the
world's ecosystem services and natural capital. Nature 387: 253260
Crowder, L.B., W.E. Cooper., 1982. Habitat structural
complexity and the interaction between bluegills and their prey.
Ecology 63:1802-1813
Delparte, D.M., M. Belt, C. Nishioka, N. Turner, R. Richardson,
and T. Ericksen., 2014. Monitoring tropical alpine lake levels in
a culturally sensitive environment utilizing 3D technological
approaches. Arctic, Antarctic, and Alpine Research 46(4):709718
Done, T.J., 1997. Decadel changes in reef-building
communities: implications for reef growth and monitoring
programs. Proceedings of the 8th International Coral Reef
Symposium 1:411-416
Dustan, P., O. Doherty, S. Pardede., 2013. Digital reef rugosity
estimates coral reef habitat complexity. PLoS ONE 8(2):e57386
Fisher, W.S., W.P. Davis, R.L. Quarles, J. Patrick, J.G.
Campbell, P.S. Harris, B.L. Hemmer, and M. Parsons., 2007.
Characterizing coral condition using estimates of threedimensional colony surface area. Environmental Monitoring
and Assessment 125:347-360
Fonstad, M.A., J.T. Dietrich, B.C. Courville, J.L. Jensen, and
P.E. Carbonneau., 2013. Topographic structure from motion: a
new development in photogrammetric measurement. Earth
Surface Processes and Landforms DOI:10.1002/esp.3366
Friedlander, A.M., and J.D. Parrish., 1998. Habitat
characteristics affecting fish assemblages on a Hawaiian coral
reef. Journal of Experimental Marine Biology and Ecology
224:1-30
Gates, R.D., and T.D. Ainsworth., 2011. The nature and
taxonomic composition of coral symbiomes as drivers of
performance limits in scleractinian corals. Journal of
Experimental Marine Biology and Ecology 408:94-101
Goreau, T.F. 1959., The ecology of Jamaican coral reefs 1.
Species composition and zonation. Ecology 40:67-90
Graham, N.A.J., and K.L. Nash., 2013. The importance of
structural complexity in coral reef ecosystems. Coral Reefs
32:315-326
Guinan, J., C. Brown, M.F.J. Dolan, and A.J. Grehan., 2009.
Ecological niche modeling of the distribution of cold-water
coral habitat using underwater remote sensing data. Ecological
Informatics 4:83-92
Harvell, C.D., K. Kim, J.M. Burkholder, R.R. Colwell, P.R.
Epstein, D.J. Grimes, E.E. Hofmann, E.K. Lipp, A.D.
Osterhaus, R.M. Overstreet, J.W. Porter, G.W. Smith, and G.R.
Vasta., 1999. Emerging Marine Diseases, Climate Links and
Anthropogenic Factors. Science 285:1505-1510
Hoegh-Guldberg, O., P.J. Mumby, A.J. Hooten, R.S. Steneck,
P. Greenfield, E. Gomez, C.D. Harvell, P.F. Sale, A.J. Edwards,
K. Caldeira, N. Knowlton, C.M. Eakin, R. Iglesias-Prieto, N.
Muthiga, R.H. Bradbury, A. Dubi, and M.E. Hatziolos., 2007.
Coral Reefs Under Rapid Climate Change and Ocean
Acidification. Science 318:1737-1742
Javernick, L., J. Brasington, and B. Caruso., 2014. Modeling the
topography of shallow braided rivers using Structure-fromMotion photogrammetry. Geomorphology 213:166-182
Knudby, A., and E. LeDrew., 2007. Measuring structural
complexity on coral reefs. In: Pollock NW, Godfrey JM, eds.
Diving for Science 2007. Proc of the American Academy of
Underwater Sciences 26th Symposium pgs:181-188
Kostylev, V.E., J. Erlandsson, M.Y. Ming, and G.A. Williams.,
2005. The relative importance of habitat complexity and surface
area in assessing biodiversity: Fractal application on rocky
shores. Ecological Complexity 2:272-286
Luckhurst, B.E., and K. Luckhurst., 1978. Analysis of the
influence of substrate variables on coral reef fish communities.
Marine Biology 49:317-323
MacArthur, R. H., 1984. Geographical ecology, patterns in the
distributions of species. Princeton University Press, Princeton,
New Jersey, USA.
Pittman, S.J., B.M. Costa, and T.A. Battista., 2009. Using lidar
bathymetry and boosted regression trees to predict the diversity
and abundance of fish and corals. Journal of Coastal Research
25(6):27-38
Pittman, S.J., and K.A. Brown., 2011. Multi-scale approach for
predicting fish species distributions across coral reef seascapes.
PLoS ONE 6(5):e20583
Reaka-Kudla, M., 1997. The global biodiversity of coral reefs: a
comparison with rain forests. In: Reaka-Kudla M, Wilson DE,
Wilson EO (eds.), Biodiversity II: Understanding and Protecting
our Biological Resources. Washington, D.C.: Joseph Henry
Press. pp. 83-108.
Risk, M.J., 1972. Fish diversity on a coral reef in the Virgin
Islands. Atoll Research Bulletin 153
Singh, H., G. Salgian, R. Eustice, and R. Mandelbaum., 2002.
Sensor fusion of structure-from-motion, bathymetric 3D, and
beacon-based navigation modalities. Proceedings of the IEEE
International Conference on Robotics and Automation 4:4024–
4031
Snavely, N., S.N. Seitz, and R. Szeliski., 2008. Modeling the
world from internet photo collections. International Journal of
Computer Vision 80:189-210
Stal, C., J. Bourgeois, P. De Maeyer, G. De Mulder, A. De
Wulf, R. Goossens, M. Hendrickx, T. Nuttens, and B.
Stichelbaut., 2012. Test case on the quality analysis of structure
from motion in airborne applications. Proceedings of the 32nd
EARSeL Symposium: ‘Advances in Geosciences,’ Mykonos,
Greece, May 21-24, P.11
Van Woesik, R., K. Sakai, A. Ganase, and Y. Loya., 2011.
Revisiting the winners and losers a decade after coral bleaching.
Marine Ecology Progress Series 434:67-76
Verhoeven, G., 2012. Getting computer vision airborne: using
structure from motion for accurate orthophoto production.
RSPSOC Archaeology Special Interest Group Newsletter, 4-6
This contribution has been peer-reviewed.
doi:10.5194/isprsarchives-XL-5-W5-61-2015
65
The International Archives of the Photogrammetry, Remote Sensing and Spatial Information Sciences, Volume XL-5/W5, 2015
Underwater 3D Recording and Modeling, 16–17 April 2015, Piano di Sorrento, Italy
Walker, B.K., L.K.B Jordan, and R.E. Spieler., 2009.
Relationship of reef fish assemblages and topographic
complexity on Southeastern Florida Coral Reef Habitats.
Journal of Coastal Research 25(6):39-48
Westoby, M.J., J. Brasington, N.F. Glasser, M.J. Hambrey, and
J.M.
Reynolds.,
2012.
‘Structure-from-Motion’
photogrammetry: A low-cost, effective tool for geoscience
applications. Geomorphology 179:300-314
Wilson, S.K., N.A.J. Graham, and N.V.C. Polunin., 2007.
Appraisal of visual assessments of habitat complexity and
benthic composition on coral reefs. Marine Biology 151:10691076
This contribution has been peer-reviewed.
doi:10.5194/isprsarchives-XL-5-W5-61-2015
66
© Copyright 2026 Paperzz