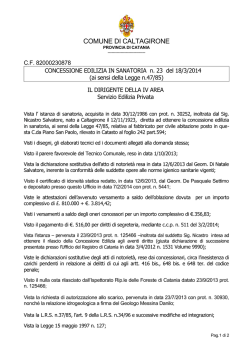
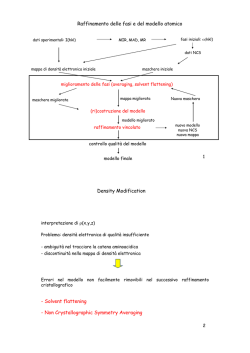
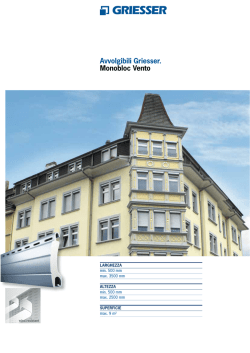
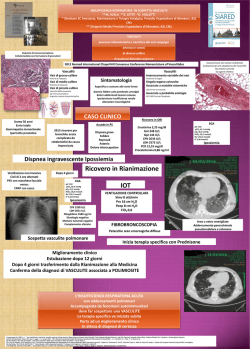
SUPPLEMENTARY INFORMATION
Assembly of Iron Oxide Nanocubes for Enhanced Cancer
Hyperthermia and Magnetic Resonance Imaging
Minjung Cho 1,2, Antonio Cervadoro 6, Maricela R. Ramirez 1, Cinzia Stigliano 1, Audrius Brazdeikis
3, Vicki L. Colvin 2, Pierluigi Civera 5,+, Jaehong Key 4,*, and Paolo Decuzzi 6,*
1
2
3
4
5
6
Department of Translational Imaging & Department of Nanomedicine, Houston Methodist Research Institute,
Houston, TX 77030, USA
Department of Chemistry, Rice University, Houston TX 77005, USA
Department of Physics and Texas Center for Superconductivity, University of Houston, Houston TX 77004,
USA
Department of Biomedical Engineering, Yonsei University, 1 Yonseidae-gil, Wonju, Gangwon-do, 220-710,
South Korea
Dipartimento di Elettronica e Telecomunicazioni, Politecnico di Torino, I-10129 Torino, Italy
Laboratory of Nanotechnology for Precision Medicine, Fondazione Istituto Italiano di Tecnologia, Genova,
16163, Italy
+ Pierluigi
Civera died on October 28, 2014.
* Correspondence: [email protected]; Tel.: +82-10-5315-0626 (J.K.); [email protected]; Tel.: 39-010-71781-941
(P.D.)
Synthesis of iron oxide nanocubes (individual NCs). This synthesis was performed according to the
method in our previous study [1]. Briefly, FeCl3·6H2O (5.4 g, 20 mmol), sodium oleate (18.5 g, 62
mmol), ethanol (40 ml), deionized water (30 ml), and hexane (70 ml) were mixed and heated to
60 °C for 4 hours in a refluxing system under N2 flow.[2] The resulting organic phase containing
iron oleate was washed with deionized water and then purified with acetone through three
rounds of centrifugation (11,000 rpm, 30 minutes). For individual 11 nm iron oxide NCs, iron
oleate (0.6 g, 0.1 mmol), sodium oleate (0.3 g, 1 mmol), oleic acid (0.56 g, 2 mmol), and 1-ODE (5
g, 20 mmol) were mixed in a 50 ml three-neck flask and heated to 315 °C for 1 hour under N2.
Individual 15 nm iron oxide NCs were synthesized by changing the amounts of iron oleate
precursors (1.8 g, 0.3 mmol), and oleic acid (0.56 g, 2 mmol), and increasing the reflux time (2
hours at 315 °C). To prepare 20 nm and 28 nm iron oxide NCs, FeOOH (0.36 g, 4 mmol), oleic
acid (16 mmol (4.52 g) or 20 mmol (5.7g)), sodium oleate (0.9 g, 3 mmol), and 1-ODE (10 g, 40
mmol) were mixed and heated to 120 °C for 6 hours to remove residual water and continuously
heated to 240°C for 0.5 hours for the synthesis of iron oleate precursor. The reaction mixture was
further heated to 315°C for 3 hours under N2.
Transmission electron microscopy (TEM). The TEM images were produced by a JEOL 2,100 field
emission gun TEM operating at 200 kV with a single tilt holder using ultrathin carbon type-A 400
mesh copper grids (Ted Pella Inc.). The average sizes and size variations were obtained by counting
more than 1,000 particles using Image-Pro Plus 5.0 (Media Cybernetics, Inc., Silver Spring, MD).
Dynamic light scattering (DLS) and zeta potential analysis. All water-soluble ANC
suspensions were analyzed by DLS and zeta potential to measure average hydrodynamic size
(nm) and surface charge (mV), respectively, using a ZEN-3,600 Zetasizer Nano (Malvern, UK)
equipped with a HeNe 633 nm laser. The average hydrodynamic size (nm) was calculated as the
mean size of the first peak in the number distribution. Standard deviations of hydrodynamic
size (nm) and zeta potential (mV) were calculated from five replicate measurements.
Inductively coupled plasma optical emission spectroscopy (ICP-OES). The concentration of
iron in ANC suspension was measured by a Perkin Elmer ICP-AES instrument equipped with
an auto sampler. Purified ANC solutions were acid digested using HNO3 (70 %) and H2O2 (30
%) and diluted with deionized water for ICP analysis.
Magnetic resonance relaxivity measurement. To measure the relaxivities r1 and r2 of ANCs, a
magnetic resonance relaxometer was used at 1.41 T (NMR analyzer, mq 60, Bruker). Various
concentrations of ANC solution were prepared (0.014 ÷ 0.35 mM for r1 and 0.0014 ÷ 0.022 mM
for r2), and the relaxivity values were calculated by the ratio of 1/T1,2 and concentration (mM) of
Fe. The r1 and r2 were calculated using Equation 1 [3]:
,
=
1
,
−
1
/[
]
(1)
where T1,2 represents the relaxation time of the sample, Twater is that for water, r1,2 (mM-1 s-1) are
the relaxivity values, and [Fe] is the concentration of Fe.
Specific absorption rate measurements for hyperthermia treatment. The magnetic heating
property of ANCs was measured by a custom-built hyperthermia system. The measurement
was performed using a radio frequency generator producing an alternating magnetic field
(AMF) with a frequency (f) of 512 KHz and field amplitude (H) of 10 kA m-1 [4]. A cooling system
thermally isolated the vial from the high temperature of the coil when applying AMF. ANC
suspension (600 μL) was placed in a cylindrical probe (4 mm ID x 40 mm height), and the
temperature was monitored with an optical probe (OptiSens Instrument) immersed into the
geometrical center of the solution. When the sample suspension reached the equilibrium
temperature (~ 19 °C), the magnetic field was activated, and the temperature was recorded every
second for about 15-20 minutes. The specific absorption rate (SAR) was calculated based on
Equation 2 [5]:
=
Δ
Δ
1
(2)
where T is the temperature of the nanocube suspension, t is the time, Cp is the heat capacity of
the buffer, and mFe is the final mass fraction of the iron in the sample suspension.
Superconducting Quantum Interference Device characterization (SQUID). To determine the
magnetic behavior and saturated magnetization value of iron oxide NCs, the magnetization
measurement was carried out with a Quantum Design SQUID magnetometer MPMS-XL. The
sample was prepared by injecting a certain amount of nanocube suspension (300 μL, 3,000~5,000
mg L-1) into an NMR tube. The tube was then sealed under vacuum and placed into a plastic
straw for measurements. DC magnetic measurement was performed at 300 K in a 0-50 Oe field.
Magnetization and hysteresis curves were collected in the range from -50 KOe to 50 KOe at 300
K.
Supplementary Figure 1. (a) TEM images of individual NCs in hexane: the core sizes of individual NCs
were 11.3 ± 1.4 nm, 15.4 ± 2.4 nm, 19.5 ± 3.2 nm, and 28.3 ± 3.2 nm. (b) TEM images of assembled NCs in
hexane: the core sizes of clustered NCs were 11.2 ± 1.2 nm, 14.9 ± 2.0 nm, 20.4 ± 2.9 nm, and 26.4 ± 3.3
nm. Insets provide the size distribution for each NC configuration. (Scale bar: 100 nm). The table
summarizes the experimental conditions for the synthesis of individual and assembled NCs, specifying
the iron source, surfactant, solvent, and temperature (see the Methods section).
Supplementary Figure 2. X-ray diffraction patterns of individual and assembled NCs compared to the
references materials magnetite (Fe3O4) and wüstite (FeO)
Supplementary Figure 3. High-resolution TEM (HR-TEM) images of individual and assembled NCs,
showing the crystalline lattice fringes.
Supplementary Figure 4. Scanning electron microscopy images (SEM) of 20 nm dOA-coated
individual and assembled iron oxide nanocubes (NCs) in water (a and b), and BSA-coated individual
and assembled iron oxide NCs (c and d) in water. The scale bars are 200 nm.
Supplementary Figure 5. MRI relaxivity and magnetic heating efficiency of NCs. a) Longitudinal
relaxivity r1 of individual and assembled NCs; b) Transverse relaxivity r2 of individual and assembled
NCs; c) specific absorption rate (SAR) of individual and assembled NCs. The table lists the average r1,
r2, and SAR values with standard deviation.
Supplementary Figure 6. MRI relaxivity values of 20 nm individual and assembled NCs with different
surface coatings: (a) r1 values of individual and assembled NCs with dOA and BSA coatings; (b) r2 values
of individual and assembled NCs with dOA and BSA coatings.
Supplementary Figure 7. Zeta potential of the assembled NCs. (a) Zeta potential values of dOA-ANCs
with different edge lengths (11-26 nm); (b) Zeta potential values of 20 nm dOA-ANCs and BSA-ANCs.
Supplementary Figure 8. The hydrodynamic diameter stability in deionized water of 20 nm
assembled NCs (ANCs), coated with dOA or BSA at 1 and 7 days.
Supplementary Figure 9. In vivo magnetic hyperthermia experiment. (a) Animal model with
two U-87-MG tumors (left: no injection, right: systemic injection of 5 mg/kg of BAS-ANCs).
An external magnet was attached to the right tumor for 40 min during the injection period. (b)
Temperature map of 30 min post treatment (the mice lying within the coil). The right tumor
area with injection of ANCs showed a higher temperature (38-42 °C) in the bright image. (c)
Monitoring of tumor volume for 10 days. The left tumor grew quickly compared to the right
tumor with ANC injection. The tumor growth was monitored daily as tumor volume (0.5 x
(major axis)2 x (minor axis).
References
1.
2.
3.
4.
5.
Yu, W.W., et al., Synthesis of monodisperse iron oxide nanocrystals by thermal decomposition of iron
carboxylate salts. Chem Commun (Camb), 2004(20): p. 2306-7.
Park, J., et al., Ultra-large-scale syntheses of monodisperse nanocrystals. Nature Materials, 2004.
3(12): p. 891-895.
Lee, N., et al., Water-dispersible ferrimagnetic iron oxide nanocubes with extremely high r(2)
relaxivity for highly sensitive in vivo MRI of tumors. Nano Lett, 2012. 12(6): p. 3127-31.
Cervadoro, A., et al., Design maps for the hyperthermic treatment of tumors with superparamagnetic
nanoparticles. PLoS One, 2013. 8(2): p. e57332.
Guardia, P., et al., Water-soluble iron oxide nanocubes with high values of specific absorption rate for
cancer cell hyperthermia treatment. ACS Nano, 2012. 6(4): p. 3080-91.
© Copyright 2026 Paperzz