Profiling Skype Video Calls: Rate Control and
Video Quality
Xinggong Zhang∗ , Yang Xu†, Hao Hu†, Yong Liu†, Zongming Guo∗ and Yao Wang†∗ Institute
†Electrical
of Computer Science&Technology, Peking University, Beijing 100871
& Computer Engineering, Polytechnic Institute of NYU, Brooklyn, NY 1120
Abstract—Video telephony has recently gained its momentum
and is widely adopted by end-consumers. But there have been
very few studies on the network impacts of video calls and the
user Quality-of-Experience (QoE) under different network conditions. In this paper, we study the rate control and video quality
of Skype video calls. We first measure the behaviors of Skype
video calls on a controlled network testbed. By varying packet
loss rate, propagation delay and available network bandwidth,
we observe how Skype adjusts its sending rate, FEC redundancy,
video rate and frame rate. We find that Skype is robust against
mild packet losses and propagation delays, and can efficiently
utilize the available network bandwidth. We also find that Skype
employs an overly aggressive FEC protection strategy. Based on
the measurement results, we develop rate control model, FEC
model, and video quality model for Skype. Extrapolating from
the models, we conduct numerical analysis to study the network
impacts of Skype. We demonstrate that user back-offs upon
quality degradation serve as an effective user-level rate control
scheme. We also show that Skype video calls are indeed TCPfriendly and respond to congestion quickly when the network is
overloaded.
I. I NTRODUCTION
The Internet has fundamentally changed the way people
communicate. While emails, text-messages, and Voice-overIP (VoIP) calls will remain to be important communication
means, we are at the threshold to embrace the next big change:
Video Telephony. Most online chatting software, such as MSN
messenger, GTalk and Facetime support video chat. Skype
[1], arguably the most popular audio/video communication
platform for end-consumers, provides two-way video calls and
multi-party video conferencing to its 500 million users on PCs
or mobile devices. Video calls are much more bandwidthdemanding than voice-over-IP (VoIP) calls. While the data
rate of a typical Skype VoIP call is around 30kbps, as will
be shown shortly, a good quality Skype video call can easily
consume bandwidth up to 950kbps, representing an increase
by a factor of more than thirty. The sheer traffic volumes generated by video calls make it imperative for network providers
and network researchers to understand the impact of this new
“killer application” on the performance and stability of the
existing network protocols and infrastructures. Meanwhile, due
to the real-time interaction between users, the quality of a
video call is more sensitive to packet losses and delays than
one-way video streaming. It is therefore of great interest for
end users and application developers to assess the quality of
video calls under different network conditions. However, up
to now, there have been very few study on the popular video
telephony applications.
In this paper, we present our recent effort on profiling Skype
video calls’ rate control and video quality through empirical
measurement and analytical modeling. We attempt to answer
two key questions:
Q1: How does a Skype video call adapt its sending rate,
video rate and quality under different network conditions?
Q2: Are Skype video calls friendly to TCP flows when they
compete for network resources?
It is challenging to come up with comprehensive answers for
those questions. First of all, Skype is a proprietary software.
There is very limited public information about its video
encoding and transmission algorithms. The common practice
is to treat it as a black-box and observe its behaviors under different conditions. Secondly, real network conditions are highly
diverse, often time-varying and traffic-varying. It is impossible
to come up with a set of scenarios that are representative for
all networks. Measuring Skype in a fast changing network
environment often gives misleading conclusions.
To address those challenges, we answer Q1 using an extensive measurement study of Skype in a controlled environment.
We set up a network testbed with configurable packet loss,
propagation delay, and available link bandwidth. We systematically generate different network settings. In each setting,
we measure Skype’s sending rate, throughput, round-trip time
(RTT), video bit rate, and frame rate after it reaches the
steady state. Based on the measurement data, we propose rate
control model, FEC model, and video quality model for Skype
video calls. Those models enable us answer Q2 quantitatively.
Specifically, we study the effectiveness of user back-offs upon
quality degradation as a user-level rate control scheme. We
study the TCP-friendliness of Skype video calls by comparing
its responsiveness to packet losses and delays with TCP. We
also conduct a numerical case study on a 4G type of wireless
network where multiple Skype flows and TCP flows compete
for bandwidth on uplink.
The contributions of our study are two-fold:
1) We are the first to measure the stationary behaviors of
Skype video calls under different network conditions.
We have the following findings: a) Skype’s sending rate
is insensitive to packet losses when the packet loss rate
is below 10%; Skype significantly reduces its sending
rate when loss rate goes above 10%; b) Skype keeps
close track of the available network bandwidth, and can
maintain bandwidth utilization around 80% under a wide
range of network conditions; c) Skype’s sending rate is
insensitive to propagation delays; d) Skype utilizes an
overly aggressive FEC scheme. Its FEC redundancy ratio
is about 4.5 times the actual packet loss rate.
2) We develop models for Skype’s rate control, FEC redundancy, and video quality. Using the models, we
demonstrate that user back-offs react fast to the onset
of congestion, and serve as an efficient user-level rate
control mechanism. We are the first to include user
behaviors in studying rate control of video calls. We
further show that, with the built-in rate control scheme
and quality-driven user back-offs, Skype video calls
are indeed TCP-friendly, and are very responsive to
congestion when the network is overloaded.
The rest of the paper is organized as follows. Section II
describes the related work. We present our measurement
methodology and testbed configurations in Section III. In
Section IV, we present measurement results on the stationary
behaviors of Skype. In Section V, we propose a rate control
model, a FEC model and a video quality model for Skype. In
Section VI, we study Skype’s TCP-friendliness by taking into
account user back-offs. Finally, we conclude the paper with
summary and future work in Section VII.
that VoIP flows don’t adapt their sending rates to congestion.
Instead, they showed that user back-off is an efficient userlevel congestion control mechanism for VoIP. We study rate
control of Skype video calls. In our experiments, we observe
that Skype video call has a built-in rate control mechanism,
which adapts its video rates to network conditions in a wide
range. On top of that, we show that user back-offs can
further enhance Skype video calls’ responsiveness to network
congestion.
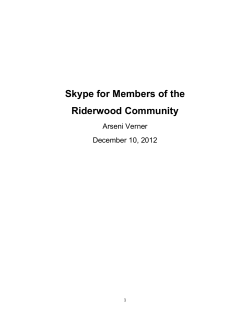
III. M EASUREMENT T EST- BED S ETUP
To study Skype under various network conditions, we set
up a controlled testbed in Fig. 1 on which Skype is observed
as a black-box. Two clients with Skype Ver. 5.2 are connected
by a NAT router. Each host has a private IP address and
connects to the Internet through the router. To emulate a wired
or wireless network, all packets pass through a software-based
network emulator, NEWT[12]. It emulates a variety of network
attributes, such as propagation delay, random packet loss, and
available bandwidth. We also inject UDP background traffic
into the testbed using iPerf tools. To emulate a video call,
II. R ELATED W ORK
Measurement work on Skype can be classified into two categories: characterizing network protocols and exploring VoIP
details. Baset et al [2] first analyzed Skype’s P2P topology,
call establishment protocols, and NAT traversal mechanism.
By analyzing Skype call traffic, they reverse engineered the
communication mechanisms of Skype. Since then, a lot of
papers have been published on Skype’s overlay architecture,
P2P protocol, and VoIP traffic [3], [4]. In the second category,
some studies [5], [6], [7] focused on the quality of Skype’s
voice-over-IP (VoIP) calls. Huang et al. investigated Skype’s
FEC mechanism and its efficiency for voice streaming [6], [7].
In [5], the authors proposed a USER Satisfaction Index model
to quantify VoIP user satisfaction. Cicco et al. [8] proposed a
congestion control model for Skype VoIP traffic. All of these
studies only focused on the voice service of Skype, did not
consider its video service.
In a closely related paper, Cicco et al. [9] measured the
responsiveness of Skype video calls to bandwidth variations.
They conclude that Skype’s response time to bandwidth increase is long. However, they only presented some empirical data, and did not systematically measure and model
the stationary behaviors of Skype. We conducted extensive
measurement of Skype under different network settings of
packet losses, packet delays and available network bandwidth.
Based on the measurements, we propose the models for Skype
video calls’ rate control, FEC redundancy, and video quality.
There have been some other related studies on investigating
the impact of user behaviors on network stability [10], [11].
In [11], Tay et al. studied how TCP user aborts enable a
network sustain a higher demand without causing congestion
collapse. Bu et al. proposed in [10] that the user back-offs in
VoIP will help maintain the network stability. They assumed
Internet
Iperf client
Propagation
delay
Skype register
server
Iperf server
Packet loss
BW capacity
Queue
Sender
Network Emulator
Receiver
Fig. 1: The network setup for Skype measurement
we choose a standard TV news video sequence “Akiyo” from
JVT (Joint Video Team) test sequence pool. The sequence
has mostly head and shoulder movements. It is very similar
to a video-call scenario. We inject the video sequence into
Skype using a virtual video camera tool [13]. This ensures the
transmitted video content are consistent and repeatable.
The measurement data are collected by two methods: TCPdump for packet level information, and Skype reports for video
level information. Since Skype employs proprietary protocols
and encrypts all control messages, it is hard to reverse-engineer
its protocols and measure video information externally. Fortunately, Skype reports some technical information through
its user interface, such as video rates, frame rates, RTT, et
al. We use a screen text capture tool [14] to capture these
information periodically from Skype window. The sampling
interval is 1 second. Unlike previous work [9], we are more
interested in Skype’s stationary behaviors. By giving enough
time for Skype to adapt to a given network scenario, we are
able to analyze its built-in rate control mechanisms. In each
TABLE I: Measured Video Parameters of Skype Codec
scenario, after Skype enters steady state, we capture data from
ten minutes of a video call. To cope with random effects, we
report the mean and 95% confidence interval for each data
point of interest.
Skype uses two transport layer protocols: TCP protocol for
control messages and UDP protocol for video transmission.
The TCP connection acts as a feedback channel through which
the receiver periodically reports current network conditions to
the sender. Then the sender adapts its UDP sending rate to
network conditions. According to our observations, a typical
signaling protocol for a video call is as follows: 1) Skype
clients connect to a register server on the Internet to log into
the system. 2) To start a video call, a client first sends a
message to the register servers and looks up the IP address of
the callee. 3) The caller attempts to establish a call session with
the callee either directly or through a relay. In our experiments,
even though the two hosts are behind a NAT router and are
assigned with private IP addresses, the caller is always able
to find the correct private address of the callee and connect to
the private address directly without going through a relay. The
monitored video call only traverses the network emulator and
NAT router before it reaches the callee. We have full control
on the network condition along the path.
Skype employs a video codec provided by On2 [15]. It is
a non-scalable motion-estimation based video codec. In our
experiments, the video encoder version of VP6, VP7, and VP8
have ever been detected. It demonstrates Skype is embedded
with multiple versions of video codec, and is compatible
with earlier versions. This codec supports real-time video
coding to generate variable video bit rates. It adapts its rate
to network conditions by adjusting video quantization step,
video resolution, and the number of frames per seconds (FPS).
The observed video codec parameters in the measurements are
listed in Table I.
IV. M EASUREMENT R ESULTS
In this section, we report measured Skype performances under various network conditions. By isolating various network
impairments, we investigate how Skype adapts its sending
rate and video rate to packet loss, packet delay and available
bandwidth.
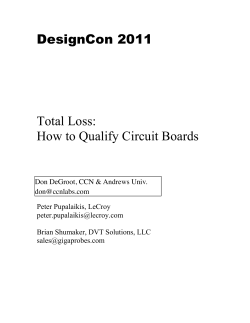
A. Impact of Packet Loss
We first introduce random packet losses using the network
emulator. The sending rate, RTT, and video rate of Skype
are measured when Packet Loss Rate (PLR) varies from 0%
to 12%. The two-way propagation delay is fixed at 50ms.
To examine whether Skype’s responses to packet loss is
consistent, we also carry out the above experiments under three
different available bandwidth settings: 250kbps, 750kbps, and
1000kbps. The measurement results are illustrated in Figure 2.
Figure 2(a) plots the mean and 95% confidence interval of
1000
bw=250kbps
bw=750kbps
bw=1000kbps
800
600
400
200
bw=250kbps
bw=750kbps
bw=1000kbps
700
Video rate (kbps)
640*480, 320*240, 160*120
5fps - 30fps
30kbps - 950kbps
Sending rate (kbps)
Video Resolution
Frame Rate per Second
Video Bit Rate
600
500
400
300
200
100
0
0
0.02
0.04
0.06 0.08 0.1
Packet loss rate
0.12
0.14
(a) Sending Rate
0
0
0.02
0.04 0.06 0.08
Packet loss rate
0.1
0.12
(b) Video Rate
Fig. 2: Impact of packet losses under different link bandwidth.
Skype sending rate. The mean and confidence interval of
video rate are plotted in Figure 2(b). First, when PLR is
less than 10%, Skpye’s sending rate almost remains constant
while its video rate drops almost linearly with PLR. The gap
between the sending rate and the video rate increases with
PLR. We conjecture that this gap is due to the Forward Error
Correction (FEC) coding. It has been reported in [7] that
Skype implements FEC to combat packet losses for voice calls.
It is reasonable to assume it protects video calls against packet
losses in a similar way. As PLR increases, Skype reduces its
video rate and allocates more bandwidth to FEC packets. We
will further verify this assumption in Section V.
When PLR is larger than 10%, both sending rate and video
rate drop dramatically under the three bandwidth settings.
Even though there is still abundant bandwidth available on the
path, Skype still drops its sending rate to the lowest rate. It
indicates that these drops are not due to network congestion.
Thus, we infer that Skype operates in two states: Normalstate (NORM) and Conservative-state (CONS). Whenever it
detects that the network condition becomes very bad, it would
switch to the CONS state. In this state, Skype only sends out
necessary data at a low constant rate. From Figure 2, we know
P LR ≥ 10% is one trigger for Skype to switch to CONS state.
We observe that in NORM state, the sending rate oscillates
around 500kbps under link bandwidth of 750kbps. The trend
is the same for the other two link bandwidth settings. This
fact indicates that in NORM state, the sending rate of Skype
is ignorant to packet losses. This is totally different from the
widely used TCP congestion control scheme, that reduces the
sending rate by half upon each perceived packet loss. This
immediately raises the concern that whether Skype is TCPfriendly. We will come back to this issue in Section VI.
From this study, we observe that when the packet loss rate
is below 10%, Skype works in normal (NORM) state, in which
its sending rate is loss-ignorant, and its video rate decreases
proportionally to loss rate; Skype switches to conservative
(CONS) state whenever the packet loss rate goes over 10%.
Both its sending rate and video rate will be significantly
reduced to a low value.
B. Impact of Available Bandwidth
To investigate how Skype responds to bandwidth available
in the network, we vary the bandwidth capacity on the network
emulator from 50kbps to 1000kbps while fixing the PLR and
propagation delay. In order to cover both NORM state and
500
600
400
200
PLR=2%
PLR=10%
90
400
300
200
200
400
600
800
Bandwidth constraint (kbps)
(a) Sending Rate
1000
0
80
70
100
0
PLR=2%
PLR=10%
100
RTT (ms)
800
600
PLR=2%
PLR=10%
Bandwidth Constraint
Video rate (kbps)
Sending rate (kbps)
1000
60
200
400
600
800
Bandwidth constraint (kbps)
1000
200
(b) Video Rate
400
600
800
Bandwidth constraint (kbps)
1000
(c) Round-trip time
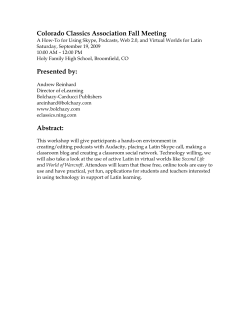
Fig. 3: Impact of available network bandwidth for PLR=2% and 10%. The two-way propagation delay is fixed at 50ms.
CONS state, two PLRs are considered, 2% and 10%. In both
cases, the two-way propagation delay is set to 50ms. The
measured results are shown in Figure 3. We again observe
distinct behaviors of Skype in NORM state and CONS state.
In Figure 3(a), when P LR = 2%, Skype is in NORM state
and increases its sending rate proportionally as the available
bandwidth increases. On the other hand, when P LR = 10%,
Skype is in CONS state and its sending rate almost remains
unchanged even when the available bandwidth increases. This
verifies our conjecture in the last section that Skype has
two states. When it detects PLR is larger than 10%, it will
switch to the CONS state and sends data at the lowest rates.
Similar trend can be detected in video rate as illustrated in
Figure 3(b): video rate in NORM state changes linearly with
available bandwidth, and remains unchanged in CONS state.
It is also noticed that the video rate increases proportionally
with the sending rate. There exists a linear function between
sending rate and video rate. We will come back to study this
in Section V-B.
The changes of RTT with the available bandwidth are shown
in Figure 3(c). We observe that RTT decreases in general
as available bandwidth increases. The slight increasing trend
towards the end of the curves is due to the variations of RTT
and the curves only report the mean. With the fixed two-way
propagation delay, the RTT reduction is due to the queueing
delay decrease resulted from the available bandwidth increase.
We will quantitatively study the relation between RTT, sending
rate and available bandwidth in Section V-A.
From these results, we find that Skype can closely keep track
of the available network bandwidth and adjust its sending rate
and video rate to efficiently utilize available bandwidth without
causing excessive congestion. While the exact algorithm employed by Skype to track available bandwidth is unknown, due
to its loss-ignorance in NORM state as studied in Section IV-A,
we conjecture that the algorithm is most likely driven by packet
delays, as commonly done in the available network bandwidth
measurement [16], [17].
C. Impact of Propagation Delay
Network delay perceived by a packet consists of two
components: congestion delay and propagation delay. While
congestion delay is highly variable, propagation delay is static
and is determined by the route taken by the packet. In this
section, we measure Skype’s performance by varying the
two-way propagation delay in the network emulator. The
TABLE II: Mean value of Skype performances under various
propagation delay.
Propagation delay
50
200
400
1000
2000
Sending rate
354.4
358.7
352.7
355.8
368.8
Video rate
343.6
342.3
335.9
338.9
350.9
RTT
64.9
220.5
416.1
1017.7
2019
bandwidth capacity is set to 500kbps and the PLR is 0. We
vary the propagation delay from 50ms to 2000ms.
The measurement results are listed in Table II. We observe
in this scenario Skype keeps sending rate stable around
360kbps for all propagation delay settings. We infer that
typically Skype does not adapt its sending rate when the propagation delay changes. The RTT observed by Skype increases
linearly with propagation delay. The small differences between
the two is due to the queueing delay occurred in the network.
From the results, we conclude that Skype rate control is
insensitive to propagation delay.1 Combined with the findings
in Section IV-A and IV-B, we conjecture that Skype’s rate
control algorithms are driven by the congestion delay, instead
of the propagation delay.
V. M ODELING S KYPE B EHAVIORS
In this section, we present more extensive measurement
results and propose analytical models for Skype’s sending rate,
video rate, and video quality. Those models will allow us to
extrapolate the measurement results to quantitatively answer
important questions regarding the effectiveness of user backoffs as a rate control mechanism and the competition between
Skype video calls and TCP flows in Section VI.
A. Sending Rate
In Section IV, we showed that Skype increases its sending
rate linearly with the available bandwidth. In addition, Skype’s
rate control is insensitive to packet losses in both NORM and
CONS states. We propose to model Skype’s sending rate RS
as a piecewise linear function as follows.
RS (Cw , p) =
ОіCw + Вµ
Оґ
p < 10%
p ≥ 10%
(1)
1 Due to the realtime interaction requirement, when the propagation delay
is excessively long, e.g. over 2 seconds, users would have dropped the video
call. That will effectively reduce Skype video call traffic.
Measurment (PLR=10%в€’12%)
Modeling rate
50
600
400
200
Measurment
Modeling RTT
100
45
RTT (ms)
800
110
55
Measurement (PLR=0%в€’8%)
Modeling rate
Sending rates (kbps)
Sending rate (kbps)
1000
40
35
30
90
80
70
25
60
20
0
0
200
400
600
Bandwidth (kbps)
800
(a) Skype in NORM State
1000
15
0
200
400
600
Bandwidth (kbps)
800
(b) Skype in CONS State
Fig. 4: Modeling sending rate with available bandwidth. PLR is from 0%
to 10%. The two-way propagation delay is fixed as 50ms.
where О±, ОІ and Пѓ are model parameters. The intuition behind
this formula is that the system can be generally modeled as
a M/M/1 queue with some corrections on the traffic pattern.
From the classic queueing theory, the per-packet queueing
delay in a M/M/1 queue with capacity C and rate R can
B
be calculated as Cв€’R
, where B is the average packet size. In
other words, queueing delay is inversely proportional to the
surplus bandwidth C в€’ R on a link. In (2), we can treat Пѓ as
the static propagation delay component in RTT. ОІ controls the
RTT increasing speed at low surplus bandwidth region when
Skype tends to send a fairly large number of small packets. By
curve fitting over the measured data, we find the parameters
to be О± = 6906, ОІ = 64, and Пѓ = 54.63, which match
our system settings that propagation delay is 50ms, measured
average packet size is 6364 bits. Therefore, with the sending
rate model, it is possible to calculate RTT as a function of
available bandwidth.
From the sending rate model, we summarize that Skype
has two built-in rate control mechanisms: when PLR is less
200
400
600
Cw в€’ Rs
800
1000
Fig. 5: Relation between Skype RTT
and surplus bandwidth. Each point is
for one combination of bandwidth and
packet loss rate.
than 10%, it controls its sending rate to maintain around 77%
utilization of the available bandwidth; when PLR is greater
than 10%, it sends out data at a conservative constant rate.
B. Video Rate
Skype uses a video codec that is able to adapt its video
bit rate to network conditions [9]. This is also verified in our
measurements in Section IV-B. We notice that the video rate
increases proportionally with the available bandwidth. Skype
employs FEC coding to combat with packet losses. In Section
IV-A, we observe that Skype decreases its video rate as PLR
increases, but keeps its sending rate unchanged. This indicates
that Skype uses more bandwidth to transmit FEC bits when
PLR increases. Let Rv be the actual video rate. We define the
FEC redundancy ratio as
ПЃ=
RS в€’ Rv
.
RS
When ПЃ becomes larger, there are more redundancy bits.
To investigate the relation between FEC ratio and packet
losses, we measured Skype’s video rate and sending rate
under various network conditions. FEC ratios are plotted as a
function of PLR in Figure 6. Through simple linear regression,
FEC ratio is modeled as a linear function of PLR:
ПЃ = П€ + П‰p
(3)
where ψ and ω are constants determined by Skype’s FEC
mechanism. Through curve fitting, we found that П€ = 0.15,
П‰ = 4.5. The model curve is also illustrated in Figure 6. We
observe that the model curve fits the measurement points very
well. In (3), П‰ is the ratio between the FEC redundancy ratio
and the packet loss rate. From the curve fitting results, we
know that the redundancy ratio of Skpye is about 4.5 times of
the actual loss rate. This is a very aggressive FEC protection.
0.7
0.6
Measurement
Modeling FEC ratio
Measurement
Modeling FEC ratio
0.5
FEC ratio
where Cw is the available bandwidth, p is the packet loss rate,
Оґ is the constant sending rate at CONS state, Оі and Вµ are two
model parameters in NORM state.
To verify the model and derive the parameters, we measured
Skype sending rates under a wide range of PLR and available
bandwidth settings. Totally 25 scenarios are set up with the
PLR varying from 0% в€’ 12% and the available bandwidth
varying from 50kbpsв€’1000kbps. Figure 4 shows the measured
data versus our proposed model. As illustrated in Figure 4(a),
in NORM state, data points at each available bandwidth are
overlapped or closely located to each other. A linear curve is
sufficient to fit all the data points. In CONS state, most of
the sending rates are around 21kbps as shown in Figure 4(b).
With curve fitting over the measured data, the parameters are
obtained as Оі = 0.77, Вµ = в€’10.8 and Оґ = 21.
It is also interesting to observe how Skype’s sending rate
RS relates to its RTT. Figure 5 is the scatter plot of Skype
RTT versus the surplus bandwidth Cw в€’ RS . Each point
corresponds to one Skype run under some combination of PLR
and available bandwidth. It can be seen that the RTT drops
as the surplus bandwidth increases. We can model RTT as a
function of the surplus bandwidth:
О±
+ Пѓ,
(2)
RT T =
Cw в€’ RS + ОІ
50
0
1000
0.4
0.3
0.2
0.1
0
0.02
0.04
0.06
0.08
Packet losses rate
0.1
0.12
Fig. 6: FEC redundance ratio as a function of PLR.
This result echos the conclusion in [7] that there is a significant
space to improve Skype’s FEC efficiency for voice calls.
Combining the sending rate model in (1) and the FEC model
in (3), the video rate of Skype can be formulated as a function
of the available bandwidth and PLR:
пЈ±
пЈІ(1 в€’ П€ в€’ П‰p)(ОіCw + Вµ) p < 10%
Rv (Cw , p) =
(4)
пЈі
(1 в€’ П€ в€’ П‰p)Оґ
p ≥ 10%
35
Frame rate (fps)
30
QS (Cw , p) = 1 + G(f (Cw , p), Rv (Cw , p))
c
в€—
=1+ cв€’
1 + (Rv (Cw , p)/d)e
(ln(f (Cw , p)) в€’ ln(a + bRv (Cw , p)))2
exp в€’
2(h + gRv (Cw , p))2
,
(7)
where the coefficients a, b, c, d, e, h, g are model parameters as
defined in ITU-T Recommendation G.1070 [19]: a = 1.431,
b = 0.02228, c = 3.759, d = 184.1, e = 1.161, h = 1.446,
g = 0.03881.
25
20
15
10
5
0
0
where the video rate is measured in kbps.
By combining the frame rate model in (6), the video rate
model in (4) and the ITU-T MOS model in (5), the Skype’s
subjective quality can be calculated as:
D. Model Validation
100
200
Video rate (kbps)
300
400
Fig. 7: Video frame rate as a function of video bit rate.
C. Video Quality
The ultimate QoE measure of video call service is the
video quality perceived by users. We use a subjective quality
model [18] to assess Skype’s video quality. The videophone
subjective quality model, also known as the opinion model for
video-telephony applications, has been standardized as ITUT Recommendation G.1070 [19]. The perceived video quality
is measured by the Mean Opinion Score (MOS), a subjective
quality score that ranges from unacceptable to excellent. This
model estimates the video quality affected by coding distortion
and frame reduction. It is a function of video rate and frame
rate. We rewrite the model as:
Q = 1 + G(f, Rv ),
(5)
where f is the frame rate measured in frames-per-second (fps),
and Rv is the video rate.
To assess the video quality of Skype, we need to measure
Skype’s frame rate under various network conditions. Since
most video codec changes its frame rate based on the video
rate, we investigate the relation between video rate and frame
rate. We collect the frame rate and video rate information from
the Skype window. The measured data are plotted in Figure
7. Again, each point corresponds to the measurement result
under a combination of PLR and available bandwidth.
In Figure 7, we observe that most video frame rates are
distributed around 5f ps, 10f ps, 15f ps, and 28f ps. As video
rate increases, the frame rate increases. We conjecture that
Skype codec encodes video into a pre-selected set of frame
rates. It selects a frame rate according to the current video
rate. Thus, we propose the frame rate model of Skype as a
piecewise-constant function:
пЈ±
5 Rv (Cw , p) ≤ 20
пЈґ
пЈґ
пЈІ
10 20 < Rv (Cw , p) ≤ 80
f (Cw , p) =
,
(6)
15 80 < Rv (Cw , p) ≤ 200
пЈґ
пЈі
28 200 < Rv (Cw , p)
To validate the above models, we conduct experiments
where a Skype flow competes with background UDP traffic
on a bottleneck link. The link’s capacity is set to 700kbps,
and the propagation delay is fixed at 50ms. UDP traffic is
injected into the test-bed at constant rate using the “iPerf” tool.
After Skype enters into steady state, the sending rate, video
rate, and frame rate are sampled. We carry out experiments
under various scenarios with the UDP traffic rate varying from
0kbps to 600kbps. Each experiment is run for 20 minutes and
the sampling interval is one second. All measured points are
illustrated as in Fig. 8.
We also use the proposed models to predict Skype’s sending
rate, video rate and frame rate. Given the link capacity is C
and the UDP rate is fixed at RU , the available bandwidth for
Skype can be expressed as:
Cw = C в€’ RU
(8)
Substituting (8) into the sending rate model RS (Cw , p) in (1),
the video rate model Rv (Cw , p) in (4), and the frame rate
model f (Cw , p) in (6), Skype’s modeling rates are calculated.
We compare them with the measurement results in Fig. 8. The
figures show that our modeling curves match the measurement results pretty well. The Pearson correlation coefficients
between the measurement and modeling results are 0.9898,
0.9831, and 0.9545 for sending rate, video rate, and frame
rate respectively.
VI. A NALYSIS OF S KYPE P ERFORMANCE UNDER
C OMPETITION
Our measurement and modeling study characterize a Skype
video call’s behaviors in a controlled environment. In a real
network, a Skype video call competes with other network
flows, including other Skype calls and TCP flows, for network
resources. In this section, we extrapolate from the obtained
Skype rate control and quality models and quantitatively
answer the following questions through numerical analysis:
1) How Skype video call users respond to quality degradation resulted from network impairments? How effective
user back-offs are as a user-level rate control scheme?
600
Measurement
Modelling
Measurement
Modeling
500
400
300
200
28
25
26
400
FPS (kbps)
Video rate (kbps)
Skype rates (kbps)
500
300
200
24
20
22
20
15
18
100
0
Measurement
Modeling
16
100
100
200
300
400
UDP flow rate (kbps)
500
0
0
600
(a) Sending Rate
100
200
300
400
UDP flow rate (kbps)
500
10
600
0
100
(b) Video Rate
200
300
400
UDP flow rate (kbps)
500
600
(c) Frame Rate
Fig. 8: Model validation. The capacity of bottleneck link is 700kps, and the two-way propagation delay is fixed at 50ms.
2) What is the performance of a Skype video call when
it competes with other Skype calls and TCP flows? Is
Skype video call TCP-friendly?
A. Network Model
We consider a 4G type of wireless cell where multiple TCP
and Skype users compete for the access to the base-station.
Both the uplink and downlink are the potential bandwidth
bottlenecks. Due to the lossy nature of wireless transmission,
we further assume that there are random channel losses on
access links other than congestion losses. The base station
takes traffic from a large number of users. It has been shown in
[20] that when the link multiplexing degree is high, the packet
arrival process can be well modeled as a Poisson process. We
assume that an access link has finite buffer and model it as
a M/M/1/K queue, which is a drop-tail queue with a total
buffer size of K. Let C denote the total link capacity. Given
the total traffic arrival rate of R, the average congestion loss
probability pq and queueing delay tq can be approximately
calculated as [21]:
pq =
tq =
1 в€’ R/C
1 в€’ (R/C)K+1
R
C
B(1 в€’ R/C)
R(1 в€’ (R/C)K )
K
K
(9)
1.5
B. User-level Rate Control
Previous studies [10], [11] have shown that user back-offs
serve as an effective rate control scheme at the user-level. It
can significantly reduce network traffic when the user QoE
degrades as the network congestion builds up. In the current
Skype implementation, it pops up a window to recommend
users to turn off their video when the network conditions
degrade. In this section, we use the obtained quality model
in (7) to study the effectiveness of user back-offs as a userlevel rate control scheme for Skype video calls. Noted here,
we consider a user dropping the video call if she turns off
her video. The call session might still continue with just
voice. Specifically, we assume that a user drops her video
call probabilistically when the MOS score drops. The drop-off
probability [19] is a function of the MOS score as enumerated
in Table III.
TABLE III: Call drop ratio at different MOS scores
i
i=0
R
C
i
,
(10)
where B is the average packet size. In our numerical analysis,
we consider a LTE wireless network [22], with 100M bps
downlink capacity and 50M bps uplink capacity. Since video
call is bi-directional communication, all users within a cell
compete for the 50M bps uplink bandwidth.
TCP users react to congestion by adjusting their sending
rates according to packet losses and round trip time. We
assume all TCP users are long-lived flows whose congestion
control phase is significant longer than the slow start phase.
According to [23], for a TCP flow with end-to-end loss
probability p and delay t, the TCP sending rate can be
characterized by:
RT =
where pq is the queueing loss due to congestion, and pc is
the random channel loss. Our analysis can also be extended
to incorporate short-lived TCP sessions following a different
model [24]. We skip it here for the clarity of presentation.
2/3BT
в€љ
t p
(11)
where t, q and BT represent round-trip delay, packet loss rate
and TCP packet size respectively. The delay t is the sum of
queueing delay tq and propagation delay tc . The end-to-end
packet loss probability consists of two parts: p = pq + pc ,
MOS score
Drop ratio
1.5
0.98
2
0.85
2.5
0.7
3
0.5
3.5
0.3
4
0.1
4.5
0
Given the available network bandwidth and packet loss rate,
we can then calculate the video drop-off probability as follows:
DS (Cw , p) = DS (QS (Cw , p))
(12)
To study the impact of video call drop-offs as a user-level
rate control, let’s assume there is a group of N Skype users
under a network condition characterized by {Cw , p}. The number of active users can be represented as N (1 в€’ DS (Cw , p)).
The total effective traffic rate generated by all users can be
approximated as:
Л† w , p, N ) = N (1 в€’ DS (Cw , p))RS (Cw , p).
R(C
Considering the audio traffic is very small, and the average
traffic contribution of each user is simply:
RˆS (Cw , p) = (1 − DS (Cw , p))RS (Cw , p)
(13)
We call RˆS (Cw , p) the expected Skype sending rate. It represents the expected traffic generated by a Skype video call
considering user drop-offs as a user-level rate control. For the
1000
500
4.5
1800
4
1600
3.5
3
2.5
2
1.5
0
0
0.05
0.1
0.15
Endв€’toв€’end packet loss ratio
(a) Skype vs. TCP Rate
0.2
5
Skype flow
TCP flow
4.5
1400
Skype quality (MOS)
1500
Skype quality (MOS)
Sending rate (kbps)
Skype flow
TCP flow
Sending rate (kbps)
2000
1200
1000
800
600
4
3.5
3
400
1
0
0.05
0.1
0.15
Endв€’toв€’end packet loss ratio
0.2
(b) Skype Quality
200
20
40
60
80
Propagation delay (ms)
100
(c) Skype vs. TCP Rate
120
2.5
20
40
60
80
Propagation delay (ms)
100
120
(d) Skype Quality
Fig. 9: Comparison of TCP and Skype’s responsiveness to loss and delay: (a), (b) varying packet loss rate, the propagation
delay is fixed at 60ms; (c), (d) varying propagation delay, the packet loss ratio is fixed at 4%.
calculation in the rest of the paper, we will use RˆS (Cw , p) in
place of Skype’s sending rate.
C. TCP-friendliness of Skype Video Call
Since Skype uses UDP as transport protocol, it has no
congestion control scheme at the transport layer. To maintain
the Internet stability, it is important for applications developed
over UDP protocols to be TCP-friendly [23]. As demonstrated
in the previous sections, Skype has its built-in rate control
scheme at the application layer. Additionally, user back-offs
can be considered as a rate control scheme at the user-level.
We now study the TCP-friendliness of Skype video calls by
taking into account rate control at both the application level
and user level.
1) Responsiveness to Loss and Delay: We first compare a
Skype video call’s responsiveness to packet losses and delays
with the responsiveness of a TCP flow. We not only compare
the sending rates of Skype and TCP, but also compare the slope
of their rate curves, which indicates how fast each flow reduces
its rate under various network impairments. If the Skype curve
has a steeper slope than the TCP curve, it means Skype is more
responsive and reacts faster to network condition changes than
TCP; if the Skype curve is flatter than TCP curve, it means
Skype is more sluggish and reacts slower than TCP.
First, we introduce random packet losses at different PLR
while keeping the end-to-end delay and available bandwidth
fixed. The numerical results are illustrated in Figure 9.
In Figure 9(a), we plot the sending rate as end-to-end PLR
increases from 0% to 20%. The end-to-end delay is fixed at
60ms. TCP starts with a much higher rate than Skype. But
TCP flow is more responsive to packet losses than Skype
flow. When the end-to-end PLR increases from 1% to 3%,
the sending rate of TCP drops quickly. In contrast, when PLR
is less than 10%, Skype only slowly decreases its expected
sending rate as defined in (13). As shown in Figure 9(b),
Skype’s video quality degrades as PLR increases. Skype’s rate
decreases in this region is due to user backoffs. The slope
of the Skype curve is flatter than that of TCP. It shows that
Skype is more sluggish in reducing its rate than TCP when
the random PLR is below 10%. When PLR goes over 10%,
Skype switches to the CONS state; both its sending rate and
quality decrease significantly. In this region, Skype is much
more conservative than TCP.
We also investigate how Skype and TCP adapt their rates to
propagation delay. In Figure 9(c), we plot the sending rate of
Skype and TCP as we increase the two-way propagation delay
from 20ms to 120ms. Again, TCP has a much higher rate
than Skype when the propagation delay is small. But TCP is
more responsive to propagation delay increase than Skype. As
propagation delay increases, TCP reduces its rate while Skype
keeps its rate unchanged. We also notice in Figure 9(d), the
video quality keeps stable. However, if we keep increasing the
propagation delay till it become too large for realtime user
interaction, most users will drop off, which will also cause
Skype sending rate drop much faster than TCP.
2) Head-head Competition with TCP: In this section, we
numerically study the behaviors of Skype video calls when
they share a 4G wireless bottleneck link with TCP flows. The
random channel loss rate is set at pc = 2%; the propagation
delay is tc = 50ms. There are totally NT TCP users and NS
Skype users. Then the aggregate traffic rate is:
R = NT RT (t, p) + NS (1 в€’ DS (Cw , p))RS (Cw , p),
(14)
where RT is the sending rate calculated by the TCP rate model
in (11). The available bandwidth seen by each Skype user can
be determined by
Cw = C в€’ R + RS (Cw , p)
(15)
Equation (15) states that the available bandwidth seen by one
Skype user equals the total bandwidth minus the aggregated
TCP rates and Skype rates except the current one. By merging
equations (1), (9), (10), (11), (12), (14), and (15), we reach
at three equations for three unknowns {Cw , pq , tq }. We can
numerically solve them for the rate allocation between TCP
and Skype users and the video quality of Skype.
We calculate the bandwidth allocation among TCP flows
and Skype flows as the number of flows in each group grows
proportionally. We set the initial number of TCP and Skype
users to one. Then we scale up their population by the same
factor k. Figure 10 plots the bandwidth shares of a Skype and
a TCP flow as k increases.
In Figure 10(a), when the scale up factor k ≤ 20, there
is abundant bandwidth in the cell, and almost no congestion
loss and delay. Skype operates in its NORM state and video
quality is good. TCP only slightly drops its rate as k increases.
Congestion starts to build up as k goes over 20, both queueing
delay and packet loss increase as illustrated in Figure 10(c).
TCP reacts faster to congestion and quickly reduces its sending
rate. Meanwhile, as k keeps increases, the available bandwidth
1
Skype
TCP
0.8
750
Queueing loss rate
1000
0.08
0.6
0.4
500
0.2
250
0
0
10
20
30
40 50 60 70
Multiply ratios k
80
90
100
16
Queueing loss rate
Queueing delay
0.07
Drop ratio
Sending rate (kbps)
1250
0
0
10
(a) Sending rate
20
30
40 50 60 70
Multiply ratios k
(b) Video drop-off ratio
80
90
100
14
0.06
12
0.05
10
0.04
8
0.03
6
0.02
4
0.01
2
0
0
10
20
30
40 50 60 70
Multiply ratios k
80
Queueing delay (ms)
1500
0
90 100
(c) Queue drops and delay
Fig. 10: Bandwidth allocation between Skype and TCP users as we scale up their population proportionally.
for each Skype call decreases, and the quality perceived by
Skype users start to degrade. User video drop-offs kick in
quickly as k goes over 25, as shown in Figure 10(b). The
expected sending rate of Skype decreases at a faster pace than
TCP in Figure 10(a). TCP users take advantage of Skype user
drop-offs and slow down their rate decreases when k ≥ 25.
Towards the end, all Skpy users turn off video and only the
“persistent” TCP users prevail in the head-head bandwidth
competition.
To summarize, when network congestion level is low, Skype
is more sluggish than TCP and manages to provide smooth
video transmission in face of mild random link losses and
delays. When the network congestion level is high, Skype is
more conservative and reacts faster to congestion than TCP,
due to its built-in rate control scheme and user back-offs. This
indicates that Skype is indeed TCP-Friendly when the network
is heavily loaded and the congestion level is high.
VII. C ONCLUSIONS AND F UTURE W ORK
In this paper, we characterized the rate control schemes
and video quality of Skype video calls. Through extensive
measurement, we showed that Skype is robust against mild
packet losses and propagation delays. It can efficiently utilize
available network bandwidth when the network is lightly
loaded. Skype significantly reduces its rate when the network
impairments become severe. Based on measurement results,
we developed rate control model, FEC model, and video
quality model for Skype. Through numerical analysis, we
showed that user back-offs serve as an effective user-level
rate control scheme, and Skype is indeed “TCP-friendly”.
Our measurement results and models can also be used as
quantitative tools in provisioning a network to support video
calls with satisfactory user QoE.
As a future work, we will extend our study to include
audio quality and its impact on user behaviors. We showed
that Skype rate control is mostly driven by congestion delay
and available bandwidth. We will explore more on delaydriven rate control algorithms for video telephony in wireline
and wireless networks. We are also interested in improving
the efficiency of Skype’s FEC strategy. In this paper, we
focused on the stationary behaviors of Skype. The transient
behaviors of Skype under competition with other flows is also
an interesting topic for future study. Finally, the rate control
and video quality of Skype’s multi-party video conferencing
is also on our future research agenda.
R EFERENCES
[1] Skype Inc., “Skype features,” http://www.skype.com.
[2] S. A. Baset and H. G. Schulzrinne, “An analysis of the skype peer-topeer internet telephony protocol,” in Proceedings of IEEE INFOCOM,
April 2006, pp. 1–11.
[3] D. Bonfiglio, M. Mellia, M. Meo, N. Ritacca, and D. Rossi, “Tracking
down skype traffic,” in Proceedings of IEEE INFOCOM, Apr 2008, pp.
261–265.
[4] S. Guha, N. Daswani, and R. Jain, “An Experimental Study of the Skype
Peer-to-Peer VoIP System,” in Proceedings of the 5th International
Workshop on Peer-to-Peer Systems, Santa Barbara, CA, February 2006,
pp. 1–6.
[5] K. Chen, T. Huang, P. Huang, and C. Lei, “Quantifying skype user
satisfaction,” in Proceedings of ACM SIGCOMM, vol. 36, Oct 2006.
[6] T. Huang, K. Chen, and P. Huang, “Tuning skype redundancy control
algorithm for user satisfaction,” in Proceedings of IEEE INFOCOM,
April 2009, pp. 1179–1185.
[7] T. yuan Huang, K. ta Chen, and P. Huang, “Could skype be more
satisfying? a QoE-Centric study of the fec mechanism in an internetscale voip system,” IEEE Network, vol. 24, no. 2, p. 42, Mar 2010.
[8] L. D. Cicco, S. Mascolo, and V. Palmisano, “A mathematical model of
the skype voip congestion control algorithm,” in Proceedings of IEEE
Conference on Decision and Control, Dec 2008.
[9] ——, “Skype video congestion control: an experimental investigation,”
Computer Networks, vol. 55, no. 3, pp. 558 – 571, Feb 2011.
[10] T. Bu, Y. Liu, and D. Towsley, “On the tcp-friendliness of voip traffic,”
in Proceedings of IEEE INFOCOM, Dec 2006.
[11] R. Morris and Y. Tay, “A model for analyziing the roles of network
and user behavior in congestion control,” Massschusetts Institute of
Technology, Tech. Rep., May 2004.
[12] Microsoft Resarch Asia, “Network Emulator for Windows Toolkit
(NEWT),” http://blogs.msdn.com/b/lkruger.
[13] e2eSoft, “Vcam: Webcam emulator,” http://www.e2esoft.cn/vcam/.
[14] Renovation Software, “Text grab for windows,” http://www.
renovation-software.com/en/text-grab-sdk/textgrab-sdk.html.
[15] Google Inc., “On2 video codec,” http://www.on2.com/on2-video/.
[16] M. Jain and C. Dovrolis, “Pathload: A measurement tool for endto-end available bandwidth,” in Proceedings of Passive and Active
Measurements (PAM) Workshop, 2002, pp. 14–25.
[17] N. Hu, L. E. Li, Z. M. Mao, P. Steenkiste, and J. Wang, “Locating internet bottlenecks: Algorithms, measurements, and implications,” 2004.
[18] K. Yamagishi and T. Hayashi, “Qrp08-1: Opinion model for estimating
video quality of videophone services,” in Proceeding of IEEE Global
Telecommunications Conference, Dec 2006, pp. 1–5.
[19] ITU-M, “G.1070: Opinion model for video-telephony applications,”
ITU, Tech. Rep., Apr 2007.
[20] J. Cao and K. Ramanan, “A possion limit for buffer overflow probabilities,” in Proceedings of IEEE INFOCOM, Mar 2002.
[21] L. Kleinrock, Theory, Volume 1, Queueing Systems. Wiley-Interscience,
1975.
[22] ITU-R, “Recommendation m.1645: Framework and overall objectives
of the future development of imt-2000 and systems beyond imt-2000,”
ITU, Tech. Rep., Jun 2003.
[23] S. Floyd and K. Fall, “Promoting the use of end-to-end congestion
control in the internet,” Networking, IEEE/ACM Transactions on, vol. 7,
no. 4, pp. 458 –472, Aug 1999.
[24] N. Cardwell, S. Savage, and T. Anderson, “Modelling the performance
of short tcp connections,” University of Washington, Tech. Rep., Nov
1998.
© Copyright 2026 Paperzz