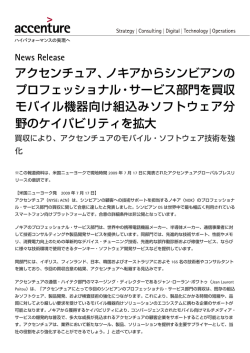
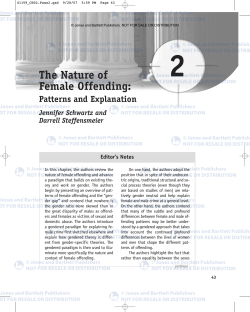
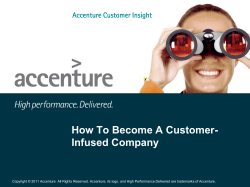
RiskTech® 2015 Research partners Media partner RiskTech S P OT L I G H T O N R I S K T EC H N O LO GY December 2014 About Chartis Chartis is the leading provider of research and analysis covering the global market for risk management technology. Our goal is to support enterprises seeking to optimize business performance through better risk management, corporate governance and compliance. We help clients make informed technology and business decisions by providing in-depth analysis and actionable advice on the broad spectrum of risk and compliance technology offerings. Areas of expertise include: ChartisResearch • Credit risk • Operational risk and governance, risk and compliance (GRC) • Market risk • Asset and liability management (ALM) and liquidity risk • Energy and commodity trading risk • Financial crime including trader surveillance, anti-fraud and anti-money laundering • Insurance risk • Regulatory requirements including Basel 2, Basel 3, Dodd-Frank, EMIR and Solvency II Chartis is solely focused on risk and compliance technology giving it significant advantage over generic market analysts. Chartis has brought together a leading team of analysts and advisors from the risk management and financial services industries. This team has hands-on experience of implementing and developing risk management systems and programs for Fortune 500 companies and leading consulting houses. Chartis Research is authorized and regulated in the United Kingdom by the Financial Conduct Authority (FCA) to provide investment advice. Visit www.chartis-research.com for more information. Join our global online community at www.risktech-forum.com © Copyright Chartis Research Ltd 2014. All Rights Reserved. No part of this publication may be reproduced, adapted, stored in a retrieval system or transmitted in any form by any means, electronic, mechanical, photocopying, recording or otherwise, without the prior permission of Chartis Research Ltd. The facts of this report are believed to be correct at the time of publication but cannot be guaranteed. Please note that the findings, conclusions and recommendations that Chartis Research delivers will be based on information gathered in good faith, whose accuracy we cannot guarantee. Chartis Research accepts no liability whatever for actions taken based on any information that may subsequently prove to be incorrect or errors in our analysis. See Chartis “Terms of Use” on www.chartis-research.com. RiskTech100®, RiskTech Quadrant® and The Risk Enabled Enterprise® are Registered Trade Marks of Chartis Research Limited. Unauthorized use of Chartis’s name and trademarks is strictly prohibited and subject to legal penalties. 2 © Copyright Chartis Research Ltd 2014 | All Rights Reserved About our partners Accenture is a global management consulting, technology services and outsourcing company, with more than 305,000 people serving clients in more than 120 countries. Combining unparalleled experience, comprehensive capabilities across all industries and business functions, and extensive research on the world’s most successful companies, Accenture collaborates with clients to help them become high-performance businesses and governments. The company generated net revenues of US$30.0 billion for the fiscal year ended Aug. 31, 2014. Its home page is www.accenture.com EY is a global leader in assurance, tax, transaction and advisory services. The insights and quality services we deliver help build trust and confidence in the capital markets and in economies the world over. We develop outstanding leaders who team to deliver on our promises to all of our stakeholders. In so doing, we play a critical role in building a better working world for our people, for our clients and for our communities. EY refers to the global organization, and may refer to one or more, of the member firms of Ernst & Young Global Limited, each of which is a separate legal entity. Ernst & Young Global Limited, a UK company limited by guarantee, does not provide services to clients. For more information about our organization, please visit ey.com. EY’s Financial Services advisory practice has dedicated globally integrated teams specializing in Financial Crime, Financial Crime Technology, and Information Security. We draw on deep industry knowledge and technical skills to deliver solutions in areas including Anti-Money Laundering, Know Your Customer, Sanctions, Fraud Detection, Trader/Market Surveillance and Cyber Security. Our services include risk assessment, regulatory response, target operating models, technology strategy, model development and optimization technology delivery, remediation, controls effectiveness testing and independent review. RiskTech S P OT L I G H T O N R I S K T EC H N O LO GY With over 79,000 registered members, RiskTech Forum (www.risktech-forum. com) is the leading independent information resource for the global risk technology community. RiskTech Forum is dedicated to the role of technology as an enabler for risk management. It aims to build the premier network of risk, compliance, and technology professionals and to act as a single hub for high quality research and news relating to risk technology. RiskTech Forum provides free access to over a thousand research papers, videos and opinions. The content covers multiple industries including banking, capital markets, insurance, and corporates. It also covers multiple risk and technology subjects, including market risk, credit risk, operational risk/GRC, financial crime, regulatory risk, risk analytics, and data management. For more information, visit RiskTech Forum at www.risktech-forum.com © Copyright Chartis Research Ltd 2014 | All Rights Reserved 3 Contents 1.Foreword 5 2.Overview 6 3. Key trends 8 4. Re-organizing for today’s cyber threat 13 5. Tackling financial crime through integrated risk and compliance 18 6. RiskTech100® rankings 2015 28 7. Category winners 31 8. Appendix A: Research methodology 32 9. Appendix B: How to read the RiskTech100® rankings 33 10. How to use research and services from Chartis 35 11. Further reading 37 List of figures and tables Figure 1: RiskTech100® research taxonomy 6 Figure 2: Geographical distribution of RiskTech100® companies 7 Figure 3: Convergence of fraud risk and IT security 13 Figure 4: Framework for integrated fraud risk and IT security management 16 Figure 5: Financial intelligence unit 19 Figure 6: Anti-fraud and AML integration 20 Figure 7: Bringing together data, models and workflow into common methodologies 21 Figure 8: Current FCRM processes 22 Figure 9: Important challenges to successful FCRM 23 Figure 10: The customer life cycle 24 Figure 11: FCRM expenditure 26 Figure 12: Example target architecture for integrated financial crime risk and compliance management 26 Figure 13: RiskTech100® research methodology 32 Table 1: 33 4 RiskTech100® assessment criteria © Copyright Chartis Research Ltd 2014 | All Rights Reserved Foreword Welcome to the Chartis RiskTech100® report. Now in its ninth year, the RiskTech100® is globally acknowledged as the most comprehensive study of the world’s most significant risk and compliance technology companies. This year we’re delighted to have additional insight from our research partners, Accenture and EY. In chapter four, Accenture shares a perceptive analysis of how leading banks are tackling cyber threats by integrating their fraud risk management and IT security capabilities. EY’s point of view on the role of integrated risk and compliance processes and systems for tackling financial crime can be found in chapter five. Over the last twelve months, integrated risk management has emerged as a central theme for many of the companies we’ve spoken to, with leading financial and nonfinancial firms looking to combine their risk and compliance capabilities across multiple risk classes. Often the motivation is to reduce cost and/or complexity – “risk and compliance simplification” is a common term that we hear from CROs – but the ultimate benefit is better risk management. Consistent taxonomies, methodologies and systems drive better decision-making and better alignment to board-level risk appetite. Of course, the concept of integrated risk management is not new; I remember seeing presentations on it over 10 years ago, post Barings, LTCM and Enron! The difference is that many of the enablers for integrated risk management are now better understood. Enhanced data aggregation, integrated analytics, workflow and reporting have created the opportunity to move from concept to reality. There’s no doubt that regulation helps; large fines and new capital and reporting requirements have acted as a catalyst for action. That said, our research over the last twelve months suggests there is a danger that, in certain domains and geographies, the regulatory focus is leading to the ‘box-ticking’ behavior that we last saw during the post-Enron Sarbanes-Oxley period, with firms falling short of realizing the full benefits of better risk management. On the supply side, cloud-based risk and compliance solutions dominate the product roadmaps of many of the leading vendors, while Big Data is central to their communications. Most of the RiskTech100® vendors’ growth strategies are dominated by solutions for regulatory compliance and, with time-to-compliance a key differentiator, those with agile and configurable capabilities have a clear advantage. As ever, the Achilles’ heel for most vendors is post-sales implementation and support. Both buyers and sellers of risk technology consistently underestimate the data integration and system configuration challenges – which bring us back to the benefits of cloud-based delivery! The trend for strategic alliances, mergers or acquisitions continues as vendors look to enhance their capabilities and establish new channels for expanding their reach. As such, we’ve noted a coming together of software and content players aiming to provide a one-stop-shop for risk and compliance. In addition to tracking the latest trends and developments in the risk technology marketplace, this report highlights some of the most dynamic and innovative vendors for key sub-segments and categories (see Category Winners on page 31). I trust that it will prove both valuable and insightful in the year ahead. Peyman Mestchian Managing Partner, Chartis © Copyright Chartis Research Ltd 2014 | All Rights Reserved 5 Overview The RiskTech100® companies are drawn from a range of risk technology specialisms, meeting the needs of both financial and non-financial organizations. However they share a number of qualities that rank them among the top 100 risk technology providers in the world. The rankings are drawn up based on the following classifications: Figure 1: RiskTech100® research taxonomy Horizontal solutions: • Credit risk • Market risk • Liquidity risk & ALM • Energy & commodity Trading • Financial crime • Operational risk & GRC • Regulatory reporting Vertical sectors: •Banking • Trading & capital markets • Fund & asset management •Insurance • Corporations (non-financial) RiskTech® 2011 Chartis categories: •Functionality • Core technology • Organizational strength • Customer satisfaction • Market presence •Innovation Geographical sectors: • North America • Central & South America •Europe •Asia-Pacific • Middle East & Africa 2011 Category Winner Credit Risk 6 © Copyright Chartis Research Ltd 2014 | All Rights Reserved The RiskTech100® only includes companies that sell their own risk management software products and solutions. While many provide professional services and consulting offerings to support the implementation and use of their software solutions, pure consulting or professional services firms are excluded from this study. The biggest rising firms are US-based Safe Banking Systems, up 24 places to 66th, and India’s Polaris FT, up 22 places to 52nd. Numerix returns to the top 20 at 19. New entrants to the RiskTech100® are Broadridge at 48, Bloomberg at 49, Fenergo at 69, CustomerXPS at 87, OpenGamma at 90, NCR Alaric at 95 and iDetect at 100. This year, two companies hold the top position in the RiskTech100®. IBM is once again ranked number one but is joined by SAS, which moves up from second place. SunGard retained third place, posting high scores for functionality and core technology. Once again, the rankings are dominated by US-based firms, as shown in Figure 2. The UK is the next most common location with 19 companies. Next are France and Canada with 6 companies, while India moves up from the 8th most featured country to the 5th, with 5 companies. Figure 2: Geographical distribution of RiskTech100® companies US UK Canada France India Ireland Germany Australia Austria Belgium Denmark Finland Israel Italy Luxemburg Netherlands Switzerland UAE 0 102030 4050 © Copyright Chartis Research Ltd 2014 | All Rights Reserved 7 Key trends Financial institutions (FIs) continue to dominate demand for risk technology solutions, despite tightening their overall IT budgets. Our research shows that risk IT spending continues to increase within these budgets, taking larger shares of the available funding – demonstrating the continued focus on risk management. The market for risk technology is staggered in terms of maturity; banks and capital markets have traditionally been leaders in risk technology investment, and therefore have the most mature technology solutions. However, other industry sectors such as insurance, energy, commodities and government are also planning to invest more on risk technology. Integrated governance, risk & compliance The vision and promise of integrated governance, risk and compliance (GRC) has been around for over a decade. However, over the last 18 months, we have observed financial and non-financial organizations making good progress from vision to execution. This trend is driven by multiple regulatory requirements, the need to manage the increasing cost of compliance, and firms’ desire to reduce complexity. For example, we have seen a number of local and global FIs, on both sides of the Atlantic, merging their risk and compliance functions. Furthermore, a number of leading consulting firms – including some of the “Big Four” advisory firms – are aggressively promoting integrated GRC as best practice. Few firms have been successful in any kind of a ‘big bang’ approach for integrated GRC. Instead, it requires a phased modular approach. Common starting points we have observed include integrating: • Operational risk and compliance • Market risk and credit risk • Fraud risk and anti-money laundering (see chapter 5 by EY) • Fraud risk and IT security (see chapter 4 by Accenture) • Risk and finance 8 Frequently it is the latter – integrating risk and finance – that is adopted as a strategic starting point. The alignment of data, metrics and processes between risk and finance functions is seen by many firms as a fundamental requirement. A small number of RiskTech100® vendors have taken up this trend as an opportunity, and are providing integrated data management, workflow, analytics and reporting platforms as enablers. The ultimate goal here is an enterprise framework for risk-based performance management supported by a robust and flexible technology environment. Risk data aggregation & reporting Providing senior management with clear, relevant information about the whole enterprise has always been a problem for organizations in every sector. Risk information is no exception, and large, multinational institutions with multiple technology systems still struggle to gain a single view of the financial position and risk faced by the organization. Rectifying this situation is a vital step towards effective risk management and improving performance. This challenge is especially difficult for FIs. The increased speed and volume of transactions have led to exponential growth of the ‘three Vs’ of data (volume, variety, velocity), and firms must process and respond to this data quickly to tackle risks and seize market opportunities. Regulatory pressures only add to the burden. In November 2011, the Financial Stability Board published policy measures to address conduct by systemically important financial institutions (SIFIs), and named 29 global systemically important banks (G-SIBs). These institutions must meet stricter regulatory requirements for data aggregation, risk governance and internal controls. The US Financial Stability Oversight Council (FSOC) also designated eight key financial system infrastructure entities as SIFI “utilities”, as well as a number of non-bank financial companies, including internationally active insurance companies. This has been mirrored by regulators around the world. It is important that firms do not underestimate the scale of the challenge that they face. The 2012 Basel © Copyright Chartis Research Ltd 2014 | All Rights Reserved Committee document (BCBS-239) Principles for effective risk data aggregation and risk reporting is frequently referred to as an industry guideline and can be used for baseline capability measurement for a range of risk reporting activities. Covering a wide variety of topics and instances, the guidance relates to four interconnected areas: • Overarching governance and infrastructure – The Board must be aware of any weaknesses in the technology architecture, and the infrastructure should support aggregation and reporting across silos and in times of stress. • Risk data aggregation capabilities – Systems need to generate accurate aggregated data in an automated and on-demand fashion. • Risk reporting practices – Firms must be able to submit reconciled, validated, accurate reports that cover all material risks, with an awareness of gaps. • Supervisory review, tools and cooperation – Supervisors will review compliance and should be able to restrict risk-taking if concerned by data deficiencies. Chartis predicts that, in due course, these requirements and standards will trickle down from Tier 1 global institutions to Tier 2 firms, although the levels of complexity will always be higher for the larger firms. This will be a core area of research for Chartis in 2015. Basel 3 Basel 3 continues to be a catalyst for risk technology initiatives and expenditure across many regions. Basel 3 guidelines require FIs to perform more calculations and submit more data to regulators than ever before; all the while meeting greater pressure to increase their capital, liquid assets and collateral. This increased workload means many FIs have to allocate limited risk and finance resources to regulatory tasks rather than pursuing business goals. To adapt to resource-squeeze and the impact of new regulations, financial institutions need to make a number of changes to improve their performance: • Improve capital management • Integrate risk and finance • Integrate liquidity and collateral management • Implement enterprise-wide risk management • Implement enterprise-wide stress testing © Copyright Chartis Research Ltd 2014 | All Rights Reserved Rather than running before they can walk, firms should consider which elements of a Basel 3 system they need. Implementing an enterprise-wide system may be useful for banks that have made little progress so far. More advanced firms may only need specific components, e.g. liquidity risk reporting, and should assess the pros and cons of ‘buy vs. build’. Either way, systems will need to be flexible enough to integrate with others, and to adapt to future regulatory changes. Solvency II Insurance firms across Europe and beyond are dealing with the challenges of implementing a set of risksensitive solvency and capital requirements that come under the Solvency II umbrella. We have noted that key trends in this market include: • The rising cost and complexity of implementing Solvency II • Most firms are moving from Pillar I to Pillar 2 requirements, particularly on ORSA (Own Risk and Solvency Assessment) • Vendor solutions specifically designed for the insurance industry are winning against generic solutions, which are often banking-focussed • Data management remains the number one obstacle to successful implementation Conduct risk There continues to be an increased global focus on the behavior of FIs with respect to their customers – driven by regulation from around the world, and following on from scandals such as mis-selling of insurance and mortgage products, and market abuse such as LIBOR rate-fixing. Incredibly, global fines for conduct-related failures reached over $250 billion from 2009-2014. FIs are therefore beginning to examine how to define and manage conduct risk across the enterprise, from the establishment of culture and governance processes, to the implementation of new technology platforms. Many firms see conduct risk as a sub-set of operational risk. Indeed, according to an OCC (Office of the Comptroller of the Currency) review of bank risk, operational risk has overtaken credit risk as the most important risk type. However, conduct risk is not only an issue for the financial services industry, as recent cases of bribery in the defense industry and accounting fraud in the retail industry go to show. 9 Evolution of crime analytics Until recently, most small and mid-sized firms could not afford the expertise and technology of advanced crime analytics. Up to now it has been accessible only to the top tier of finance and government institutions. Also, the analytical tools themselves had traditionally been designed for advanced (PhD level) users and not accessible by business users/generalists. However, this picture is starting to change. Innovations in areas such as cloud-based analytics, new visualization tools and open analytical discovery toolkits are putting crime analytics in the hands of business users. Further advances include the use of artificial intelligence, unstructured data analytics, in-memory and real-time computing and open-source data/ content. Risk & compliance solutions as-a-service The idea and promise of risk and compliance as-aservice has been around for some time. Already a number of sub-segments (e.g. buy-side risk analytics) have mature hosted and cloud-based solutions. However, over the last twelve months, we have observed a significant shift in demand towards hosted risk and compliance solutions across more industry verticals and risk classes. The technology vendors are responding to this demand by developing horizontal software-as-a-service solutions in such segments as Know Your Customer (KYC), Anti Money Laundering (AML), GRC, market risk and regulatory reporting. Risk technology expenditure in the US The US is the fastest growing market for risk IT expenditure. This is driven by a raft of new financial services regulations coupled with stringent local enforcement. Risk IT spending priorities in the US include: • Capital adequacy infrastructure, with particular focus on credit risk • Enterprise stress testing • Model risk management • Liquidity risk management • Operational risk management • Collateral management 10 New definitions of emerging market banks Our research identified clear regional and geographical differences in risk management and compliance trends. However, demand for risk technology in the emerging markets is not segmented along the traditional regional lines of Asia-Pacific, Americas, Middle-East and Africa. A more representative segmentation of the emerging markets is by maturity, as outlined below: 1. Advanced – making good progress towards implementing Basel 3, demonstrating substantial knowledge and expertise, and focusing on comprehensive stress testing and advanced risk analytics. Countries in this market segment include: Brazil, Malaysia, Mexico, Saudi Arabia, Singapore and South Africa. 2. Intermediate – post-Basel 2 but pre-Basel 3, with some in-house expertise yet lacking more advanced know-how. Conducting basic stress testing and in the process of attaining skills and technology for the more sophisticated requirements of Basel 3. Countries in this segment include China, Hong Kong, India, Indonesia, Philippines, Russia, South Korea, Thailand and Turkey. 3. Developing – still implementing Basel 2, with a focus on putting credit risk management systems and processes in place and learning about advanced operational risk management. Little or no attention given to stress testing, and government enforcement of Basel regulations tends to be relatively weak. Countries in this segment include: Argentina, Egypt, Ghana, Kenya, Nigeria, Qatar, UAE, Uruguay and Vietnam. Partnerships, mergers and acquisitions In the last twelve months, Chartis have observed and advised on a number of high profile strategic alliances, mergers and acquisitions in the risk technology marketplace. The key drivers for most of these transactions are: • Access to new product functionality and/or technology capabilities • Access to innovative intellectual property (IP) or risk/ compliance content • Access to new channels to market, e.g. new geographical or industry verticals • Speed to market © Copyright Chartis Research Ltd 2014 | All Rights Reserved • Becoming a one-stop-shop for risk and compliance solutions Selected transactions and partnerships from the last twelve months include: Reed Elsevier’s acquisition of FircoSoft – FircoSoft will become part of Accuity, Reed Elsevier’s provider of global payment routing data and compliance solutions to banks and businesses worldwide. The acquisition will extend Accuity’s portfolio of next-generation products and solutions covering AML, KYC and regulatory compliance. The estimated value of the transaction is €150m. Intercontinental Exchange’s (NYSE: ICE) acquisition of SuperDerivatives – Founded in 2000, SuperDerivatives provides risk management analytics and systems across multiple asset classes – including interest rates, FX, credit, equities, energy and commodities – to customers such as banks, asset managers, corporations, central banks, auditors and brokers. The acquisition will accelerate the expansion of ICE’s comprehensive multi-asset class clearing strategy. Terms of the all-cash transaction included a purchase price of approximately $350 million. MSCI’s acquisition of GMI Ratings – GMI Ratings is a provider of corporate governance research and ratings on over 6,000 companies worldwide. Clients of GMI Ratings include leading institutional investors, banks, insurers, auditors, regulators and corporations seeking to incorporate environmental, social and governance (ESG) factors into risk assessment and decision-making. GMI Ratings was formed in 2010 through the merger of GovernanceMetrics International, The Corporate Library and Audit Integrity. The addition of GMI’s corporate governance research and ratings will enable MSCI to offer its clients a depth and quality of coverage across all three pillars of ESG research. The estimated value of the transaction is $15m. ACI Worldwide’s acquisition of Retail Decisions (ReD) – ACI Worldwide (NASDAQ: ACIW), a provider of electronic payment and banking solutions, completed the acquisition of Retail Decisions (ReD), a provider of fraud prevention solutions. The combination of ACI and ReD results in a comprehensive merchant retail risk and customer experience management solution. Under the terms of the agreement, ACI Worldwide acquired ReD for an all-cash purchase price of $205 million. IBM’s acquisition of CrossIdeas – IBM acquired CrossIdeas, a privately owned provider of security software that governs user access to applications and © Copyright Chartis Research Ltd 2014 | All Rights Reserved data across on-premise and cloud environments. The financial terms were not disclosed. IBM has now made more than a dozen acquisitions in security over the past decade and invested extensively in dedicated research and development in the security space. FIS’s acquisition of CMSI – CMSI is a leading provider of consumer loan origination and portfolio management software to a range of financial institutions within the US and Canada ranging from community-based institutions to large, international lenders. The acquisition expands FIS’s total lending offering to North American financial institutions and creates an end-toend loan life cycle management offering for direct and indirect lenders across North America. The terms of the transaction were not disclosed. Deutsche Börse’s acquisition of Impendium Systems – Deutsche Börse Market Data and Services acquired Impendium Systems, a London-based firm that deploys cloud-based software solutions to help customers achieve regulatory compliance in Europe, North America and Asia-Pacific. The deal represents an important step in Deutsche Börse’s growth strategy of integrating technology and data offerings to better serve client needs. GoldenSource and CTI form strategic alliance to provide FATCA solution – GoldenSource, a supplier of enterprise data management solutions for the securities and investment industry, announced a strategic alliance with Compliance Technologies International (CTI), a provider of tax withholding and compliance software. The aim of the partnership is to provide a complete, end-to-end, FATCA solution for financial institutions. Misys and FircoSoft form alliance to tackle the dangers of dual-use goods and financial crime in trade finance – More than 200 banks rely on Misys FusionBanking Trade Innovation to manage their trade finance operations. Now it is combined with FircoSoft’s solutions for sanctions filtering, banks are able to screen international trade messages for sanctions purposes as well as monitoring incoming or outgoing payments, throughout the trade life cycle. Markit and Genpact launch KYC services – Citi, Deutsche Bank, HSBC and Morgan Stanley work with Markit and Genpact to design new service to centralize client on-boarding and KYC data management. The partnership will operate as a joint venture and will serve customers from centers in London, New York, Dallas, Bucharest, Krakow, Bangalore and Noida. It builds on expertise and technologies offered by Markit and Genpact, including Genpact’s Remediation as a 11 Service platform, which offers workflow, document management, analytics, reporting, traceability and governance, and Markit’s Counterparty Manager service. Trusteer to integrate with Fiserv Retail Online and Business Online banking solutions – Fiserv, Inc. (NASDAQ: FISV), a global provider of financial services technology solutions, and Trusteer, an IBM company and a provider of endpoint cybercrime prevention solutions, announced a partnership to provide integrated fraud prevention services designed to protect financial institutions and their customers against cyber-attacks. As part of the agreement, Trusteer technology will be available to Fiserv online banking clients. 12 © Copyright Chartis Research Ltd 2014 | All Rights Reserved Re-organizing for today’s cyber threats Converging fraud risk management with IT security The threat for banks however, is that, in tandem with the technological developments underpinning an ever increasing set of new service offerings, organized criminals have been developing multipronged strategies to exploit fresh weaknesses and vulnerabilities for fraudulent gain. If we were to think of financial institutions as homes, and organized criminals as potential burglars, then each time banks implement a new product or open up a new channel for customer interaction, this effectively adds a new window or door that could serve as an entry point for those criminals and therefore needs to be secured. Banks are facing an urgent need to bring the historic silos of fraud risk management and IT security more closely together to combat mounting data security and cyber threats from increasingly well organized criminal entities. The past two decades have seen an accelerated rate of product development and technology adaptation within the financial services sector. From the introduction of the first online banking service in the US As the IT systems supporting banking services have in 1994, the industry has developed and implemented 1 become more advanced from mainframes in the 1960s, increasingly innovative services. Customers today to today’s Web 2.0 and cloud technologies, criminals benefit from contactless card payments, mobile have and become more sophisticated in their abilities to banking apps and person-to-person payments, toof name Convergence Fraud Risk IT Security target and penetrate these systems. Today’s organized just a few of these innovations. criminals are deploying a wide array of attack methods, Figure 3: Convergence of fraud risk and IT security Accelerating rate of product development Bank of America credit card Cheque guarantee cards 1958 1950 Diners charge card Development of ACH 1966 1966 Barclaycard launched Introduction of home banking 1970 1970 Rollout of ATMs Microsoft includes online banking in finance software 1980 1980 Rollout of debit cards Contactless card transactions 1994 1994 First online banking website Banking apps for smart phones 2007 2003 Chip and PIN trials begin 2010 2008 2014 Faster payments Person-to-person rapid or instant clearing payments: paym Driving evolving vulnerabilities to fraud Fraud risks Risk Management • Credit risk • Market risk • Operational risk • Financial crime • Conduct Integration of risk and IT Check Fraud Lost and stolen cards Application fraud Mail non-receipt fraud Account take-over Counterfeit card fraud Cash machine / ATM fraud Historic separation of domains Phone banking fraud Fake banking apps Phishing websites Industry responses eg: Chip & PIN, EMV, 3-D Secure Evolving product, business and IT risks driving the integration of risk and IT IT risks Technology responses eg: data analytics, sophisticated profiling Advanced persistent threats IT Security • Policies • Physical controls • Anti-virus • Access controls • Device hardening • Segmentation IT evolution Social engineering Card not present fraud Resilience Remote access trojans Key logging Drive by downloads Disaster recovery Intrusion Screen capturing Man-in-the-middle attacks Distributed denial of service Mainframe Mini Copyright © 2014 Accenture All rights reserved. Source: Accenture analysis, November 2014 © Copyright Chartis Research Ltd 2014 | All Rights Reserved Client - server Web services HTML injection Man-in-the browser attacks Bring your own device Proxy servers, DNS poisoning Cloud 1 13 such as screen capturing, man-in-the-middle attacks, Trojans, falsifying mortgage applications, card cloning and embedding sleepers within the workforce, among many others. For financial institutions, particularly in the areas of retail banking and payments, there are enormous opportunities to be gained from enhancing their digital offerings to customers. The overall experience is improved as customers gain greater flexibility in how they manage their finances, while at the same time banks are able to lower their operating costs, and also offer more personalized products and services to customers through better use of data and analytics capabilities. The challenge for banks however, is to implement these new digital models at speed so they can maintain a competitive edge in the market, but without putting security at risk. To date, the speed at which many banks have evolved their technology and service offerings has been so rapid that their counter-fraud strategies have struggled to keep pace. And looking forward, the expectation is that the pace of change will only increase. The need for convergence Traditionally, banks have managed different categories of fraud within silos. For example, there may be specific teams dedicated to check fraud, mortgage fraud, credit card fraud and so on. But often, these teams are not sharing data with one another, and they may be reporting into individual heads of fraud for each business line. Ultimately, the chief risk officer (CRO) would tend to be at the top of this umbrella. Meanwhile, IT security issues, such as those concerned with systems access, tend to be managed solely by the IT function, often under the jurisdiction of the chief information officer (CIO). As traditional risks converge with new risks such as cyber threats, banks are becoming exposed to security threats that can fall between the cracks of the various silos. Organized criminals are targeting several channels at the same time, aware that many banks are unable to connect the dots and spot wider patterns of behavior as a result of these historic structures and the lack of a holistic approach to risk and security. Furthermore, legacy information security, event log management, and fraud and risk management software solutions, which still form the backbone of many risk and security architectures, lack the ability to provide deep insights into real-time user behaviors, transactions and data. If security solutions remain siloed and banks continue to extend their offerings, then sophisticated criminals Digital disintegration – cyberattack as a global risk The threat of cyberattack is no longer something that can be addressed by individual organizations in isolation. As the World Economic Forum notes in its Global Risks 2014 report, the increasing interconnectedness of every part of the world’s societies and economies, that rely on the same infrastructure, hardware and software standards raises the prospect of disruptions having systemic impact. In future, cyber governance must become a combined international effort. For instance, the growth of the “internet of things” means that more and more devices are now online, widening the reach of cyber connectivity into people’s lives across the world. This serves to create more points of entry for attackers and exacerbates the potential damage that could be caused. At the same time, the complexity of interaction between people and their “connected” devices across the globe is making those impacts harder to predict. While banks and financial institutions are 14 concentrating on boosting their own organizational defenses, what may be needed in future is cooperation between nations, their governments and private organizations, to counter the common threats. Fresh thinking is required on how to preserve, protect and govern the common good of a trusted cyberspace. Organizing an effective international response will not be easy however. Recent revelations surrounding the extent to which national security organizations have allegedly been using the internet for spying threatens repercussions that may make it more difficult to prevent widespread attacks, or contain them when they occur. If there is a breakdown of trust among nations, it could be disastrous for cybersecurity. In the same way that piecemeal solutions within banks are unable to effectively combat multipronged attacks from organized criminals, solutions undertaken without cooperation between nations will fail to address the systemic threats that are emerging. © Copyright Chartis Research Ltd 2014 | All Rights Reserved will simply run rings around them, bypassing existing controls and protections by abusing the business logic across multiple channels. To fight this organized crime, banks need a sophisticated, organized approach of their own. Developing such an approach however will require financial institutions to concentrate more of their budget on developing more advanced solutions to support the future shape of the industry, rather than focusing investments to respond to issues from past transgressions or remediation activities. Process Integrating fraud risk and IT security Another key step is to ensure that there is common governance across risk and IT security. This will involve aligning risk and performance indicators. At the same time, policies must be realigned to ensure that they reflect the new aggregation of responsibilities across the two functions. Underpinning this will be a need to re-engineer the management information processes and the key metrics being applied. In many countries, recently introduced banking regulations are driving firms to evaluate their risk management frameworks from a more integrated perspective than ever before. At the same time, leading banks are responding quickly to the emerging threats posed by organized criminals by integrating their approach to fraud risk and cyberattack across the organization. As they respond to these twin pressures, financial institutions will need to address challenges around people, processes and technology. People Banks must ensure that there is formalized knowledge sharing between those in the fraud risk function and the IT security function. In addition, they will need to align behaviors around risk management across the organization. Part of the solution will involve adjusting incentives and targets to ensure that both IT security and fraud risk personnel are measuring their performance and effectiveness in this area in ways that are aligned for the desired outcomes of the bank. The differing cultures, experiences and backgrounds of the stakeholders will also need to be addressed, in order to establish a common level of understanding and use of terminology (for example, a unified taxonomy for risk and controls). The importance of an effective communications strategy in achieving this level of change cannot be over emphasized. The wider business must also ensure that these two functions are in a position to be proactive, rather than reactive as has historically been the case. For instance, they need to be involved earlier in decision-making processes, especially around the future development of products and services – rather than being engaged at the end of a decision chain. Developing a product or service that cannot be supported does not benefit anyone. © Copyright Chartis Research Ltd 2014 | All Rights Reserved At present, many banks manage fraud cases through separate units, using different system tools to log activity. However, this approach does not reflect the way fraudsters are behaving, as they attack the bank from multiple angles in a coordinated manner. Banks must therefore shift to enterprise case management, enabling them to look at every fraud or risk case that arises within the organization as a single portfolio, to protect themselves more effectively. Technology The foremost technology priority for banks is to ensure that organizational data is freed from silos and shared upon common platforms. This undertaking must encompass both structured data, such as transactional and account data, as well as unstructured data, such as email, video, image and social media. Ensuring that common data standards are enforced across functions will be another key aspect of this shift: at present, a lack of common oversight around data management means that different standards and taxonomies are often applied to the same data by individual business units. In addition, without consistency in reporting, it becomes almost impossible for the board to project organizational risk priorities accurately and respond appropriately. Therefore, a single data governance framework covering fraud and IT security is a critical success factor. For many leading banks, the chief data officer (CDO) plays a key part in defining the appropriate policies and procedures for data governance. Advanced analytics technologies provide the ability to gain a real-time understanding of behavior and spot anomalies that indicate threats. These analytics must also be appropriately intuitive and accessible: enterprise dashboards can deliver integrated fraud and security visualization capabilities depicting key risk and control metrics, for instance, with full drill-down capabilities into the source data. 15 Figure 4: Framework for integrated fraud risk and IT security management CRO CCO Head of security CIO COO Visualization layer Dashboard Heat maps Case evidence Regulatory reports Enterprise core management Work flow tools Forensic tools Risk scoring Ad hoc query Detection layer Rules engine Predictive analytics Big data + big analytics Behavioral modeling Alert engine Data integration layer Point solution layer Security data Fraud data OpRisk data Cyber crime data HR data Customer data Source : Chartis, November 2014 Convergence is a multi-year journey The convergence we have discussed is a significant undertaking and clearly cannot be achieved overnight. As with any business change of this scale, a phased approach will be required. And importantly, will need to be aligned to the strategy and desired positioning of the bank. So while the sequence of the journey will be dependent upon each individual bank’s current structure and culture, there are some common steps that all banks should consider. Gap analysis and vulnerability assessments must be made to identify any weaknesses in controls and potential opportunities for malicious activity. The results of these assessments can then be used to design a target operating model that effectively protects against those highlighted risks. Once this has been identified, it is important initially to pursue the low-hanging fruit to build momentum and senior management support for the change process. For example, it may be that existing systems already hold some degree of shared data, so this would be an obvious starting point. In addition, the scale and importance of the transformation may justify the appointment of someone with the appropriate skillset to oversee the change. Some large banks have begun to hire for roles entitled ‘Head of Operational Risk Change’, for 16 instance. And in the same way that criminals today have grown in sophistication by working together in online networks, we expect to see increased sharing of insight across financial institutions, and some common platforms being established, along with laws and law enforcement evolving to enable banks to better collaborate and protect themselves. While it is likely to take several years before the desired convergence is achieved, what is clear is that leading banks are already moving in this direction, and Accenture and Chartis expect this trend to extend across the industry. In some ways, financial institutions are involved in an arms race to improve their security defenses, but the good news is that there are multiple players involved. The banks that are leading the pack will naturally face fewer attacks, as criminals will always target those with the weakest defenses. And with financial institutions increasingly competing on their ability to act as custodians of customer data, the convergence of fraud risk and IT security will drive their competitive advantage in this area in future too. Notes 1. “How Online Banking Evolved Into a Mainstream Financial Tool,” Motley Fool, November 9, 2014. Access at: www.nasdaq. com/article/how-online-banking-evolved-into-a-mainstreamfinancial-tool-cm411861 © Copyright Chartis Research Ltd 2014 | All Rights Reserved About the Accenture contributors Steve Culp Senior Managing Director Accenture Finance & Risk Services Based in Chicago, Steve has more than 20 years of global experience working with clients to define strategy, and execute change programs across a broad spectrum of risk management and finance disciplines. Steve is responsible for leading the global group across all dimensions, from setting the strategic direction through to the enablement of local teams operating across diverse markets. In addition, he oversees Accenture’s efforts on large-scale transformation programs across Finance and Risk for some of our most important financial services clients. Prior to his current role he was responsible for our Global Risk Management Practice, and prior to that he led Accenture’s Finance & Enterprise Performance consulting services for global banking, insurance and capital markets institutions. With his extensive experience in the financial services industries, combined with his knowledge of risk management and the finance function, he guides executives and client teams on the journey to becoming high-performance businesses. Mark Daws Managing Director Accenture Finance & Risk Services Based in London, Mark has more than 25 years of financial services experience, specialized in large, complex, risk, regulation and compliance, and IT enabled business transformation client assignments and work. His deep experience across all sectors of the financial services space includes previous roles as a; Technology Consultant leading large and complex risk and regulation IT implementations; a Solvency II Chief IT Architect leading the design and implementation of Solvency ll solutions; a Forensic Technologist assisting clients in crisis-management situations including rogue trading and sanctions violations and; a Financial Services Regulator focusing on complex and high-profile investigations. DISCLAIMER: This document is intended for general informational purposes only and does not take into account the reader’s specific circumstances, and may not reflect the most current developments. Accenture disclaims, to the fullest extent permitted by applicable law, any and all liability for the accuracy and completeness of the information in this document and for any acts or omissions made based on such information. Accenture does not provide legal, regulatory, audit, or tax advice. Readers are responsible for obtaining such advice from their own legal counsel or other licensed professionals. Rights to trademarks referenced herein, other than Accenture trademarks, belong to their respective owners. We disclaim proprietary interest in the marks and names of others. Accenture, its logo, and High Performance Delivered are trademarks of Accenture. Copyright © 2014 Accenture All Rights Reserved © Copyright Chartis Research Ltd 2014 | All Rights Reserved 17 Tackling financial crime through integrated risk and compliance Leading financial institutions (FIs) are rethinking their organizational structures to manage financial crime risk more effectively. The integration and alignment of risk and compliance functions will be crucial if the financial services sector is to address the broader sources of financial crime risk and tightening regulation to which it is exposed today. FIs are becoming exposed to increasingly sophisticated techniques used by organized criminals, who target vulnerabilities that are opening up as large volumes of customers perform multiple transactions across multiple channels. Cyber threats are one part of the equation, but FIs are grappling with criminals who often target a number of different internal and external channels. In addition, they must monitor traders, sanctions and watch-lists, and deal with the proliferating numbers of smaller financial crimes, all the while managing tightened budgets. At the same time, the sector is facing a significant compliance burden as regulation of its practices continues to tighten, and as customers and investors demand greater transparency and integrity from financial dealings. The introduction of the Foreign Account Tax Compliance Act (FATCA) in the US this 18 year – as well as the subsequent intergovernmental agreements (IGA) to follow – is just one such signal of international intent to make FIs more accountable for risk and compliance management on behalf of their customers. In addition, the operational costs of financial crime risk management are rising: the monitoring of the multitude of channels is proving to be increasingly expensive for firms in terms of expertise and the establishment of Financial Crime Risk Management (FCRM) Systems. There have been several recent cases of large FIs being fined by regulators and reproached in the media for failures in their anti-money laundering (AML) and sanctions monitoring controls, too. Given that such financial crime is fundamental to the operations of terrorists, drug traffickers and corrupt political regimes, FIs simply cannot afford to risk the reputational damage inflicted by such compliance failures. The traditional silo-based approach to the management of financial crime risk and compliance – whereby separate organizational structures support individual risk types such as money laundering, card fraud or internal fraud – will no longer suffice. A disconnected set of fraud or AML platforms is less likely to stand up to attacks that cut across multiple business lines, geographies and risk types. It is for this reason that FIs are looking towards integrating their risk and compliance systems. In the long term, small incremental adjustments to systems and processes will simply not be enough. © Copyright Chartis Research Ltd 2014 | All Rights Reserved The EY point of view: The establishment of financial intelligence units One emerging industry trend in response to increased regulatory scrutiny is the adoption of financial intelligence units (FIU). Financial institutions are looking to establish or enhance their financial intelligence units in order to better leverage disparate sources and available internal and external intelligence to improve the effectiveness and efficiency of their financial crime risk management programs (Figure 5). to design and implementation of an FIU vary significantly across industry, FIs are recognizing the benefits of maximizing the information available for analysis and investigation along with standardizing processes across lines of business, geographies and financial crime domains (e.g., AML, fraud, bribery, corruption, sanctions, tax evasion and cybercrime). Longer term, FIU concepts encourage a more proactive stance to financial crime risk management, allowing banks to better identify and be more adaptive to emerging trends and typologies. The core concepts of collation, analysis and dissemination of intelligence are highly applicable to the current environment in FIs. While the approaches FIU Original Government organizations LoBs Other banks AML Sanctions Fraud AML Sanctions Fraud AML Sanctions Fraud Transactions Transactions Transactions Transactions Customers Customers Customers Customers Corporate Private banking Capital markets Retail Data Country FIU AML Industry bodies Regional FIU Sanctions Media Global FIU Monitoring Key Fraud FIU Intelligence, analysis, decision-making, governance and technology External intelligence Example FIU geographic structure Regulators / national FIUs Figure 5: Financial intelligence unit Potential functional scope of an FIU Source: EY Page 0 December 9, 2014 [Presentation title] © Copyright Chartis Research Ltd 2014 | All Rights Reserved 19 The business case for integrated risk and compliance Apart from protecting against financially damaging attacks and regulatory fines, there are business, compliance, efficiency and cost advantages to be gained from integrating risk and compliance capabilities. In a recent Chartis survey of senior executives within FIs around the world (Figure 6), 71% of respondents agreed that there is a compelling business case for integrating some or all of their anti-fraud and AML systems into a single technology environment. A siloed approach to managing financial crime risk makes it almost impossible for FIs to spot patterns of behavior across the organization, which will enable them to identify sophisticated attacks that target multiple sources. Regulators and FIs are drawing links between types of financial crime. Fraud and trading violations are increasingly being regarded as predicate offenses- those offenses whose proceeds may become the subject of money laundering. Opportunities for criminals to undertake multi-pronged attacks have been expanded by the explosion of new technologies that FIs have implemented, and the increase of remote banking transactions through internet and mobile channels (e.g., person-to-person payments and mobile banking apps). This has served to amplify the inter-connectedness of financial crimes. For instance, most fraud crimes have some kind of money-laundering element in them, as the proceeds of fraud have to be placed back into the financial system, layered with transactions to separate the money from its source, and finally integrated, returning the money to the criminals from a seemingly legitimate source. A key advantage of integrated risk and compliance is that it brings the personnel tackling different financial crimes and compliance initiatives closer together, to enable direct communication among teams managing 20 Figure 6: Anti-fraud and AML integration Do you believe that there is a compelling business case for integrating some or all of your anti-fraud and AML systems into a single technology environment? 31% Strongly agree Agree 40% Neutral 26% 1% Disagree Strongly disagree 2% 0% 5% 10% 15% 20% 25% 30% 35% 40% Source: Chartis financial crime global survey fraud risk, AML and market abuse, for instance. This also helps organizations visualize potential financial crime risks across business lines, and build a holistic view of normal and abnormal behaviors. There are several examples in the industry of how FIs can obtain benefits from sharing intelligence and information from different risk and compliance silos to glean insights on financial crime risks. For example: • Rogue trading events may have been better understood by combining views on toxic combinations of access with unauthorized trading activity for individual trades. • More comprehensive KYC and trader surveillance information for individual broker dealer customers may have identified toxic, large-scale Ponzi schemes using floats generated by sophisticated check kiting techniques earlier. • New human and drug trafficking typologies have benefited from sharing information between fraud and money laundering departments. © Copyright Chartis Research Ltd 2014 | All Rights Reserved Convergence of people, processes, technology and data • The identification of previously unidentified patterns Until now, most FIs have been reacting to the sector’s rapidly evolving regulatory requirements on a piecemeal basis, meaning that some of the data and technology being used to combat financial crime have been duplicated across the organization. The integration of risk and compliance is an opportunity to remove that duplication of effort, and to bring data and analytics together into a central and consistent environment. • The recognition of new threats and construction of This environment can be considered to consist of three key building blocks that must be brought together: data, models and workflows. These can be drawn together into common methodologies and processes, enabling standard operating models, and consistent analysis across risk silos, and organizational and geographical barriers (Figure 7). In most FIs, separate business lines use individual case management databases for logging and managing risks that arise, while reporting is also done on a siloed basis. Pooling cross-organizational, cross-border data is perhaps the most important step in the integration process. An enterprise financial crime data management strategy can deliver a host of advantages, such as: of behavior through linking unusual activities across risk silos, business lines and borders. intelligence that can be used to enhance controls in individual monitoring platforms. • The ability to recognize the scale of impact of an attack and coordinate an appropriate response. • The ability to enable true enterprise-wide search to facilitate internal and external requests for information. Cost savings Recent discussions with Tier 1 FIs have revealed that, if managed properly, the integration of multiple risk and compliance functions can deliver cost savings between 20% and 30%, as a broad estimate. This is achieved through a combination of system and process rationalization. Creating a unified data platform will reduce the cost of ownership for a particular system, because the support and maintenance costs are shared. The integration of systems makes data management an easier task too. Figure 7: Bringing together data, models and workflow into common methodologies Common methodologies Data data can be shared • Risk across the lines of • AML, fraud, sanctions monitoring, trader surveillance, and cyber security. Models Linked models can be • used to build holistic views of customers. More efficient or • specifically purposed Data can be shared across business lines and geographies to establish a common standard. This should take into account any potential issues with national and regional data protection laws. © Copyright Chartis Research Ltd 2014 | All Rights Reserved analytics for counterfraud or AML can be re-used and utilized to reinforce or disprove conclusions from their neighboring disciplines. Workflow Workflow activities • can be brought together into an enterprise-level case management system. hub can • beA single created for investigations or action plans. 21 A centralized financial crime department can also provide a centralized group of investigators, cutting down on manpower and bottlenecks in expertise, and enabling more efficient investigations and reporting. This can cut down on duplication of effort, increase transparency, scalability, and agility. In the end, this can result in significant cost savings while improving risk management. on unified technology architecture and data model, while the vast majority still has significant hurdles to overcome to achieve this. Breaking down silos A more holistic approach to tackling FCRM is needed because without a centralized approach, it becomes almost impossible to join the dots in recognizing patterns of behavior associated with organized attacks. The challenges of risk and compliance integration Before getting down to the hard graft of technological integration, FIs need to ensure that their organizational structures are aligned. It is a common error to attempt to “patch up” perceived organizational gaps with technology and, in the long term, this will only serve to create yet more structural complexity. In today’s competitive environment, the emphasis of many FIs is on cost reduction and efficiency improvements. Against this backdrop, it can be difficult to prioritize the fight against financial crime and simultaneously meet the ever-increasing compliance requirements. At the same time, as with any business change process, risk and compliance integration is a complex undertaking. A key issue that FIs must address is the need to align all the various efforts taken to manage financial crime risk and compliance across the organization. For example, some aspects of FCRM, such as counter-measures for internal and external fraud, are directly driven by the business case and introduced to prevent direct losses or bad debt provisions. Other aspects, however, will be driven by regulation, such as AML, FATCA and sanctions monitoring, and by indirect losses in the form of regulatory fines and brand erosion. It is vital to ensure that these different motivations for change do not The high-profile punitive fines doled out to several global FIs by regulators and national governments in the past few years have underlined the importance of investing in this area, but there are some difficult barriers to overcome. According to the survey (Figure 8), only 12% of FIs currently have fully integrated FCRM processes based Figure 8: Current FCRM processes Which of the following options best describes your current FCRM processes? Fully integrated processes and systems based on a unified technology architecture and data model 12% Semi-integrated processes and systems with some level of alignment and data sharing, but not fully integrated 69% Well formulated and communicated processes that are totally separate with little or no integration 19% 0% 10% 20% 30% 40% 50% 60% 70% Source: Chartis financial crime global survey 22 © Copyright Chartis Research Ltd 2014 | All Rights Reserved lead to change processes being undertaken by isolated teams that are not working toward the aligned risk appetite of the firm. Ideally, these individual initiatives need to be managed as a portfolio with a vision for an integrated target operating model. At the same time, business transformations can create long-lasting misalignments in business practices and culture. In order to manage financial crime risk and compliance more effectively, firms must overcome this barrier by educating the workforce to use common methodologies when identifying and scoring risks, for instance, and to ensure that internal risk and compliance standards and taxonomies are aligned. This process is made more challenging in larger FIs, which are inherently complex. For example, many of today’s largest financial institutions have grown through mergers and acquisitions (M&A) at some stage, which often gives rise to silos where business units in the acquired firm are not sufficiently consolidated into the new organization because of difficulties in aligning mismatched products, services, and processes. Managing data When bringing together workflow, data and models into a common methodology, aligning analytics and workflows is essential, but FIs normally find that the vast bulk of the necessary work is in the data management. Furthermore, FIs have not historically been strong at documenting and developing a consistent IT architecture, meaning that M&A events have also led to overlapping and complex legacy systems in many cases. In terms of FCRM systems, it may be that specific systems are dedicated to individual areas, such as check fraud, credit card fraud, and so on. In many cases, these systems and their data will need to be realigned to establish a unified FCRM platform. A unified data platform that enables analysis of reliable and consistent information from across the organization will form the lynchpin of FCRM in future. This resonates with our survey respondents (Figure 9), 92% of whom cite the quality of available data as an important challenge to successful FCRM. Figure 9: Important challenges to successful FCRM What do you see as your organization’s most important challenges to successful FCRM? Access to internal data 45% 45% 11% In-house knowledge and expertise 46% 43% 9% Organizational culture and awareness of financial crime 49% Completeness of data recorded electronically 36% Detection of previously undetected fraud 27% Budgets 24% Investigative tools/solutions (including case management) 10% Important 14% 51% 20% 52% 30% 0% 13% 49% 32% Board level/senior management support Very important 38% 20% 30% 40% 20% 45% 19% 46% 19% 50% Somewhat important 60% 70% 80% 90% 100% Not important Source: Chartis financial crime global survey © Copyright Chartis Research Ltd 2014 | All Rights Reserved 23 The EY point of view: Managing data throughout the customer life cycle Effective financial crime risk controls are dependent on the data that is supplied to them – even the best control systems will be ineffective if the data provided is of poor quality. This is an issue that more and more organizations are identifying as a root cause to operational inefficiencies. There is a need for better data governance to be put in place, including data policies to define minimum standards and effective ongoing monitoring of these standards. In addition there is currently an increasing trend of organizations moving towards the use of a single data layer to supply data to all of their financial crime risk control systems, therefore ensuring a consistent set of data is used and reducing the number of feeds from source systems. Looking at data management across the customer life cycle helps identify where financial crime risks are introduced, controls required to mitigate those risks, and ultimately what key data elements need to be captured for those controls to be effective (Figure 10). Figure 10: The customer life cycle Example of data collection, financial crime controls and inherent risks at various stages in a bank account life cycle Apply Ongoing usage (iterative) Customer – Applica4on Bank -‐ Customer due diligence (CDD) Bank -‐ Conducts periodic review Bank -‐ Account provided Customer -‐ Change details Key Risk decision point I Input Customer -‐ Transac4ons Bank -‐ Block or Close account Bank -‐ Block or Close account END Data Bank – Applica4on denied § Customer and address iden4fica4on and verifica4on (ID&V) § Beneficial owner iden4fica4on § Inten4on and product choice § Ini4al verifica4on sources § Nega4ve news data § Behavioral data (e.g., transac4ons and counterpar4es) § Change to reference informa4on (e.g., account numbers, sort codes) § Changes to beneficial ownership, company structures, customer informa4on, address data, etc § New customer informa4on § New ID&V data requirements § § § § § Controls Bank – Applica4on denied Bank -‐ Block or close account Customer -‐ Account closure § Ini4al know your customer (KYC) check § Fraud check (e.g. impersona4on) § Credit score check (if needed) § Prohibited customers list § Knowledge base authen4ca4on (KBA) check § Customer risk assessment model § Credit score check (if needed) § Poli4cally exposed person (PEP) and sanc4ons screening § Customer due diligence procedures, including simplified and enhanced procedures when appropriate § Trigger (alerts) event-‐based assessment § Fraud and transac4on monitoring systems § Customer and payment screening system § Fraud (impersona4on) checks § Customer risk assessment model (CRAM) § PEP and sanc4ons screening § Periodic reviews (frequency determined by CRAM ra4ng) § Transac4on and fraud monitoring alerts § Reports to FIU and SARs § Financial intelligence units to coordinate risk-‐based exit decisions § Intelligence and informa4on sharing protocols § Exit list updates Risks Output Closure I Account closure data Suspicious ac4vity data Credit risk exposure data Fraudulent ac4vity data Associated evidence § Onboarding convicted fraudsters § Facilita4ng iden4ty the[ or criminal ac4vity § Establishing rela4ons with sanc4oned jurisdic4ons, individuals or en44es § Establishing rela4ons with PEPs outside of risk appe4te § Inappropriate AML risk ra4ng due to poor assessment § Failure to iden4fy beneficial ownership and ul4mate beneficial ownership § Failure to iden4fy source of funds or source of wealth § Facilita4ng payments to sanc4oned geographies or individuals § Overlooking suspicious trends in transac4ons due to wrong risk profile mapping § Failure to disclose suspicious ac4vity reports (SARs) § Fines/reputa4onal damage § Enabling fraud and cyber crime § Concealed true beneficial ownership § Fraudulent or withheld informa4on by customer § Fraud: Account closure by people other than real owner § Li4ga4on/legal risk § Conduct risk Source: EY Page 1 December 15, 2014 Executing the integration process [Presenta4on 4tle] The impetus for FIs to move toward integrated FCRM is readily apparent. The integration process that individual FIs follow, however, will vary in complexity and direction, depending upon multiple factors, such as size and organizational structure. Multi-national firms and those with multiple business lines will be facing particularly difficult challenges with respect to coordination and alignment across those business lines and borders. Despite this, one commonality is that a phased approach will be required by all – such a transformation cannot be achieved overnight. Another common challenge for most FIs is that they will probably begin with roughly eight or nine main silos related to FCRM: 24 AML, sanctions filtering, card fraud, ACH fraud, online fraud, employee fraud, trader surveillance, FATCA compliance and KYC, for example. Given that the concept of simultaneously unifying all financial crime systems and processes under a single umbrella is unrealistic, FIs must identify the areas where there is least resistance to change in terms of their systems and organizational structure. For most organizations, the alignment of fraud and AML systems and processes is a good place to start. As regulators become more restrictive in their approach, FIs are finding that they need to apply consistent investigation processes and controls to their fraud and AML assessments. Indeed, a number of FIs have already integrated their processes. © Copyright Chartis Research Ltd 2014 | All Rights Reserved Decisions on data As firms move toward integration, the success of the project will ultimately be determined by how effectively they can manage organizational data. We have outlined some of the different approaches and options that FIs may consider as they seek to integrate data management. 1. Data integration To turn data into practical information, business intelligence systems need to manage the integration of metadata. This process has a number of steps, which are given below: 1. E stablishment of the source to target data interface with extract and transformation logic conducted at the source. 2. I ntermediation with a central data-staging layer to centralize transformation logic. 3. D evelopment of messaging standards to allow sharing of information across networks and application-to-application connectivity. 4. I ntroduction of high performance infrastructure to speed up extraction of information and provide a central platform for fast search. 5. D eployment of data and analytics kernels to source platforms to pull data quickly through the enterprise, and speed up end-user decision-making. Many FIs have reacted to the ever-increasing volumes of data they are required to process by investing in large data warehouse projects. These data warehouses are often cumbersome and slow, however, with lengthy and laborious extract, load and transform (ETL) processes. We are seeing organizations adopt several different approaches to solve this problem. Some are moving to a “publish and subscribe” model, while others are converging regional standardized data hubs in an attempt to make data transfer faster and more efficient, while taking into account potential regional and crossborder data protection issues. Audits of data quality are also becoming increasingly common. • A base, physical layer – where data sources are integrated, providing basic quality checks, typecasting, and name formatting. • A business layer – where standardized methods of data description and modeling throughout the enterprise are applied to the metadata from the physical layer. • An application data layer – where data is transformed into an accessible format for data consumers, whether these are customers or business users. While the abstraction data layer system does not have the same speed and efficiency as an integrated data warehouse, the potential for quick implementation and therefore return on investment make it an attractive proposition, particularly for larger, complex organizations. Managing the integration process As with any business change process, it is important to create a structured roadmap at the outset that takes into account the organization’s current state, including any gaps, overlaps and efficiencies, and outlines the future state, such as shared capabilities, synergies and benefits. Broad executive-level ownership and visible support for change will be important too, including leaders representing a cross-section of the organization committing time, resources and subject matter expertise. Firms will also need to continue to run their existing systems in parallel with the creation of new, integrated systems in order to keep essential business processes running. For most large FIs, a change budget will be set aside, with a specific team set up to oversee the process, usually over a three- to five-year period. These teams will follow separate work streams, but their progress will be reviewed at group level to ensure their approach is aligned with the wider business. Careful construction of a roadmap for this process is critical, as the transformation process can and will change data sources behind applications and will affect their function. This balancing act of “run the bank” versus “change the bank” is a critical success factor. 2. Data alignment and abstraction One method for bringing data management systems together that does not involve breaking down silos is to use layered data abstraction processes that bridge across silos instead. An abstraction layered data management architecture includes: © Copyright Chartis Research Ltd 2014 | All Rights Reserved Expenditure It is obvious that the budget will strongly influence the approach that FIs are able to adopt as they move toward FCRM integration, in terms of how swiftly and how deeply the process goes. 25 Which one of the following best describes your organization’s/business unit’s expenditure on FCRM technology for 2014–15? Increase by more than 50% 15% 23% Increase by more than 25% 25% Increase by more than 10% Expenditure to remain the same as 2013 28% Decrease by more than 10% 6% Decrease by more than 25% 2% Decrease by more than 50% 2% 0% 5% 10% 15% 20% 25% 30% Source: Chartis financial crime global survey Our survey results (Figure 11) reflect both the urgency of the issue and the potential of integrated FCRM to help reduce future costs, given that the majority of FIs intend to increase their expenditure on financial crime risk and compliance management technology, despite the current emphasis on cost cutting in the sector. be a low volume of very high-value “change the bank” projects by tier 1 FIs, involving significant investment, and possibly the creation of financial intelligence units. The greater part of the spending increase within the sector is likely to be tactical expenditure, focused on extending existing point solutions to conduct enhanced analytics, further compliance reporting, or buying new point solutions. At the same time, there is also likely to A convergence trend in financial crime looks at common capabilities of reporting, case management, work flow, analytics and data across all financial crime risks to provide better information and intelligence sharing and drive efficiencies in risk management (Figure 12). Reference architecture A financial crime reference architecture 3 Figure 12: Example target architecture for integrated financial crime risk and compliance management Anti-money laundering Sanctions screening Anti-fraud Anti-bribery and corruption Example capabilities Metrics and reporting • KPIs / KRIs • Operational MI • Visualization • Data aggregation • Model performance • Risk assessment Investigation management and financial intelligence unit • Holistic customer risk • Cross function investigation • Intelligence sharing Case management • Document management • Work flow • Consolidation & scoring • Case analytics Risk-specific Alerts eme for ons on the ese two are 1) dark ackgrounds Figure 11: FCRM expenditure KYC Name screening Internal fraud Gifts and entertainment Customer risk assessment Payment filtering External fraud Hiring practices Unauthorized trading Whistle blowing Transaction monitoring Analytics • Holistic data view • Trend analysis • Model optimization • Predictive analytics • Model management • Peer analysis Data management • Data policy • Data governance • Data quality • Data validation • Data interfaces • List management Data storage • Internal data • External data • Relational data • Unstructured data • SLA management Key: 26 Page 0 Financial crime risks December 11, 2014 DB Data sources Common functions [Presentation title] Source: EY © Copyright Chartis Research Ltd 2014 | All Rights Reserved Conclusion Today’s FIs are exposed to a wider range of risks than ever before, as they continually implement new technologies and open up new channels to customers in a bid to remain competitive. Meanwhile, regulators continue to pressurize firms to devote greater resources to assessing and reporting on financial crime and conduct risk. Significant operational savings can be gained with centralized management of financial crime. The convergence of analytics, workflow and data management will increase transparency, increase agility and decrease duplication of effort when analyzing financial crime across business lines and international borders, creating complete views of customers across the entire transactional life cycle. Those FIs that fail to face up to these risks and demands will be at a distinct disadvantage in future as customers, investors and shareholders all begin to attach greater value to the security and integrity of financial institutions, as well as reputation and brand protection. What will be needed, therefore, is an integrated approach to the management of financial crime risk and compliance that will help them to better detect criminal attacks and fraud and avoid regulatory fines, and ultimately reduce their costs as a result of operational efficiency savings and tighter security. About the EY contributors Patrick Craig EMEIA Compliance IT Advisory Leader Patrick has been with EY for more than six years and runs the EMEIA Compliance IT Advisory practice. This practice provides IT strategy, transformation, optimization and analytics services on monitoring, surveillance, investigation and reporting platforms to global financial services institutions to help manage risk. Prior to this role, he was responsible for building EY’s compliance IT advisory capability in New York. Previous to working at EY Patrick was head of services for Searchspace, an AML technology company that is now part of the Nice Actimize corporation. Patrick gives lectures at the International Compliance Association on the topic of compliance technology and speaks at international conferences on AML and financial crime trends. Scott Samme EMEIA Compliance IT Advisory Director Scott has been advising and delivering technology solutions related to financial crime prevention for more than nine years. He has experience across different industries, including banking, insurance, national intelligence and policing, addressing Fraud, AML, Sanctions, organized crime and intelligence in different geographies. Previous to working at EY, Scott was the head of services globally for BAE Detica NetReveal. The views reflected in this article are the views of the author and do not necessarily reflect the views of the global EY organization or its member firms. © Copyright Chartis Research Ltd 2014 | All Rights Reserved 27 RiskTech100® rankings 2015 Rank 2015 Rank 2014 1= Company HQ Total score Functionality Core technology Organizational strength Customer satisfaction Market presence Innovation 1 IBM US 68.7% 82% 75% 66% 52% 68% 69% 1= 2 SAS US 68.7% 83% 80% 60% 53% 67% 69% 3 3 SunGard US 66.8% 78% 68% 65% 58% 68% 64% 4 4 Wolters Kluwer FS US 64.3% 68% 63% 67% 64% 65% 59% 5 7 MSCI US 64.3% 66% 60% 69% 60% 65% 66% 6 6 Oracle US 64.2% 73% 75% 64% 53% 57% 63% 7 5 Moody’s Analytics US 63.2% 64% 63% 68% 60% 63% 61% 8 11 Thomson Reuters US 62.8% 65% 64% 63% 58% 66% 61% 9 8 Misys UK 62.5% 70% 66% 64% 53% 60% 62% 10 9 OpenLink US 62.5% 63% 64% 66% 58% 61% 63% 11 15 SAP Germany 62.3% 65% 71% 62% 54% 60% 62% 12 13 Murex France 62.3% 65% 64% 63% 60% 61% 61% 13 14 BAE Systems UK 62.0% 64% 64% 62% 56% 61% 65% 14 10 Fiserv US 61.5% 66% 61% 64% 63% 60% 55% 15 12 NICE Actimize US 61.3% 62% 61% 65% 52% 64% 64% 16 17 FICO US 61.2% 63% 58% 60% 58% 63% 65% 17 18 Markit UK 60.5% 68% 64% 61% 55% 56% 59% 18 20 MetricStream US 59.8% 59% 59% 63% 55% 60% 63% 19 26 Numerix US 59.3% 53% 49% 61% 68% 63% 62% 20 19 NASDAQ OMX Bwise US 58.7% 64% 56% 57% 55% 60% 60% 21 22 FINCAD Canada 58.5% 58% 54% 55% 65% 61% 58% 22 16 Calypso US 58.0% 62% 59% 57% 53% 59% 58% 23 24 Wynyard UK 57.3% 60% 56% 57% 58% 52% 61% 24 23 Imagine US 57.2% 60% 58% 55% 59% 51% 60% 25 25 QRM US 57.0% 60% 52% 55% 54% 60% 61% 26 34 EMC RSA US 56.5% 55% 54% 57% 56% 60% 57% 27 31 Quantifi US 55.8% 55% 58% 58% 56% 51% 57% 28 35 Reed Elsevier UK 55.5% 60% 50% 52% 57% 64% 50% 29 29 Lombard Risk UK 55.3% 56% 56% 57% 57% 54% 52% 30 30 Allegro US 55.2% 56% 55% 58% 52% 56% 54% 31 32 FIS US 55.0% 59% 55% 53% 54% 57% 52% 32 27 ION Trading Ireland 54.7% 60% 57% 56% 48% 57% 50% 28 © Copyright Chartis Research Ltd 2014 | All Rights Reserved Rank 2015 Rank 2014 33 Company HQ Total score Functionality Core technology Organizational strength Customer satisfaction Market presence Innovation 33 ACI Worldwide US 54.5% 58% 51% 55% 55% 55% 53% 34 28 Fernbach Lux 54.2% 59% 58% 47% 56% 48% 57% 35 42 Intellinx Israel 53.8% 53% 56% 52% 60% 50% 52% 36 36 Axiom SL US 53.8% 56% 59% 49% 64% 47% 48% 37 37 SS&C US 53.8% 50% 50% 60% 57% 50% 56% 38 21 Experian UK 53.7% 49% 48% 57% 57% 62% 49% 39 38 EastNets UAE 53.3% 53% 50% 52% 58% 54% 53% 40 48 Prometeia Italy 53.0% 55% 50% 50% 68% 40% 55% 41 41 Verafin Canada 52.8% 56% 50% 50% 66% 39% 56% 42 46 Quartet FS UK 52.3% 41% 57% 51% 60% 46% 59% 43 56 ACL Canada 52.2% 55% 50% 54% 57% 49% 48% 44 39 Palantir US 52.0% 50% 54% 48% 53% 47% 60% 45 40 MEGA France 51.8% 56% 52% 52% 48% 50% 53% 46 44 RiskVal US 51.5% 52% 52% 52% 54% 47% 52% 47 47 Protiviti US 51.2% 45% 45% 57% 55% 55% 50% 48 – Broadridge US 51.0% 56% 53% 54% 50% 50% 43% 49 – Bloomberg US 50.7% 40% 42% 55% 55% 60% 52% 50 52 Trintech US 50.3% 48% 48% 51% 51% 55% 49% 51 55 Simcorp Denmark 50.3% 46% 47% 54% 50% 50% 55% 52 74 Polaris FT India 50.3% 58% 56% 51% 52% 35% 50% 53 45 FinAnalytica US 50.3% 50% 45% 45% 55% 45% 62% 54 51 Conning US 50.3% 58% 50% 49% 52% 43% 50% 55 50 Jack Henry US 49.8% 53% 50% 51% 50% 49% 46% 56 53 DST Global US 49.8% 47% 47% 51% 52% 51% 51% 57 59 Brady UK 49.8% 49% 48% 53% 51% 50% 48% 58 64 Davis + Henderson Canada 49.7% 49% 50% 56% 56% 46% 41% 59 58 Empowered Systems UK 49.7% 49% 57% 38% 66% 28% 60% 60 61 Xenomorph UK 48.8% 47% 53% 41% 55% 37% 60% 61 60 BPS Resolver Canada 48.5% 45% 52% 49% 50% 40% 55% 62 49 TMX Group Canada 48.5% 53% 58% 47% 48% 30% 55% 63 57 Towers Watson US 48.3% 44% 39% 49% 55% 56% 47% 64 63 StatPro UK 48.2% 45% 45% 51% 58% 42% 48% 65 65 UBS Delta UK 47.2% 45% 44% 48% 50% 42% 54% 66 90 Safe Banking Systems US 46.8% 40% 50% 48% 58% 37% 48% 67 67 AIM Software Austria 46.0% 35% 53% 50% 50% 45% 43% 68 69 Savvysoft US 45.8% 45% 45% 45% 53% 39% 48% 69 – Fenergo Ireland 45.8% 55% 50% 50% 50% 30% 40% © Copyright Chartis Research Ltd 2014 | All Rights Reserved 29 Rank 2015 Rank 2014 70 62 Enablon 71 71 BlackRock Solutions 72 66 73 HQ Total score Functionality Core technology Organizational strength Customer satisfaction Market presence Innovation France 45.7% 42% 42% 50% 50% 50% 40% US 45.5% 42% 40% 50% 50% 42% 49% eFront France 44.7% 48% 48% 48% 48% 35% 41% 76 Temenos Switzerland 44.5% 40% 49% 50% 49% 40% 39% 74 79 SecondFloor Netherlands 44.3% 40% 50% 45% 51% 30% 50% 75 80 Software AG Germany 44.2% 44% 41% 46% 50% 45% 39% 76 82 SAI Global Australia 44.0% 46% 41% 45% 50% 47% 35% 77 78 Riskdata France 44.0% 40% 40% 46% 50% 43% 45% 78 73 Cura Technologies India 44.0% 40% 40% 47% 55% 42% 40% 79 84 3i InfoTech India 44.0% 48% 44% 40% 46% 40% 46% 80 86 ClusterSeven UK 43.8% 41% 43% 47% 50% 37% 45% 81 85 Patsystems UK 43.5% 36% 39% 47% 52% 38% 49% 82 89 Investor Analytics US 43.5% 42% 39% 39% 54% 40% 47% 83 68 Entrust US 43.5% 35% 38% 45% 48% 45% 50% 84 83 Reval US 43.3% 44% 40% 46% 46% 40% 44% 85 87 QUMAS Ireland 42.8% 45% 40% 45% 50% 35% 42% 86 81 Wilshire US 42.3% 38% 33% 46% 51% 40% 46% 87 – India 41.8% 52% 45% 35% 45% 33% 41% 88 95 Rockall Technologies Ireland 41.3% 30% 47% 42% 54% 30% 45% 89 77 Tonbeller Germany 41.2% 60% 55% 46% 45% 38% 3% 90 – OpenGamma UK 41.0% 37% 60% 34% 45% 30% 40% 91 94 Infogix US 41.0% 34% 35% 47% 50% 40% 40% 92 75 Linedata France 40.8% 38% 40% 45% 49% 30% 43% 93 91 Neural Technologies UK 40.5% 40% 45% 43% 42% 32% 41% 94 99 Chase Cooper UK 40.5% 40% 37% 40% 47% 35% 44% 95 – NCR Alaric US 40.5% 46% 44% 30% 50% 25% 48% 96 96 FactSet US 40.3% 27% 30% 52% 50% 41% 42% 97 72 Sword Group UK 40.2% 38% 40% 40% 50% 40% 33% 98 92 Teradata US 39.8% 20% 49% 42% 53% 38% 37% 99 93 Vadis Belgium 39.8% 55% 45% 27% 37% 23% 52% 100 – India 38.3% 50% 52% 28% 35% 22% 43% 30 Company CustomerXPs iDetect © Copyright Chartis Research Ltd 2014 | All Rights Reserved Category winners Chartis categories: Functionality: IBM • Core technology: SAS • MSCI • Organizational strength: Prometeia • Customer satisfaction: IBM • Market presence: Innovation: SAS • Vertical: Banking:SAS • Murex • Capital markets – sell-side: Capital markets – buy-side: MSCI • Insurance:SAS • Corporations:OpenLink • Geographical sectors: Americas: FICO • Europe: IBM • Misys • Asia Pacific: EastNets • Middle-East & Africa: Horizontal: Credit risk:Moody’s Analytics • Market risk:IBM • QRM • Liquidity risk & ALM: • Energy & Commodity trading risk: OpenLink Financial crime:SAS • MetricStream • Operational risk & GRC: Regulatory reporting: Wolters Kluwer • © Copyright Chartis Research Ltd 2014 | All Rights Reserved 31 Appendix A: Research methodology The rankings in Chartis’s RiskTech100® report reflect our analysts’ considered opinions, along with research into market trends, participants, expenditure patterns and best practices. The data collection for this study started in January 2014, and the analysis has been validated through several phases of independent verification. This study is the most comprehensive of its kind and is a core element of Chartis’s annual research cycle. Figure 13: RiskTech100® research methodology • Performed market sweep of 32,000 risk technology buyers globally (80% financial services, 20% non-financial services) • Collated 1217 completed questionnaires from risk technology buyers and end-users • Collected data on expenditure priorities and vendor preferences • Collated 318 completed questionnaires from risk technology vendors • Conducted 118 interviews and product briefings with risk technology vendors • Conducted 115 interviews with risk technology buyers to validate survey findings • Conducted 55 interviews with independent consultants and systems integrators specializing in risk technology • Applied RiskTech100® assessment criteria to filter top 150 vendors • Reviewed data with 20 independent consultants and 110 risk technology buyers • Interviewed 35 ex-employees of top 25 risk technology vendors to validate findings • Undertook final data validation with 108 vendors – received 80 completed questionnaires and 50 vendor briefings • Concluded final top-100 rankings, category winners and report write-up 32 © Copyright Chartis Research Ltd 2014 | All Rights Reserved Appendix B: How to read the RiskTech100® rankings The RiskTech100® assessment criteria comprises six equally weighted categories: •Functionality • Core technology • Organizational strength • Customer satisfaction • Market presence •Innovation Within each category, a number of sub-categories are weighted according to the level of importance that end-users and system integrators attach to these aspects of risk technology provision. Table 1: RiskTech100® assessment criteria (Sub-category weightings are shown in brackets) Functionality • Depth of functionality (0.5) – The level of sophistication and detailed features in the software product. Aspects assessed include: innovative functionality, practical relevance of features, user-friendliness, flexibility and embedded intellectual property. High scores are given to those firms that achieved an appropriate balance between sophistication and user-friendliness. In addition, functionality linking risk to performance is given a positive score. • Breadth of functionality (0.5) – The spectrum of risks covered as part of an enterprise risk management solution. The risk spectrum under consideration includes treasury risk management, trading risk, market risk, credit risk, operational risk, energy risk, business/strategic risk, actuarial risk, asset-liability risk, financial crime and compliance. Functionality within and integration between front-office (customer-facing) and middleback office (compliance, supervisory and governance) risk management systems are also considered. High scores are given to those firms achieving (or approaching) integrated risk management – breaking the silos between different risk management functions. Core technology • Data management (0.35) – The ability of enterprise risk management systems to interact with other systems and handle large volumes of data. Data quality is often cited as a critical success factor, and ease of data access, data integration, data storage and data movement capabilities are all important factors. • Risk analytics (0.35) – The computational power of the core system, the ability to analyze large amounts of data in a timely manner (e.g., real-time analytics), and the ability to improve analytical performance are all important factors. • Reporting (0.30) – The ability to surface information in a timely manner. The quality and flexibility of reporting tools and ease of use are important for all risk management systems. © Copyright Chartis Research Ltd 2014 | All Rights Reserved 33 Organizational strength • Sales execution (0.25) – The size and quality of sales force, sales distribution channels, global presence, focus on risk management, messaging and positioning are all important factors. • Financial strength /stability (0.25) – Revenue growth, profitability, sustainability and financial backing. (The ratio of license to consulting revenues is key to business scalability.) • Implementation and support (0.25) – Important factors include size and quality of implementation team, approach to software implementation, post-sales support and training. • Thought-leadership (0.25) – Business insight/understanding, new thinking, formulation and execution of best practices, and intellectual rigor are considered important by endusers. Customer satisfaction • Value for money (0.4) – Price to functionality ratio, total cost of ownership versus license price. • After sales service and support (0.4) – Important factors include ease of software implementation, level of support and quality of training. • Product updates (0.2) – End-users consider frequency of updates, keeping pace with bestpractice and regulatory changes to be important. Market presence • Market penetration (0.4) – Number of customers in chosen markets, rate of growth relative to sector growth rate. • Market potential (0.3) – Brand awareness, reputation, and the ability to leverage current market position to expand horizontally (with new offerings) or vertically (into new sectors). • Momentum (0.3) – Performance over the last 12 months, including financial performance, new product releases, quantity and quality of contract wins and market expansion moves. Innovation • New product development (0.4) – New ideas, functionality, and technologies to improve risk management for target customers. Chartis assesses new product development, not in absolute terms, but in relation to the vendor’s closest competitors. • Exploitation (0.4) – Developing new products is only the first step in generating success. Speed to market, positioning of new products and translation to incremental revenues are critical success factors. • New business models (0.2) – Innovation is not limited to the product dimension. Some risk technology vendors are also actively working toward new business models for generating profitable growth. 34 © Copyright Chartis Research Ltd 2014 | All Rights Reserved How to use research and services from Chartis In addition to our flagship industry reports, Chartis also offers customized information and consulting services. Our in-depth knowledge of the risk technology market and best-practice allows us to provide high quality and costeffective advice to our clients. If you found this report informative and useful, you may be interested in the following services from Chartis. For risk technology buyers If you are purchasing risk management software, Chartis’s vendor selection service is designed to help you find the most appropriate risk technology solution for your needs. We monitor the market to identify the strengths and weaknesses of the different risk technology solutions, and track the post-sales performance of companies selling and implementing these systems. Our market intelligence includes key decision criteria such as TCO (total cost of ownership) comparisons and customer satisfaction ratings. Our research and advisory services cover a range of risk and compliance management topics such as credit risk, market risk, operational risk, GRC, financial crime, liquidity risk, asset and liability management, collateral management, regulatory compliance, risk data aggregation, risk analytics and risk BI. Our vendor selection services include: • Buy vs. build decision support • Business and functional requirements gathering • Identification of suitable risk and compliance implementation partners • Review of vendor proposals • Assessment of vendor presentations and demonstrations • Definition and execution of proof-of-concept (PoC) projects • Due diligence activities For risk technology vendors Strategy Chartis can provide specific strategy advice for risk technology vendors and innovators, with a special focus on growth strategy, product direction, go-to-market plans, and more. Some of our specific offerings include: • Market analysis, including market segmentation, market demands, buyer needs, and competitive forces • Strategy sessions focused on aligning product and company direction based upon analyst data, research, and market intelligence • Advice on go-to-market positioning, messaging, and lead generation • Advice on pricing strategy, alliance strategy, and licensing/pricing models © Copyright Chartis Research Ltd 2014 | All Rights Reserved 35 Thought leadership Risk technology vendors can also engage Chartis to provide thought leadership on industry trends in the form of in-person speeches and webinars, as well as custom research and thought-leadership reports. Target audiences and objectives range from internal teams to customer and user conferences. Some recent examples include: • Participation on a “Panel of Experts” at global user conference for leading ERM (Enterprise Risk Management) software vendor • Custom research and thought-leadership paper on Basel 3 and implications for risk technology • Webinar on financial crime risk management • Internal education of sales team on key regulatory and business trends and engaging C-level decision makers Visit www.chartis-research.com for more information. 36 © Copyright Chartis Research Ltd 2014 | All Rights Reserved Further Chartis reading • Liquidity Risk Management Systems 2014 • Conduct Risk Management Systems 2014 • Risk Data Management & BI at Bank of Montreal • Solvency II Technology Solutions 2014 • Enterprise GRC Solutions 2014 • The Evolution of Crime Analytics • Competing on Risk and Compliance: A New Path for Emerging Market Banks • Model Risk Management Solutions 2014 • Operational Risk Management Systems for 2014 • Basel 3 Technology Solutions 2013 • Aligning Risk And Finance In Banks: From Theory to Practice • Enterprise Fraud Solutions 2013 • Anti-Money Laundering Solutions 2013 For all of these reports see: www.chartis-research.com © Copyright Chartis Research Ltd 2014 | All Rights Reserved 37
© Copyright 2026 Paperzz