Issue Report
F as in Fat:
2012
How Obesity
Threatens
America’s Future
September 2012
Preventing Epidemics.
Protecting People.
ACKNOWLEDGEMENTS
Trust for America’s Health is a non-profit, non-partisan organization dedicated to saving lives by
protecting the health of every community and working to make disease prevention a national priority.
The Robert Wood Johnson Foundation focuses on the pressing health and health care issues facing our country. As the nation's largest philanthropy devoted exclusively to improving the health and health care of all Americans, the Foundation works with a diverse group of organizations and individuals to identify solutions and achieve comprehensive, meaningful and timely change. For 40 years the Foundation has brought
experience, commitment, and a rigorous, balanced approach to the problems that affect the health and health care of those it serves. When it
comes to helping Americans lead healthier lives and get the care they need, the Foundation expects to make a difference in your lifetime. For
more information, visit www.rwjf.org. Follow the Foundation on Twitter www.rwjf.org/twitter or Facebook www.rwjf.org/facebook.
This report was supported by the Robert Wood Johnson Foundation.
TFAH BOARD OF DIRECTORS
Gail Christopher, DN
President of the Board, TFAH
Vice President—Program Strategy
WK Kellogg Foundation
Cynthia M. Harris, PhD, DABT
Vice President of the Board, TFAH
Director and Professor
Institute of Public Health, Florida
A&M University
Robert T. Harris, MD
Treasurer of the Board, TFAH
Former Chief Medical Officer and Senior
Vice President for Healthcare
BlueCross BlueShield of North Carolina
David Fleming, MD
Director of Public Health
Seattle King County, Washington
John Gates, JD
Founder, Operator and Manager
Nashoba Brook Bakery
Alonzo Plough, MA, MPH, PhD
Director, Emergency Preparedness and Response
Program
Los Angeles County Department of
Public Health
Theodore Spencer
Secretary of the Board, TFAH
Senior Advocate, Climate Center
Natural Resources Defense Council
Arthur Garson, Jr., MD, MPH
Director, Center for Health Policy, University
Professor,
And Professor of Public Health Services
University of Virginia
Eduardo Sanchez, MD, MPH
Chief Medical Officer
Blue Cross Blue Shield of Texas
REPORT AUTHORS
CONTRIBUTORS
Jeffrey Levi, PhD.
Executive Director
Trust for America’s Health and
Associate Professor in the Department of Health
Policy
The George Washington University
School of Public Health and Health Services
Kathryn Thomas, MJ
Senior Communications Officer
Robert Wood Johnson Foundation
Elizabeth Goodman, MS
Senior Associate
Burness Communications
Laura M. Segal, MA
Director of Public Affairs
Trust for America’s Health
Rebecca St. Laurent, JD
Health Policy Research Manager
Trust for America’s Health
Albert Lang
Communications Manager
Trust for America’s Health
Jack Rayburn
Government Relations Representative
Trust for America’s Health
Laura C. Leviton, PhD.
Special Advisor for Evaluation
Robert Wood Johnson Foundation
Tina J. Kauh, MS, PhD.
Research and Evaluation Program Officer
Robert Wood Johnson Foundation
Chuck Alexander, MA
Senior Vice President, and Director, Public
Health Team
Burness Communications
Elizabeth Wenk, MA
Vice President
Burness Communications
Jane Silver, MPH
President
Irene Diamond Fund
Adam Zimmerman
Associate
Burness Communications
PEER REVIEWERS
Scott Kahn, MD, MPH
Co-Director
George Washington University Weight
Management Center;
and Faculty
Department of Health Policy of the
George Washington University School of
Public Health and Health Services
Monica Vinluan, JD
Project Director, Healthier Communities Initiatives
The Y
Introduction
The following is a letter from Risa Lavizzo-Mourey, MD, MBA, president and CEO of the Robert Wood
Johnson Foundation, and Jeff Levi, PhD, executive director of Trust for America’s Health.
T
he future health of the United States is at a crossroads, due in large part to
the obesity epidemic. Each year, the Trust for America’s Health (TFAH)
and the Robert Wood Johnson Foundation (RWJF) issue F as in Fat: How Obesity
Threatens America’s Future to examine strategies for addressing the obesity crisis. In
this ninth edition of the report, TFAH and RWJF also commissioned a new study to
look at how obesity could impact the future health and wealth of our nation.
This new analysis provides a picture of two possible futures for the health of Americans over
the next 20 years:
n If obesity rates continue on their current trajectory, it’s estimated that:
s Obesity rates for adults could reach or exceed 44 percent in every state and exceed
60 percent in 13 states;
s The number of new cases of type 2 diabetes, coronary heart disease and stroke, hypertension and arthritis could increase 10
times between 2010 and 2020 — and then
double again by 2030; and
s Obesity-related health care costs could increase by more than 10 percent in 43 states
and by more than 20 percent in nine states.
n But, if we could lower obesity trends by reducing the average adult BMI (body mass index)
by only 5 percent in each state, we could
spare millions of Americans from serious
health problems and save billions of dollars
in health spending — between 6.5 percent
and 7.8 percent in costs in almost every state.1
As this year’s report details, we have seen important inroads made toward preventing and reducing obesity around the country, especially among
children. We know that real changes are possible.
But we also have found that efforts will need to
be intensified if we are going to achieve a major
reduction in obesity and related health problems.
The promising results we see in some cities and
states pave the way for more intensive efforts.
Multiple studies and reports have demonstrated
that the cities and states that took an early and
comprehensive approach to preventing obesity
have demonstrated progress toward reversing
the epidemic. For instance, in California, over-
all rates of overweight and obesity among fifth-,
seventh- and ninth-graders decreased by 1.1 percent from 2005 to 2010, and, in New York City,
obesity in grades K-8 decreased 5.5 percent from
2006-07 to 2010-11.2, 3 In Mississippi, combined
rates of overweight and obesity among all public elementary school students dropped from 43
percent in 2005 to 37.3 percent in 2011.4
While these cases showed that pockets of progress are possible, they also showed that children who face the biggest obstacles to healthy
choices and are at greatest risk for obesity, such
as children in lower-income families and Black
and Hispanic children, did not share equally in
progress. That’s why a study released just this
month tells the best story of all.
New data from Philadelphia show the city reduced obesity rates in ways that also helped to
close the disparities gap. In addition to achieving an overall decline in obesity rates among
public school students (from 21.5 percent of all
public school students in the 2006-2007 school
year to 20.5 percent in the 2009-2010 school
year), the city made the largest improvements
among Black male and Hispanic female students. For Black male students, rates declined
from 20.66 percent to 19.08 percent, and rates
for Hispanic female students declined from
22.26 percent to 20.61 percent within the same
timeframe. We need to learn from the City of
Brotherly Love and spread the actions and policies that work so all children can enjoy the benefits of better health.
These pockets of progress around the country
are showing the positive impact that many policies and programs are having — but they need
to be taken to scale. Fortunately, we know a lot
about what it will take to bend the obesity curve
in America.
3
n Stepping up the investment in evidence-based,
locally implemented prevention programs
could help achieve results. The U.S. Centers
for Disease Control and Prevention (CDC),
The New York Academy of Medicine (NYAM)
and others have identified a range of programs
that have proved effective in reducing obesity
and obesity-related disease levels by 5 percent
or — in some cases — more. For example,
a study of the Diabetes Prevention Program
found that randomly selected participants
reduced their diabetes risk by 16 percent for
every kilogram (a little more than 2 pounds,
3 ounces) of weight they lost over a follow-up
period of approximately three years. Another
study reported the effects of an educational
and mass media campaign developed by the
Heart Health Program in Pawtucket, R.I.
Five years into the intervention, the risks for
cardiovascular disease and coronary heart
disease also had decreased by 16 percent for
randomly selected participants.5
n Recalibrating our goals could help us dramatically slow the national growth in obesity
rates by preventing adults from gaining additional weight (including individuals who are
currently obese, overweight and at a healthy
weight), and by preventing kids from becom-
ing overweight or obese in the first place.
The research shows that a strategy of primary
prevention that focuses on avoiding further
gain can help improve health and reduce
costs, and is a realistic and achievable goal.
For example, in 2010, researchers reviewed
36 studies of corporate wellness programs,
including those with successful weight-loss elements, and calculated that employers saved
an average of $6 for every $1 spent. Researchers also noted that other benefits of such programs likely would include improved health.6
F as in Fat is an annual reminder of how critical
it is to provide everyone living in our country,
particularly our nation’s children, with the opportunity to be as healthy as they can be. The
forecasting study in this year’s report demonstrates what’s at stake.
If we take action, the number of Americans, particularly children, we could spare from type 2
diabetes, heart disease, cancer and other health
problems is striking, and the savings in health
care costs and increased productivity would
have a real and positive impact on the economy.
Investing in prevention today means a healthier, more productive and brighter future for our
country and our children.
Background on Obesity and Body Mass Index (BMI)
4
Currently, more than 35 percent of adults are
obese.7 Obesity is defined as an excessively high
amount of body fat or adipose tissue in relation
to lean tissue. An adult is considered obese if his
or her body mass index (BMI) is 30 or higher.
The study also forecasts what would happen
if average BMI in the state was reduced by 5
percent, which could translate to a 9 percent to
14 percent reduction in the states’ obesity rates
by 2030 depending on the state.
The new modeling study in this year’s
report projects what obesity rates and the
consequences for disease rates and health
care costs could be if the average state BMI
continued to grow based on current trends for
each state’s population over the next 20 years.
For example, on an individual level, reducing the
BMI of an average adult by 1 percent would be
equivalent to a weight loss of approximately 2.2
pounds.8 According to the CDC, the average
American male over age 20 weighs 194.7
pounds and the average American woman over
age 20 weighs 164.7 pounds.9
Childhood Obesity: What’s At Stake
Childhood obesity rates have climbed dramatically in the past 30 years. In 1980, the obesity
rate for children ages 6 to 11 was 6.5 percent.
By 2008, the rate grew to 19.6 percent. And,
in 1980, 5 percent of teens ages 12 to 19 were
obese. That rate climbed to 17 percent (approximately 12.5 million children and teens) by 2010.10
This change is having a major impact on the
health of children and youths. If we don’t reverse
the epidemic, the current generation of young
people could be the first in U.S. history to live
sicker and die younger than their parents’ generation. Nearly one-third of children and teens are
currently obese or overweight, which is putting
them at higher risks for developing a range of diseases and developing them earlier in life.11
Children who are obese are more than twice
as likely to die before the age of 55 as children
whose BMI is in the healthy range.12 Around
70 percent of obese youths have at least one
additional risk factor for cardiovascular disease,
such as elevated total cholesterol, triglycerides,
insulin or blood pressure.13 Overweight and
obese children and teens also are at higher risk
for other health conditions, including asthma
and sleep-disordered breathing.14, 15 Children
who are obese after the age of 6 are 50 percent
more likely to be obese as adults, and among
overweight tweens and teens ages 10 to 15, 80
percent were obese at age 25.16, 17
Being obese or overweight also can have a major
social and emotional impact on children and
youths. For instance, studies have found that
overweight and obese children and teens face a
higher risk for more severe and frequent bullying, are rejected by their peers more often, are
chosen less as friends and are generally not as
well-liked as healthy-weight children. Studies also
have found that weight-based teasing is related to
increased susceptibility to depression.18, 19, 20
Reducing and preventing childhood obesity is
critical to improving the future health of the
country, and consequently would help to lower
health care costs and improve productivity.
What’s more, research supports the concept
that focusing on children and getting them on
a healthy path early in life is one of the areas
where the greatest successes can be achieved.
For instance, a recent study from the American
Journal of Preventive Medicine found that eliminating just 41 calories a day per person could halt rising body weight trends in children and teens ages
2 to 19, and eliminating 161 calories per day per
person could reduce childhood obesity to 5 percent by 2020.21 Researchers have created a tool
to help estimate the impact of nutrition or physical activity interventions on specific populations.
The tool is available at http://caloriccalculator.org.
Programs around the country are helping to change
our culture to encourage healthier nutrition and increased physical activity. Some areas where there
have been concerted efforts to prevent and reduce
childhood obesity are demonstrating promising
results. Initiatives ranging from Let’s Move to the
Alliance for a Healthier Generation to the Y are all
having an impact and leading to positive change.
Reversing the childhood obesity crisis is at the
core of the future health and wealth of the
country. The evidence shows that the goal is
achievable, but only if there is a sufficient investment in effective programs and policies.
5
F as in Fat 2012 — CONTENTS
Section 1:Obesity Rates and Trends. . . . . . . . . . . . . . . . . . . . . . . . . . . . . . . . . 9
A. Adult obesity and overweight rates . . . . . . . . . . . . . . . . . . . . . . . . . . . . . . . . . . . . . . . 9
B. Childhood and youth obesity and overweight rates . . . . . . . . . . . . . . . . . . . . . . . . . . 17
Section 2:Two Futures for America’s Health. . . . . . . . . . . . . . . . . . . . . . . . . 23
A. Key Findings . . . . . . . . . . . . . . . . . . . . . . . . . . . . . . . . . . . . . . . . . . . . . . . . . . . 25
B. Five Top Obesity-Related Health Issues . . . . . . . . . . . . . . . . . . . . . . . . . . . . . 33
1. Type 2 Diabetes and Obesity . . . . . . . . . . . . . . . . . . . . . . . . . . . . . . . . . . . . . . . . . . . 33
2. Coronary Heart Disease and Stroke and Obesity. . . . . . . . . . . . . . . . . . . . . . . . . . . . 36
3. Hypertension and Obesity. . . . . . . . . . . . . . . . . . . . . . . . . . . . . . . . . . . . . . . . . . . . . . 38
4. Arthritis and Obesity. . . . . . . . . . . . . . . . . . . . . . . . . . . . . . . . . . . . . . . . . . . . . . . . . . 40
5. Obesity-Related Cancer and Obesity . . . . . . . . . . . . . . . . . . . . . . . . . . . . . . . . . . . . . 42
C. Some Additional Health and Obesity Issues. . . . . . . . . . . . . . . . . . . . . . . . . . 45
1. Maternal Health and Obesity. . . . . . . . . . . . . . . . . . . . . . . . . . . . . . . . . . . . . . . . . . . . 45
2. Breastfeeding and Obesity Prevention. . . . . . . . . . . . . . . . . . . . . . . . . . . . . . . . . . . . . 46
3. Mental Health, Neurological Conditions and Obesity. . . . . . . . . . . . . . . . . . . . . . . . . 48
4. Kidney Disease and Obesity. . . . . . . . . . . . . . . . . . . . . . . . . . . . . . . . . . . . . . . . . . . . . 49
5. Liver Disease and Obesity. . . . . . . . . . . . . . . . . . . . . . . . . . . . . . . . . . . . . . . . . . . . . . 49
6. HIV/AIDS and Obesity. . . . . . . . . . . . . . . . . . . . . . . . . . . . . . . . . . . . . . . . . . . . . . . . . 50
Section 3:Strategies and Policy Approaches to Reducing Obesity,
Improving Nutrition and Increasing Activity. . . . . . . . . . . . . . . . . 51
A. State Responsibilities and Policies. . . . . . . . . . . . . . . . . . . . . . . . . . . . . . . . . . 51
1. Obesity-Related Legislation for Healthy Schools. . . . . . . . . . . . . . . . . . . . . . . . . . . . . 52
2. Obesity-Related Legislation for Healthy Communities. . . . . . . . . . . . . . . . . . . . . . . . 63
B. Federal Policies and Programs. . . . . . . . . . . . . . . . . . . . . . . . . . . . . . . . . . . . . 69
C. Examples of Prevention in Action . . . . . . . . . . . . . . . . . . . . . . . . . . . . . . . . . . 75
1. Small Businesses . . . . . . . . . . . . . . . . . . . . . . . . . . . . . . . . . . . . . . . . . . . . . . . . . . . . . 78
2. Faith-Based Organizations. . . . . . . . . . . . . . . . . . . . . . . . . . . . . . . . . . . . . . . . . . . . . . 83
3. Schools. . . . . . . . . . . . . . . . . . . . . . . . . . . . . . . . . . . . . . . . . . . . . . . . . . . . . . . . . . . . . 88
Section 4:Conclusions and Recommendations. . . . . . . . . . . . . . . . . . . . . . . . 95
Appendix A:Physical Activity and Nutrition Trends. . . . . . . . . . . . . . . . . . . . 102
Appendix B:Methodologies for Rates and Trends. . . . . . . . . . . . . . . . . . . . . . 109
Appendix C:Methodologies for 2020 and 2030 Modeling Projections. . . . . . . 111
7
F as in Fat 2012 Major Findings
In August 2012, the Centers for Disease Control and Prevention released the latest rates of adult
obesity in the United States. In 2011:
n Twelve states had an adult obesity rate above 30 percent.
n Mississippi had the highest rate of obesity at 34.9 percent, while Colorado had the lowest rate at
20.7 percent.В n Twenty-six of the 30 states with the highest obesity rates are in the Midwest and South.
n All 10 of the states with the highest rates of type 2 diabetes and hypertension are in the South.
Two Futures for America’s Health: Projections for Obesity,
Diseases and Costs
The new analysis commissioned by TFAH and RWJF, and conducted by the National Heart
Forum (NHF) was based on a peer-reviewed model published in The Lancet. The analysis includes
projections for potential rates of obesity, health problems and health care costs in the year 2030 if
current trends continued, and it examined how reducing the average body mass index (BMI) in the
state by 5 percent could lower obesity rates and decrease costs. 22
8
2030: Obesity on Current Track
2030: BMI Reduced by 5 Percent
Obesity Rates
n More than 60 percent of people could
be obese in 13 states;
n More than half of people could be
obese in 39 states;
n In all 50 states, more than 44 percent
of people could be obese.
n No state would have an obesity rate
above 60 percent;
n More than half of people would be
obese in 24 states;
n Two states would have obesity rates
under 40 percent.
Obesity-Related
Disease Rates
By 2030, for every 100,000 people, the
number of new Americans who could
develop the five top diseases associated
with obesity could range from:
n Between 8,658 in Utah to 15,208 in
West Virginia (average for all states:
12,127) for new cases of type 2 diabetes
n Between 16,730 in Utah to 35,519 in
West Virginia (average for all states:
26,573) for new cases of coronary
heart disease and stroke
n Between 17,790 in Utah to 30,508 in
Maine (average for all states: 24,923)
for new cases of hypertension
n Between 12,504 in Utah to 18,725 in
Maine (average for all states: 16,152)
for new cases of arthritis
n Between 2,468 in Utah to 4,897 in
Maine (average for all states: 3,781) for
new cases of obesity-related cancer
Thousands of cases of type 2 diabetes,
coronary heart disease and stroke,
hypertension and arthritis could be
avoided in all states;
More than 100 cases of obesity-related
cancer per 100,000 people could be
prevented in all states;
States could avoid — per 100,000 people:
n Between 1,810 and 3,213 new cases of
type 2 diabetes
n Between 1,427 and 2,512 new cases of
hypertension
n Between 1,339 and 2,898 new cases of
coronary heart disease and stroke
n Between 849 and 1,382 new cases of
arthritis
n Between 101 and 277 new cases of
cancer.
Obesity-Related
Health Care
Costs
n Every state except Florida would
n Nine states could see increases of
save between 6.5 and 7.8 percent on
more than 20 percent;
obesity-related health costs compared
n1
6 states and Washington, D.C., could
with 2030 projected costs if rates
expect increases between 15-20 percent;
continue to increase at their current
n 18 states could expect increases
pace. (Florida would save 2.1 percent).
between 10-15 percent;
n Only seven states could have increases
lower than 10 percent.
Obesity Rates and
Related Trends
M
ore than two-thirds (68 percent) of American adults are either overweight
or obese.23 Adult obesity rates have more than doubled — from 15 percent
in 1980 to 35 percent in 2010, based on a national survey. 24, 25
Rates of obesity among children ages 2–19 have
more than tripled since 1980.26,27 According to
the most recent National Health and Nutrition
Examination Survey (NHANES), 16.9 percent
of children ages 2–19 are obese, and 31.7 percent are overweight or obese.28 This translates
to more than 12 million children and adolescents who are obese and more than 23 million
1
Section
who are either obese or overweight. Researchers at the U.S. Centers for Disease Control and
Prevention (CDC) report that, during the period between 1999 and 2008, there was no statistically significant change in the number of
children and adolescents with high BMI-for-age,
except among the very heaviest boys ages 6–19.29
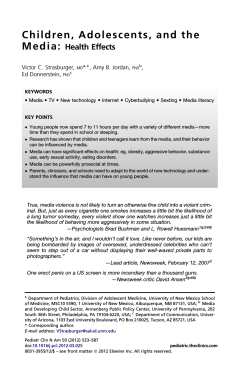
A. ADULT OBESITY AND OVERWEIGHT RATES
In August 2012, CDC released the latest rates of
obesity in the states. Twelve states currently have
an adult obesity rate over 30 percent. Mississippi
had the highest rate of obesity at 34.9 percent,
while Colorado had the lowest rate at 20.7 percent. Twenty-six of the 30 states with the highest
rates of obesity are in the South and Midwest.
Northeastern and Western states comprise most
of the states with the lowest rates of obesity.
The U.S. Department of Health and Human
Services (HHS) set a national goal to reduce
adult obesity rates to 30 percent in every state
by the year 2020. Healthy People 2020 also sets
a goal of increasing the percentage of people at
a healthy weight (BMI <25) from 30.8 percent
to 33.9 percent by 2020.
2011 Obesity Rates
WA
ND
MT
MN
VT
WI
SD
OR
ID
WY
NE
NV
UT
IL
CO
KS
MO
OK
NM
TX
WV
TN
AR
LA
PA
OH
KY
CA
AZ
IN
NH
MA
NY
MI
IA
VA
NJ
DE
MD
DC
ME
CT
RI
NC
SC
MS
AL
GA
FL
AK
HI
n <25%
n >25% & <30%
n >30%
9
CHART ON OBESITY AND OVERWEIGHT RATES
ADULTS
Overweight &
Obese
Obesity
States
Alabama
Alaska
Arizona
Arkansas
California
Colorado
Connecticut
Delaware
D.C.
Florida
Georgia
Hawaii
Idaho
Illinois
Indiana
Iowa
Kansas
Kentucky
Louisiana
Maine
Maryland
Massachusetts
Michigan
Minnesota
Mississippi
Missouri
Montana
Nebraska
Nevada
New Hampshire
New Jersey
New Mexico
New York
North Carolina
North Dakota
Ohio
Oklahoma
Oregon
Pennsylvania
Rhode Island
South Carolina
South Dakota
Tennessee
Texas
Utah
Vermont
Virginia
Washington
West Virginia
Wisconsin
Wyoming
2011 Percentage
2011 Percentage
2011 Percentage
Ranking
(95% Conf Interval)
(95% Conf Interval) (95% Conf Interval)
32.0% (+/- 1.5)
27.4% (+/- 2.2)
24.7% (+/- 2.1)
30.9% (+/- 2.2)
23.8% (+/- 0.9)
20.7% (+/- 1.1)
24.5% (+/- 1.5)
28.8% (+/- 1.9)
23.7% (+/- 1.9)
26.6% (+/- 1.3)
28.0% (+/- 1.4)
21.8% (+/- 1.5)
27.0% (+/- 1.8)
27.1% (+/- 1.8)
30.8% (+/- 1.4)
29.0% (+/- 1.4)
29.6% (+/- 0.9)
30.4% (+/- 1.5)
33.4% (+/- 1.5)
27.8% (+/- 1.1)
28.3% (+/- 1.4)
22.7% (+/- 1.0)
31.3% (+/- 1.3)
25.7% (+/- 1.1)
34.9% (+/- 1.4)
30.3% (+/- 1.7)
24.6% (+/- 1.4)
28.4% (+/- 0.8)
24.5% (+/- 2.1)
26.2% (+/- 1.5)
23.7% (+/- 1.1)
26.3% (+/- 1.3)
24.5% (+/- 1.4)
29.1% (+/- 1.5)
27.8% (+/- 1.6)
29.6% (+/- 1.4)
31.1% (+/- 1.4)
26.7% (+/- 1.6)
28.6% (+/- 1.3)
25.4% (+/- 1.6)
30.8% (+/- 1.3)
28.1% (+/- 1.9)
29.2% (+/- 2.5)
30.4% (+/- 1.4)
24.4% (+/- 1.1)
25.4% (+/- 1.4)
29.2% (+/- 1.7)
26.5% (+/- 1.2)
32.4% (+/- 1.6)
27.7% (+/- 2.0)
25.0% (+/- 1.6)
4
28
40
7
46
51
42
19
47
32
24
50
30
29
8
18
13
10
2
25
22
49
5
36
1
12
41
21
42
35
47
34
42
17
25
13
6
31
20
37
8
23
15
10
45
37
15
33
3
27
39
66.8% (+/- 1.6)
66.5% (+/- 2.4)
62.5% (+/- 2.4)
65.0% (+/- 2.3)
60.2% (+/- 1.1)
56.1% (+/- 1.3)
59.6% (+/- 1.8)
63.9% (+/- 2.2)
52.8% (+/- 2.4)
63.4% (+/- 1.4)
62.7% (+/- 1.6)
55.8% (+/- 1.8)
62.3% (+/- 2.1)
64.1% (+/- 2.0)
65.7% (+/- 1.5)
64.8% (+/- 1.5)
64.4% (+/- 0.9)
66.6% (+/- 1.6)
67.6% (+/- 1.5)
65.0% (+/- 1.2)
64.4% (+/- 1.6)
59.4% (+/- 1.2)
65.5% (+/- 1.4)
62.5% (+/- 1.2)
68.9% (+/- 1.5)
64.8% (+/- 1.8)
60.3% (+/- 1.5)
64.9% (+/- 0.9)
60.3% (+/- 2.4)
61.6% (+/- 1.8)
61.5% (+/- 1.3)
62.3% (+/- 1.4)
60.5% (+/- 1.6)
65.2% (+/- 1.5)
63.8% (+/- 1.9)
65.8% (+/- 1.4)
65.4% (+/- 1.5)
61.6% (+/- 1.7)
64.5% (+/- 1.4)
62.5% (+/- 1.8)
65.9% (+/- 1.4)
64.5% (+/- 2.2)
66.5% (+/- 2.8)
65.9% (+/- 1.5)
58.9% (+/- 1.3)
59.8% (+/- 1.6)
63.4% (+/- 1.9)
61.0% (+/- 1.4)
69.0% (+/- 1.7)
64.1% (+/- 2.2)
61.2% (+/- 1.8)
Source: Behavior Risk Factor Surveillance System (BRFSS), CDC.
10
Diabetes
11.8% (+/- 0.9)
7.9% (+/- 1.4)
9.5% (+/- 1.3)
11.2% (+/- 1.2)
8.9% (+/- 0.6)
6.7% (+/- 0.6)
9.3% (+/- 0.9)
9.7% (+/- 1.1)
9.1% (+/- 1.1)
10.4% (+/- 0.8)
10.1% (+/- 0.7)
8.4% (+/- 0.8)
9.4% (+/- 1.0)
9.7% (+/- 1.1)
10.2% (+/- 0.8)
8.2% (+/- 0.7)
9.5% (+/- 0.5)
10.8% (+/- 0.8)
11.8% (+/- 0.9)
9.6% (+/- 0.6)
9.4% (+/- 0.8)
8.0% (+/- 0.5)
10.0% (+/- 0.8)
7.3% (+/- 0.6)
12.3% (+/- 0.8)
10.2% (+/- 1.0)
7.9% (+/- 0.7)
8.4% (+/- 0.5)
10.4% (+/- 1.6)
8.7% (+/- 0.8)
8.8% (+/- 0.6)
10.0% (+/- 0.8)
10.4% (+/- 0.9)
10.8% (+/- 0.8)
8.3% (+/- 0.8)
10.0% (+/- 0.8)
11.1% (+/- 0.8)
9.3% (+/- 0.9)
9.5% (+/- 0.7)
8.4% (+/- 0.8)
12.0% (+/- 0.8)
9.5% (+/- 1.1)
11.2% (+/- 1.5)
10.2% (+/- 0.8)
6.7% (+/- 0.5)
7.7% (+/- 0.7)
10.4% (+/- 1.1)
8.9% (+/- 0.7)
12.1% (+/- 1.0)
8.4% (+/- 1.0)
8.2% (+/- 1.0)
Physical Inactivity
Hypertension
Ranking
2011 Percentage
(95% Conf Interval)
Ranking
2011 Percentage
(95% Conf Interval)
Ranking
4
46
25
6
34
50
31
22
33
11
18
38
29
22
15
43
25
9
4
24
29
45
19
49
1
15
46
38
11
37
36
19
11
9
42
19
8
31
25
38
3
25
6
15
50
48
11
34
2
38
43
32.6% (+/- 1.6)
22.0% (+/- 2.0)
24.2% (+/- 2.2)
30.9% (+/- 2.1)
19.1% (+/- 0.9)
16.5% (+/- 1.0)
25.3% (+/- 1.6)
27.0% (+/- 1.9)
19.8% (+/- 1.8)
26.9% (+/- 1.3)
26.8% (+/- 1.4)
21.3% (+/- 1.5)
21.4% (+/- 1.7)
25.2% (+/- 1.7)
29.3% (+/- 1.4)
25.9% (+/- 1.3)
26.8% (+/- 0.8)
29.4% (+/- 1.5)
33.8% (+/- 1.5)
23.0% (+/- 1.0)
26.1% (+/- 1.4)
23.5% (+/- 1.0)
23.6% (+/- 1.2)
21.8% (+/- 1.0)
36.0% (+/- 1.5)
28.5% (+/- 1.6)
24.4% (+/- 1.3)
26.3% (+/- 0.8)
24.1% (+/- 2.2)
22.5% (+/- 1.5)
26.4% (+/- 1.1)
25.3% (+/- 1.3)
26.2% (+/- 1.4)
26.7% (+/- 1.4)
27.0% (+/- 1.6)
27.0% (+/- 1.3)
31.2% (+/- 1.4)
19.7% (+/- 1.5)
26.3% (+/- 1.2)
26.2% (+/- 1.5)
27.2% (+/- 1.3)
26.9% (+/- 2.0)
35.2% (+/- 2.7)
27.2% (+/- 1.3)
18.9% (+/- 1.0)
21.0% (+/- 1.3)
25.0% (+/- 1.0)
21.9% (+/- 1.2)
35.1% (+/- 1.6)
22.6% (+/- 1.8)
25.3% (+/- 1.6)
5
41
34
7
49
51
28
13
47
16
18
45
44
31
9
27
18
8
4
38
26
37
36
43
1
10
33
22
35
40
21
28
24
20
13
13
6
48
22
24
11
16
2
11
50
46
32
42
3
39
28
40.0% (+/- 1.6)
29.4% (+/- 2.1)
28.0% (+/- 2.0)
35.7% (+/- 2.1)
27.8% (+/- 0.9)
24.9% (+/- 1.0)
29.7% (+/- 1.5)
34.6% (+/- 1.9)
29.9% (+/- 2.0)
34.2% (+/- 1.3)
32.3% (+/- 1.3)
28.7% (+/- 1.5)
29.4% (+/- 1.7)
31.0% (+/- 1.8)
32.7% (+/- 1.3)
29.9% (+/- 1.3)
30.8% (+/- 0.8)
37.9% (+/- 1.5)
38.3% (+/- 1.4)
32.2% (+/- 1.0)
31.3% (+/- 1.4)
29.2% (+/- 1.0)
34.2% (+/- 1.3)
26.3% (+/- 1.0)
39.2% (+/- 1.4)
34.3% (+/- 1.6)
30.1% (+/- 1.3)
28.5% (+/- 0.8)
30.9% (+/- 2.2)
30.6% (+/- 1.5)
30.6% (+/- 1.1)
28.5% (+/- 1.2)
30.6% (+/- 1.4)
32.4% (+/- 1.3)
28.9% (+/- 1.5)
32.7% (+/- 1.3)
35.5% (+/- 1.4)
29.8% (+/- 1.5)
31.4% (+/- 1.2)
33.0% (+/- 1.5)
36.4% (+/- 1.3)
30.9% (+/- 1.9)
38.6% (+/- 2.6)
31.3% (+/- 1.3)
22.9% (+/- 0.9)
29.3% (+/- 1.4)
31.2% (+/- 1.6)
30.1% (+/- 1.2)
37.1% (+/- 1.6)
28.9% (+/- 1.8)
28.7% (+/- 1.6)
1
37
47
8
48
50
36
10
33
12
18
43
37
24
15
33
27
5
4
19
21
40
12
49
2
11
31
45
25
28
28
45
28
17
41
15
9
35
20
14
7
25
3
21
51
39
23
31
6
41
43
AND RELATED HEALTH INDICATORS IN THE STATES
CHILDREN AND ADOLESCENTS
2011 YRBS
Percentage of
Percentage of
Percentage of High School
Obese High School Overweight High
Students Who Were
Students (95%
School Students
Physically Active At Least
Conf Interval)
(95% Conf Interval) 60 Minutes on All 7 Days
Alabama
17.0 (+/- 3.9)
15.8 (+/- 3.0)
28.4 (+/- 4.3)
Alaska
11.5 (+/- 2.0)
14.4 (+/- 2.1)
21.3 (+/- 2.8)
Arizona
10.9 (+/- 1.9)
13.9 (+/- 1.8)
25.0 (+/- 2.0)
Arkansas
15.2 (+/- 2.1)
15.4 (+/- 2.1)
26.7 (+/- 3.3)
California
N/A
N/A
N/A
Colorado
7.3 (+/- 2.4)
10.7 (+/- 2.5)
29.2 (+/- 2.8)
Connecticut
12.5 (+/- 2.7)
14.1 (+/- 1.9)
26.0 (+/- 3.1)
Delaware
12.2 (+/- 1.5)
16.9 (+/- 2.1)
24.9 (+/- 2.1)
D.C.
N/A
N/A
N/A
Florida
11.5 (+/- 2.3)
13.6 (+/- 1.1)
25.8 (+/- 1.4)
Georgia
15.0 (+/- 2.3)
15.8 (+/- 2.2)
25.2 (+/- 3.0)
Hawaii
13.2 (+/- 2.4)
13.4 (+/- 1.6)
21.0 (+/- 2.3)
Idaho
9.2 (+/- 1.6)
13.4 (+/- 1.8)
25.9 (+/- 3.4)
Illinois
11.6 (+/- 1.7)
14.5 (+/- 1.7)
23.2 (+/- 2.3)
Indiana
14.7 (+/- 1.8)
15.5 (+/- 2.1)
24.2 (+/- 2.7)
Iowa
13.2 (+/- 3.2)
14.5 (+/- 2.0)
29.1 (+/- 3.3)
Kansas
10.2 (+/- 1.5)
13.9 (+/- 1.8)
30.2 (+/- 2.5)
Kentucky
16.5 (+/- 2.5)
15.4 (+/- 1.6)
21.9 (+/- 2.5)
Louisiana
16.1 (+/- 2.6)
19.5 (+/- 4.5)
24.2 (+/- 3.5)
Maine
11.5 (+/- 1.4)
14.0 (+/- 1.1)
23.7 (+/- 1.7)
Maryland
12.0 (+/- 1.7)
15.4 (+/- 2.0)
21.4 (+/- 2.8)
Massachusetts
9.9 (+/- 1.8)
14.6 (+/- 1.4)
22.4 (+/- 2.6)
Michigan
12.1 (+/- 1.6)
15.3 (+/- 2.4)
27.0 (+/- 2.7)
Minnesota
N/A
N/A
N/A
Mississippi
15.8 (+/- 2.2)
16.5 (+/- 2.0)
25.9 (+/- 3.0)
Missouri
N/A
N/A
N/A
Montana
8.5 (+/- 1.1)
12.9 (+/- 1.4)
28.7 (+/- 1.9)
Nebraska
11.6 (+/- 1.2)
13.6 (+/- 1.3)
28.0 (+/- 1.8)
Nevada
N/A
N/A
N/A
New Hampshire
12.1 (+/- 1.7)
14.1 (+/- 2.2)
N/A
New Jersey
11.0 (+/- 2.0)
15.2 (+/- 1.9)
28.0 (+/- 2.8)
New Mexico
12.8 (+/- 2.1)
14.4 (+/- 1.2)
26.3 (+/- 1.6)
New York
11.0 (+/- 1.3)
14.7 (+/- 1.0)
25.1 (+/- 2.4)
North Carolina
12.9 (+/- 3.2)
15.9 (+/- 2.0)
26.0 (+/- 2.4)
North Dakota
11.0 (+/- 1.7)
14.5 (+/- 2.1)
21.8 (+/- 1.9)
Ohio
14.7 (+/- 3.1)
15.3 (+/- 2.3)
25.4 (+/- 3.5)
Oklahoma
16.7 (+/- 3.0)
16.3 (+/- 2.8)
33.1 (+/- 4.1)
Oregon
N/A
N/A
N/A
Pennsylvania
N/A
N/A
N/A
Rhode Island
10.8 (+/- 2.3)
14.9 (+/- 2.1)
26.7 (+/- 4.0)
South Carolina
13.3 (+/- 3.0)
16.3 (+/- 2.6)
25.8 (+/- 2.9)
South Dakota
9.8 (+/- 2.0)
14.1 (+/- 1.4)
27.3 (+/- 3.5)
Tennessee
15.2 (+/- 1.6)
17.3 (+/- 1.9)
30.2 (+/- 2.8)
Texas
15.6 (+/- 2.0)
16.0 (+/- 1.4)
27.1 (+/- 2.7)
Utah
8.6 (+/- 1.7)
12.2 (+/- 2.0)
20.8 (+/- 2.6)
Vermont
9.9 (+/- 2.0)
13.0 (+/- 1.7)
24.4 (+/- 1.6)
Virginia
11.1 (+/- 2.5)
17.2 (+/- 2.7)
24.1 (+/- 4.0)
Washington
N/A
N/A
N/A
West Virginia
14.6 (+/- 2.4)
15.7 (+/- 2.4)
29.0 (+/- 3.2)
Wisconsin
10.4 (+/- 1.6)
15.0 (+/- 1.5)
27.7 (+/- 3.6)
Wyoming
11.1 (+/- 1.4)
12.0 (+/- 1.6)
25.8 (+/- 2.1)
States
Source: Youth Risk Behavior Survey (YRBS) 2011, CDC. YRBS data are collected every 2 years. Percentages are as reported on the CDC website and can be found at <http://www.cdc.gov/HealthyYouth/
yrbs/index.htm>. Note that previous YRBS reports used the term “overweight” to describe youth
with a BMI at or above the 95th percentile for age and sex and “at risk for overweight” for those with
a BMI at or above the 85th percentile, but below the 95th percentile. However, this report uses the
terms “obese” and “overweight” based on the 2007 recommendations from the Expert Committee on
the Assessment, Prevention, and Treatment of Child and Adolescent Overweight and Obesity convened
by the American Medical Association. “Physically active at least 60 minutes on all 7 days” means that
the student did any kind of physical activity that increased their heart rate and made them breathe
hard some of the time for a total of least 60 minutes per day on each of the 7 days before the survey.
2010 PedNSS
Percentage of
Obese Low-Income
Children Ages 2-5
14.1%
N/A
14.2%
14.1%
17.2%
9.1%
15.8%
N/A
13.7%
13.4%
13.5%
9.1%
11.4%
14.6%
14.2%
14.7%
13.0%
15.6%
12.5%
14.3%
15.7%
16.1%
13.3%
12.7%
13.7%
13.6%
12.2%
13.8%
13.6%
14.2%
17.3%
11.7%
14.5%
15.5%
14.1%
12.4%
N/A
15.1%
12.0%
15.5%
12.8%
16.1%
14.5%
15.3%
8.7%
12.2%
15.5%
14.4%
13.7%
14.1%
N/A
Source: Pediatric Nutrition Surveillance 2010
Report, Table 6. Available
at http://www.cdc.gov/
pednss/pednss_tables/pdf/
national_table6.pdf
2007 National Survey of Children’s Health
Percentage of
Overweight and
Obese Children
Ages 10-17
36.1% (+/- 4.6)
33.9% (+/- 4.4)
30.6% (+/- 4.9)
37.5% (+/- 4.2)
30.5% (+/- 6.4)
27.2% (+/- 5.1)
25.7% (+/- 3.7)
33.2% (+/- 4.1)
35.4% (+/- 4.8)
33.1% (+/- 6.1)
37.3% (+/- 5.6)
28.5% (+/- 4.1)
27.5% (+/- 3.9)
34.9% (+/- 4.1)
29.9% (+/- 4.3)
26.5% (+/- 4.3)
31.1% (+/- 4.2)
37.1% (+/- 4.1)
35.9% (+/- 4.6)
28.2% (+/- 3.8)
28.8% (+/- 4.2)
30.0% (+/- 4.6)
30.6% (+/- 4.3)
23.1% (+/- 4.0)
44.4% (+/- 4.3)
31.0% (+/- 4.1)
25.6% (+/- 3.7)
31.5% (+/- 4.6)
34.2% (+/- 5.4)
29.4% (+/- 3.9)
31.0% (+/- 4.5)
32.7% (+/- 5.0)
32.9% (+/- 4.4)
33.5% (+/- 4.5)
25.7% (+/- 3.3)
33.3% (+/- 4.7)
29.5% (+/- 4.1)
24.3% (+/- 3.9)
29.7% (+/- 4.8)
30.1% (+/- 4.2)
33.7% (+/- 4.2)
28.4% (+/- 3.9)
36.5% (+/- 4.3)
32.2% (+/- 5.6)
23.1% (+/- 4.2)
26.7% (+/- 4.5)
31.0% (+/- 4.2)
29.5% (+/- 5.0)
35.5% (+/- 3.9)
27.9% (+/- 3.8)
25.7% (+/- 4.0)
Ranking
Percentage Participating in
Vigorous Physical Activity
Every Day Ages 6-17
6
12
26
2
28
42
45
16
9
17
3
37
41
10
31
44
22
4
7
39
36
30
26
50
1
23
48
21
11
35
23
19
18
14
45
15
33
49
32
29
13
38
5
20
50
43
23
33
8
40
45
36.5%
30.4%
28.5%
30.7%
30.0%
27.6%
22.1%
31.1%
26.3%
34.1%
29.4%
28.0%
25.0%
26.1%
31.3%
27.8%
25.2%
25.9%
34.0%
32.7%
30.7%
26.6%
33.1%
34.8%
29.0%
29.6%
31.5%
26.2%
24.4%
29.0%
29.1%
27.0%
27.6%
38.5%
27.1%
32.1%
29.6%
27.9%
35.4%
27.6%
31.2%
25.3%
29.8%
28.9%
17.6%
36.6%
26.2%
27.6%
33.2%
28.5%
29.8%
Source: National Survey of Children’s Health, 2007. Overweight and Physical Activity
Among Children: A Portrait of States and the Nation 2009, Health Resources and
Services Administration, Maternal and Child Health Bureau. * & red indicates a
statistically significant increase (p<0.05) from 2003 to 2007. Over the same time
period, AZ and IL had statistically significant increases in obesity rates, while OR saw
a significant decrease. Meanwhile, NM and NV experienced significant increases in
rates of overweight children between 2003 and 2007, while AZ had a decrease.
11
Obesity Rates by Sex and Race — 2011
12
Adult Obesity
TOTAL
Alabama
32.0% (+/- 1.5)
Alaska
27.4% (+/- 2.2)
Arizona
24.7% (+/- 2.1)
Arkansas
30.9% (+/- 2.2)
California
23.8% (+/- 0.9)
Colorado
20.7% (+/- 1.1)
Connecticut
24.5% (+/- 1.5)
Delaware
28.8% (+/- 1.9)
D.C.
23.7% (+/- 1.9)
Florida
26.6% (+/- 1.3)
Georgia
28.0% (+/- 1.4)
Hawaii
21.8% (+/- 1.5)
Idaho
27.0% (+/- 1.8)
Illinois
27.1% (+/- 1.8)
Indiana
30.8% (+/- 1.4)
Iowa
29.0% (+/- 1.4)
Kansas
29.6% (+/- 0.9)
Kentucky
30.4% (+/- 1.5)
Louisiana
33.4% (+/- 1.5)
Maine
27.8% (+/- 1.1)
Maryland
28.3% (+/- 1.4)
Massachusetts
22.7% (+/- 1.0)
Michigan
31.3% (+/- 1.3)
Minnesota
25.7% (+/- 1.1)
Mississippi
34.9% (+/- 1.4)
Missouri
30.3% (+/- 1.7)
Montana
24.6% (+/- 1.4)
Nebraska
28.4% (+/- 0.8)
Nevada
24.5% (+/- 2.1)
New Hampshire 26.2% (+/- 1.5)
New Jersey
23.7% (+/- 1.1)
New Mexico
26.3% (+/- 1.3)
New York
24.5% (+/- 1.4)
North Carolina 29.1% (+/- 1.5)
North Dakota
27.8% (+/- 1.6)
Ohio
29.6% (+/- 1.4)
Oklahoma
31.1% (+/- 1.4)
Oregon
26.7% (+/- 1.6)
Pennsylvania
28.6% (+/- 1.3)
Rhode Island
25.4% (+/- 1.6)
South Carolina
30.8% (+/- 1.3)
South Dakota
28.1% (+/- 1.9)
Tennessee
29.2% (+/- 2.5)
Texas
30.4% (+/- 1.4)
Utah
24.4% (+/- 1.1)
Vermont
25.4% (+/- 1.4)
Virginia
29.2% (+/- 1.7)
Washington
26.5% (+/- 1.2)
West Virginia
32.4% (+/- 1.6)
Wisconsin
27.7% (+/- 2.0)
Obesity Rates by Sex
MEN
WOMEN
32.3% (+/- 2.5) 31.8% (+/- 1.9)
28.0% (+/- 3.3) 26.8% (+/- 3.0)
24.2% (+/- 3.1) 25.1% (+/- 2.9)
30.7% (+/- 3.4) 31.1% (+/- 2.7)
23.1% (+/- 1.4) 24.5% (+/- 1.2)
21.1% (+/- 1.6) 20.4% (+/- 1.4)
25.6% (+/- 2.4) 23.7% (+/- 2.0)
29.1% (+/- 2.9) 28.5% (+/- 2.5)
18.5% (+/- 2.8) 28.4% (+/- 2.8)
27.8% (+/- 2.0) 25.6% (+/- 1.7)
26.7% (+/- 2.2) 29.3% (+/- 1.8)
24.4% (+/- 2.3) 19.3% (+/- 1.9)
26.0% (+/- 2.6) 28.0% (+/- 2.4)
27.8% (+/- 2.7) 26.6% (+/- 2.2)
30.9% (+/- 2.2) 30.9% (+/- 1.9)
30.5% (+/- 2.0) 27.5% (+/- 1.8)
30.0% (+/- 1.3) 29.1% (+/- 1.1)
29.6% (+/- 2.2) 31.1% (+/- 2.0)
33.1% (+/- 2.4) 33.9% (+/- 1.8)
28.1% (+/- 1.6) 27.6% (+/- 1.4)
28.9% (+/- 2.3) 27.9% (+/- 1.8)
24.2% (+/- 1.5) 21.5% (+/- 1.2)
31.9% (+/- 2.0) 30.7% (+/- 1.8)
28.4% (+/- 1.6) 22.9% (+/- 1.4)
32.4% (+/- 2.2) 37.4% (+/- 1.9)
29.8% (+/- 2.6) 30.8% (+/- 2.2)
25.9% (+/- 2.0) 23.4% (+/- 1.8)
29.3% (+/- 1.3) 27.6% (+/- 1.2)
25.6% (+/- 3.1) 23.5% (+/- 2.8)
28.1% (+/- 2.4) 24.2% (+/- 1.9)
25.5% (+/- 1.7) 21.9% (+/- 1.4)
26.4% (+/- 1.9) 26.4% (+/- 1.6)
25.3% (+/- 2.1) 23.9% (+/- 1.7)
28.3% (+/- 2.2) 30.0% (+/- 1.9)
30.1% (+/- 2.4) 25.4% (+/- 2.1)
31.7% (+/- 2.1) 27.6% (+/- 1.7)
30.6% (+/- 2.2) 31.5% (+/- 1.8)
26.3% (+/- 2.4) 27.3% (+/- 2.1)
29.6% (+/- 1.9) 27.7% (+/- 1.6)
27.7% (+/- 2.5) 23.4% (+/- 1.9)
28.5% (+/- 2.0) 33.1% (+/- 1.7)
29.9% (+/- 2.9) 26.3% (+/- 2.5)
28.0% (+/- 3.8) 30.5% (+/- 3.4)
31.0% (+/- 2.1) 30.0% (+/- 1.9)
25.8% (+/- 1.6) 22.9% (+/- 1.4)
27.3% (+/- 2.2) 23.6% (+/- 1.8)
29.7% (+/- 2.6) 28.6% (+/- 2.4)
28.0% (+/- 1.9) 25.1% (+/- 1.6)
30.7% (+/- 2.4) 34.3% (+/- 2.1)
29.4% (+/- 2.9) 26.1% (+/- 2.7)
Wyoming
26.1% (+/- 2.3)
25.0% (+/- 1.6)
Obesity Rates by Race/Ethnicity
WHITE
BLACK
LATINO
29.8% (+/- 1.8) 40.1% (+/- 3.3) 28.8% (+/- 13.4)
25.9% (+/- 2.3)
NA
32.3% (+/- 13.1)
20.6% (+/- 2.1) 27.0% (+/- 13.3) 33.6% (+/- 5.7)
31.0% (+/- 2.4) 38.5% (+/- 7.2) 18.4% (+/- 8.9)
22.0% (+/- 1.1) 33.1% (+/- 4.9) 30.3% (+/- 1.9)
18.9% (+/- 1.1) 34.9% (+/- 8.0) 26.6% (+/- 3.4)
23.1% (+/- 1.7) 32.8% (+/- 6.5) 32.6% (+/- 6.0)
27.3% (+/- 2.1) 38.2% (+/- 5.3) 22.4% (+/- 9.8)
10.7% (+/- 2.2) 36.7% (+/- 3.4) 13.3% (+/- 6.2)
25.0% (+/- 1.4) 35.6% (+/- 4.5) 27.9% (+/- 3.6)
25.0% (+/- 1.6) 36.8% (+/- 3.2) 26.4% (+/- 6.6)
19.0% (+/- 2.6)
NA
26.9% (+/- 6.2)
25.8% (+/- 1.8)
NA
36.1% (+/- 8.7)
26.0% (+/- 1.8) 39.2% (+/- 6.2) 25.2% (+/- 6.6)
29.5% (+/- 1.5) 42.3% (+/- 5.9) 35.1% (+/- 9.2)
29.2% (+/- 1.4) 27.8% (+/- 10.1) 33.2% (+/- 8.5)
29.1% (+/- 0.9) 41.1% (+/- 5.1) 30.5% (+/- 3.9)
29.6% (+/- 1.5) 43.1% (+/- 7.7) 22.2% (+/- 11.3)
31.1% (+/- 1.8) 39.3% (+/- 3.0) 37.5% (+/- 8.8)
27.9% (+/- 1.1) 15.3% (+/- 10.7) 30.3% (+/- 12.3)
26.0% (+/- 1.6) 37.9% (+/- 3.2) 20.9% (+/- 7.0)
22.2% (+/- 1.1) 32.4% (+/- 4.7) 31.0% (+/- 4.1)
29.8% (+/- 1.5) 40.9% (+/- 4.2) 36.7% (+/- 8.6)
25.9% (+/- 1.1) 28.4% (+/- 5.9) 31.6% (+/- 7.8)
30.7% (+/- 1.7) 42.9% (+/- 2.7) 26.8% (+/- 10.3)
29.4% (+/- 1.8) 39.3% (+/- 6.2) 27.8% (+/- 13.3)
24.2% (+/- 1.4)
NA
22.5% (+/- 9.6)
28.3% (+/- 0.9) 32.9% (+/- 5.4) 29.8% (+/- 4.1)
22.0% (+/- 2.1) 31.2% (+/- 8.3) 29.2% (+/- 6.1)
26.5% (+/- 1.6)
NA
22.9% (+/- 14.5)
23.1% (+/- 1.3) 31.6% (+/- 3.4) 27.2% (+/- 3.3)
22.6% (+/- 1.7) 23.9% (+/- 10.0) 30.0% (+/- 2.1)
23.7% (+/- 1.7) 32.6% (+/- 4.2) 26.3% (+/- 3.9)
26.2% (+/- 1.6) 40.8% (+/- 3.8) 29.0% (+/- 6.8)
26.9% ( +/- 1.6)
NA
NA
29.2% ( +/- 1.5) 34.0% (+/- 4.7) 32.2% (+/- 11.6)
30.3% ( +/- 1.6) 34.8% (+/- 6.5) 28.7% (+/- 6.3)
26.1% ( +/- 1.5)
NA
28.8% (+/- 8.2)
28.0% ( +/- 1.3) 36.0% (+/- 4.7) 32.9% (+/- 7.6)
24.9% ( +/- 1.7) 35.2% (+/- 9.8) 26.5% (+/- 5.6)
27.0% ( +/- 1.5) 42.4% (+/- 2.8) 25.0% (+/- 8.5)
26.7% ( +/- 2.0)
NA
40.0% (+/- 15.1)
27.9% ( +/- 2.7) 40.5% (+/- 8.2)
NA
27.1% ( +/- 1.7) 39.6% (+/- 5.1) 34.5% (+/- 2.7)
24.4% ( +/- 1.1) 29.0% (+/- 14.3) 24.2% (+/- 4.0)
25.4% ( +/- 1.4)
NA
23.5% (+/- 14.4)
27.6% ( +/- 1.9) 37.8% (+/- 4.8) 31.4% (+/- 9.4)
27.1% ( +/- 1.4) 39.5% (+/- 10.3) 27.9% (+/- 5.0)
32.4% ( +/- 1.6) 34.2% (+/- 10.8) 29.1% (+/- 14.7)
26.8% ( +/- 2.0) 44.0% (+/- 10.8)
NA
23.8% (+/- 2.2) 24.9% ( +/- 1.7)
NA
25.9% (+/- 6.6)
States with the Highest Obesity Rates
Rank
State
1
2
3
4
5
6
7
8 (tie)
8 (tie)
10 (tie)
10 (tie)
Mississippi
Louisiana
West Virginia
Alabama
Michigan
Oklahoma
Arkansas
Indiana
South Carolina
Kentucky
Texas
Percentage of Adult Obesity
(Based on 2011 Data, Including Confidence Intervals)
34.9% (+/- 1.4)
33.4% (+/- 1.5)
32.4% (+/- 1.6)
32.0% (+/- 1.5)
31.3% (+/- 1.3)
31.1% (+/- 1.4)
30.9% (+/- 2.2)
30.8% (+/- 1.4)
30.8% (+/- 1.3)
30.4% (+/- 1.5)
30.4% (+/- 1.4)
Note: For rankings, 1 = Highest rate of obesity.
States with the Lowest Obesity Rates
Rank
State
51
50
49
47 (tie)
47 (tie)
46
45
42 (tie)
42 (tie)
42 (tie)
Colorado
Hawaii
Massachusetts
D.C.
New Jersey
California
Utah
Connecticut
Nevada
New York
Percentage of Adult Obesity
(Based on 2011 Data, Including Confidence Intervals)
20.7% (+/- 1.1)
21.8% (+/- 1.5)
22.7% (+/- 1.0)
23.7% (+/- 1.9)
23.7% (+/- 1.1)
23.8% (+/- 0.9)
24.4% (+/- 1.1)
24.5% (+/- 1.5)
24.5% (+/- 2.1)
24.5% (+/- 1.4)
Note: For rankings, 51 = Lowest rate of obesity.
13
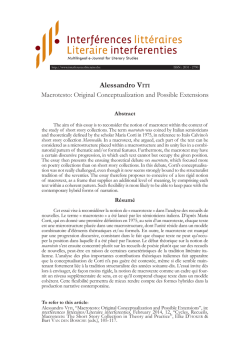
PAST OBESITY TRENDS* AMONG U.S. ADULTS
BRFSS, 1991, 1993-1995,1998-2000, and 20082010 Combined Data
(*BMI >30, or about 30lbs overweight for 5’4”
person)
1991
WA
ND
MT
MN
VT
ID
WY
IL
UT
CO
KS
OK
LA
TX
PA
OH
WV
KY
TN
AR
NM
AZ
IN
MO
CA
NH
MA
NY
MI
IA
NE
NV
ME
WI
SD
OR
VA
CT
NJ
DE
MD
DC
RI
NC
SC
MS
AL
GA
FL
AK
HI
1993–1995 Combined Data
WA
ND
MT
MN
VT
ID
WY
IL
UT
CO
KS
OK
LA
TX
WV
TN
AR
NM
PA
OH
KY
CA
AZ
IN
MO
NH
MA
NY
MI
IA
NE
NV
ME
WI
SD
OR
VA
CT
NJ
DE
MD
DC
RI
NC
SC
MS
AL
GA
FL
AK
HI
1998–2000 Combined Data
WA
ND
MT
MN
VT
WI
SD
OR
ID
WY
NV
UT
IL
CO
KS
OK
NM
TX
IN
MO
VA
NJ
DE
MD
DC
CT
RI
NC
SC
MS
AL
GA
FL
AK
HI
14
WV
TN
AR
LA
PA
OH
KY
CA
AZ
NY
MI
IA
NE
ME
NH
MA
n No Data
n <10%
n >10% & <15%
n >15% & <20%
n >20%
RATES AND RANKINGS METHODOLOGY30
The analysis in F as in Fat compares data from the Behavioral
Risk Factor Surveillance System (BRFSS), the largest phone
survey in the world.
BRFSS is the largest ongoing telephone health survey in the
world. It is a state-based system of health surveys established
by CDC in 1984. BRFSS completes more than 400,000 adult
interviews each year. For most states, BRFSS is their only
source of population-based health behavior data about chronic
disease prevalence and behavioral risk factors.
BRFSS surveys a sample of adults in each state to get information
on health risks and behaviors, health practices for preventing
disease, and healthcare access mostly linked to chronic disease
and injury. The sample is representative of the population of
each state.
Washington, D.C., is included in the rankings because CDC
provides funds to the city to conduct a survey in an equivalent
way to the states.
The data are based on telephone surveys by state health
departments, with assistance from CDC. Surveys ask
people to report their weight and height, which is used to
calculate BMI. Experts say rates of overweight and obesity
are probably slightly higher than shown by the data because
people tend to underreport their weight and exaggerate
their height.31
BRFSS made two changes in methodology for its 2011 dataset
to make the data more representative of the total population.
These are making survey calls to cell-phone numbers and
adopting a new weighting method:
n The first change is including and then growing the number of
interview calls made to cell phone numbers. Estimates today
are that 3 in 10 U.S. households have only cell phones.
n The second is a statistical measurement change, which
involves the way the data are weighted to better match the
demographics of the population in the state.
The new methodology means the BRFSS data will better
represent lower-income and racial and ethnic minorities, as
well as populations with lower levels of formal education.В The
size and direction of the effects will vary by state, the behavior
under study, and other factors. Although generalizing is
difficult because of these variables, it is likely that the changes
in methods will result in somewhat higher estimates for the
occurrence of behaviors that are more common among
younger adults and to certain racial and ethnic groups.
The change in methodology makes direct comparisons to past
data difficult.
In prior years, this report has included racial, ethnic and
gender breakdowns by state. However, because there is only
one year of data available using the new methodology, the
sample sizes for some states are too small to reliably provide
these breakdowns in this year’s report.
More information on the methodology is available in Appendix B.
Definitions of Obesity and Overweight
Obesity is defined as an excessively high amount of body fat or adipose tissue in relation to lean body
mass.32,33 Overweight refers to increased body weight in relation to height, which is then compared
to a standard of acceptable weight.34 An adult is considered obese if his or her body mass index
(BMI), a calculation based on an individual’s weight and height, is 30 or higher. The equation is:
BMI =
(Weight in pounds)
(Height in inches) x (Height in inches)
x 703
Adults with a BMI of 25 to 29.9 are considered overweight. The National Institutes of Health (NIH)
adopted a lower optimal weight threshold in June 1998. Previously, the federal government defined
overweight as a BMI of 28 for men and 27 for women.
On the basis of 2000 CDC growth charts, children and youth at or above the 95th percentile were
defined as “overweight,” while children at or above the 85th percentile but below the 95th percentile
were defined as “at risk of overweight.” However, in 2007, an expert committee recommended
using the same cut points but changing the terminology by replacing “overweight” with “obese” and
“at risk of overweight” with “overweight.” The committee also added an additional cut point — BMI
at or above the 99th percentile — to define “severe obesity.”35
BMI is considered an important measure for understanding population trends. For individuals, it may
be less accurate and should be used alongside other measures of risk, including waist size, waist-tohip ratio, blood pressure, cholesterol level, and blood sugar, among others.36
15
OBESITY AROUND THE WORLD
New information from the Organization for
Economic Cooperation and Development
(OECD) shows that, while more than half of
adults are either overweight or obese in the
majority of OECD countries, the rate of growth
slowed or stopped in many countries over the
last decade.37 In England almost a quarter of the
population is obese, up to 18 percent in Hungary
are considered obese, and almost 15 percent in
Spain and Ireland are obese.38
In England, Hungary, Italy, South Korea and
Switzerland, obesity rates either stopped
growing or slowed significantly, and Spain
and France only increased by 2 percent to 3
percent.39 But in Canada, Ireland and the United
States, rates continued to increase, by up to
5 percent. During the last decade childhood
obesity rates have leveled out in England, France,
South Korea and the United States.40
Data also showed consistent disparities in obesity
rates across many countries. Women with less
education were two to three times more likely
to be overweight or obese than women with
higher education levels, and the trend stayed
consistent throughout the decade with no improvements made to remedy the disparity.41
SOCIOECONOMICS AND OBESITY
An analysis of the 2008-2010 BRFSS data looking at income, level of schooling completed and
obesity finds strong correlations between obesity
and income and between obesity and education:
n Nearly 33 percent of adults who did not graduate high school were obese, compared with
21.5 percent of those who graduated from
college or technical college.
n More than 33 percent of adults who earn less
than $15,000 per year were obese, compared
with 24.6 percent of those who earned at
least $50,000 per year.42
B. CHILDHOOD AND YOUTH OBESITY AND OVERWEIGHT RATES
1. Study of Children Ages 10–17 (2007)
The most recent data for childhood statistics on
a state-by-state level are from the 2007 National
Survey of Children’s Health (NSCH).43 The next
NSCH release is expected in late 2012. According
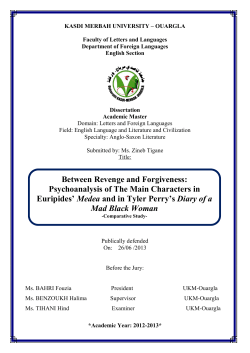
to the 2007 study, obesity rates for children ages
10–17, defined as BMI greater than the 95th
percentile for age group, ranged from a low of
9.6 percent in Oregon to a high of 21.9 percent
in Mississippi. The NSCH study is based on a
survey of parents in each state. The data are
derived from parental reports, so they are not as
reliable as measured data, such as NHANES, but
16
they are the only source of comparative state-bystate data for children.
Nine of the 10 states with the highest rates of
obese children are in the South. In 2003, when
the last NSCH was conducted, only Washington,
D.C., and three states — Kentucky, Tennessee
and West Virginia — had childhood obesity
rates higher than 20 percent. Four years later,
in 2007, six more states had childhood obesity
rates over 20 percent: Arkansas, Georgia, Illinois, Louisiana, Mississippi and Texas.
Obese 10- to 17-Year-Olds, 2007 NSCH
WA
ND
MT
MN
VT
WI
SD
OR
ID
WY
NE
NV
IL
UT
CO
KS
MO
OK
NM
TX
WV
TN
AR
LA
PA
OH
KY
CA
AZ
IN
NH
MA
NY
MI
IA
VA
NJ
DE
MD
DC
ME
CT
RI
NC
SC
MS
AL
GA
FL
AK
HI
n No Data
n <10%
n >10% & <15%
n >15% & <20%
n >20% & <25%
n >25% & <30%
n >30%
Source: National Survey on Children’s Health, 2007.
States with the Highest Rates of Obese 10- to 17-year-olds
Rank
States
Percentage of Obese 10- to 17-year-olds
(95 percent Confidence Intervals)
1
2
3
4 (tie)
4 (tie)
6
7 (tie)
7 (tie)
9
Mississippi
Georgia
Kentucky
Illinois
Louisiana
Tennessee
Arkansas
Texas
D.C.
21.9% (+/- 3.5)
21.3% (+/- 5.1)
21.0% (+/- 3.5)
20.7% (+/- 3.6)
20.7% (+/- 4.0)
20.6% (+/- 3.7)
20.4% (+/- 3.6)
20.4% (+/- 5.0)
20.1% (+/- 3.9)
10
West Virginia
*Note: For rankings, 1 = Highest rate of childhood obesity.
18.9% (+/- 3.2)
Eight of the states with the lowest rates of obese 10- to 17-year-olds are in the West.
States with the Lowest Rates of Obese 10- to 17-year-olds
Rank
States
Percentage of Obese 10- to 17-year-olds
(95 percent Confidence Intervals)
51
50
48 (tie)
48 (tie)
46 (tie)
46 (tie)
44 (tie)
44 (tie)
Oregon
Wyoming
Washington
Minnesota
Iowa
Hawaii
Utah
North Dakota
9.6% (+/- 2.7)
10.2% (+/- 2.7)
11.1% (+/- 3.4)
11.1% (+/- 3.0)
11.2% (+/- 2.7)
11.2% (+/- 2.8)
11.4% (+/- 3.5)
11.4% (+/- 2.5)
42 (tie)
Montana
42 (tie)
Idaho
*Note: For rankings, 51 = Lowest rate of childhood obesity.
11.8% (+/- 2.8)
11.8% (+/- 2.7)
17
2. Study of High School Students
The Youth Risk Behavior Surveillance System
(YRBSS) includes both national and state surveys
that provide data on adolescent obesity and overweight rates, most recently in 2011.44 The information from the YRBSS is based on self-reported
information. According to the national survey, 13
percent of high school students were obese and
15.2 percent were overweight.45 There has been
an upward trend from 1999 to 2011 in the prevalence of students nationwide who were obese
(10.6 percent to 13 percent) and who were overweight (14.2 percent to 15.2 percent).46 Students
also reported on whether or not they participated
in at least 60 minutes of physical activity every day
of the week. The most recent state surveys, con-
ducted in 43 states, found a range in the percentage of high school students who were physically
active for at least 60 minutes per day seven days a
week, from a high of 33.1 percent in Oklahoma
to a low of 20.8 percent in Utah, with a median
prevalence of 25.8 percent.
The latest state surveys also found a range of
obesity levels: a low of 7.3 percent in Colorado
to a high of 17.0 percent in Alabama, with a median prevalence of 12.0 percent. Overweight
prevalence among high school students ranged
from a low of 10.7 percent in Colorado to a high
of 19.5 percent in Louisiana, with a median
prevalence of 14.7 percent.
PERCENT OF OBESE HIGH SCHOOL STUDENTS —
Selected U.S. States, Youth Risk Behavior Survey, 2011
WA
11
9
MN
10
OR
9
11
9
12
7
10
MO
17
13
15
15
15
16
16
PA
15
17
CA
11
15
12
10
11
12
13
12
NV
12
10
10
11
11
12
12
13
11
13
13
16
17
15
12
12
13
n No Data
n <10%
n 10% – 14%
n 15% – 19%
Source: YBRS. Trend maps from 2003-2011 are available at: http://www.cdc.gov/healthyyouth/obesity/obesity-youth.htm.
Percentage of Obese and Overweight U.S. High School Students by Sex
Female
Male
Total
Obese
Overweight
9.8%
16.1%
13.0%
15.4%
15.1%
15.2%
Percentage of Obese and Overweight U.S. High School Students
by Race/Ethnicity
18
Obese
Overweight
White*
Black*
Hispanic
11.5%
18.2%
14.1%
14.2%
16.2%
17.4%
Total**
13.0%
15.2%
Notes: *Non-Hispanic. **Other race/ethnicities are included in the total but are not presented separately.
Percentage of Obese and Overweight U.S. High School Students
by Sex and Race/Ethnicity
Obese
Overweight
Female
Male
White*
7.7%
15.0%
13.8%
14.7%
Black*
18.6%
17.7%
19.6%
12.8%
Hispanic
8.6%
19.2%
18.0%
16.9%
Total**
9.8%
16.1%
15.4%
15.1%
Notes: *Non-Hispanic. **Other race/ethnicities are included in the total but are not presented separately.
Female
Male
3. Study of Children from Lower-Income Families (2010)
The Pediatric Nutrition Surveillance Survey
(PedNSS), which examines children between
the ages of 2 and 5 from lower-income families,
found that 14.4 percent of this group is obese,
compared with 12.1 percent for all U.S. children
of a similar age.47 The data for PedNSS is based
on actual measurements rather than self reports.
The prevalence of obesity among children from
lower-income families increased from 12.7 percent in 1999 to 14.4 percent in 2010, although
rates have remained stable since 2003. The highest obesity rates were seen among American Indian and Alaska Native children (21.1 percent)
and Latino children (17.6 percent).
4. Physical Inactivity in Adults
Physical inactivity in adults reflects the number
of survey respondents who reported not engaging in physical activity or exercise during the previous 30 days other than doing their regular jobs.
Mississippi, the state with the highest rate
of obesity, also had the highest reported
percentage of inactivity at 36 percent.
States with the Highest Physical Inactivity Rates, 2011
Rank
State
Percentage of Adult Physical Inactivity
(Based on 2011 Data, Including Confidence Intervals)
1
2
3
Mississippi
Tennessee
West Virginia
36.0% (+/- 1.5)
35.2% (+/- 2.7)
35.1% (+/- 1.6)
4
Louisiana
5
Alabama
6
Oklahoma
7
Arkansas
8
Kentucky
9
Indiana
10
Missouri
*Note: For rankings, 1=Highest rate of physical inactivity
33.8% (+/- 1.5)
32.6% (+/- 1.6)
31.2% (+/- 1.4)
30.9% (+/- 2.1)
29.4% (+/- 1.5)
29.3% (+/- 1.4)
28.5% (+/- 1.6)
Obesity Ranking
1
15 (tie)
3
2
4
6
7
10 (tie)
8 (tie)
12
Colorado, the state with the lowest rate of adult obesity, also had the lowest reported rate of physical
inactivity at 16.5 percent.
States with the Lowest Physical Inactivity Rates, 2011
Rank
State
Percentage of Adult Physical Inactivity
(Based on 2011 Data, Including Confidence Intervals)
51
50
Colorado
Utah
16.5% (+/- 1.8)
18.9% (+/- 1.0)
49
California
19.1% (+/- 0.9)
48
Oregon
19.7% (+/- 1.5)
47
D.C.
19.8% (+/- 1.8)
46
Vermont
21.0% (+/- 1.3)
45
Hawaii
21.3% (+/- 1.5)
44
Idaho
21.4% (+/- 1.7)
43
Minnesota
21.8% (+/- 1.0)
42
Washington
21.9% (+/- 1.2)
*Note: For rankings, 51 = Lowest rate of physical inactivity.
Obesity Ranking
51
45
46
31
47 (tie)
37 (tie)
50
30
36
33
19
D. Type 2 Diabetes and Hypertension in Adults
Obesity and physical inactivity have been linked
to a range of chronic diseases, including diabetes and hypertension. Seven of the 10 states
with the highest diabetes rates are also in the
top 10 for obesity rates; and 7 of the 10 states
with the highest hypertension rates are also in
the top 10 for obesity.
1. Type 2 Diabetes
All 10 of the states with the highest rates of type 2 diabetes are in the South.
States with the Rates of Adult with Type 2 Diabetes, 2011
Rank
State
1
Mississippi
Percentage of Adult Diabetes
(Based on 2011 Data, Including Confidence Intervals)
Obesity Ranking
1
3
8 (tie)
4
2
7
15 (tie)
6
10 (tie)
17
12.3% (+/- 0.8)
2
West Virginia
3
South Carolina
4
Alabama
5
Louisiana
6 (tie)
Arkansas
6 (tie)
Tennessee
8
Oklahoma
9 (tie)
Kentucky
9 (tie)
North Carolina
*Note: For rankings, 1 = Highest rate of type 2 diabetes.
12.1% (+/- 1.0)
12.0% (+/- 0.8)
11.8% (+/- 0.9)
11.8% (+/- 0.9)
11.2% (+/- 1.2)
11.2% (+/- 1.5)
11.1% (+/- 0.8)
10.8% (+/- 0.8)
10.8% (+/- 0.8)
THE DIABETES BELT
In the 1960s researchers first identified the
Southeastern United States as the “stroke belt,”
since strokes were much more frequent in
that region than the rest of the country. Now,
scientists are focusing on a “diabetes belt,” made
up of 644 counties in 15 mostly Southern states.
This belt includes parts of Alabama, Arkansas,
Florida, Georgia, Kentucky, Louisiana, North
Carolina, Ohio, Pennsylvania, South Carolina,
Tennessee, Texas, Virginia, West Virginia, and
all of Mississippi.48 The demographics of these
644 counties vary greatly from those of the
overall country. They have a high percentage of
Blacks, and, not surprisingly, a high number of
people who are obese and lead sedentary lives.49
Policymakers hope to use this new information to
target resources to those who most need help.
2. Hypertension
All 10 states with the highest rates of hypertension are also in the South.
States with the Highest Rates of Adult Hypertension, 2011
Percentage of Adult Hypertension
(Based on 2011 Data, Including Confidence Intervals)
1
Alabama
40.0% (+/- 1.6)
2
Mississippi
39.2% (+/- 1.4)
3
Tennessee
38.6% (+/- 2.6)
4
Louisiana
38.3% (+/- 1.4)
5
Kentucky
37.9% (+/- 1.5)
6
West Virginia
37.1% (+/- 1.6)
7
South Carolina
36.4% (+/- 1.3)
8
Arkansas
35.7% (+/- 2.1)
9
Oklahoma
35.5% (+/- 1.4)
10
Delaware
34.6% (+/- 1.9)
*Note: For rankings, 1 = Highest rate of hypertension.
Rank
20
State
Obesity Ranking
4
1
15 (tie)
2
10 (tie)
3
8 (tie)
7
6
19
e. Fruit and Vegetable Consumption
Fruit and vegetable consumption, as part of a healthy diet, is important for weight management,
optimal child growth, and chronic disease prevention. Seven of the 10 states with the highest rates
of obesity were also in the bottom 10 for fruit and vegetable consumption
States with the Lowest Adult Fruit and Vegetable Consumption, 2011
Percentage of Adult Fruit and Vegetable Consumption
(Based on 2011 Data, Including Confidence Intervals)
1
West Virginia
7.9% (+/- 0.9)
2
Louisiana
8.2% (+/- 0.9)
3
Oklahoma
9.8% (+/- 0.9)
4
Mississippi
10.3% (+/- 1.0)
5 (tie)
Kentucky
10.6% (+/- 1.0)
5 (tie)
Tennessee
10.6% (+/- 1.9)
7
South Dakota
11.0% (+/- 1.2)
8 (tie)
Alabama
12.5% (+/- 1.1)
8 (tie)
South Carolina
12.5% (+/- 0.9)
10
Delaware
12.9% (+/- 1.4)
Note: For rankings, 1 = Lowest rate of fruit and vegetable consumption.
Rank
State
Obesity Ranking
3
2
6
1
10 (tie)
15 (tie)
23
4
8
19
States with the Highest Adult Fruit and Vegetable Consumption, 2011
Percentage of Adult Fruit and Vegetable Consumption
(Based on 2011 Data, Including Confidence Intervals)
51
D.C.
25.6% (+/- 2.1)
50
California
24.4% (+/- 0.9)
49
Vermont
22.7% (+/- 1.3)
48
New Hampshire
22.5% (+/- 1.5)
47
Oregon
22.3% (+/- 1.4)
46
Arizona
21.4% (+/- 2.0)
45
Connecticut
20.8% (+/- 1.4)
44
New York
19.9% (+/- 1.3)
43
Rhode Island
19.8% (+/- 1.4)
42
Hawaii
19.7% (+/- 1.4)
Note: For rankings, 51 = Highest rate of fruit and vegetable consumption.
Rank
State
Obesity Ranking
47 (tie)
46
37 (tie)
35
31
40
42 (tie)
42 (tie)
37 (tie)
50
21
Two Futures for
America’s Health
T
FAH and RWJF commissioned the National Heart Forum (NHF) to conduct a modeling study to examine how obesity rates in states could change
if trends continued on their current trajectory, including the potential impact on
obesity-related diseases and costs by 2030. The analysis also looked at how disease
rates and costs could be affected by lowering the average BMI in the state by only 5
percent in each state.
Currently, more than 35 percent of American
adults are obese.50 Individuals with a BMI of
30 or higher are considered obese. The report
found if current trends continue, by the year
2030, more than 44 percent of adults could be
obese, which could lead to major increases in
obesity-related disease rates and health care
costs. But, if states could reduce the average
adult BMI by 5 percent, millions of Americans
2
Section
could be spared from preventable diseases and
each state could save billions in health care
costs. For an adult of average weight, reducing
BMI by 1 percent is equivalent to a weight loss
of around 2.2 pounds.51
The analysis concluded, therefore, that there
are two potential futures for America’s health.
Background
The study is based on a peer-reviewed model
developed by researchers at the NHF and
used for the basis of an analysis, “Health and
Economic Burden of the Projected Obesity
Trends in the USA and the UK,” published in
2011 in The Lancet.52 В The full methodology is
available in Appendix C.
The NHF is an international center for the
prevention of avoidable chronic diseases, including
coronary heart disease, stroke, cancer and
diabetes. The organization is an alliance of 65
charitable organizations in the United Kingdom,
including leading policy research experts on
chronic disease prevention and promotes
consensus-based healthy public policy.
23
Peer-Reviewed Projections of Future Trends
The analysis is based on a model developed
by researchers at the National Heart Forum.
Micro Health Simulations used the model in a
peer reviewed study, “Health and Economic
Burden of the Projected Obesity Trends in
the [United States and the United Kingdom],”
published in 2011 in The Lancet.53 В The full
methodology is available in Appendix C.
All models have limitations in forecasting the
future, but they help predict the trajectory
of trends based on past data. Trends can, of
course, change significantly over time for a
variety of reasons. However, having a sense
of potential scenarios is particularly helpful
to understand patterns, such as growth rates
for diseases and costs projections, which can
inform policy priorities and decisions.
The NHF study published in The Lancet in
2011 developed national projections for
obesity and the potential growth in related
disease rates and costs between 2010 and
2030, using data from the National Health and
Nutrition Examination Survey (NHANES).
They found the number of obese Americans
could grow from 32 percent, in 2011, to
around 50 percent (+/- 5) in 2030, with the
potential estimated low rate would be 45 and
the high rate is 55.
Based on the predicted rise in obesity, they
found the baseline potential growth in obesity
costs could be $66 billion (+/- 45 billion).
Within the potential range, it could be as low
as $20 billion or as high as $110 billion.
24
In addition, they projected baseline estimates for:54
n The number of new cases of diabetes could
be 7.9 million (+/- 1.6 million) per year,
which means it could be as low as 6.3 million or as high as 9.5 million;
n The number of new cases of chronic heart disease and stroke could be 6.8 million (+/- 1.5
million) per year, which means it could be as
low as 5.3 million or as high as 8.3 million; and
n The number of new cases of cancer could
be 0.5 million (+/- 0.1 million) per year,
which means it could be as low as 0.4 million or as high as 0.6 million.
The projections in the state-by-state analysis
featured in the F as in Fat report are considered
to be marginally more accurate than those reported in the national study, because the stateby-state study is based on data from the BRFSS
instead of NHANES. BRFSS provides more data
points than NHANES (10 versus seven). In other
words, more data points enables researchers to
estimate projections more precisely.
The modeling study also reflects adjustments of
data to correct for self-reporting bias in BRFSS.55
These findings are similar to a 2012 study in
the American Journal of Preventive Medicine.
The study found that by 2030, 42 percent of
U.S. adults will be obese.56 This study also
found that the rate of severe obesity will
double by 2030, when more than 10 percent
of adults will be considered severely obese.57
The projected increase in obesity is estimated
to cost the United States $550 billion in health
spending between now and 2030.58
A. KEY FINDINGS
Obesity in 2030
If obesity rates continue on their current track,
in 2030, more than 60 percent of adults in America could be obese in 13 states; more than half
of adults could be obese in 39 states; and more
than 44 percent could be obese in all 50 states.
2030: Adult
Obesity Rates
if the Current
Trajectory
Continues
WA
However, if states could reduce average adult BMIs
by 5 percent, no state would have an obesity rate
above 60 percent. More than half of Americans
would be obese in 24 states; two states would have
rates under 40 percent (Alaska at 39.4 percent
and Colorado at 39 percent); and Washington,
D.C. would be below 30 percent (29.1 percent).
ND
MT
MN
VT
WI
SD
OR
ID
WY
NV
MI
IA
NE
IL
UT
CO
KS
MO
OK
LA
TX
PA
OH
WV
TN
AR
NM
NH
MA
NY
KY
CA
AZ
IN
VA
ME
NJ
DE
MD
DC
CT
RI
NC
SC
MS
AL
GA
n <35%
n <35% & <40%
n >40% & <45%
n >45% & <50%
n >50% & <55%
n >55% & <60%
n >60% & <65%
n >65%
FL
AK
HI
2030: Adult
Obesity Rates if
Average BMI is
Reduced by
5 Percent
WA
ND
MT
MN
VT
WI
SD
OR
ID
WY
NV
IL
UT
CO
KS
MO
OK
LA
TX
WV
TN
AR
NM
PA
OH
KY
CA
AZ
IN
NH
MA
NY
MI
IA
NE
VA
ME
NJ
DE
MD
DC
CT
RI
NC
SC
MS
AL
GA
FL
AK
n <35%
n <35% & <40%
n >40% & <45%
n >45% & <50%
n >50% & <55%
n >55% & <60%
n >60% & <65%
n >65%
HI
Potential
Percent Increase
in Obesity Rates
2010-2030
WA
ND
MT
MN
VT
WI
SD
OR
ID
WY
NV
UT
IL
CO
KS
OK
NM
TX
WV
TN
AR
LA
PA
OH
KY
CA
AZ
IN
MO
AL
GA
FL
AK
VA
NC
SC
MS
NH
MA
NY
MI
IA
NE
NJ
DE
MD
DC
ME
CT
RI
n <80%
n >80% & <90%
n >90% & <100%
n >100% & <110%
n >110% & <120%
n >120% & <130%
n >130%
HI
25
Rates and Rankings 2030
State
26
Obesity rates in 2030
on current track
Rank
Obesity rates in 2030 if states
reduce average adult BMI by 5%
Rank
Alabama
62.6%
6
55.1%
8
Alaska
45.6%
49
39.4%
49
Arizona
58.8%
16
51.8%
17
Arkansas
60.6%
10
53.4%
11
California
46.6%
46
40.5%
47
Colorado
44.8%
50
39.0%
50
Connecticut
46.5%
47
40.5%
47
Delaware
64.7%
3
56.4%
4
DC
32.6%
51
29.1%
51
Florida
58.6%
18
51.1%
19
Georgia
53.6%
35
47.5%
33
Hawaii
51.8%
38
45.5%
38
Idaho
53.0%
37
46.9%
37
Illinois
53.7%
34
47.5%
33
Indiana
56.0%
27
49.5%
25
Iowa
54.4%
31
47.6%
32
Kansas
62.1%
7
55.1%
8
Kentucky
60.1%
13
53.2%
15
Louisiana
62.1%
7
55.4%
7
Maine
55.2%
29
49.0%
29
Maryland
58.8%
16
52.2%
16
Massachusetts
48.7%
43
42.4%
43
Michigan
59.4%
15
53.4%
11
Minnesota
54.7%
30
47.5%
33
Mississippi
66.7%
1
59.9%
1
Missouri
61.9%
9
55.5%
5
Montana
53.6%
35
47.4%
36
Nebraska
56.9%
23
50.6%
21
Nevada
49.6%
41
43.8%
41
New Hampshire
57.7%
20
50.8%
20
New Jersey
48.6%
44
42.3%
44
New Mexico
54.2%
32
48.8%
30
New York
50.9%
39
44.5%
40
North Carolina
58.0%
19
51.4%
18
North Dakota
57.1%
22
49.4%
26
Ohio
59.8%
14
53.5%
10
Oklahoma
66.4%
2
58.6%
2
Oregon
48.8%
42
43.4%
42
Pennsylvania
56.7%
24
50.4%
23
Rhode Island
53.8%
33
48.4%
31
South Carolina
62.9%
5
55.5%
5
South Dakota
60.4%
11
53.3%
14
Tennessee
63.4%
4
57.4%
3
Texas
57.2%
21
50.4%
23
Utah
46.4%
48
40.6%
46
Vermont
47.7%
45
42.1%
45
Virginia
49.7%
40
44.7%
39
Washington
55.5%
28
49.1%
28
West Virginia
60.2%
12
53.4%
11
Wisconsin
56.3%
26
49.4%
26
Wyoming
56.6%
25
50.5%
22
DISEASE RATES
Nationally, obesity could contribute to more
than 6 million cases of type 2 diabetes, 5 million
cases of coronary heart disease and stroke, and
more than 400,000 cases of cancer in the next
two decades, according to The Lancet study’s
conservative estimates.59
As the number of obese individuals grows, the segment of the population that is currently at risk for
the highest incidence of health problems related
to obesity exponentially increases their risk of developing those conditions. This report examined
the potential growth of five of the highest-cost and
highest-incidence health problems related to obesity — type 2 diabetes, coronary heart disease and
stroke, hypertension, arthritis and obesity-related
cancer. For instance, approximately 33 percent
of Americans (79 million people) are currently
pre-diabetic, which means they have prolonged
or uncontrolled elevated blood sugar levels that
can contribute to the development of diabetes.
These 79 million Americans are at a tipping point.
As more Americans become obese, more people
who are currently maintaining blood sugar levels
below the level of full-blown diabetes will cross
over that line. Twenty years ago, only 7.8 million
Americans had been diagnosed with diabetes.
Currently, around 25.8 million Americans have
diabetes, and if trends continue on their current
track, in 2030, more than 31 million Americans
will have diabetes.
The analysis found that if we continue on current trajectories by 2030, for every 100,000
Americans, the number of additional individuals that could develop the top five obesity-related health conditions (new cases) range from:
n Type 2 Diabetes: Between 8,658 in Utah
to 15,208 in West Virginia (average for all
states: 12,127)
nC
oronary Heart Disease and Stroke: Between
16,730 in Utah to 35,519 in West Virginia (average for all states: 26,573)
n Hypertension: Between 17,790 in Utah to
30,508 in Maine (average for all states: 24,923)
nA
rthritis: Between 12,504 in Utah to 18,725
in Maine (average for all states: 16,152)
n Obesity-Related Cancer: Between 2,468 in Utah
to 4,897 in Maine (average for all states: 3,781)
However, if states could reduce the average BMI
by 5 percent by 2030, thousands of cases of type
2 diabetes, coronary heart disease, stroke, hypertension and arthritis (except Alaska and Utah)
could be prevented per 100,000 people in nearly
each state, and more than 100 cases of obesityrelated cancer per 100,000 people could be prevented per state.
For every 100,000 Americans, the number of
individuals who could avoid these serious health
problems range from:
nT
ype 2 Diabetes: Between 1,810 in Utah to
3,216 in West Virginia
nC
oronary Heart Disease and Stroke: Between
1,339 in Utah to 2,898 in West Virginia
nH
ypertension: Between 1,427 in Utah to
2,512 in Maine
nA
rthritis: Between 849 in Utah to 1,382 in
Maine
nO
besity-Related Cancer:
Utah to 277 in Maine
Between 101 in
More information about these five top obesityrelated health problems is provided in the following section.
27
Health Care Costs
The national analysis found combined medical
costs associated with treating preventable obesity-related diseases are estimated to increase by
between $48 billion and $66 billion per year in
the United States by 2030 — while the loss in
economic productivity could be between $390
billion and $580 billion annually by 2030.60
n 16 states and Washington, D.C., could expect
increases between 15 percent and 20 percent;
In the state-by-state review, the analysis found
that if obesity rates continue on their current
track, obesity-related health care costs are on a
course to increase significantly in most states:
Many states that currently have lower obesity
rates, such as Colorado and New Hampshire,
stand to see the largest increases in obesity-related costs if obesity continues to grow on its
current trajectory.
n New Jersey could see an increase of more
than a third (34.5 percent);
n Eight states could see increases between 20
percent and 30 percent — New Hampshire
(28.7 percent), Colorado (28.5 percent),
Alaska (25.7 percent), Georgia (24.3 percent), Virginia (23.8 percent), Washington
(21.6 percent), Maryland (21.3 percent) and
Vermont (20.3 percent);
28
n 18 states could expect increases between 10
percent and 15 percent; and
n Only seven states could have increases lower
than 10 percent.
Reducing average BMI by 5 percent by 2030
could significantly reduce health care costs
around the country. Every state except Florida
would save between 6.5 percent and 7.8 percent
in obesity-related health costs. (The impact on
Florida, which could see a 2.1 percent reduction, would likely be less significant because of
the older demographics in the state.)
New Cases by 2030
State
New Diabetes
Cases by 2030
(per 100,000)
Rank New Cancer Cases Rank New CHD & Stroke Rank New Hypertension Rank
(per
by 2030 (per
(per
Cases by 2030
(per
Cases by 2030
(per
100,000)
100,000)
100,000)
(per 100,000)
100,000)
(per 100,000)
100,000)
New Arthritis
Cases by 2030
(per 100,000)
Rank
(per
100,000)
13
Alabama
13,777
9
4,169
9
30,376
8
26,782
10
17,039
Alaska
9,648
49
3,034
50
20,785
50
21,258
50
14,501
50
Arizona
11,239
42
3,358
45
23,405
44
22,356
47
14,942
45
Arkansas
13,000
18
3,950
20
28,548
18
25,512
26
16,484
25
California
10,078
48
3,320
46
22,365
47
22,360
46
14,783
49
Colorado
10,146
47
3,443
43
22,979
46
23,592
43
15,371
44
Connecticut
11,524
37
4,130
12
28,320
20
26,281
17
16,677
20
Delaware
13,360
13
4,217
8
29,936
9
27,039
8
16,922
14
DC
9,346
50
3,288
48
21,229
49
21,989
49
14,892
47
Florida
12,816
19
4,561
3
32,471
3
27,611
5
17,138
9
Georgia
11,405
40
3,311
47
23,032
45
23,286
44
15,519
42
Hawaii
11,031
45
3,791
31
26,121
38
24,174
42
15,486
43
Idaho
11,156
43
3,400
44
23,845
42
22,605
45
14,894
46
Illinois
11,856
34
3,639
41
25,304
41
24,420
38
15,975
36
Indiana
12,497
25
3,737
33
26,801
32
24,925
31
16,181
31
Iowa
12,007
33
3,933
21
28,018
21
24,996
29
16,150
32
Kansas
12,809
20
3,703
38
26,803
31
24,838
34
16,022
35
Kentucky
13,596
10
4,034
16
29,257
14
26,909
9
17,132
10
30
Louisiana
13,238
14
3,718
36
26,723
34
24,870
33
16,267
Maine
14,507
3
4,897
1
34,833
2
30,508
1
18,725
1
Maryland
12,720
21
3,825
30
26,433
37
25,538
25
16,617
24
22
Massachusetts
11,313
41
4,045
15
27,214
27
25,858
21
16,639
Michigan
13,997
5
4,002
19
28,941
15
26,450
15
17,249
8
Minnesota
11,411
39
3,642
40
25,550
40
24,549
36
15,808
39
Mississippi
13,945
6
3,729
35
27,346
24
25,233
28
16,372
27
Missouri
14,032
4
4,016
18
29,291
13
26,373
16
16,918
15
Montana
12,639
22
4,287
7
30,542
6
27,080
7
17,063
11
Nebraska
12,225
30
3,706
37
26,672
35
24,211
41
15,741
41
Nevada
11,443
38
3,670
39
25,796
39
24,361
39
15,806
40
New Hampshire
13,850
8
4,363
5
30,933
5
28,959
3
18,146
3
New Jersey
11,012
46
3,492
42
23,661
43
24,687
35
16,078
34
New Mexico
12,146
31
3,850
28
26,875
29
24,515
37
15,972
37
New York
11,612
36
3,915
23
26,806
30
25,450
27
16,332
28
North Carolina
12,604
24
3,759
32
26,638
36
24,994
30
16,289
29
North Dakota
11,641
35
3,913
25
27,836
22
24,925
31
16,098
33
Ohio
13,851
7
4,079
13
29,441
12
26,742
13
17,058
12
Oklahoma
13,525
12
3,879
27
28,516
19
25,579
23
16,373
26
21
Oregon
12,078
32
3,922
22
27,245
26
25,555
24
16,666
Pennsylvania
13,586
11
4,340
6
31,110
4
27,338
6
17,376
7
Rhode Island
13,215
15
4,149
10
28,655
17
26,754
12
17,497
5
South Carolina
13,156
16
4,023
17
28,886
16
25,993
18
16,687
19
South Dakota
12,278
29
3,737
33
27,013
28
24,317
40
15,844
38
Tennessee
14,673
2
4,066
14
29,625
10
26,778
11
17,449
6
Texas
11,107
44
3,158
49
22,156
48
22,160
48
14,791
48
Utah
8,658
51
2,468
51
16,730
51
17,790
51
12,504
51
Vermont
12,322
28
4,430
4
30,429
7
27,823
4
17,608
4
Virginia
12,607
23
3,890
26
27,309
25
25,976
19
16,780
18
Washington
12,366
27
3,829
29
26,758
33
25,769
22
16,639
22
West Virginia
15,208
1
4,796
2
35,519
1
30,092
2
18,720
2
Wisconsin
12,408
26
3,914
24
27,658
23
25,880
20
16,785
17
Wyoming
13,005
17
4,149
10
29,564
11
26,632
14
16,892
16
29
Total Health Care Costs 2030
State
Alabama
Percentage of Potential
Increase in Obesity-Related
Health Care Costs by 2030
on Current Course
Rank for Potential
Increase in ObesityRelated Health Care
Costs by 2030
Percentage of Potential
Potential Savings by 2020 Potential Savings by 2030
Savings by 2030 if State
if State Reduced Average if State Reduced Average
Reduced Average
BMI by 5% (cumulative) BMI by 5% (cumulative)
BMI by 5%
12%
34th
$3,381,000,000
$9,481,000,000
7.1%
Alaska
25.7%
4th
$573,000,000
$1,530,000,000
6.5%
Arizona
11.1%
41st
$4,775,000,000
$13,642,000,000
7.5%
Arkansas
9.6%
45th
$2,157,000,000
$6,054,000,000
7.6%
California
15.7%
22nd
$28,886,000,000
$81,702,000,000
7.6%
Colorado
28.5%
3rd
$3,792,000,000
$10,794,000,000
7.1%
Connecticut
15.7%
22nd
$2,626,000,000
$7,370,000,000
7.0%
Delaware
14.0%
28th
$701,000,000
$1,912,000,000
7.3%
DC
18.8%
15th
$364,000,000
$1,026,000,000
6.7%
Florida
3.3%
50th
$12,541,000,000
$34,436,000,000
2.1%
Georgia
24.3%
5th
$7,963,000,000
$22,743,000,000
7.7%
Hawaii
12.3%
38th
$976,000,000
$2,704,000,000
7.1%
Idaho
12.0%
36th
$1,195,000,000
$3,280,000,000
7.3%
Illinois
16.1%
21st
$9,852,000,000
$28,185,000,000
7.5%
Indiana
13.0%
32nd
$5,020,000,000
$13,400,000,000
7.1%
Iowa
3.7%
49th
$2,059,000,000
$5,702,000,000
7.1%
Kansas
11.2%
43rd
$2,188,000,000
$5,979,000,000
7.7%
Kentucky
17.6%
17th
$3,376,000,000
$9,437,000,000
7.3%
Louisiana
12.8%
39th
$3,657,000,000
$9,839,000,000
7.3%
Maine
19.0%
12th
$1,019,000,000
$2,870,000,000
7.1%
Maryland
21.3%
7th
$4,935,000,000
$13,836,000,000
7.6%
Massachusetts
19.1%
10th
$5,045,000,000
$14,055,000,000
7.2%
Michigan
19.0%
12th
$8,710,000,000
$24,187,000,000
7.7%
Minnesota
15.7%
26th
$4,189,000,000
$11,630,000,000
7.3%
Mississippi
11.7%
40th
$2,270,000,000
$6,120,000,000
6.9%
Missouri
13.9%
31st
$4,718,000,000
$13,368,000,000
7.9%
Montana
13.0%
32nd
$715,000,000
$1,939,000,000
6.9%
Nebraska
6.7%
47th
$1,334,000,000
$3,686,000,000
7.5%
Nevada
18.2%
14th
$2,095,000,000
$5,921,000,000
7.3%
New Hampshire
28.7%
2nd
$1,158,000,000
$3,257,000,000
7.1%
New Jersey
34.5%
1st
$471,000,000
$1,391,000,000
7.4%
New Mexico
11.8%
42nd
$1,483,000,000
$4,095,000,000
7.3%
New York
14.8%
29th
$14,097,000,000
$40,017,000,000
7.2%
North Carolina
17.6%
17th
$7,633,000,000
$21,101,000,000
7.5%
North Dakota
1.9%
51st
$413,000,000
$1,177,000,000
7.2%
Ohio
15.2%
25th
$9,628,000,000
$26,328,000,000
7.6%
Oklahoma
10.8%
44th
$2,755,000,000
$7,444,000,000
7.2%
Oregon
17.3%
16th
$2,791,000,000
$7,938,000,000
7.3%
Pennsylvania
9.1%
46th
$8,774,000,000
$24,498,000,000
7.1%
Rhode Island
19.9%
11th
$855,000,000
$2,478,000,000
7.6%
South Carolina
12.6%
35th
$3,319,000,000
$9,309,000,000
7.4%
South Dakota
3.6%
48th
$569,000,000
$1,553,000,000
7.6%
Tennessee
17.8%
20th
$4,928,000,000
$13,827,000,000
7.6%
Texas
17.1%
19th
$19,386,000,000
$54,194,000,000
7.7%
Utah
13.7%
30th
$2,122,000,000
$5,843,000,000
7.8%
Vermont
20.3%
9th
$487,000,000
$1,376,000,000
7.3%
Virginia
23.8%
6th
$6,266,000,000
$18,114,000,000
7.4%
Washington
21.6%
8th
$5,201,000,000
$14,729,000,000
7.4%
West Virginia
12.0%
36th
$1,346,000,000
$3,638,000,000
6.8%
Wisconsin
14.7%
27th
$4,148,000,000
$11,962,000,000
7.4%
Wyoming
15.6%
24th
$389,000,000
$1,088,000,000
7.3%
30
Potential Percent Growth in Obesity-Related Health Care Costs by 2030
if the Current Trajectory Continues (By Percent)
WA
ND
MT
MN
VT
OR
ID
WY
UT
IL
CO
KS
MO
OK
AZ
TX
WV
TN
AR
LA
PA
OH
KY
CA
NM
IN
NH
MA
NY
MI
IA
NE
NV
ME
WI
SD
VA
NJ
DE
MD
DC
CT
RI
NC
SC
MS
AL
GA
n <5%
n >5% & <10%
n >10% & <15%
n >15% & <20%
n >20% & <25%
n >25% & <30%
n >30%
FL
AK
HI
Projected Obesity-Related Health Care Costs 2010 to 2030
Orange: If Obesity Continues to Rise on Its Current Trajectory
Blue: If BMI is Reduced by 1 Percent
Red: If BMI is Reduced by 5 Percent
Predicted BMI-related direct health costs; 0%, 1%, and 5% reduction in absolute BMI
630000
620000
$ million
610000
600000
590000
580000
570000
560000
550000
year
2012
2017
2022
— 0% reduction
2027
— 1% reduction
— 5% reduction
31
CURRENT ECONOMIC COSTS OF OBESITY
n As a person’s BMI increases, so do the numHealth Care Costs
n The medical cost of adult obesity in the
United States is difficult to calculate but estimates range from $147 billion to nearly $210
billion per year.61В The bulk of the spending is
generated from treating obesity-related diseases such as diabetes.62
s Of the $147 billion, Medicare and Medicaid
are responsible for $61.8 billion. Medicare
and Medicaid spending would be 8.5 percent and 11.8 percent lower, respectively,
in the absence of obesity.63
s Obese people spend 42 percent more on
health care costs than healthy-weight people.64
n Childhood obesity alone is responsible for
$14.1 billion in direct costs.65
n Annually, the average total health expenses
for a child treated for obesity under Medicaid
is $6,730, while the average health cost for all
children covered by Medicaid is $2,446. The
average total health expenses for a child treated
for obesity under private insurance is $3,743,
while the average health cost for all children
covered by private insurance is $1,108.66
n Hospitalizations of children and youths with a
diagnosis of obesity nearly doubled between
1999 and 2005, while total costs for children
and youth with obesity-related hospitalizations
increased from $125.9 million in 2001 to $237.6
million in 2005, measured in 2005 dollars.67
n In California alone, the economic costs of
overweight, obesity and physical inactivity are
estimated at $41 billion a year.68
Decreased Worker Productivity and
Increased Absenteeism
n Obesity-related job absenteeism costs $4.3
billion annually.69
n Obesity is associated with lower productivity
while at work (presenteeism), which costs
employers $506 per obese worker per year.70
32
ber of sick days, medical claims and health
care costs associated with that person.71
Higher Workers’ Compensation
Claims
n A number of studies have shown obese
workers have higher workers’ compensation
claims.72, 73, 74, 75, 76, 77
n Obese employees had $51,091 in medical
claims costs per 100 full-time employees,
compared with only $7,503 in medical claims
costs for healthy-weight workers. And obese
workers had $59,178 in indemnity claims
costs per 100 full-time employees, compared
with only $5,396 in indemnity claims costs for
healthy-weight employees.78 Indemnity claims
are those where an insurer agrees to cover
the cost of losses suffered by the insured and
can include medical payments and payment
for lost time by the injured worker. В Occupational Health and Safety Costs
n Emergency responders and health care
providers face unique challenges in
transporting and treating the heaviest
patients. According to one study, the number
of severely obese (BMI > 40) patients
quadrupled between 1986 and 2000 from one
in 200 to one in 50. The number of superobese (BMI > 50) patients grew by a factor of
five, from one in 2,000 to one in 400.79
n A typical ambulance outfitted with equipment
and two emergency medical technicians
(EMTs) that can transport a 400-pound
patient costs $70,000. A specially outfitted
bariatric ambulance that can transport patients
weighing up to 1,000 pounds costs $110,000.80
n A standard hospital bed can hold 500
pounds and costs $1,000. A bariatric
hospital bed that can hold up to 1,000
pounds costs $4,000.81
B. FIVE TOP OBESITY-RELATED HEALTH ISSUES
The NHF study commissioned by RWJF and
TFAH examined the potential future rates —
and related costs — of five of the leading health
problems related to obesity if trends continue
on their current track versus if average adult
BMI was reduced by 5 percent in every state.
1. TYPE 2 DIABETES AND OBESITY
Potential Diabetes Cases Avoided by 2030 if BMI is Reduced by 5 Percent
(cases per 100,000 population)
WA
ND
MT
MN
VT
WI
SD
OR
ID
WY
NE
NV
UT
IL
CO
KS
MO
OK
NM
TX
AL
Over a 10-year period, the number of adults in
the United States ages 18–79 with newly diagnosed diabetes more than tripled from 493,000
in 1980 to more than 1.7 million in 2010.86
About 1.9 million people aged 20 years or older
were newly diagnosed with diabetes in 2010.87
Approximately 215,000 individuals under the
age of 20 have diabetes.88 Two million adolescents ages 12–19 have pre-diabetes.89
CT
RI
NC
GA
FL
HI
More than 25 million adult Americans have diabetes.83 Another 79 million Americans are prediabetic, which means they have elevated blood
sugar levels that can contribute to the development of diabetes.84 CDC projects that as many
as one in three U.S. adults could have diabetes
by 2050, and the analysis in this report shows
the numbers could top 31 percent by 2030.85
VA
NJ
DE
MD
DC
SC
MS
AK
Diabetes is the seventh leading cause of death in
the United States and accounts for $174 billion
in total U.S. health care costs.82
WV
TN
AR
LA
PA
OH
KY
CA
AZ
IN
NH
MA
NY
MI
IA
ME
n <2300
n >2300 & <2500
n >2500 & <2700
n >2700 & <2900
n >2900 & <3100
n >3100
Being overweight or obese significantly increases an individual’s risk of type 2 diabetes.
More than 80 percent of people with type 2
diabetes are overweight.90 Excess weight decreases the effectiveness of insulin, a hormone
that transports sugar from blood to cells. When
insulin doesn't work correctly, too much sugar
stays in the bloodstream. To make up for this,
the cells that produce insulin must produce
more of the hormone. This process may lead
the cells to deteriorate more quickly, exacerbating the development of diabetes.91, 92
People with type 2 diabetes have higher-thannormal levels of glucose, a source of sugar that
humans produce by metabolizing carbohydrates, in their blood. High blood sugar contributes to a range of serious health problems,
including heart disease, stroke, kidney disease,
circulatory problems, neurological problems
and eye damage.
33
Nutrition, Physical Activity, Weight Loss and Diabetes
The National Institute of Diabetes and Digestive and Kidney Diseases (NIDDK) found that
a 7 percent weight loss together with moderate
levels of physical activity (walking 30 minutes a
day, five days a week) decreased the number of
new type 2 diabetes cases by 58 percent among
people at risk for diabetes. 93 While the lifestyle changes in nutrition and activity through
the Diabetes Prevention Program (DPP) reduced the incidence of type 2 diabetes by 58
percent, drug therapy reduced the incidence
by only 31 percent.94
Physical activity and weight loss both increase
insulin sensitivity, which increases the body’s
ability to transport sugar from the bloodstream
to cells. A healthy diet, with recommended levels of fruits, vegetables and grains and a limited
amount of saturated fats and sweets, can also
help reduce the severity of the illness.95, 96, 97
Diabetes Management and Teens: Study Finds Discouraging Results
Because type 2 diabetes previously was considered to be an adult condition, there are few studies evaluating how to treat young people with the
disease. New research in the New England Journal of Medicine examined various treatments for
controlling blood sugar in teens. Results showed
that nearly half of participants failed in controlling
the disease, and one in five suffered serious complications within a few years of diagnosis.98 The
results highlight the importance of preventing
type 2 diabetes in the first place.
The research focused on nearly 700 overweight
and obese teens recently diagnosed with type
2 diabetes. Teens were placed in one of three
treatment groups and followed for four years.
One group took metformin, another took metformin plus diet and exercise counseling, and the
final group was given metformin plus a second
drug, Avandia. Results showed that half in the
metformin group failed to maintain blood sugar
control, but the outcomes for the other two
groups were not much better.99
Where You Live Matters: Moving to Higher-Income Areas Reduces
Risk of Obesity and Diabetes for Poor Women
Between 1994 and 1998 the U.S. Department
of Housing and Urban Development (HUD)
randomly assigned families living in public housing
projects in high-poverty neighborhoods into an
experimental and control group. The experimental group was given vouchers to move to higherincome neighborhoods, and the control group
did not receive vouchers. Findings of the study,
which were released in the New England Journal of
34
Medicine, revealed that having the option to move
to lower-poverty neighborhoods lowered the risk
of obesity and diabetes among poor women.100
Women who were given the vouchers were
almost one-fifth less likely to become extremely
obese and were one-fifth less likely to develop
diabetes compared with women who were not
offered the housing voucher.101
Diabetes Costs and Cases
State
2010
Number of
Cases
Alabama
Alaska
Arizona
Arkansas
California
Colorado
Connecticut
Delaware
DC
Florida
Georgia
Hawaii
Idaho
Illinois
Indiana
Iowa
Kansas
Kentucky
Louisiana
Maine
Maryland
Massachusetts
Michigan
Minnesota
Mississippi
Missouri
Montana
Nebraska
Nevada
New Hampshire
New Jersey
New Mexico
New York
North Carolina
North Dakota
Ohio
Oklahoma
Oregon
Pennsylvania
Rhode Island
South Carolina
South Dakota
Tennessee
Texas
Utah
Vermont
Virginia
448,912
50,843
496,106
265,417
2,694,595
333,206
267,944
79,275
40,312
1,722,611
754,593
105,063
119,270
1,014,097
544,815
262,746
239,691
394,029
398,422
120,878
469,294
483,855
861,006
410,004
284,269
535,793
83,849
152,276
214,217
108,764
607,689
173,054
1,516,923
820,118
58,887
1,012,377
337,823
313,737
1,135,646
82,811
429,273
70,269
594,871
1,962,059
164,385
50,472
644,975
661,673
69,728
728,569
381,937
3,798,591
519,150
412,641
121,193
57,758
2,442,415
1,119,425
151,655
176,821
1,525,779
814,420
367,691
367,777
594,058
605,617
192,680
741,358
745,248
1,382,370
609,902
415,353
843,420
126,162
225,263
311,630
182,570
971,386
252,907
2,260,299
1,217,093
79,617
1,599,091
512,801
467,643
1,731,248
138,930
615,599
101,181
939,564
2,851,687
243,915
77,189
1,020,739
13,777
9,648
11,239
13,000
10,078
10,146
11,524
13,360
9,346
12,816
11,405
11,031
11,156
11,856
12,497
12,007
12,809
13,596
13,238
14,507
12,720
11,313
13,997
11,411
13,945
14,032
12,639
12,225
11,443
13,850
11,012
12,146
11,612
12,604
11,641
13,851
13,525
12,078
13,586
13,215
13,156
12,278
14,673
11,107
8,658
12,322
12,607
9
49
42
18
48
47
37
13
50
19
40
45
43
34
25
33
20
10
14
3
21
41
5
39
6
4
22
30
38
8
46
31
36
24
35
7
12
32
11
15
16
29
2
44
51
28
23
Potential Cases
Avoided by 2020
if Average BMI
Reduced by 5%
(cumulative)
72,185
7,892
79,411
41,337
420,642
54,596
42,682
13,017
6,155
260,135
123,475
15,879
19,384
167,300
89,021
40,851
39,537
63,793
66,884
19,949
79,731
77,206
147,056
65,368
45,988
90,942
13,156
24,784
34,232
18,692
103,119
26,569
241,952
134,610
8,809
174,329
56,835
49,676
185,919
14,308
68,972
11,166
102,390
321,447
27,327
8,000
106,956
550,296
844,602
12,366
27
90,361
Washington
New Diabetes Rank New Cases
New Diabetes
Cases by 2030 by 2030 (per
Cases by 2030
(per 100,000)
100,000)
Potential Cost
Savings by 2020,
if Average BMI
Reduced by 5%
(cumulative)
$1,152,000,000
$176,000,000
$1,739,000,000
$722,000,000
$9,747,000,000
$1,247,000,000
$887,000,000
$228,000,000
$133,000,000
$4,459,000,000
$2,563,000,000
$319,000,000
$404,000,000
$3,434,000,000
$1,635,000,000
$726,000,000
$741,000,000
$1,104,000,000
$1,212,000,000
$344,000,000
$1,580,000,000
$1,656,000,000
$2,777,000,000
$1,350,000,000
$774,000,000
$1,575,000,000
$234,000,000
$458,000,000
$690,000,000
$385,000,000
$158,000,000
$486,000,000
$4,774,000,000
$2,363,000,000
$150,000,000
$3,075,000,000
$912,000,000
$936,000,000
$3,208,000,000
$297,000,000
$1,099,000,000
$196,000,000
$1,676,000,000
$6,597,000,000
$718,000,000
$160,000,000
$2,122,000,000
$1,680,000,000
Potential Cases
Potential Cost Savings
Avoided by 2030, if
by 2030, if Average
Average BMI Reduced BMI Reduced by 5%
by 5% (cumulative)
(cumulative)
141,297
14,389
154,737
80,530
796,430
108,067
83,932
25,427
11,705
501,976
238,019
31,634
36,677
325,721
170,743
77,783
77,294
124,701
127,455
40,550
158,413
155,532
294,113
127,368
86,347
179,659
26,522
47,577
65,087
38,425
202,357
52,597
473,588
261,785
16,873
342,192
110,522
98,578
366,995
29,889
133,498
21,780
201,257
605,152
50,992
16,193
209,621
$3,672,000,000
$546,000,000
$5,781,000,000
$2,324,000,000
$31,087,000,000
$4,043,000,000
$2,824,000,000
$721,000,000
$433,000,000
$14,074,000,000
$8,324,000,000
$1,051,000,000
$1,274,000,000
$11,141,000,000
$5,160,000,000
$2,287,000,000
$2,390,000,000
$3,503,000,000
$3,882,000,000
$1,114,000,000
$5,211,000,000
$5,436,000,000
$9,067,000,000
$4,367,000,000
$2,472,000,000
$5,084,000,000
$758,000,000
$1,456,000,000
$2,172,000,000
$1,239,000,000
$520,000,000
$1,599,000,000
$15,726,000,000
$7,746,000,000
$491,000,000
$9,899,000,000
$2,950,000,000
$3,089,000,000
$10,318,000,000
$1,018,000,000
$3,548,000,000
$638,000,000
$5,505,000,000
$21,338,000,000
$2,289,000,000
$526,000,000
$6,837,000,000
178,401
$5,534,000,000
West Virginia
191,529
282,164
15,208
1
29,964
$430,000,000
59,669
$1,391,000,000
Wisconsin
470,136
708,716
12,408
26
74,310
$1,442,000,000
147,935
$4,733,000,000
Wyoming
48,566
73,889
13,005
17
7,750
$127,000,000
15,596
$421,000,000
35
2. HEART DISEASE, STROKE AND OBESITY
Potential Chronic Heart Disease & Stroke Cases Avoided by 2030 if BMI is
Reduced by 5 Percent (cases per 100,000 population)
WA
ND
MT
MN
VT
WI
SD
OR
ID
WY
NE
NV
UT
IL
CO
KS
MO
OK
NM
TX
VA
NJ
DE
MD
DC
CT
RI
NC
SC
MS
AL
GA
FL
AK
HI
Being overweight or obese raises the risk of having
high blood pressure, having high levels of harmful
blood fats known as triglycerides and high levels
of low-density lipoprotein (LDL), also known as
“bad cholesterol.” And, it can lead to lower levels
of high-density lipoprotein (HDL), also known as
“good cholesterol.” These conditions can raise the
long-term risk of heart disease or stroke. Excess
body fat can also produce chemicals in the body
that trigger inflammation. Chronic inflammation
WV
TN
AR
LA
PA
OH
KY
CA
AZ
IN
NH
MA
NY
MI
IA
ME
n <2000
n <2000 & <2100
n >2100 & <2200
n >2200 & <2300
n >2300 & <2400
n >2400 & <2500
n >2500
throughout the body, and especially in blood vessels, may increase the risk of heart disease.102
Most cardiovascular disease can be prevented or
at least delayed until old age through a combination of direct medical care and community-based
prevention programs and policies, particularly
those focusing on physical activity and nutrition,
according to a review of more than 200 articles
by the American Heart Association.103
Weight Loss, Physical Activity, Nutrition and Heart Disease and Stroke
For individuals who are overweight or obese, evidence indicates that losing as little as 5 percent
to 10 percent of total weight can reduce the risk
of heart disease and stroke. For someone who
weighs 220 pounds, 5 percent of total weight is
11 pounds. Weight loss may cut risks of heart
disease and stroke by decreasing hypertension,
lowering levels of triglycerides and bad choles-
36
terol, and reducing inflammation, which may
decrease cardiovascular risk. It also reduces the
production of inflammatory chemicals in the
body, and, as a result, reduces cardiovascular
inflammation. In addition, exercise can help by
strengthening the heart and improving blood
flow. A healthy diet also can protect against
heart disease and stroke.104, 105
Coronary Heart Disease & Stroke Costs and Cases
State
2010
Number of
Cases
New CHD &
Stroke Cases
by 2030
Alabama
Alaska
Arizona
Arkansas
California
Colorado
Connecticut
Delaware
DC
Florida
Georgia
Hawaii
Idaho
Illinois
Indiana
Iowa
Kansas
Kentucky
Louisiana
Maine
Maryland
Massachusetts
Michigan
Minnesota
Mississippi
Missouri
Montana
Nebraska
Nevada
New Hampshire
New Jersey
New Mexico
New York
North Carolina
North Dakota
Ohio
Oklahoma
Oregon
Pennsylvania
Rhode Island
South Carolina
South Dakota
Tennessee
Texas
Utah
311,842
29,747
348,694
187,061
1,876,680
231,944
214,986
57,340
29,219
1,412,354
465,535
78,240
85,114
719,649
386,193
206,491
176,438
264,958
274,399
91,512
320,731
375,028
601,065
298,457
183,417
383,542
64,244
116,013
144,554
76,996
398,981
123,330
1,140,661
543,752
46,993
732,181
239,699
225,575
892,129
64,087
289,176
54,373
396,752
1,261,654
113,478
1,458,880
150,217
1,517,230
838,734
8,429,796
1,175,789
1,014,057
271,560
131,194
6,188,174
2,260,639
359,114
377,940
3,256,437
1,746,600
857,998
769,578
1,278,342
1,222,533
462,648
1,540,592
1,792,732
2,858,267
1,365,612
814,504
1,760,591
304,870
491,469
702,508
407,757
2,087,173
559,598
5,217,841
2,572,272
190,379
3,398,949
1,081,186
1,054,888
3,964,312
301,251
1,351,642
222,609
1,896,993
5,688,482
471,321
New CHD & Rank New CHD
Stroke Cases & Stroke Cases
by 2030 (per by 2030 (per
100,000)
100,000)
30,376
20,785
23,405
28,548
22,365
22,979
28,320
29,936
21,229
32,471
23,032
26,121
23,845
25,304
26,801
28,018
26,803
29,257
26,723
34,833
26,433
27,214
28,941
25,550
27,346
29,291
30,542
26,672
25,796
30,933
23,661
26,875
26,806
26,638
27,836
29,441
28,516
27,245
31,110
28,655
28,886
27,013
29,625
22,156
16,730
8
50
44
18
47
46
20
9
49
3
45
38
42
41
32
21
31
14
34
2
37
27
15
40
24
13
6
35
39
5
43
29
30
36
22
12
19
26
4
17
16
28
10
48
51
Potential Cases
Avoided by 2020
if Average BMI
Reduced by 5%
(cumulative)
59,122
6,273
58,537
32,935
321,512
45,232
37,776
10,786
4,721
234,408
87,846
13,363
15,232
129,207
72,338
33,808
31,727
52,389
50,964
17,970
63,295
65,085
117,033
54,304
35,444
73,330
12,018
20,435
26,144
16,082
77,009
21,384
194,652
106,510
7,222
145,120
46,484
40,229
150,111
11,722
56,853
9,246
79,145
230,559
20,030
Potential Cost Savings
Potential Cases
by 2020, if Average
Avoided by 2030, if
BMI Reduced by 5% Average BMI Reduced
(cumulative)
by 5% (cumulative)
$1,627,000,000
$281,000,000
$2,148,000,000
$1,027,000,000
$13,923,000,000
$1,761,000,000
$1,296,000,000
$344,000,000
$165,000,000
$5,913,000,000
$3,735,000,000
$482,000,000
$585,000,000
$4,649,000,000
$2,499,000,000
$940,000,000
$1,051,000,000
$1,656,000,000
$1,723,000,000
$491,000,000
$2,408,000,000
$2,358,000,000
$4,401,000,000
$2,071,000,000
$1,122,000,000
$2,290,000,000
$358,000,000
$629,000,000
$989,000,000
$561,000,000
$220,000,000
$730,000,000
$6,777,000,000
$3,733,000,000
$183,000,000
$4,726,000,000
$1,345,000,000
$1,330,000,000
$3,956,000,000
$394,000,000
$1,682,000,000
$277,000,000
$2,380,000,000
$9,169,000,000
$1,026,000,000
121,749
11,889
114,546
67,867
656,970
95,428
79,528
22,261
9,295
465,385
185,409
26,286
30,146
268,967
140,700
67,065
63,052
107,355
99,640
38,398
129,330
138,075
241,967
111,066
66,897
152,070
23,617
40,796
55,556
35,077
168,660
43,102
410,326
213,310
14,116
293,011
92,323
82,200
312,456
25,063
114,735
17,899
162,325
465,739
37,723
Potential Cost
Savings by 2030,
if Average BMI
Reduced by 5%
(cumulative)
$4,235,000,000
$692,000,000
$5,467,000,000
$2,642,000,000
$35,571,000,000
$4,735,000,000
$3,316,000,000
$871,000,000
$406,000,000
$14,684,000,000
$9,928,000,000
$1,153,000,000
$1,454,000,000
$12,073,000,000
$5,922,000,000
$2,373,000,000
$2,560,000,000
$4,298,000,000
$4,120,000,000
$1,265,000,000
$6,099,000,000
$5,918,000,000
$10,943,000,000
$5,242,000,000
$2,681,000,000
$5,935,000,000
$847,000,000
$1,593,000,000
$2,653,000,000
$1,467,000,000
$610,000,000
$1,782,000,000
$17,296,000,000
$9,360,000,000
$467,000,000
$11,718,000,000
$3,281,000,000
$3,388,000,000
$9,867,000,000
$1,009,000,000
$4,297,000,000
$660,000,000
$6,034,000,000
$23,124,000,000
$2,530,000,000
Vermont
38,031
190,617
30,429
7
6,978
$243,000,000
14,702
$618,000,000
Virginia
442,803
2,211,102
27,309
25
86,796
$3,041,000,000
183,631
$8,114,000,000
Washington
378,316
1,827,582
26,758
33
74,379
$2,575,000,000
151,285
$6,592,000,000
West Virginia
137,761
659,007
35,519
1
26,420
$685,000,000
53,768
$1,658,000,000
Wisconsin
347,847
1,579,761
27,658
23
59,574
$1,968,000,000
123,717
$5,171,000,000
Wyoming
35,021
167,970
29,564
11
6,619
$189,000,000
13,403
$474,000,000
37
3. HYPERTENSION AND OBESITY
Potential Hypertension Cases Avoided by 2030 if BMI is Reduced by 5 Percent
(cases per 100,000 population)
WA
ND
MT
MN
VT
WI
SD
OR
ID
WY
NE
NV
UT
IL
CO
KS
MO
OK
NM
TX
AL
RI
NC
GA
FL
HI
Being overweight or obese can increase risk for
hypertension in a number of ways:
VA
NJ
DE
MD
DC
CT
SC
MS
AK
Hypertension, often known as high blood pressure, can cause damage to an individual’s arteries, heart, brain, kidneys, eyes and other body
functions and can increase an individual’s risk
for heart disease, stroke, kidney damage and
other health problems.106 About 1 in 3 U.S.
adults—an estimated 68 million—have high
blood pressure.107
WV
TN
AR
LA
PA
OH
KY
CA
AZ
IN
NH
MA
NY
MI
IA
ME
n <1900
n >1900 & <2000
n >2000 & <2100
n >2100 & <2200
n >2200 & <2300
n >2300
n Increased activity of the sympathetic nervous
system, which controls some automatic bodily
functions, including blood pressure;
n Increased salt retention and insulin resistance,
both of which can increase blood pressure;
n Increased levels of systemic inflammation,
which can damage blood vessels and lead to
hypertension; and
n Increased risk of sleep apnea, which raises the
risk of high blood pressure.108
Nutrition, Physical Activity and Hypertension
A range of studies have found that reducing
obesity can reduce high blood pressure. Losing
as little as five pounds can reduce hypertension
and may allow people to reduce the amount of
blood pressure medicine they take. Reducing
sodium intake may also reduce the amount of
blood pressure medicine needed. Getting at
least 30 minutes of physical activity several times
38
a week and eating a healthy, lower sodium diet
also can help to lower high blood pressure.
Losing weight lowers blood pressure through a
combination of changes: reduced activity in the
sympathetic nervous system, reduced sodium
intake, reduced systemic inflammation, and a
lowered risk of sleep apnea.109,110
Hypertension Costs and Cases
State
2010
New
Number of Hypertension
Cases
Cases by 2030
Alabama
Alaska
Arizona
Arkansas
California
Colorado
Connecticut
Delaware
DC
Florida
Georgia
Hawaii
Idaho
Illinois
Indiana
Iowa
Kansas
Kentucky
Louisiana
Maine
Maryland
Massachusetts
Michigan
Minnesota
Mississippi
Missouri
Montana
Nebraska
Nevada
New Hampshire
New Jersey
New Mexico
New York
North Carolina
North Dakota
Ohio
Oklahoma
Oregon
Pennsylvania
Rhode Island
South Carolina
South Dakota
Tennessee
Texas
Utah
Vermont
Virginia
1,006,222
113,936
1,176,899
606,605
6,478,109
847,137
708,945
187,986
98,237
4,372,562
1,649,642
264,816
283,475
2,369,745
1,249,620
636,409
558,427
881,343
882,898
296,784
1,083,304
1,258,549
1,934,745
990,242
595,822
1,221,011
212,207
364,659
511,848
263,771
1,438,554
419,506
3,749,386
1,831,530
145,630
2,336,929
765,126
749,127
2,752,209
207,285
961,722
169,415
1,299,689
4,300,252
390,890
128,688
1,512,608
1,286,270
153,635
1,449,229
749,537
8,427,912
1,207,155
941,046
245,280
135,891
5,261,978
2,285,570
332,347
358,286
3,142,673
1,624,343
765,455
713,158
1,175,750
1,137,762
405,204
1,488,428
1,703,405
2,612,251
1,312,110
751,568
1,585,199
270,312
446,122
663,428
381,736
2,177,679
510,457
4,953,893
2,413,521
170,470
3,087,351
969,830
989,454
3,483,650
281,265
1,216,272
200,392
1,714,690
5,689,509
501,184
174,292
2,103,174
26,782
21,258
22,356
25,512
22,360
23,592
26,281
27,039
21,989
27,611
23,286
24,174
22,605
24,420
24,925
24,996
24,838
26,909
24,870
30,508
25,538
25,858
26,450
24,549
25,233
26,373
27,080
24,211
24,361
28,959
24,687
24,515
25,450
24,994
24,925
26,742
25,579
25,555
27,338
26,754
25,993
24,317
26,778
22,160
17,790
27,823
25,976
10
50
47
26
46
43
17
8
49
5
44
42
45
38
31
29
34
9
33
1
25
21
15
36
28
16
7
41
39
3
35
37
27
30
31
13
23
24
6
12
18
40
11
48
51
4
19
Potential Cases
Avoided by 2020
if Average BMI
Reduced by 5%
(cumulative)
60,370
6,562
67,742
34,933
364,104
55,978
43,219
11,575
5,296
235,932
106,004
14,587
17,276
145,937
77,095
34,573
34,943
54,617
55,539
19,113
71,397
75,888
122,761
60,985
35,861
77,117
12,428
21,872
31,999
18,455
100,473
23,821
219,567
113,366
7,667
150,084
46,939
43,442
163,109
12,973
56,291
9,724
83,372
271,638
24,341
7,605
96,997
Washington
1,282,066
1,760,032
25,769
22
83,258
West Virginia
New
Hypertension
Cases by 2030
(per 100,000)
Rank New
Hypertension
Cases by 2030
(per 100,000)
Potential Cost
Savings by 2020,
if Average BMI
Reduced by 5%
(cumulative)
$214,000,000
$36,000,000
$327,000,000
$148,000,000
$1,773,000,000
$274,000,000
$184,000,000
$47,000,000
$26,000,000
$827,000,000
$535,000,000
$64,000,000
$77,000,000
$680,000,000
$334,000,000
$135,000,000
$144,000,000
$219,000,000
$241,000,000
$73,000,000
$338,000,000
$340,000,000
$559,000,000
$286,000,000
$145,000,000
$295,000,000
$49,000,000
$91,000,000
$149,000,000
$83,000,000
$37,000,000
$95,000,000
$992,000,000
$486,000,000
$26,000,000
$621,000,000
$176,000,000
$182,000,000
$609,000,000
$57,000,000
$202,000,000
$38,000,000
$321,000,000
$1,352,000,000
$141,000,000
$34,000,000
$434,000,000
Potential Cases
Avoided by 2030,
if Average BMI
Reduced by 5%
(cumulative)
102,683
10,826
112,018
60,434
698,431
97,935
75,911
18,887
9,665
401,924
184,624
26,740
29,084
258,801
128,579
60,940
57,769
93,198
91,451
33,364
126,707
135,308
211,548
105,240
56,741
133,798
21,391
36,005
53,677
31,320
177,570
40,458
395,338
195,735
13,248
249,255
77,423
77,631
284,931
23,602
101,446
16,721
139,977
472,671
40,202
13,976
175,777
Potential Cost
Savings by 2030,
if Average BMI
Reduced by 5%
(cumulative)
$570,000,000
$94,000,000
$876,000,000
$391,000,000
$5,422,000,000
$759,000,000
$506,000,000
$119,000,000
$72,000,000
$2,175,000,000
$1,492,000,000
$184,000,000
$213,000,000
$1,889,000,000
$864,000,000
$369,000,000
$379,000,000
$576,000,000
$618,000,000
$196,000,000
$930,000,000
$952,000,000
$1,480,000,000
$783,000,000
$357,000,000
$823,000,000
$126,000,000
$238,000,000
$401,000,000
$217,000,000
$104,000,000
$251,000,000
$2,793,000,000
$1,311,000,000
$75,000,000
$1,602,000,000
$451,000,000
$503,000,000
$1,656,000,000
$155,000,000
$568,000,000
$103,000,000
$842,000,000
$3,777,000,000
$393,000,000
$95,000,000
$1,219,000,000
$358,000,000
145,002
$987,000,000
433,914
558,316
30,092
2
25,474
$86,000,000
42,840
$220,000,000
Wisconsin
1,130,359
1,478,205
25,880
20
65,742
$286,000,000
114,692
$777,000,000
Wyoming
118,620
151,312
26,632
14
7,085
$23,000,000
12,119
$68,000,000
39
4. ARTHRITIS AND OBESITY
Potential Arthritis Cases Avoided by 2030 if BMI is Reduced by 5 Percent
(cases per 100,000 population)
WA
ND
MT
MN
VT
WI
SD
OR
ID
WY
NE
NV
UT
IL
CO
KS
MO
OK
NM
TX
WV
TN
AR
LA
PA
OH
KY
CA
AZ
IN
NH
MA
NY
MI
IA
VA
NJ
DE
MD
DC
ME
CT
RI
NC
SC
MS
AL
GA
FL
AK
HI
n <1000
n >1000 & <1100
n >1100 & <1200
n >1200 & <1300
n >1300
Obesity is a known risk factor for the development and progression of osteoarthritis of the
knee and possibly of other joints. Obese adults
are up to four times more likely to develop osteoarthritis of the knee than healthy-weight adults.111
Being overweight or obese puts more stress on
joints and cartilage, and leads to increased deterioration. Increased body fat also triggers the
production of inflammatory chemicals, which
may accelerate the arthritic process.114, 115
Among individuals who have received a doctor’s diagnosis of arthritis, 68.8 percent are
overweight or obese.112 Obesity prevalence is
54 percent higher among adults with arthritis
compared with adults without arthritis.113
Adults with arthritis are significantly less likely
to participate in leisure time physical activity
compared with those without arthritis.116
Arthritis and Weight Loss
For those who are overweight or obese, losing
weight can make a significant difference for arthritis symptoms and for the overall progression
of the disease. Losing as little as 5 percent of
total body weight can reduce the pounding on
knees, hips and lower back, and can reduce the
40
production of inflammatory chemicals that can
worsen pain and speed deterioration.117, 118
For every pound of body weight lost, there is a
4 percent reduction in knee joint stress among
overweight and obese people with osteoarthritis
of the knee.119
Arthritis Costs and Cases
13
50
45
25
49
44
20
14
47
9
42
43
46
36
31
32
35
10
30
1
24
22
8
39
27
15
11
41
40
3
34
37
28
29
33
12
26
21
7
5
19
38
6
48
51
4
18
22
2
Potential Cases
Avoided by 2020
if Average BMI
Reduced by 5%
(cumulative)
31,890
3,845
37,145
19,067
209,567
29,984
20,911
5,633
3,424
117,776
58,793
8,084
8,828
78,116
40,079
18,527
17,199
29,187
29,645
9,457
37,884
40,777
67,553
31,481
19,509
40,031
6,418
11,093
16,667
8,806
48,075
13,701
115,429
62,284
4,001
75,273
23,697
24,122
84,103
7,170
29,432
4,928
44,119
149,683
13,382
4,228
51,899
43,507
13,099
Potential Cost
Savings by 2020,
if Average BMI
Reduced by 5%
(cumulative)
$295,000,000
$55,000,000
$436,000,000
$193,000,000
$2,758,000,000
$347,000,000
$220,000,000
$54,000,000
$38,000,000
$1,013,000,000
$752,000,000
$84,000,000
$101,000,000
$923,000,000
$430,000,000
$176,000,000
$189,000,000
$286,000,000
$327,000,000
$86,000,000
$458,000,000
$439,000,000
$771,000,000
$365,000,000
$191,000,000
$369,000,000
$64,000,000
$116,000,000
$191,000,000
$97,000,000
$40,000,000
$135,000,000
$1,347,000,000
$679,000,000
$39,000,000
$730,000,000
$233,000,000
$251,000,000
$788,000,000
$79,000,000
$278,000,000
$52,000,000
$428,000,000
$1,704,000,000
$190,000,000
$44,000,000
$579,000,000
$477,000,000
$111,000,000
Potential Cases
Avoided by 2030,
if Average BMI
Reduced by 5%
(cumulative)
59,554
6,895
68,326
36,343
387,850
52,652
38,564
10,341
6,582
218,399
108,753
14,834
16,151
149,927
74,684
34,635
33,105
53,350
55,676
18,356
70,406
76,086
126,613
56,923
35,176
75,434
11,948
20,601
30,746
16,807
93,945
25,757
220,151
115,491
7,585
144,774
44,816
47,508
163,746
13,856
58,678
9,625
84,332
270,868
23,918
8,062
104,689
82,370
25,307
Potential Cost
Savings by 2030,
if Average BMI
Reduced by 5%
(cumulative)
$791,000,000
$151,000,000
$1,269,000,000
$561,000,000
$7,865,000,000
$949,000,000
$608,000,000
$143,000,000
$118,000,000
$2,849,000,000
$2,196,000,000
$249,000,000
$286,000,000
$2,730,000,000
$1,200,000,000
$513,000,000
$515,000,000
$790,000,000
$915,000,000
$249,000,000
$1,262,000,000
$1,257,000,000
$2,161,000,000
$1,013,000,000
$521,000,000
$1,082,000,000
$175,000,000
$321,000,000
$540,000,000
$265,000,000
$119,000,000
$391,000,000
$3,718,000,000
$1,942,000,000
$110,000,000
$2,131,000,000
$629,000,000
$754,000,000
$2,267,000,000
$229,000,000
$803,000,000
$145,000,000
$1,201,000,000
$4,891,000,000
$541,000,000
$129,000,000
$1,750,000,000
$1,371,000,000
$308,000,000
16,785
17
34,499
$377,000,000
66,542
$1,091,000,000
16,892
16
3,744
$37,000,000
6,858
$100,000,000
Rank New
New Arthritis
Arthritis Cases
Cases by 2030
by 2030 (per
(per 100,000)
100,000)
2010 Number of
Cases
New Arthritis
Cases by 2030
Alabama
Alaska
Arizona
Arkansas
California
Colorado
Connecticut
Delaware
DC
Florida
Georgia
Hawaii
Idaho
Illinois
Indiana
Iowa
Kansas
Kentucky
Louisiana
Maine
Maryland
Massachusetts
Michigan
Minnesota
Mississippi
Missouri
Montana
Nebraska
Nevada
New Hampshire
New Jersey
New Mexico
New York
North Carolina
North Dakota
Ohio
Oklahoma
Oregon
Pennsylvania
Rhode Island
South Carolina
South Dakota
Tennessee
Texas
Utah
Vermont
Virginia
Washington
West Virginia
988,452
117,391
1,179,621
598,760
6,631,138
875,842
710,198
184,829
103,440
4,225,438
1,707,454
265,338
285,313
2,387,762
1,243,233
628,692
555,211
876,143
877,591
290,329
1,098,166
1,270,472
1,929,807
998,206
589,477
1,207,427
207,585
361,250
512,502
262,518
1,504,360
413,967
3,752,890
1,843,890
141,984
2,316,148
752,463
751,876
2,691,043
208,610
947,357
166,267
1,289,571
4,426,828
410,666
127,660
1,519,490
1,294,975
418,737
818,339
104,801
968,616
484,296
5,571,995
786,503
597,155
153,505
92,032
3,266,082
1,523,222
212,903
236,068
2,055,864
1,054,503
494,563
460,030
748,558
744,189
248,703
968,487
1,096,100
1,703,543
844,916
487,642
1,016,888
170,323
290,050
430,448
239,199
1,418,265
332,573
3,179,056
1,572,931
110,099
1,969,338
620,784
645,284
2,214,204
183,946
780,823
130,568
1,117,321
3,797,542
352,265
110,302
1,358,610
1,136,450
347,324
17,039
14,501
14,942
16,484
14,783
15,371
16,677
16,922
14,892
17,138
15,519
15,486
14,894
15,975
16,181
16,150
16,022
17,132
16,267
18,725
16,617
16,639
17,249
15,808
16,372
16,918
17,063
15,741
15,806
18,146
16,078
15,972
16,332
16,289
16,098
17,058
16,373
16,666
17,376
17,497
16,687
15,844
17,449
14,791
12,504
17,608
16,780
16,639
18,720
Wisconsin
1,124,133
958,720
Wyoming
116,541
95,973
State
41
5. CANCER AND OBESITY
Potential Obesity-Related Cancer Cases Avoided by 2030 if BMI is Reduced by
5 Percent (cases per 100,000 population)
WA
ND
MT
MN
VT
OR
ID
WY
UT
IL
CO
KS
MO
OK
NM
TX
WV
TN
AR
LA
PA
OH
KY
CA
AZ
IN
NH
MA
NY
MI
IA
NE
NV
ME
WI
SD
VA
NJ
DE
MD
DC
CT
RI
NC
SC
MS
AL
GA
FL
AK
HI
n <150
n <150 & <175
n >175 & <200
n >200 & <225
n >225 & <250
n >250 & <275
n >275
Cancer death rates have declined in the United
States in recent years, but the rise in obesity
could change that trend.
n
Approximately 20 percent of cancer in
women and 15 percent of cancer in men is
attributable to obesity.122
Being overweight, obese or physically inactive
can significantly increase a person’s risk of cancer. Approximately one-third of cancer deaths
are linked to obesity or lack of physical activity,
according to the American Cancer Society.120 A
review of 7,000 studies has shown links between
obesity and cancer.121
n Cancer is the second-leading cause of death
in the United States.123
Research has found that obesity may increase the
risk for many types of cancers through increased
levels of some types of hormones (including estrogen, insulin and other tumor growth regulators), chronic hypertension and/or damage
caused by chronic low-level inflammation.124
Obesity Increases Risk for Some Types of Cancer
Type of Cancer
Endometrial (lining of the uterus)
Esophageal
Kidney
Colon
Postmenopausal Breast
42
Estimated Percentage Cancer Cases Caused by Obesity
39 percent
37 percent
25 percent
11 percent
9 percent
Physical Activity and Cancer
On the other hand, physical activity can reduce a
person’s risk for a variety of cancers, including:126
s Colon cancer by 30 percent to 40 percent;
s Breast cancer by at least 20 percent;
s Endometrial (uterine) cancer by 20 percent
to 40 percent; and
s Lung cancer by approximately 20 percent.
Increased activity could prevent nearly 100,000
cases of breast and colon cancer in the United
States each year, according to one analysis of
more than 200 current studies.127
There is also increasing evidence that limiting
the amount of time a person spends sitting during the day, independent of physical activity,
can also decrease the likelihood of developing
obesity, type 2 diabetes, cardiovascular disease
and some forms of cancer.128
And, physical activity also has been shown to
improve survival rates for individuals with colon
and breast cancer and slow the progression of
prostate cancer.129
Nutrition and Cancer
According to the American Cancer Society
Guidelines on Nutrition and Physical Activity
for Cancer Prevention, individuals who maintain a healthy diet are at lower risk for cancer.
According to a review of the research, individuals who eat more processed and red meats,
potatoes, refined grains and sugar-sweetened
beverages and foods are at a higher risk for developing some forms of cancer, while consuming a diet that contains a variety of vegetables
and fruits, whole grains and fish or poultry
or is lower in red and processed meats is associated with lower risks of developing certain
types of cancers.130
Evidence also suggests that weight loss, through
calorie reduction with or without exercise, can
produce a significant reduction in various breast
cancer biomarkers.131 Results from a recent
study showed that weight loss of greater than 5
percent could be associated with a 22 percent
decrease in breast cancer risk.
Breast Cancer and Weight Loss
A randomized 12-month intervention published
in the Journal of Clinical Oncology reveals that
biomarkers associated with postmenopausal
breast cancer can be improved through weight
loss, with or without exercise.132 The study
compared estrogen and androgen levels, which
are both positively associated with risk for
breast cancer,133 between women assigned to
one of four study groups: diet, exercise, diet and
exercise or control group. Results showed that
women in the experimental groups experienced
large and statistically significant reductions in sex
hormones and an increase in sex-hormone binding globulin (SHBG), which reduces bioactivity
of the hormones.134
43
Obesity Related Cancer Costs and Cases
State
Alabama
Alaska
Arizona
Arkansas
California
Colorado
Connecticut
Delaware
DC
Florida
Georgia
Hawaii
Idaho
Illinois
Indiana
Iowa
Kansas
Kentucky
Louisiana
Maine
Maryland
Massachusetts
Michigan
Minnesota
Mississippi
Missouri
Montana
Nebraska
Nevada
New Hampshire
New Jersey
New Mexico
New York
North Carolina
North Dakota
Ohio
Oklahoma
Oregon
Pennsylvania
Rhode Island
South Carolina
South Dakota
Tennessee
Texas
Utah
Vermont
Virginia
Washington
West Virginia
Wisconsin
Wyoming
44
2010 Number
of Cases
79,581
7,892
87,125
47,390
505,825
64,932
58,115
14,714
8,417
352,183
126,027
21,062
21,778
189,693
99,188
51,477
44,590
68,075
69,400
23,721
86,375
102,436
150,809
77,233
46,018
96,772
16,490
29,132
37,310
20,353
110,882
32,920
306,188
142,818
11,572
185,989
59,906
58,349
227,588
17,094
75,148
13,490
101,301
328,379
29,834
10,273
118,372
99,240
33,990
89,046
9,068
Rank New
New Cancer New Cancer
Cancer Cases
Cases by Cases by 2030
by 2030 (per
2030
(per 100,000)
100,000)
200,226
21,927
217,683
116,050
1,251,371
176,171
147,883
38,254
20,320
869,214
324,982
52,119
53,889
468,312
243,537
120,441
106,322
176,260
170,092
65,041
222,932
266,466
395,245
194,660
111,069
241,389
42,793
68,288
99,946
57,513
308,035
80,166
762,062
362,984
26,762
470,919
147,073
151,854
553,041
43,619
188,245
30,796
260,360
810,806
69,529
27,751
314,958
261,522
88,983
223,559
23,573
4,169
3,034
3,358
3,950
3,320
3,443
4,130
4,217
3,288
4,561
3,311
3,791
3,400
3,639
3,737
3,933
3,703
4,034
3,718
4,897
3,825
4,045
4,002
3,642
3,729
4,016
4,287
3,706
3,670
4,363
3,492
3,850
3,915
3,759
3,913
4,079
3,879
3,922
4,340
4,149
4,023
3,737
4,066
3,158
2,468
4,430
3,890
3,829
4,796
3,914
4,149
9
50
45
20
46
43
12
8
48
3
47
31
44
41
33
21
38
16
36
1
30
15
19
40
35
18
7
37
39
5
42
28
23
32
25
13
27
22
6
10
17
33
14
49
51
4
26
29
2
24
10
Potential Cases
Avoided by 2020
if Average BMI
Reduced by 5%
(cumulative)
4,947
434
6,223
2,732
29,023
3,684
2,900
1,125
371
24,965
6,380
1,210
1,474
11,325
6,387
3,460
2,527
4,151
3,934
1,886
5,537
6,851
9,382
5,024
2,591
6,852
868
1,935
2,369
1,318
6,616
1,978
14,794
9,174
739
12,469
3,981
3,678
15,674
1,041
5,007
832
7,236
20,540
1,747
614
5,506
5,669
2,375
4,341
574
Potential Cost
Savings by 2020,
if Average BMI
Reduced by 5%
(cumulative)
$95,000,000
$26,000,000
$123,000,000
$76,000,000
$689,000,000
$160,000,000
$37,000,000
$23,000,000
$6,000,000
$328,000,000
$382,000,000
$27,000,000
$29,000,000
$163,000,000
$122,000,000
$84,000,000
$62,000,000
$118,000,000
$156,000,000
$27,000,000
$156,000,000
$250,000,000
$203,000,000
$118,000,000
$34,000,000
$186,000,000
$17,000,000
$41,000,000
$82,000,000
$31,000,000
$13,000,000
$39,000,000
$206,000,000
$371,000,000
$19,000,000
$475,000,000
$83,000,000
$89,000,000
$217,000,000
$29,000,000
$52,000,000
$8,000,000
$124,000,000
$560,000,000
$47,000,000
$9,000,000
$89,000,000
$107,000,000
$33,000,000
$75,000,000
$11,000,000
Potential Cases
Avoided by 2030,
if Average BMI
Reduced by 5%
(cumulative)
9,846
809
9,983
5,347
52,769
7,624
6,374
1,923
667
43,451
12,073
2,323
2,710
23,036
10,883
5,849
4,939
8,651
7,640
3,679
10,841
13,109
18,370
8,338
4,795
13,704
1,637
3,243
4,521
2,715
13,232
3,665
29,392
17,382
1,272
22,974
7,128
7,240
28,162
2,092
9,124
1,467
14,151
34,918
2,845
1,222
13,764
11,748
4,379
7,882
1,068
Potential Cost Savings
by 2030, if Average
BMI Reduced by 5%
(cumulative)
$213,000,000
$51,000,000
$249,000,000
$145,000,000
$1,766,000,000
$313,000,000
$118,000,000
$47,000,000
$7,000,000
$656,000,000
$812,000,000
$74,000,000
$51,000,000
$353,000,000
$256,000,000
$160,000,000
$132,000,000
$277,000,000
$302,000,000
$53,000,000
$339,000,000
$489,000,000
$540,000,000
$230,000,000
$79,000,000
$438,000,000
$46,000,000
$79,000,000
$164,000,000
$65,000,000
$31,000,000
$72,000,000
$481,000,000
$742,000,000
$38,000,000
$977,000,000
$126,000,000
$200,000,000
$393,000,000
$68,000,000
$88,000,000
$8,000,000
$246,000,000
$1,061,000,000
$92,000,000
$12,000,000
$195,000,000
$239,000,000
$57,000,000
$187,000,000
$21,000,000
C. ADDITIONAL HEALTH AND OBESITY ISSUES
In addition to the five health issues examined in
the NHF analysis, obesity increases the risk for
a number of other health problems. Some key
areas reviewed in the following section include:
children and maternal health with a special focus
on breastfeeding, mental health and neurological conditions with a special focus on dementia,
kidney and liver diseases and HIV/AIDS.
1. Maternal Health and Obesity
n There is a growing body of evidence documenting the links between maternal health conditions, including obesity and chronic diseases, and
increased risks before, during and after birth.135
n Children born to obese mothers are twice
as likely to be obese and to develop type 2
diabetes later in life.136
n Many pregnant women are overweight, obese,
or have diabetes, all of which can have negative effects on the fetus as well as the mother.
According to CDC, approximately 50 percent
of women of child-bearing age (between 18
and 44) were either overweight or obese in
2002 and 9 percent had diabetes.137
n Teenage mothers who are obese before pregnancy are four times more likely than their
healthy-weight counterparts to develop gestational diabetes, a form of diabetes that arises
during pregnancy and increases a woman’s risk
of developing type 2 diabetes later on.138
n CDC and the Kaiser Permanente Northwest
Center for Health Research found in a recent
study that obesity during pregnancy is associated with an increased use of health care services and longer hospital stays.139 The study of
more than 13,000 pregnancies found that obese
women required more outpatient medications,
were given more obstetrical ultrasounds, and
were less likely to see nurse midwives or nurse
practitioners in favor of physicians. Cesarean
delivery rates were 45.2 percent for extremely
obese women, compared with 21.3 percent for
healthy-weight women.140
45
2. Breastfeeding and Obesity Prevention: For The Health Of The Child And The Mother
Only Two States Meet
Breastfeeding Goals
Children who are breastfed have lower rates
of obesity; this is especially true for those who
are breastfed exclusively, without formula
supplementation.141 Breastfeeding also is associated with a range of other benefits, and
the American Academy of Pediatrics (AAP),
the American Academy of Family Physicians,
the Academy of Breastfeeding Medicine, the
World Health Organization, the United Nations Children’s Fund and many other health
organizations recommend exclusive breastfeeding for the first six months of life.
However, according to CDC’s 2012 Breastfeeding Report Card, only 16.3 percent of
mothers in the United States are breastfeeding exclusively through six months, which is
well below the Healthy People 2020 goal of
25.5 percent.142 Only two states, Colorado
and Oregon, meet this goal.
States with the Highest Rates of Exclusive
Breastfeeding at 6 Months
Rank
State
1
2
3
4
5
6
7
8
9
10
Colorado
Oregon
Utah
New Hampshire
Vermont
Idaho
New Mexico
South Dakota
California
Alaska
Percentage Breastfeeding
Exclusively at 6 Months (2009)
26.6%
26.3%
24.8%
24.7%
23.3%
23.2%
22.8%
22.1%
21.7%
21.0%
Obesity Ranking
51
31
45
35
37
30
34
23
46
28
*Note: For rankings, 1 = Highest rate of breastfeeding.
States with the Lowest Rates of Exclusive
Breastfeeding at 6 Months
Rank
State
51
49 (tie)
49 (tie)
47 (tie)
47 (tie)
46
45
44
43
42
Mississippi
Alabama
West Virginia
Kentucky
Louisiana
Oklahoma
Arkansas
Ohio
Nevada
Montana
Percentage Breastfeeding
Exclusively at 6 Months (2009)
7.6%
9.1%
9.1%
9.6%
9.6%
10.4%
10.6%
11.0%
11.7%
12.5%
Obesity Ranking
1
4
3
10
2
6
7
13
42
41
*Note: For rankings, 51 = Lowest rate of breastfeeding.
Evidence from a comprehensive review of existing breastfeeding
research found that breastfeeding has the following effects:143
nF
or the child: reduced risk of ear, skin, stomach and respiratory infections, diarrhea, sudden infant death syndrome,
necrotizing enterocolitis, and other bacterial and viral infections; and in the longer term, reduced risk of obesity,
type 1 and 2 diabetes, asthma, celiac disease, inflammatory
bowel disease and childhood leukemia.144
n For the mother: quicker loss of pregnancy weight, prevention
of postpartum bleeding and reduced risk of breast cancer,
ovarian cancer, type 2 diabetes and postpartum depression.145
The AAP recommends that babies are breastfed through the
first year of life.146
Breast milk provides a baby with food that is nutritious and
easy for the baby to digest. It also gives the baby the ability to
decide when to eat and when to stop eating, allowing for the
baby to develop healthy eating patterns. Keeping a baby at a
healthy weight from infancy is important because recent studies have shown that overweight babies are more at risk for
being overweight or obese throughout childhood.147
46
A recent study at Children’s Hospital in Boston and Harvard Medical School found that feeding an infant solid food before 4 months
of age may increase the baby’s risk of becoming obese as a toddler.148 The study included almost 900 infants; about two-thirds
were breastfed for at least four months.149 Follow-up at age 3
revealed that 9 percent of the toddlers were obese.150 Results
showed that among formula-fed babies, those that were introduced to solid foods before 4 months of age were six times more
likely to be obese by age 3, but timing of solid food introduction
was not associated with obesity among the breastfed babies.151
In conjunction with the release of the Let’s Move campaign in
2010, the U.S. Breastfeeding Committee (USBC) released a
statement highlighting the importance of including breastfeeding
as part of the national strategy to reduce childhood obesity.152
Data from the National Immunization Survey shows that approximately 75 percent of new mothers begin breastfeeding, but only
43 percent are still breastfeeding at all at six months.153 According
to USBC chair, Dr. Joan Younger Meek, “The duration of breastfeeding has been shown to be inversely related to overweight—
meaning that the longer the duration of breastfeeding, the lower
the odds of overweight. And although further research is needed,
exclusive breastfeeding appears to have a stronger protective effect than breastfeeding combined with formula feeding.”154
Surgeon General’s Call to Action to Support Breastfeeding
In an effort to make breastfeeding easier for
women, the U.S. Surgeon General has identified 20 key actions to improve support for
breastfeeding.155
Some key barriers to breastfeeding include:156
n Lack of Knowledge
n Lactation Problems
n Poor Family and Social Support
n Social Norms
n Embarrassment
n Employment and Child Care
n Health Services
In order to address some of the barriers to
breastfeeding the Surgeon General suggests the
following actions by various key stakeholders:157
Mothers and Families
n Give mothers the support they need to
breastfeed.
n Develop programs to educate fathers and
grandmothers about breastfeeding.
Communities
n Strengthen programs that provide motherto-mother support and peer counseling.
n Use community-based organizations to
support and promote breastfeeding.
n Create a national campaign to promote
breastfeeding.
n Ensure that the marketing of infant formula
is conducted in a way that minimizes its
negative impacts on exclusive breastfeeding.
Health Care
n Ensure that maternity care practices around
the United States are fully supportive of
breastfeeding.
n Develop systems to guarantee continuity of
skilled support for lactation between hospitals
and health care settings in the community.
n Provide education and training in breastfeeding for all health professionals who care
for women and children.
n Include basic support for breastfeeding as
a standard of care for midwives, obstetricians, family physicians, nurse practitioners
and pediatricians.
n Ensure access to services provided by International Board Certified Lactation Consultants.
n Identify and address obstacles to greater
availability of safe banked donor milk for
fragile infants.
Employment
n Work toward establishing paid maternity
leave for all employed mothers.
n Ensure that employers establish and maintain
comprehensive, high-quality lactation
support programs for their employees.
n Expand the use of programs in the workplace that allow lactating mothers to have
direct access to their babies.
n Ensure that all child care providers accommodate the needs of breastfeeding mothers
and infants.
Research and Surveillance
n Increase funding of high-quality research on
breastfeeding.
n Strengthen existing capacity and develop
future capacity for conducting research on
breastfeeding.
n Develop a national monitoring system to
improve the tracking of breastfeeding rates
as well as the policies and environmental
factors that affect breastfeeding.
Public Health Infrastructure
n Improve national leadership on the promotion and support of breastfeeding.
47
3. Mental Health, Neurological Conditions and Obesity
n Obesity may increase adults’ risk for dementia. A review of 10 published studies found
that people who were obese at the beginning
of the studies were 80 percent more likely to
develop Alzheimer’s disease than those adults
who had a normal weight at enrollment.158
n An analysis of data from a health survey of
more than 40,000 Americans found a correla-
tion between depression and obesity. Obese
adults were more likely to have depression,
anxiety and other mental health conditions
than healthy-weight adults.159 The odds of
experiencing any mood disorder rose by 56
percent among obese individuals (30 < BMI
< 39.9) and doubled among the extremely
obese (BMI > 40).160
Growing Evidence Suggests Link Between Obesity and Dementia
During the past 10 years there has been
a growing body of research that suggests
overweight and obesity are associated with
reduced cognitive function, markers of brain
degeneration and increased risk of Alzheimer’s disease later in life.
Many of the studies linking obesity with dementia found that individuals with visceral
fat, better known as belly fat, during midlife
were the most at risk. A few notable studies
include the following:
n In a 2008 National Institute of Aging funded
study, researchers conducted a longitudinal
analysis of more than 6,500 members of
Kaiser Permanente of Northern California who had their midsections measured
between 1964 and 1973. Diagnoses of dementia were found from medical records an
average of 36 years later. Results showed
that midsection obesity in midlife increases
risk of dementia independent of diabetes
and other cardiovascular diseases.161
nR
esearchers in South Korea released findings in 2012 of their study investigating
the connection between visceral adiposity, belly fat and risk of brain decline. The
study measured BMI and waist sizes and
tested cognitive abilities of 250 participants
48
between 60 and 70 years old. Researchers
found that those with the highest BMIs and
largest waists scored the poorest on the
cognitive tests.162
n In Neurology, researchers found that being
overweight or obese during middle age may
increase the risk of dementia. The study
included more than 8,500 twins from the
Swedish Twin Registry age 65 or older.
The participants were grouped according
to their weight, which had been measured
30 years earlier. Results showed that those
who were overweight or obese at middle
life had an 80 percent higher risk of developing dementia, Alzheimer’s disease, or
vascular dementia in late life compared with
the twins with normal BMIs.163
A wide range of studies have found that physical activity and maintaining a healthy weight
help limit a person’s risk for Alzheimer’s
and cognitive decline at any age.164 According to Ronald Petersen, MD, director of the
Alzheimer’s Research Center at the Mayo
Clinic: “Regular physical exercise is probably
the best means we have of preventing Alzheimer’s disease today, better than medications, better than intellectual activity, better
than supplements and diet.”165
Study: Stress and Obesity
Studies have shown that low socioeconomic
status and job stress, both of which are related to chronic stress, are associated with
abdominal obesity.166
In an effort to more closely examine the
relationship between stress and abdominal
obesity, a recent randomized control study
looked at the effects of stress reduction interventions on abdominal fat among a group
of overweight or obese women. The study
did not find a significant difference in weight,
abdominal fat or cortisol awakening response
(CAR), which is a marker revealing stress
levels, between the treatment and control
groups, but it did find significant differences
among obese participants.167 Obese women
in the treatment group significantly reduced
CAR and maintained body weight while
women in the control group had stable CAR
and gained weight.168
Sleep and Obesity
A 2012 study released in the journal Sleep
provides additional evidence supporting the
connection between lack of sleep and obesity.169 In an effort to see the role genes play
in our weight, researchers measured BMI of
more than 600 pairs of identical twins and
examined how it varied based on sleep patterns. They also examined almost 500 fraternal
twins for comparison, since identical twins
share all genes and fraternal share only some.
Results showed that among participants who
were getting less than seven hours of sleep
per night, genes played more than twice the
role in determining body weight than in those
who were getting more than nine hours of
sleep per night.170 Researchers were unable to
determine why sleep has this effect on obesity
genes, but suggest that less sleep may provide
a more permissive environment for the expression of obesity genes, or that more sleep may
be protective by suppressing obesity genes.171
4. Kidney Disease and Obesity
n Obese individuals are 83 percent more likely
to develop kidney disease than normal-weight
individuals, while overweight individuals are 40
percent more likely to develop kidney disease.172
n An estimated 24.2 percent of kidney disease
cases among U.S. men and 33.9 percent of cases
among women are related to overweight and
obesity.173
5. Liver Disease and Obesity
n Obese individuals are at greater risk of nonalcoholic steatohepatitis (NASH), a liver disease that
can lead to cirrhosis, in which the liver is permanently damaged and scarred and no longer
able to work properly. NASH ranks as one of
the major causes of cirrhosis in America, behind
hepatitis C and alcoholic liver disease.174
n NASH affects 2 percent to 5 percent of
Americans. An additional 10 percent to 20
percent have fat in their liver, but no inflammation or liver damage, a condition called
“fatty liver.” Both types of liver disease have
become more common as obesity rates have
risen in the country.175
49
6.HIV/AIDS and Obesity
n Antiretroviral treatments are less effective for
obese patients. One study found that obese
individuals had significantly smaller gains in
CD4 cell count after starting HIV treatment
than both patients of normal weight and those
who were overweight.176
WEIGHT BIAS AND QUALITY OF LIFE
As obesity rates have gone up in the United States,
Weight Bias in Health Care
so, too, has the prevalence of weight discrimination. Researchers at the Yale University Rudd
Center on Food Policy and Obesity report weight
discrimination has increased by 66 percent over
the past decade in the United States and is now
found at rates similar to racial discrimination.177,178
Weight bias and discrimination are found in all areas
of life, including the workplace, health care facilities,
schools and universities, mass media and personal
relationships. Stigmatization of obese individuals
threatens health, generates health disparities and
interferes with obesity-intervention efforts.179 Researchers at the Rudd Center published a comprehensive review of articles on the stigma of obesity
in January 2009.180 A selection of documented findings on obesity bias and stigma are listed below.
Weight Bias In Employment
n In one survey of overweight and obese
women, 25 percent of participants said they
experienced on-the-job discrimination because of their weight, 54 percent reported
stigma from co-workers, and 43 percent experienced stigma from their supervisors.181
n A 2007 study of more than 2,800 adults found
that overweight adults were 12 times more
likely to report weight-based employment
discrimination, obese adults were 37 times
more likely, and severely obese adults were
100 times more likely.182
n Compared with job applicants with the same
qualifications, obese applicants are rated more
negatively and are less likely to be hired.183
n Overweight people earn between 1 percent
and 6 percent less than non-overweight people in comparable positions.184
50
n More than 50 percent of primary care physicians
surveyed viewed obese patients as awkward,
unattractive, ugly and noncompliant. One-third
of the doctors surveyed described obese patients as weak-willed, sloppy and lazy.185
s Surveys of nurses,186 medical students,187
fitness professionals188 and dieticians189 revealed similar biases.
n A study investigating parents’ perceptions of
words and descriptions used by health providers explaining a child’s excess weight found
that describing a child as “obese,” “extremely
obese,” and “fat” were the most undesirable,
stigmatizing, blaming and least motivating,
whereas “weight,” “unhealthy weight,” and
“weight problem” were the most desirable
and motivating descriptions.190
Weight Bias in Education
n Teachers view overweight students as untidy, more emotional, less likely to succeed
on homework and more likely to have family
problems.191 They also have lower expectations for overweight students.192
Physical and Emotional Health
Consequences of Weight Bias
n Weight bias is associated with psychological
consequences, including depression,193 lower
levels of self-esteem194 and body image dissatisfaction.195
n Weight bias also is associated with unhealthy
eating behaviors,196 physical activity levels197
and cardiovascular health outcomes.198
Strategies And Policy
Approaches To Improving
Nutrition, Increasing Activity
And Reducing Obesity
3
Section
A
ccording to CDC, more than half of Americans live with a chronic disease,
many of which are related to obesity, poor nutrition and physical inactivity
— and a majority of these diseases could be prevented.199
A wide range of evidence-based studies have
found that effective disease prevention programs in schools, neighborhoods and workplaces can reduce obesity rates, improve
nutrition and increase physical activity.
As the evidence about what works continues to build,
many states and communities across the country are
working to implement promising approaches for
improving health and reducing obesity. The following section includes strategies and policy trends in
states, an overview of federal approaches toward obesity prevention in the past few years, and examples
of prevention in action in communities, workplaces,
faith-based organizations and schools.
A. STATE OBESITY-RELATED LEGISLATION
Since 2003, TFAH and RWJF have tracked state
obesity-related legislation relating to schools, including nutrition, physical education, physical
activity, and height and weight measurements.
The report also has tracked legislation related
to tax policy, menu labeling, obesity liability
and Complete Streets initiatives. This section
provides an updated summary of legislation enacted between June 1, 2011, and June 30, 2012.
1. Legislation for Healthy Schools
Studies show that school-based programs can
help prevent and reduce obesity.200 The more
than 14,000 school districts in the country have
primary jurisdiction for setting local school policies. States can set education policy or pass legislation, but school districts typically can decide
what policies they follow or implement, a principle known as local control. States often try
to create incentives for districts to follow their
policies, such as attaching compliance rules to
state funding. For example, if a school district
in New Mexico fails to meet the academic content and performance standards for elementary
physical education programs, it would result
in the cessation of funding for the following
school year to the offending district.201
Over the past decade, school-based efforts
have focused on improving the quality of
food served and sold in cafeterias, vending
machines and school stores, limiting sales of
less nutritious foods and beverages, improving
physical and health education, and increasing
physical activity. In addition, in the past few
years, some districts have set up farm-to-school
programs that bring fresh, local produce into
schools, encouraging both healthy eating and
sustainable farming.
51
OBESITY-RELATED STANDARDS IN SCHOOLS – 2012
States
Alabama
Nutritional
Standards for
School Meals
3
Nutritional
Standards for
Competitive
Foods
3
Limited Access
to Competitive
Foods
Physical
Education
Requirement
3
Alaska
Physical
Activity
Requirement
Health
Education
Requirement
Farm-to-School
Program
3
3
3
3
3
3
BMI or Health
Info Collected
Arizona
3
3
3
3
Arkansas
3
3
3
3
3
California
3
3
3
3
3
Colorado
3
3
3
3
3
Connecticut
3
3
3
3
3
Delaware
DC
3
3
3
3
3
3
3
3
3
3
3
3
Georgia
3
3
3
3
3
3
3
3
3
3
Idaho
3
3
3
Florida
Hawaii
3
Non-Invasive
Screening for
Diabetes
3
3
3
3
3
3
3
Illinois
3
3
3
3
Indiana
3
3
3
3
Iowa
3
3
Kansas
3
3
3
3
3
3
3
3
3
3
3
Kentucky
3
3
3
3
3
3
3
Louisiana
3
3
3
3
3
3
3
3
Maine
3
3
3
3
3
3
3
Maryland
3
3
3
3
3
3
3
3
Massachusetts
3
3
3
3
Michigan
3
3
Minnesota
3
3
Mississippi
3
3
3
3
3
Missouri
3
3
3
Montana
3
3
3
3
3
3
3
3
Nebraska
Nevada
3
3
New Hampshire
New Jersey
3
New Mexico
3
Oklahoma
3
3
3
3
3
3
3
3
3
3
3
3
3
3
3
3
3
3
3
3
3
3
3
3
3
3
3
3
3
Oregon
3
3
3
Pennsylvania
3
3
3
Rhode Island
3
3
South Carolina
3
3
South Dakota
3
Tennessee
3
3
Texas
3
3
Utah
Vermont
3
3
3
3
3
3
3
3
3
3
3
3
3
3
3
3
3
3
3
3
3
3
3
3
3
3
3
3
3
3
3
3
3
3
3
North Dakota
Ohio
3
3
3
New York
North Carolina
3
3
3
3
Virginia
3
3
3
3
Washington
3
3
3
3
West Virginia
3
3
3
3
3
3
3
Wisconsin
3
3
Wyoming
3
3
# of States
20 + D.C.
35 + D.C.
29 + D.C.
50 + D.C.
12
21
2
48 + D.C.
Please Note: Checkmarks in chart above that are in red type represent new laws passed 2011 or 2012.
52
3
28 + D.C.
SCHOOL MEALS
The foods and beverages available in schools
have a significant impact on children’s diets, contributing more than 35 percent of many students’
daily caloric intake.202 In 2010, Congress passed
the Healthy, Hunger-Free Kids Act, which included many provisions to improve student
health. Most notable was the charge to USDA
to update nutrition standards for school meals
and competitive foods. USDA released updated
standards for the National School Lunch Program and School Breakfast Program earlier this
year, which will impact tens of millions of students who participate in those programs. These
improvements, which are the first changes to
national school meal standards in more than 15
years, will be phased in over a three-year period
beginning with the 2012-2013 school year with
schools having the flexibility to focus on changes
to the lunch menu. Changes during the first year
will include increased servings of fruits and vegetables, increasing the amount of whole grains and
phasing to only fat-free and low-fat milk at lunch.
The new national standards for school meals will
supersede the state laws at that time, but states
will still be able to retain stronger standards if
they have those in place.
The USDA is required to oversee the transition to healthier school meals, and schools that
comply will be eligible for increased federal reimbursements for school meals.
n Eight years ago, only four states had
school meal standards that were stricter
than the old USDA requirements: Arkansas, South Dakota, Tennessee and Texas.
n Today, 20 states and Washington, D.C.
have stricter standards than the old USDA
requirements: Alabama, Arizona, Arkansas,
California, Colorado, Connecticut, Kentucky,
Louisiana, Massachusetts, Mississippi, Nevada,
New Jersey, North Carolina, Oklahoma, Rhode
Island, South Carolina, South Dakota, Tennessee, Texas, and Vermont.
No state updated regulations regarding school
meals between June 1, 2011, and June 30, 2012.
2012 NATIONAL SCHOOL MEAL STANDARDS
Below is a comparison of current and new requirements to the National School Lunch Program (the final rule also includes requirements
for school breakfast and nutrient standards
not shown below).
The current requirements will be replaced with
new national requirements, which are being
phased in over three years starting during the
2012-2013 school year. States with standards
that are stronger than the new national standards will be able to retain those standards.
Food Group
Current Requirements
Fruits and
Vegetables
ВЅ - Вѕ cup of fruit and vegetables Вѕ - 1 cup of vegetables plus ВЅ - 1 cup of fruit per day
combined per day
New Requirements
Vegetables
No specifications as to type of
vegetable subgroup
Weekly requirements for: dark green, red/orange,
beans/peas, starchy, others (as defined in 2010
Dietary Guidelines)
Meat/Meat
Alternate
1.5 – 2 ounce equivalent (daily
minimum) (oz eq. min.)
Daily minimum and weekly ranges:
Grades K-5: 1 oz eq. min. daily (8-10 oz weekly)
Grades 6-8: 1 oz eq. min. daily (9-10 oz weekly)
Grades 9-12: 2 oz eq. min. daily (10-12 oz weekly)
Grains
8 servings per week (minimum
of 1 serving per day)
Daily minimum and weekly ranges:
Grades K-5: 1 oz eq. min. daily (8-9 oz weekly)
Grades 6-8: 1 oz eq. min. daily (8-10 oz weekly)
Grades 9-12: 2 oz eq. min. daily (10-12 oz weekly)
Whole Grains
Encouraged
At least half of the grains must be whole grain-rich
beginning July 1, 2012. Beginning July 1, 2014, all
grains must be whole grain-rich.
Milk
1 cup; Variety of fat contents
allowed; flavor not restricted
1 cup; Must be fat-free (unflavored/flavored) or 1%
low fat (unflavored)
Source: Food and Nutrition Service, USDA. Ounce equivalent (oz eq.) means the having the same nutritional value as in a standard ounce of that food group. http://www.fns.usda.gov/cnd/Governance/Legislation/comparison.pdf (accessed March 6, 2012).
53
Increasing Fruit and Vegetable Consumption at School
through Salad Bars
In an effort to increase the amount of fruits
and vegetables consumed by children, the
Food Family Farming Foundation, National
Fruit and Vegetable Alliance, United Fresh
Produce Association Foundation, and Whole
Foods Market put forth the initiative Let’s
Move Salad Bars to Schools to support First
Lady Michelle Obama’s Let’s Move! initiative.
Evidence shows that children consume more
fruits and vegetables, and try new foods,
when they have a variety of choices like those
provided on salad bars.203 But few schools take
advantage of salad bars, whether for lack of
knowledge or due to financial constraints. In
order to increase children’s access to salad
bars at schools, any school that participates
in the National School Lunch Program can
apply for a grant that helps to pay for salad
bar equipment. The Let’s Move Salad Bars
to Schools program hopes to fund and award
6,000 salad bars by the end of 2013.204
GOT WATER?
Research shows that children are not drinking
enough water during the school day.205 Although water fountains have been available in
most schools for decades, there are issues that
discourage students from drinking water at
school. For example, many schools do not have
enough water fountains to supply all of the students, and most schools do not make cups available to encourage students to take more water
from the fountains. The cost of providing cups
may be a barrier in some schools.206
In addition, encouraging students to drink free
water decreases revenue from bottled water
sales, which often fund extracurricular activities.207 Issues with water quality, such as complaints about taste or excessive lead content,
also prevent students in some districts from
drinking water at school.
But evidence shows that making water more
available to students can increase water
consumption and improve health. The Healthy,
Hunger-Free Kids Act of 2010 requires schools
to provide easily accessible, clean water to
students at no cost. However, some advocates
worry that the law is too vague about how
schools should actually accomplish this. In
an effort to help schools improve quality of
and access to water in schools Change Lab
Solutions has a range of resources and policy
ideas to improve drinking water at schools.
More information can be found at: http://
changelabsolutions.org/publications/wateraccess-schools-model-wellness-policy-language.
n Today two states have water regulations
that make clean water accessible to
students during the school day: California
and Massachusetts.
No state implemented new regulations on water in
schools between June 1, 2011, and June 30, 2012.
Give Them Water and They Will Drink It
A recent study published in Preventing Chronic
Disease found that students will drink more
water if it is made available to them.211 A middle
school in Los Angeles conducted a five-week
program that included providing cold, filtered
drinking water in cafeterias; distributing reusable
water bottles to students and staff; conducting
school promotional activities; and providing edu-
54
cation.212 Researchers measured consumption
of water before the program and at one week
and two months after the completion of the
program at both the intervention school and a
comparison school.213 Students at the intervention school had higher adjusted odds of drinking
water from fountains and reusable water bottles
than the comparison school.214
COMPETITIVE FOODS
The USDA defines competitive foods as any
food or beverage served or sold at school that is
not part of the USDA school meals program.215
These foods are sold in Г la carte lines, in school
vending machines, in school stores, or through
bake sales. In 2012, USDA is expected to publish a proposed rule updating nutrition standards
for “competitive foods.”
The current standards for competitive foods are
more than 30 years old, and the federal government does not regulate products beyond those
classified as foods of minimal nutritional value
(FMNV).216 FMNV are identified by the school
meals program as carbonated beverages, water
ices, chewing gum, hard candy, jellies and gums,
marshmallow candies, fondant, licorice, spun
candy, and candy-coated popcorn.217 As such,
many competitive foods are high in calories, fat,
sugar and sodium. Schools commonly sell sugary
drinks, salty snacks, pizza, ice cream and french
fries, often from multiple venues. Forty percent
of students purchase these snacks on a daily basis,
and, as of the 2009-2010 school year, almost half
of elementary school students could purchase unhealthy competitive foods at school.218
nE
ight years ago only six states had nutritional standards for competitive foods:
Arkansas, California, Hawaii, Tennessee,
Texas and West Virginia.
n Today, 35 states and Washington, D.C.
have nutritional standards for competitive
foods: Alabama, Arizona, Arkansas, California,
Colorado, Connecticut, Delaware, Hawaii,
Illinois, Indiana, Iowa, Kansas, Kentucky,
Louisiana, Maine, Maryland, Massachusetts,
Mississippi, Nevada, New Jersey, New Mexico,
North Carolina, Ohio, Oklahoma, Oregon,
Pennsylvania, Rhode Island, South Carolina,
Tennessee, Texas, Utah, Vermont, Virginia,
Washington and West Virginia.
States that implemented new regulations regarding competitive foods between June 1,
2011, and June 30, 2012:
n Colorado prohibited the availability of any
food or beverage that contains any amount of
industrially produced trans fat or the use of
food that contains any industrially produced
trans fat in the preparation of food or beverages for students (SB 12-068, 2012).
n Delaware banned the sale of any food or
beverage containing industrially produced
trans fat to students in grades K-12 during
the normal or extended school day on school
grounds (HB 3, 2011).
Start time and place standards for competitive
foods include:
n Eight years ago, 17 states had laws
about when and where competitive
foods can be sold that were stricter than
federal requirements: Arkansas, California,
Colorado, Connecticut, Florida, Georgia,
Hawaii, Illinois, Kentucky, Louisiana, Maine,
Mississippi, Nebraska, New York, North
Carolina, Texas and West Virginia.
n Today, 29 states and Washington, D.C.,
have laws that limit when and where
competitive foods may be sold that
exceed federal requirements: Alabama,
Arizona, Arkansas, California, Colorado,
Connecticut, Florida, Georgia, Hawaii, Illinois,
Indiana, Kentucky, Louisiana, Maine, Maryland,
Mississippi, Nebraska, Nevada, New Jersey,
New Mexico, New York, North Carolina,
Oklahoma, Oregon, Pennsylvania, South
Carolina, Texas, Vermont and West Virginia.
No state implemented new regulations regarding
competitive foods between June 1, 2011, and
June 30, 2012.
Strong Support for USDA Competitive Food Standards
Recent polling commissioned by the Kids’ Safe &
Healthful Foods Project, a joint project between
The Pew Charitable Trusts and RWJF, found
strong public support for national standards to
limit calories, fat and sodium in snack and Г la
carte foods sold to students at schools.219
Results from the poll show that 80 percent of
American voters favor national standards for
unhealthy snacks at school, more than 80 percent are concerned about childhood obesity,
83 percent believe foods sold through vending
machines are not really healthy or nutritious,
and 68 percent said food purchased from Г la carte lines and school stores is not really
healthy or nutritious.220
55
Student Health and School Budgets Could Benefit from
Updating Nutrition Standards for Competitive Foods
The Kids’ Safe & Healthful Foods Project and the
Health Impact Project, funded by The Pew Charitable Trusts and RWJF, worked with Upstream
Public Health to conduct a health impact assessment (HIA) of the possible effects of updating
competitive food policies. The HIA assumes that
new guidelines would be required to meet the
2010 Dietary Guidelines for Americans (DGA).
Results of the HIA find that if school competitive
food policies adhered to the 2010 DGA:221
n Student access to, purchase of, and consumption of unhealthy foods and beverages,
and subsequently their risk for disease,
would decrease;
nD
istricts would likely not see a decline in
revenue because children will purchase
school meals if there are fewer items competing for their lunch money; and
56
nV
ulnerable populations would benefit because students from lower-income families
who participate in free and reduced-price
meal programs would be more likely to buy
healthier foods.
Based on findings of the HIA, the Kids’ Safe &
Healthful Foods and Health Impact projects
recommend that the USDA:222
n Establish nutrition standards for all foods
that are regularly sold onsite during the
school day but that are outside of the
USDA meals program;
n Set nutrition guidelines for all beverages
sold on school grounds; and
n Adopt policies and practices that ensure
effective implementation of the standards.
THE FARM-TO-SCHOOL MOVEMENT GROWS
Over the last decade, many cities and towns have developed farmto-school programs, which bring local, fresh fruits and vegetables
to school cafeterias. Often, the programs include farm visits, cooking demonstrations, and the creation of school gardens and composting sites. Some states have laws supporting the practice.
Studies show that these programs improve students’ diets.223
For example, a study by researchers at the University of
California at Davis found that farm-to-school programs not
only increase consumption of fruits and vegetables, but
actually change eating habits, causing students to choose
healthier options at lunch.224 A recent health impact
assessment conducted before the Oregon Farm to School
reimbursement law passed found that the law would
create and maintain jobs for Oregonians, increase student
participation in school meal programs, improve household
food security and strengthen connections within Oregon’s
food economy.225
These programs also increase the use of locally grown foods,
and teach kids about local food and farming issues.
n Twenty-eight states and Washington, D.C. currently
have established farm-to-school programs: Alabama,
Alaska, California, Colorado, Connecticut, Florida, Illinois,
Iowa, Kentucky, Louisiana, Maine, Maryland, Massachusetts,
Michigan, Missouri, Montana, New Jersey, New Mexico,
New York, Oklahoma, Oregon, Pennsylvania, Tennessee, Texas, Vermont, Virginia, Washington and Wisconsin.
Many of these programs cover portions of the students or
schools in these states rather than all of the students or
schools in the state. Six years ago only New York had a
law that established a farm-to-school program.
States that implemented new farm-to-school legislation between June 1, 2011, and June 30, 2012:
n Alabama established the Farm to School Procurement Act,
which mandates a coordination effort between the Department of Education, the Department of Agriculture and Industries to provide local grown food to schools
(HB 670, 2012).
n Maine passed a law requiring that the Department of Agriculture, Food and Rural Resources, the Department of Education and the Department of Marine Resources support
a pilot program to examine the benefits of promoting the
purchasing of food grown or raised and fish raised or caught
by Maine food producers for use in primary and secondary
school meal programs (LD 1446, 2011).
n Missouri created the “Farm-to-Table Advisory Board” to
put forth recommendations to help schools incorporate
locally grown agricultural products into their cafeteria offerings, salad bars and vending machines, and increase public
awareness of local agricultural practices and the role that
local agriculture plays in sustaining healthy communities and
supporting healthy lifestyles (HB 344, 2011).
n New York passed legislation that finances the transportation and distribution of New York state farm grown
products to schools, especially in underserved urban communities (SB 614, 2011).
Farm-to-School Stories
Below are a few examples of what some schools and school districts are doing to increase access to fresh fruits and vegetables:
Minnesota—In Minnesota, a new documentary, “Farm-to-School:
Growing Our Future,” is being aired on public television as well as
at several events around the state. The purpose of the documentary is to help give momentum to the farm-to-school movement.
Among many vignettes, the video shows students helping harvest,
weigh and eventually eat beets from their school garden. The creators of the documentary hope the video will be used as a resource
for the future as each DVD comes with detailed instructions on
holding a community screening, talking about the documentary and
moving forward with ideas for farm-to-school programs.226
Indiana—At Batesville Primary School and High School, students have the opportunity to plant, grow and consume local
vegetables thanks to the farm-to-school program, which is in
its third year. In an effort to generate more interest in gardening, the farm-to-school project coordinator is hosting two
workshops; the first is Green Teen Garden Workshop, which
is free to students, and the second is an annual workshop
called Teaching in the Garden, which is free to local educators.
The Teaching workshop aims to help educators establish farmto-school curriculum for the classroom.227
California—In San Diego, school buses now have more than
one purpose: a “farms on wheels” program will use some
buses as hands-on labs for students to learn more about
agriculture and nutrition to complement the District’s current
farm-to-school program.228
57
PHYSICAL EDUCATION, PHYSICAL ACTIVITY, AND HEALTH EDUCATION
IN SCHOOLS
The 2008 HHS Physical Activity Guidelines for
Americans recommend that children engage in one
hour or more of moderate or vigorous aerobic
physical activity a day, including vigorous physical
activity at least three days a week. Examples of
moderate intensity aerobic activities include hiking,
skateboarding, bicycle riding and brisk walking.
Vigorous-intensity aerobic activities include
bicycle riding, jumping rope, running, soccer,
basketball, and ice or field hockey. According
to the Guidelines, children and adolescents also
should incorporate muscle-strengthening activities,
such as rope climbing, sit-ups and tug-of war, three
days a week.В Finally, bone-strengthening activities,
such as jumping rope, running and skipping, are
recommended three days a week.
A recent Bridging the Gap report found that
many districts have made minor improvements
to their wellness policies, but that physical education has been almost entirely taken out of the
standard curriculum for high schools and physical activity is very low throughout all schools.229
Some key findings included:
n In 2010, 83 percent of middle school students
and 34 percent of high school students were
required to take physical education during the
school year, but it is likely that half of the high
school students only took physical education
for one semester or trimester.
n Only 23 percent of middle school students and
13 percent of high school students walked or
bicycled to school in 2010.
n Only 12 percent to 13 percent of high school
students and 19 percent to 23 percent of middle school students participated in intramural
sports and physical activity clubs in 2010. The
rates were lower for girls than boys.
According to data from the 2011 Youth Risk
Behavior Surveillance System, the percentage of
58
high school students who were physically active
at least an hour on all seven days in the previous
week ranged from 33.1 percent in Oklahoma to
20.8 percent in Utah.230
In recent years, many school systems have eliminated or cut PE. Generally, schools sacrifice
PE to give students more time to prepare for
standardized tests, which are often required by
districts and states.
Physical Education
n Every state has some physical education
requirements for students. However,
these requirements are often limited or
not enforced, and many programs are
inadequate.
States that implemented new laws between June
1, 2011, and June 30, 2012:
n Virginia required that the Board of Education
develop physical education program guidelines
for public elementary and middle schools prior
to January 1, 2014 (HB 1092, 2012).
Physical Activity
n Many states have started enacting laws
requiring schools to provide a certain number
of minutes and/or a specified difficulty level
of physical activity. Twelve states require
schools to provide physical activity or recess
during the school day.
States that implemented new laws between June
1, 2011, and June 30, 2012:
n Connecticut required each school under its
jurisdiction to include in the regular school
day students enrolled in grades kindergarten
through five, time devoted to physical activity
of at least twenty minutes daily (SB 458, 2012).
Physical Activity Breaks
Physical activity breaks are a proven way to increase physical
activity among students as well as enhance academic achievement.231 Researchers found that third and fourth graders who
participated in a physical activity break program took almost
1,000 more steps during the school day than those not enrolled in the program.232 Studies have also shown that these
short active breaks during the day improve elementary school
students’ ability to stay on task during academic work by 20
percent compared to no effect for inactive classroom breaks.233
Implementing state policies requiring physical activity breaks
is one way to increase the amount of daily physical activity for
school students. Many states have started doing this, and following enactment of a law in Texas requiring students to engage in 30 minutes of daily physical activity studies show that
students across the state participated in around 30 percent
more physical activity than the minimum requirement.234
Schools are using a variety of tactics to reach the recommended 30 minutes of physical activity per day for students.
Physical activity breaks often happen in the classroom and
consist of activities such as stretching, yoga or jumping jacks.235
And, many schools use specific physical activity break programs
such as Brain Gym®, Take 10!® and the JAMmin’ Minute®.236
Health Education
Health education curricula often include community health,
consumer health, environmental health, family life, mental and
emotional health, injury prevention and safety, nutrition, personal health, prevention and control of disease and substance
use and abuse. The goal of school health education is to prevent premature deaths and disabilities by improving the health
literacy of students.237
nO
nly two states — Colorado and Oklahoma — do not
require schools to provide health education.
States that implemented new health education rules between
June 1, 2011, and June 30, 2012:
nM
aryland integrated new requirements into the health
curriculum, including the importance of physical activity and
information regarding diabetes, and new requirements for
reporting to the Department of Education (HB 9, 2012).
According to the 2006 CDC study, health education standards
and curricula vary greatly from school to school.238
n The percentage of states that require districts or schools
to follow national or state health education standards increased from 60.8 percent in 2000 to almost 75 percent in
2006; the percentage of districts that required this of their
schools increased from 68.8 percent to 79.3 percent.
n Almost 14 percent of states and 42.6 percent of districts
required each school to have a school health education
coordinator.
PHYSICAL ACTIVITY AND ACADEMIC ACHIEVEMENT
Experts agree that physical activity improves children’s
health. However, most children still do not get enough
physical activity. HHS Physical Activity Guidelines for
Americans recommend children and adolescents engage in
60 minutes or more of physical activity each day.
In 2010, CDC issued Association Between School-based Physical Activity, Including Physical Education, and Academic Performance, a literature review which examined 23 years of research
and 50 studies about the relationship between school-based
physical activity, including physical education, and academic
performance.239 The majority of the studies found that physical
activity was positively related to academic performance and that
adding time during the school day for physical activity does not
appear to take away from academic performance.
Other major findings include:
n Studies show that physical activity can actually improve
children’s brain function. For example, researchers at the
University of Illinois found that nine- and ten-year-olds
who were more physically fit scored better on a series
of cognitive tests than those who were less fit.240 Brain
scans showed that in the fitter kids, a key cognitive area
of the brain had greater volume. The researchers concluded that being fit enhanced the “executive control”
portion of the children’s brains.241
n Children who perform better on physical capacity tests
are more likely to receive higher reading and math
scores, even when the added time for physical activity
takes away from time in the classroom.242
n Intensive physical education programs in school can improve cognitive skills and attitudes, including concentration, attention and classroom behavior.243
n Researchers analyzed FITNESSGRAMВ® test results from
more than 2.4 million Texas students in grades 3 to 12 during the 2007-2008 school year, and found significant schoollevel correlations between physical fitness achievement and
better performance on state standardized tests.244
59
BMI SCREENING AND SURVEILLANCE
As of June 30, 2012, 22 states had legislation that
mandates school-based BMI or other weightrelated screenings in schools. Such assessments
are intended to help schools and communities
assess rates of childhood obesity, educate parents and students, and serve as a means to evaluate obesity prevention and control programs
in that school and community. The American
Academy of Pediatrics (AAP) recommends that
BMI should be calculated and plotted annually
for all youth as part of normal health supervision within the child’s medical home, and the
Institute of Medicine (IOM) recommends annual
school-based BMI screenings.245, 246
n Eight years ago, only four states required
BMI screening or other weight-related
assessments for children and adolescents:
Arkansas, Kansas, Louisiana and Massachusetts.
n Today, 21 states have legislation that
requires BMI screening or weight-related
assessments other than BMI.
s States with BMI screening requirements:
Arkansas, California*, Florida, Illinois, Maine,
Missouri, New York, North Carolina,
Ohio, Oklahoma, Pennsylvania, Tennessee,
Vermont and West Virginia.
s States with other weight-related
screening requirements: Delaware, Iowa,
Louisiana, Massachusetts, Nevada, South
Carolina and Texas.
*Starting July 2010, statewide distribution of
diabetes risk information to schoolchildren,
California Education Code В§ 49452.7, replaced
individual BMI reporting, California Education
Code В§ 49452.6.
Childhood Obesity Rates in New York City Decrease
In 2005, the New York City Department of Education started annually measuring BMI of public
school students in grades K-12 during physical
education classes. Results from this data collection show that obesity decreased among 5-14
year olds by 5.5 percent—from 21.9 percent in
2006-2007 to 20.7 percent in 2010-2011.247
Obesity rates decreased significantly among all
age groups, racial/ethnic groups and neighborhood poverty levels, but some groups saw
more significant improvements than others.
The obesity rate among 5 to 6-year-olds declined by almost 10 percent, which was the
largest drop for any age group. The smallest
60
drop, of 3.2 percent, was observed among 11
to 14-year-olds.248 Obesity rates among White
and Asian/Pacific Islander children decreased by
12.5 percent and 7.6 percent respectively.249
Although obesity rates also dropped significantly among Black and Hispanic children, by
1.9 percent and 3.4 percent respectively, these
declines were smaller than those observed
among other races/ethnicities.250 Children
coming from low poverty neighborhoods had
the greatest decrease in obesity rates of 7.8
percent compared with those coming from
very high poverty neighborhoods that experienced a decrease by 2.9 percent.251
Using Child Care Quality Rating and Improvement Systems (QRISs) to Prevent
Childhood Obesity
Child care facilities can have a major impact on childhood obesity prevention. Second only to the home, child care settings
are where young children spend their time. More than threefifths of children under age 5 are in some type of regular child
care arrangement.252
Recently, states have been incorporating nutrition, physical activity and screen time standards into child care Quality Rating
and Improvement Systems (QRISs).253 QRISs are a voluntary
approach to improving the quality of early care and education programs, and are designed to incentivize improvement
through voluntary, market-driven actions.254 Most states currently use QRISs to improve the quality and education of child
care facilities, but their use has been emerging as a new strategy to improve the quality of health as well.255
Altarum Institute recently put together a report, State Efforts
to Address Obesity Prevention In Child Care Quality Rating
and Improvement Systems, evaluating the current state of
obesity prevention as part of QRISs. The report found many
states are making progress in including nutrition, physical
activity and screen time standards into QRISs, yet there are
many challenges states face in incorporating new standards,
including:256
n Lack of staff training and capacity—staff that currently
provide support to child care facilities lack training and expertise in the topics of nutrition, physical activity and screen
time. The same is true for the raters who assess the quality
of child care facilities. Training would be necessary to bring
them up to speed with the new standards.
n Increased implementation and monitoring costs—
both child care providers and QRIS programs see including
health standards as an increased cost and that they do not
have adequate funding to meet the standards.
nA
bsence of tools and methods to monitor providers’
achievements of standards—existing tools used to rate
child care facilities are not set up to assess the new standards of nutrition, physical activity and screen time.
n Stakeholder resistance—states have experienced
pushback from several stakeholders, including parents and
faith-based entities providing care.
Review: Obesity Prevention Interventions Can Help Children Be Healthier
A review evaluating the effectiveness of obesity prevention
interventions among children found strong evidence showing that the programs helped children make progress toward achieving a healthier body weight. The study included
a review of 55 controlled studies targeting children age 6
to 12 through policies or programs in place for at least 12
weeks. According to the review, the following were cited
as the most promising policies and strategies:257
n School curriculum that includes focus on healthy eating,
physical activity and healthy body image;
n Increased sessions for physical activity and the development of
fundamental movement skills throughout the school week;
n Improvements to nutritional quality of the food supply in
schools;
n Providing an environment and culture that support the
ability of children to make healthier choices and be more
physically active throughout the entire day;
n Support for teachers and other staff to implement health
promotion strategies and activities, such as professional
development and capacity building activities; and
n Encourage parents and other care providers to support
children to be more active, eat more nutritious foods and
spend less time in screen-based activities at home.
The review also found that obesity prevention interventions
aimed at promoting a healthy weight among children were
not associated with increased body image issues, unhealthy
eating or dieting practices, or harmful attitudes about
weight.258 But, the authors note that while they found
strong evidence supporting the programs, the findings must
be interpreted cautiously due to heterogeneity and the
potential for small study bias in the interventions.259 The
study highlights the importance of continued investment
into more obesity prevention studies focused on children,
as well as detailed follow up of interventions to see what
works, for whom and at what cost.
61
Childhood Obesity: Reaching Healthy People Goals Through
Energy Reduction
Healthy People 2010 and Healthy People 2020
both have goals for reducing childhood obesity.
A recent study from the American Journal of Preventive Medicine reveals exactly how many fewer
calories youths have to consume daily in order
to achieve the respective goals.260
Based on NHANES data and previous trends in
obesity prevalence, weight and BMI among youth
ages 2-19, the researchers found that in order
to halt the rising trend in mean body weight it
would be necessary to eliminate 41 calories per
day per capita.261 In order to reach the Healthy
People 2020 goal (to lower childhood obesity by
10% from 2005-2008 levels) it would take a reduction of 64 calories/day per capita.262
The research also revealed that much larger
reductions would be needed among low-income
and racial/ethnic minority youths and adolescents. In order to reach the Healthy People
62
2020 goals by 2020, non-Hispanic black 2-19
year olds would need to reduce daily intake by
138 calories, Mexican-Americans by 91 calories
and lower-income youths by 110 calories.263
Some policy changes to achieve the reduction
suggested by the authors include:264
n Reducing consumption of sugar-sweetened
beverages (SSB) by replacing all SSBs with
water could reduce the per capita caloric intake by 12 calories per day;
n Participating in a comprehensive physical
education program among fourth- to sixthgraders could result in an additional 19
calories expended per day; and
n Engaging in an after-school activity program
for children in grades K-5 could result in an
additional 25 calories expended per day.
2. Obesity-Related Legislation for Healthy Communities
States also have obesity-related legislation aimed at the general population. These actions include
tax policies, menu labeling, restrictions on litigation and planning and transportation policies.
OBESITY-RELATED STATE INITIATIVES -- 2012
State
Alabama
Alaska
Arizona
Arkansas
California
Colorado
Connecticut
Delaware
DC
Florida
Georgia
Hawaii
Idaho
Illinois
Indiana
Iowa
Kansas
Kentucky
Louisiana
Maine
Maryland
Massachusetts
Michigan
Minnesota
Mississippi
Missouri
Montana
Nebraska
Nevada
New Hampshire
New Jersey
New Mexico
New York
North Carolina
North Dakota
Ohio
Oklahoma
Oregon
Pennsylvania
Rhode Island
South Carolina
South Dakota
Tennessee
Texas
Utah
Vermont
Virginia
Has Menu Labeling Laws
Has Soda (Sugar-Sweetened
Beverage) Taxes
3
Has Complete the Streets
Policy
Has Limited Liability Laws
3
3
3
3
3
3
3
3
3
3
3
3
3
3
3
3
3
3
3
3
3
3
3
3
3
3
3
3
3
3
3
3
3
3
3
3
3
3
3
3
3
3
3
3
3
3
3
3
3
3
3
3
3
3
3
3
3
3
3
3
3
3
3
3
3
3
3
3
3
3
3
3
3
Washington
3
West Virginia
3
Wisconsin
Wyoming
# of States
5
3
3
3
3
34 + D.C.
17
3
3
25
Please Note: Checkmarks in chart above that are in red type represent new laws passed 2011 or 2012.
63
SUGAR-SWEETENED BEVERAGE (SSB) TAXES
A number of states have a tax on soda or sugarsweetened beverages. While many states instituted the taxes for revenue purposes, some
proponents of these taxes believe they can have
a health benefit, comparing them to taxes on
tobacco products. Twenty years ago, cigarettes
were taxed at a relatively low rate. Since then
cigarette taxes have tripled, pushing the cost of
cigarettes higher by an average of 160 percent.
Many experts say the increases played a major
role in reducing rates of smoking and tobaccorelated disease.265, 266
n According to Bridging the Gap, a nationally
recognized research program funded by
RWJF, 34 states and Washington, D.C.
now impose sales taxes on soda: Alabama,
Arkansas, California, Colorado, Connecticut,
Florida, Hawaii, Idaho, Illinois, Indiana, Iowa,
Kansas, Kentucky, Maine, Maryland, Minnesota,
Mississippi, Missouri, New Jersey, New
York, North Carolina, North Dakota, Ohio,
Oklahoma, Pennsylvania, Rhode Island, South
Dakota, Tennessee, Texas, Utah, Virginia,
Washington, West Virginia and Wisconsin.267
A number of advocates and policy-makers have
examined the impact of potential federal action
on the issue. Researchers at Yale University
say a national soda tax of a penny per 12
ounces would generate $1.5 billion a year.268
A 2008 Congressional Budget Office (CBO)
report on options to pay for health reform
included a proposal for a federal excise tax of
three cents per 12 ounces of sugar-sweetened
beverage. According to their estimates, this
tax have generated an estimated $24 billion
between 2009 and 2013.269
However, the proposed SSB tax did not gain
widespread support during the 2009-2010
health care debate. Supporters blame a $24
million lobbying and advertising campaign by the
beverage industry, funneled partly through an
industry-funded group called Americans Against
Food Taxes.270
Voters in Richmond, California and El Monte,
California will consider ballot measures for a
one-cent-per-ounce tax on sugar-sweetened
beverages this November.271, 272 The proposed
taxes would require owners of bodegas,
theaters, and other stores to total ounces
sold and then most likely pass the cost on to
customers. If approved, money from the taxes
would go toward fighting childhood obesity
through more bike lanes, nutritional education
and after-school sports programs.273
SSBs and Health
Many studies link increased consumption of
SSBs to negative health outcomes, including
obesity, type 2 diabetes and coronary heart disease.274,275, 276 In the Nurses’ Health Study II, the
risk of diabetes was nearly double for women
who consumed one or more servings of SSBs
per day compared to those who consumed less
than one serving of SSBs per month.277 And,
women were 23 percent more at risk of coronary heart disease when they consumed one
64
serving of SSBs per day, and 35 percent more at
risk when they consumed two servings or more
per day compared to women who consumed
less than one serving per month.278
There is also evidence to suggest that beverages sweetened with noncaloric sweeteners
increase caloric intake through consumption
of other calorie sources or by increasing a
taste for sweets.279
MENU LABELING
Menu labeling — including nutrition information
on menus and menu boards — is based on
the idea that informed consumers make
informed choices. Leading health organizations,
including the American Medical Association,
want labeling that is easy to understand and
includes information about the total calories,
fat, saturated fat, trans fat and sodium content
of food items.280 According to the Yale Rudd
Center for Food Policy and Obesity, 80 percent
of consumers also want this information.281
The Affordable Care Act requires chain restaurants or food establishments (those with 20 or
more locations) to display calorie counts and
other nutritional information for standard menu
items. Companies that own or operate 20 or
more food or beverage vending machines have
similar requirements.
The federal rules, in most cases, will pre-empt
state regulations related to menu labeling.
In recent years, several states and localities have
implemented menu labeling laws:
n Five states — California, Massachusetts,
Maine, New Jersey and Oregon —
currently have laws that require the
posting of nutrition information on menus
and menu boards in restaurant chains
with 20 or more in-state locations. Seattle,
Philadelphia, New York City, Nashville, San
Francisco and Montgomery County, Maryland
also have menu-labeling provisions.
One state updated menu-labeling legislation between June 1, 2011, and June 30, 2012:
n California passed legislation to align the current California state menu labeling law with
the new Federal standards (SB 20, 2011).
Front-of-Pack Labeling at Walmart
In an effort to make it easier for consumers to
identify healthier food items, Walmart recently
unveiled their “Great For You” icon. Walmart,
which is the nation’s largest food retailer, will
include the icon on select Walmart Great Value
and Marketside items. Items that bear the
“Great For You” icon have undergone an exten-
sive evaluation process and must meet nutrition
criteria that, according to Walmart, have been
informed by the 2010 Dietary Guidelines for
Americans, FDA, USDA and IOM. The criteria are available to the public to view online at
www.walmartgreatforyou.com.282
LEGISLATION TO LIMIT OBESITY LIABILITY
Many states have responded to the obesity epidemic through
laws that prevent people from suing restaurants, manufacturers
and marketers for contributing to unhealthy weight and related
health problems. These laws have been prompted by corporations that were concerned about potential obesity-related lawsuits similar to the lawsuits tobacco companies have faced.
n Twenty-five states have obesity liability laws: Alabama, Arizona, Colorado, Florida, Georgia, Idaho, Illinois,
Indiana, Louisiana, Kansas, Kentucky, Maine, Michigan,
Missouri, New Hampshire, North Dakota, Ohio, Oregon,
South Dakota, Texas, Tennessee, Utah, Washington, Wisconsin and Wyoming.
One state implemented obesity liability legislation between
June 1, 2011 and June 30, 2012:
n Alabama established that a packer, distributor, manufacturer, carrier, holder, seller, marketer, or advertiser of food
shall not be subject to any civil action for any claim arising
out of weight gain, obesity, a health condition associated
with weight gain or obesity, or other generally known condition allegedly caused by or allegedly likely to result from
long-term consumption of food (HB 242, 2012).
Proponents of these laws argue that obesity is an individual choice,
a matter of “common sense, and personal responsibility.”283
Opponents of the laws argue that, in some cases, restaurants,
food manufacturers and marketers withhold crucial information
about the dangers of their products, and that lawsuits are an appropriate way to respond to this unethical or illegal behavior.
65
DESIGNING STREETS FOR ALL USERS
To encourage physical activity and green transportation, activities that include walking and cycling, and building or protecting urban transport
systems that are fuel-efficient, space-saving, and
promote healthy lifestyles, many state and local
governments are adopting Complete Streets
policies. Complete Streets are roads designed to
allow all users — bicyclists, pedestrians, drivers
and public transit users — to access them safely.
Many parents and children say that concerns
about traffic safety keep them from walking
to school.284 According to the 2009 National
Household Travel Survey, only 13 percent of
children ages 5–14 usually walked or biked to
school, compared with almost half of students
in 1969.285 Conversely, 12 percent of children
arrived at school by car in 1969, compared with
44 percent in 2009.286
Better traffic safety can promote healthier
living. For instance, a 2003 study found that
43 percent of people with safe places to walk
within 10 minutes of home met recommended
activity levels; just 27 percent of those without
safe places to walk met the recommendation.287
An Australian study found that residents are 65
percent more likely to walk in a neighborhood
with sidewalks.288
A review by the National Conference of State
Legislatures (NCSL) identified the five policies
that most encourage biking and walking: 289
66
1. Incorporating sidewalks and bike lanes into
community design.
2. Providing funding for biking and walking in
highway projects.
3. Establishing safe routes to school.
4. Fostering traffic-calming measures (e.g., any
transportation design to slow traffic).
5. Creating incentives for mixed-use development.
According to the National Complete Streets
Coalition, states, counties, regional governments
and cities have passed more than 350 Complete
Streets policies.
nS
eventeen states have passed Complete
Streets laws: California, Colorado,
Connecticut, Delaware, Florida, Hawaii,
Illinois, Maryland, Massachusetts, Michigan,
Minnesota, New York, Oregon, Rhode Island,
Vermont, Washington and Wisconsin.
One state implemented legislation between June
1, 2011, and June 30, 2012:
n New York established that the state shall
consider the access and mobility on the road
network by all users of all ages, including
motorists, pedestrians, bicyclists and public
transportation users through the use of complete street design features in the planning,
design, construction, reconstruction and rehabilitation of such projects (SB 5411, 2011).
National Policy and Legal Analysis Network (NPLAN) and Food
Marketing to Youth
NPLAN, a project of Change Lab Solutions,
continues to work to provide information and
technical assistance for communities interested in
improving healthy eating and active living. They
focus on four major categories: healthy community food systems, healthy schools, healthy land
use planning and food marketing. NPLAN develops model policies for a variety of topics ranging
from model healthy beverage vending policies to
model physical activity standards for child-care
providers to a model ordinance for produce carts.
NPLAN also recently released a report on digital food marketing to children and adolescents,
Problematic Practices and Policy Interventions.
Research has found most foods that are marketed
toward young people are high in sugars, fat and
salt, and food marketing does have an impact on
what youths consume.290,291 The report notes
that digital marketing is different from previous
forms of marketing in that it is multidimensional
and proliferates a range of social media and online
applications through not only exposing youths to
their product, but also by encouraging adolescents to interact with the product and integrate
the brand into their identity.292
The report takes an in depth look at five categories of digital marketing techniques used by food
marketers to target youths: 293
1. Augmented reality, online gaming, virtual environments, and other immersive techniques
that can induce “flow,” reduce conscious attention to marketing techniques and foster
impulsive behaviors;
2. Social media techniques that include surveillance of users’ online behaviors without notification, as well as viral brand promotion;
3. Data collection and behavioral profiling designed to deliver personalized marketing to
individuals without sufficient user knowledge
or control;
4. Location targeting and mobile marketing,
which follow young peoples’ movements and
are able to link point of influence to point of
purchase; and
5. Neuromarketing, which employs neuroscience methods to develop digital marketing
techniques designed to trigger subconscious,
emotional arousal.
Food Marketing in Maine High Schools
In 2007, Maine became the first state to implement a statewide law prohibiting marketing
of foods of minimal nutritional value on public
school grounds. Yet, a recent study released
by the University of New England found that
marketing of junk food is still widespread in
Maine public schools.294
Researchers surveyed a sample of Maine high
schools, and, while support for the ban was
overwhelming among key administrators, 85
percent of Maine high schools still marketed
unhealthy foods on campus.295 The compliance problem appeared to stem from a lack of
knowledge about the law. In only 15 percent
of the schools, both administrators interviewed had knowledge of the ban on marketing of unhealthy foods and drinks, and fewer
than 50 percent of the schools reported any
changes to food marketing practices since the
ban went into effect in 2007.296 More than
three-quarters of schools reported wanting
more help and technical assistance in order to
meet the requirements of the ban.297
Researchers conducting the assessment also
found the following at the sample high schools
in Maine:298
n Nearly 200 different food and beverage
products were marketed in schools and
each school displayed 49 food or beverage
posters and signs on average;
n There were 28 different noncompliant
food or beverage products marketed in
schools, and a significant portion of those
were promoted in athletic areas and
teachers’ lounges;
n The majority of food and beverage posters
and signs were in cafeterias (52 percent),
athletic areas (16 percent), entrances and
hallways (12 percent) and teachers’ lounges
(12percent); and
n On average, each school had 5.6 vending
machines.
67
B. C
DC COOPERATIVE AGREEMENTS TO STATES FOR OBESITY
PREVENTION AND CONTROL
CDC funds many state and local efforts to prevent and control obesity and related diseases.
Two years ago, through its Communities Putting Prevention to Work (CPPW) program, the
agency awarded $373 million to cities, towns
and rural areas for evidence-based prevention
and wellness programs. More than half of the
funds will go toward obesity prevention efforts.
The table below provides a summary of these grants.
Obesity-Related CDC Cooperative Agreements to States - FY 2011
State
1 While all 50 states
receive some funding
through the CPPW State
and Territorial Initiative, 39
communities in 28 states
receive CPPW Community funding for obesity.
2 Nez Perce Tribe also
receives Coordinated
School Health funding.
3 Most Healthy Communities grants are not directed
to States, but are instead
directed to tribes, local
public health departments,
and community-based
organizations. The states
listed here have at least
one grantee funded by
these programs. Healthy
Communities funds all
States through the Collaborative Funding Opportunity Announcement, but at
a minimal level.
4 REACH U.S. grants are
not directed to States,
but are instead directed
to tribes, local public
health departments, and
community-based organizations. The states listed
here are those have at
least one grantee funded
by these programs. Five
other states *AL, AZ, GA,
IN, WY) have REACH
U.S. grantees whose work
does not directly relate to
prevention and control of
obesity-related diseases.
68
Alabama
Alaska
Arizona
Arkansas
California
Colorado
Connecticut
Delaware
DC
Florida
Georgia
Hawaii
Idaho
Illinois
Indiana
Iowa
Kansas
Kentucky
Louisiana
Maine
Maryland
Massachusetts
Michigan
Minnesota
Mississippi
Missouri
Montana
Nebraska
Nevada
New Hampshire
New Jersey
New Mexico
New York
North Carolina
North Dakota
Ohio
Oklahoma
Oregon
Pennsylvania
Rhode Island
South Carolina
South Dakota
Tennessee
Texas
Utah
Vermont
Virginia
Washington
West Virginia
Wisconsin
Wyoming
# of States
Nutrition, Physical
Coordinated School
Healthy
ARRA Community
Health Grants2 Communities3
Obesity Grants1 Activity & Obesity Grants
3
3
3
3
3
3
3
3
3
3
3
3
3
3
3
3
3
3
3
3
3
3
3
3
3
3
3
3
3
3
3
3
3
3
3
3
3
3
3
3
3
3
3
3
3
3
3
3
3
3
3
3
3
3
3
3
3
3
3
3
3
3
3
3
3
3
3
3
3
3
3
3
3
3
3
3
3
3
3
3
3
3
3
28
25
22
3
3
3
3
3
3
3
3
3
3
3
3
3
3
3
3
3
3
3
3
3
3
3
3
3
3
3
3
3
3
3
3
3
3
3
3
3
3
3
3
3
3
50
REACH
US4
Community
Transformation Grants
3
3
3
3
3
3
3
3
3
3
3
3
3
3
3
3
3
3
3
3
3
3
3
3
3
3
3
3
3
3
3
3
3
3
3
3
3
3
3
3
3
3
3
3
3
3
17
3
3
3
3
3
3
3
36
C. FEDERAL POLICIES AND PROGRAMS
The following section examines key federal laws
and programs affecting obesity.
1. Let’s Move
February 2012 marked the two-year anniversary of
the Let’s Move initiative, launched by First Lady
Michelle Obama to raise awareness about the
dangers of the childhood obesity epidemic and
promote comprehensive, multi-sector solutions.
The initiative emphasizes healthy eating and increased physical activity at school, at home and
in the community. It has brought together public officials, the food industry, faith- and community-based organizations, advocacy groups
and others to find solutions. Two of the most
recent targeted efforts in the past year include:
n Let’s Move! Child Care, launched in June 2011
in partnership with Nemours Foundation,
Partnership for a Healthier America, Bright
Horizons and the National Association of
Child Care Resource and Referral Agencies
(NACCRRA). The effort helps child care
providers implement standards to promote
healthy behaviors and habits for young children — a checklist helps providers to improve physical activity and healthy eating
and limit screen time for children in child
care settings. The practices are based on
evidence-based standards developed by CDC
and largely supported by the public. A 2008
survey by NACCRRA reported that 98 percent of parents thought child care health and
safety standards needed to be improved. Providers and parents can go to www.HealthyKidsHealthyFuture.org for these free tools and
resources and to share success stories. Let’s
Move! Child Care has recognized the efforts of
20 child care programs and networks, including the states of Rhode Island and Idaho.
n Let’s Move! Indian Country, launched in May 2011,
is a partnership to address childhood obesity
on our nation’s Indian reservations within a
generation. The initiative focuses in a culturally
sensitive way on issues specifically related to
nutrition and activity for Native Americans. A
tool kit was produce by a Let’s Move! in Indian
Country interagency workgroup led by the
White House, Domestic Policy Council, the U.S.
Department of Agriculture, the U.S. Department
of the Interior, the U.S. Department of Health
and Human Services, the U.S. Department
of Education, and in collaboration with the
Office of the First Lady, Centers for Disease
Control and Prevention, the U.S. Department
of Transportation and the Corporation for
National and Community Service.
2. Implementation of the Affordable Care Act (Public Law 111-248)
The Affordable Care Act (ACA) includes a number of components that could significantly enhance obesity-prevention efforts, if strategically
implemented and fully funded. Some of these
key aspects include:
n The Prevention and Public Health Fund. Between fiscal years 2010 and 2012, $2.25 billion
has been appropriated from the Prevention
and Public Health Fund to states and community-based organizations to support programs
related to public health improvement and
chronic disease prevention. Despite cuts made
to the Fund by the Middle Class Tax Relief and
Job Creation Act of 2012 (Public Law 112-96),
the Fund will provide for an additional $12.5
billion over the next ten years (FY2013-FY2022).
n Community Transformation Grants (CTGs).
In May 2011, CDC awarded more than $100
million to 61 states and communities and
seven national organizations to implement
and disseminate evidence-based strategies to
address chronic disease to achieve key health
outcomes. Per the direction of Congress, at
least 20 percent of CTG funding is targeted
to rural and frontier populations. In May
2012, CDC announced the availability of an
additional $70 million for a new Small Communities CTG grant program, a two-year grant
opportunity aimed at improving health in
communities with less than 500,000 people.
n The National Prevention Council, the National
Prevention Strategy and the National Prevention Council’s Action Plan. In June 2011, the
National Prevention, Health Promotion, and
Public Health Council (National Prevention
Council)—comprised of representatives from
17 different departments and agencies—released the National Prevention Strategy, the
nation’s first comprehensive action plan for improving the health of all Americans. The Strategy contains a number of recommendations
for addressing the obesity epidemic. The U.S.
Surgeon General and other federal officials
visited various parts of the country to encourage communities to replicate the strategy at the
state and local level by leveraging public and
69
private resources to prevent disease and promote better health. The National Prevention
Council’s Action Plan, released in June 2012,
identifies more than 200 current commitments
the federal government is taking to implement
the Strategy. Included in that list are efforts led
by the USDA to ensure that foods purchased,
distributed or served in federal programs and
settings meet standards consistent with the Dietary Guidelines for Americans.
n Essential Benefits and Coverage of Preventive
Services. All new group benefit plans will be
required to cover any preventive service that
has received an “A” or “B” rating from the
U.S. Preventive Services Task Force (USPSTF), which includes screening for obesity
and many obesity-related diseases such as
type 2 diabetes and hypertension as well as
intensive obesity counseling for both adults
and children. Additionally, there are new
requirements for coverage of preventive services in the Medicare program, including an
annual wellness visit and new covered preventive services for all Medicare beneficiaries.
n Menu Labeling. In April 2011, FDA issued
proposed rules implementing new requirements for chain restaurants, similar retail food
establishments and vending machines to include calorie counts on menu boards and have
additional nutrition information available to
customers upon request. A public comment
period was held later that year, with the regulations expected to be finalized by the end of
2012. According to FDA, about one-third of
all calories consumed by Americans are from
foods prepared outside the home.
3. Implementation of the Healthy, Hunger-Free Kids Act (Public Law 111-296)
n In January 2012, the USDA published a final
rule containing the first update to nutritional
standards for the National School Lunch Program and School Breakfast Program in 15
years. Among other changes, the standards
will help to ensure that students are able to eat:
s Both fruits and vegetables every day of the
school week;
s A greater selection of whole grain-rich
foods;
s Only fat-free or low-fat milk;
s Meals with age-appropriate calorie totals to
ensure proper portion size; and
s Foods with less saturated fats, trans fats and
sodium.
n In 2012, USDA is expected to publish a proposed rule updating nutrition standards for
“competitive foods,” which include snacks
and drinks sold in school vending machines,
stores, or Г la carte lines that are outside the
school meals program. A recent Health Impact Assessment by the Kids’ Safe & Healthful
Foods Project and the Health Impact Project
concluded that updating national standards
for the snacks and drinks sold in school vending machines, stores and Г la carte lines would
reduce students’ consumption of unhealthy
items during the school day.299 The study also
found that consistent national guidelines likely
would encourage more students to buy breakfast and lunch at school, providing schools
with extra revenue. Students in lower-income
communities and Black and Hispanic students
would benefit from stronger standards, which
70
is of particular importance because obesity
rates tend to be higher among such students.
n USDA also is due to issue a proposed rule to update the meal patterns for the Child and Adult
Care Food Program (CACFP), a federal program
that provides subsidized meals to more than 3
million infants from low-income families, children and impaired or older adults. The update
will be based on a consensus report issued by the
Institute of Medicine in November 2010 entitled
Child and Adult Care Food Program: Aligning Dietary Guidance for All. The report noted that current meal pattern nutrition standards are more
than 20 years old and recommended that new
standards should be based on updated dietary
guidelines and promote eating more fruits and
vegetables, whole grains, and other foods that
are low in fat, sugar and salt.
n Finally, USDA is due to issue a proposed rule
in 2012 to help implement expanded requirements regarding school district wellness policies. While all school districts participating
in federal child nutrition programs were required to have a wellness policy in place by the
2006-2007 school year, the law expanded these
policies to help school districts and interested
stakeholders promote student wellness, prevent and reduce obesity and address other drivers of disease and illness. In July 2011, USDA
issued an implementation guidance memorandum to school districts describing upcoming requirements and is working with both the
Department of Education Office of Safe and
Drug-Free Schools and the CDC to provide
technical assistance to local stakeholders.
4. Strategic Realignment of Chronic Disease Programs at CDC
For fiscal year 2013, President Obama used his
budget proposal to urge Congress to condense
or consolidate several dozen budget lines for the
CDC Center for Chronic Disease Prevention and
Health Promotion into five lines. The proposal is
similar to one made in his fiscal year 2012 budget
proposal and is aimed at transitioning current categorical funding for various chronic diseases into
a more comprehensive approach to addressing
chronic disease. Such an approach could offer
improved efficiencies to achieving progress in
addressing obesity and other co-morbidities but
would need to be thoughtfully designed to ensure
that scarce resources are appropriately spent and
current investments are improved, not lost.
Separate from the budget proposal, the Chronic
Disease Center is already undergoing a series of
changes aimed at addressing chronic diseases
via more integrated strategies. Aside from the
Division for Nutrition, Physical Activity, and
Obesity, two new divisions, the Division for
Community Health and Division of Population
Health, now house programs aimed at empowering communities to address chronic diseases,
including reduction of obesity.
In 2011, the Center initiated a new Coordinated
Chronic Disease Prevention and Health Promotion Program with funding from the Prevention
and Public Health Fund. The program awarded
grants to all 50 state health departments to help
build capacity to address chronic disease, including obesity, by focusing on comprehensive
strategies and common risk factors.
5. Healthy Food Financing Initiative
Nearly 23.5 million Americans live in neighborhoods where they cannot buy healthy food to
feed their families. Without access to foods that
can help people stay healthy, obesity rates and
health care costs will continue to rise. Improving
the availability of healthy food in underserved
communities is an important and proven component of a comprehensive strategy to combat America’s obesity crisis and strengthen the
health of our communities.
In 2010, President Obama proposed creating a
Healthy Food Financing Initiative (HFFI) at the
USDA to help bring affordable healthy foods to
undeserved communities. At the federal level,
the initiative would be run as a partnership
between HHS, USDA, and the Department of
Treasury. For fiscal year 2013, the budget proposal included $285 million (including $10 million for HHS, $25 million for the Community
Development Financial Institutions program at
Treasury, and a $250 million set-aside from the
New Markets Tax Credit Program). Opponents
of the proposal contend that it is an inappropriate use of federal resources.
The program employs a triple aim — creating jobs,
economic development, and improving health in
low-income neighborhoods by improving access
to healthy food options to help address obesity. It
is based on the Pennsylvania Fresh Food Financing Initiative, a public-private collaboration that
employed a similar model beginning in 2004.
The Pennsylvania FFI has made it easier for an
estimated 400,000 residents to find healthier food
in the neighborhood. It led to the financing of 88
healthy food stores or farm markets in underserved
rural or urban locations that created or retained
some 5,000 jobs in struggling neighborhoods.
The Senate’s version of the 2012 Farm Bill includes $125 million for HFFI.
6. National Physical Activity Plan
Now entering its third year of implementation,
the National Physical Activity Plan was developed by a public-private partnership of organizations and individuals representing eight
different sectors: business and industry; education; health care; mass media; parks, recreation,
fitness and sports; public health; transportation,
land use and community design; and volunteer
and non-profit. Each of the sectors is charged
with developing strategies and tactics to promote physical activity across all sectors of American life — where they work, live, play and learn.
71
7. FDA Front-of-Package Review
Congress directed CDC to work with IOM, FDA,
and the USDA on a study over concerns that the
growing number of types and systems of “frontof-package” (FOP) labeling on food products is
leading to consumer confusion and varying levels
of scientific rigor. As expected, IOM released the
second part of the study in October 2011, which
examines consumer understanding of FOP systems and recommends steps for FDA to take to
develop a standard FOP system. The report concludes that the standard FOP system should:
n Not simply provide nutrition information but
give guidance on the healthfulness of a product and encourage healthier choices through
simplicity, visual clarity and symbolic meaning;
n Show calories in household servings on all products;
n Use a point system for saturated and trans
fats, sodium and added sugars where more
points conveys that a product is healthier.
FDA is reviewing the report and has indicated
they plan to propose a new system in the future.
8. Childhood Obesity Demonstration Program
CDC announced four-year funding for the new
Childhood Obesity Demonstration Program in
September 2011. The program aims to identity
strategies for integrating pediatric clinical care
with community prevention and other support
programs to help prevent childhood obesity.
Community health workers are being used to
help link families with community programs,
health insurance enrollment and other resources
for disease prevention and management. The
project is focused on children ages 2-12 who are
covered under the Children’s Health Insurance
Program (CHIP), a lower-income population for
which the obesity epidemic is disproportionately
problematic. Funding was awarded to research
facilities in Houston, Texas; San Diego, California; and Massachusetts. All funded activities will
be evaluated and studied for scalability. The program was authorized by the Children’s Health
Insurance Program Reauthorization Act of 2009
(Public Law 111-3) and funded by the ACA to the
tune of $25 million for 2010-2014.
9. USDA Fruit and Vegetable Program Expansion
In early 2012, USDA issued a proposed rule to expand and improve the Fresh Fruit and Vegetable
Program (FFVP), an initiative that provides fresh
fruits and vegetables to more than 3 million children in 4,600 elementary schools in low-income
neighborhoods. The program seeks to not only improve access to fruits and vegetables but also educate
school-age children on the importance of lifelong
healthy eating habits. An independent evaluation
of the program found that the FFVP increases the
consumption of fruits and vegetables by 15 percent
in participating schools on days when the program
is implemented with no increase in total caloric intake. Further, many school districts have reported
that popular fruits and vegetables served in the
FFVP are now served in participating school meals.
10. Surface Transportation Law
Federal transportation policy impacts how all
Americans move around in their day-to-day
lives, and provides a significant opportunity to
encourage more Americans to walk, bike and
employ other forms of physical activity routinely.
In July 2012, President Obama signed a twoyear extension of the federal surface transportation authorization that included a number of
changes to current law.
72
The law eliminates dedicated funding for Safe
Routes to School, Recreational Trails and Transportation Enhancement programs. Instead,
these and other active transportation programs
are combined into a new entity called Transportation Alternatives. Funding for this new entity
has been authorized at $800 million annually, a
33 percent cut from the $1.2 billion appropriated in FY2011 to the three individual programs.
A new provision also allows states to opt-out of
half the funds dedicated to small-scale walking
and biking projects It also includes new restrictions that could limit opportunities for public
health and other stakeholders to participate in
the transportation planning process.
The law does include a provision that provides
grants to local communities for street-scale
improvements dedicated to safer walking and
biking. However, a number of health-related
measures supported by public health advocates—including a Health Impact Assessment
or Complete Streets provision—were not included in the final legislation.
11. National Initiative for Children’s Healthcare Quality
In September 2010, the Health Resources and
Services Agency (HRSA) awarded $5 million from
the Prevention and Public Health Fund to the National Initiative for Children’s Healthcare Quality
(NICHQ) to support the creation of a new Prevention Center for Healthy Weight. In addition
to identifying health care systems strategies for
preventing and reducing childhood obesity, the
initiative also launched the Healthy Weight Collaborative and expanded to include health care
and public health partners in ten new communities in 2011, including:
n Boston Children’s Hospital (Massachusetts),
Greater Rochester Obesity Collaborative (New
York), St. Charles Health Council (Virginia),
Community Health Improvement Partnership
(Florida), Nationwide Children’s Hospital/
Ohio State University (Ohio), ArCare (Arkansas), Children’s Mercy Hospitals and Clinics
(Missouri), Yellowstone City County Health Department (Montana), Scripps Family Medical
Residency Program (California), and Lincoln
County Health Department (Washington).
The communities are working to promote
collaborations between primary care, public
health, and individuals and families towards addressing the obesity epidemic. Phase two of the
collaborative is expected to launch sometime in
2012 with the addition of 40 additional teams
across the country. Evaluation of phase one has
already started and is expected to assess the
quality and effectiveness of the Healthy Weight.
Learning purpose of this evaluation is to assess
the quality and effectiveness of these activities.В 12. Upcoming Legislative Opportunities
a. Agriculture Appropriations Act and Fiscal
Year 2013
A number of important programs that are appropriated through the annual agriculture
appropriations bill provide opportunity to promote and support healthy eating, particularly
among low-income populations that are disproportionately impacted by the obesity epidemic.
SNAP helps put food on the table for more than
46 million Americans and cuts to this program
threaten beneficiaries’ ability to access healthy
foods. Similarly, the Special Supplemental
Nutrition Program for Women, Infants and
Children (WIC) provides nutritional food, education and health care services to more than 9
million women and children younger than age
5 to help support and promote healthy weight
and development. Other funds in agriculture
appropriations legislation help support:
n Breastfeeding peer counselors to help women initiate and sustain proper breastfeeding, a proven
strategy to reducing pediatric obesity prevalence.
n Grants to school meal programs to upgrade
kitchen equipment to serve healthier, safer
meals and initiate breakfast programs.
n Farmers’ market vouchers for low-income
women, infants, children, and seniors.
Annual appropriations bills, which are responsible
for setting levels of federal discretionary spending,
are often a flashpoint in congressional debates
over the size and scope of the federal government.
Supporters of federal nutrition programs contend
that they are a vital element of the social safety net
for low-income families and children. Opponents
contend that funding for such programs is unsus-
tainable and have prioritized reductions in spending to achieve deficit reduction targets.
b. Farm Bill Reauthorization
The Farm Bill helps to guide our nation’s overall agricultural policy and has a major impact in
providing all Americans with access to healthy,
affordable food choices. In fact, nutrition assistance programs have historically accounted for
more than two-thirds of total Farm Bill funding.
A number of provisions in the nutrition title are
aimed at protecting against hunger while promoting nutritious diets, such as SNAP and The
Emergency Food Assistance Program (TEFAP),
while others, like the SNAP Nutrition Education
and Fresh Fruit and Vegetable Program, help
to improve consumption of healthy foods, nutrition and health outcomes among vulnerable
populations. Funding for the National Institute
of Food and Agriculture helps to ensure that
vital and basic research on nutrition, hunger
and obesity prevention is carried out. The Farm
Bill also supports community-based nutrition
approaches, like supporting farmers’ markets
and Community Food Projects, that have an impact on the crops and food products that are
available in various communities.
Additional opportunities exist to further incentivize healthier eating and make healthy food
choices accessible and affordable. For example,
steps to improve the purchase and consumption
of fruits and vegetables at farmers’ markets and
similar healthy food retailers, such as a SNAP incentive grant program or enabling EBT benefits,
could be taken.
73
The House Agriculture Committee’s version of
the bill proposes a cut of around $16 billion to
SNAP. The Senate version of the bill proposes a
$4.5 billion cut to SNAP.
Debate over reauthorization of the Farm Bill
is deeply influenced by larger debates over
the size and role of the federal budget. As the
SNAP program encompasses such a large portion of total Farm Bill spending, differences in
opinion over the value and effectiveness of the
program have resulted in considerable variation
in the proposed level of total Farm Bill funding.
The arguments are similar to the agriculture appropriations bills discussed in the prior section.
Supporters of maintaining or expanding SNAP
funding say that the program is a vital element of
the social safety net that also helps stimulate the
economy. Opponents, meanwhile, believe that
the program has grown too large with respect
to both funding and number of people served,
particularly in light of the current budget deficit.
c. Elementary and Secondary Education Act
Reauthorization
School districts and community organizations
that implement comprehensive physical fitness and nutrition programs for students are
eligible for competitive Carol M. White Physical
Education Program (PEP) grants, authorized by
the Elementary and Secondary Education Act
(ESEA). The program was funded at $78.7 million in FY 2012, which permitted the U.S. Department of Education to award 56 additional
grants in 2012 in addition to meeting additional
obligations for grantees that were already in the
middle of a three-year grant cycle.
However, despite this limited grant opportunity,
there is no federal requirement regarding content
or scope of the nutrition education curriculum
for schools that receive federal funding. ESEA
reauthorization therefore provides a number of
opportunities to address the obesity epidemic by
both promoting healthy eating and increasing
physical activity among school-age children.
Studies also have demonstrated that increased
physical activity is linked to improved academic
performance, better behavior and reduced truancy. Moving physical and health education to
“core” subjects would ensure that schools have
the option to use Title I and Title II funds for
similar programs, such as those included in Senator Tom Udall’s (D-NM) Promoting Health
for Youth Skills in Classrooms and Life (PHYSICAL) Act (S.392). The Act would also create
an Office of Safe and Healthy Students in the
74
Department of Education and reauthorize the
Carol M. White Physical Education Program.
In March 2011, Senator Tom Harkin (D-IA), and
Representatives Ron Kind (D-WI) and Jim Gerlach
(R-PA) reintroduced the Fitness Integrated with
Teaching (FIT) Kids Act (S. 576, H.R. 1057). The
bill would require local education agencies and
school boards to publish how much progress they
have made in meeting national standards for physical education and activity. The legislation would
also expand efforts to hire more physical education teachers, fund research on how health affects
academic achievement, and explore new ways to
promote physical education in schools. Among
the many provisions of the Fit for Life Act (H.R.
2795) introduced by Representative Marcia Fudge
(D-OH) is a new Department of Education grant
program to secondary schools to establish health
and fitness programs in low-income communities.
Respective pieces of legislation introduced and
considered by respective House and Senate committees of jurisdiction for ESEA differ in their
approach to promoting physical activity and nutrition. The Senate HELP Committee bill would
eliminate the PEP program, but a broader �Successful, Safe and Healthy Students’ grant program
would provide funding to states and localities for
physical activity, fitness, and nutrition programs.
The Senate HELP Committee bill also would permit states to use federal core education funding to
support physical and health education curriculum.
The House Education & Workforce Committee
passed legislation that would eliminate 41 federal
education programs, including the PEP program.
ESEA reauthorization legislation that has been approved by the Senate HELP Committee and the
House Education & Workforce Committee represent two competing visions for the role of federal
government in supporting physical education
funding. The Senate approach would continue
federal funding for physical education programs
and would expand core curriculum funding opportunities to include physical education; supporters contend that federal funding is particularly
important in light of state and local budgets cuts
that have eliminated physical education programs
across the country. The House approach would
discontinue federal funding for such programs
amidst a larger elimination of federal education
programs generally; supporters of this approach
contend that overly prescriptive federal requirements for schools infringes on state autonomy to
tailor and implement education programs that
meet students needs and achieve results.
D. EXAMPLES OF PREVENTION IN ACTION
Where a person lives, learns, works, plays and
prays has a significant impact on his or her
health. The following section focuses on examples of how some communities, small businesses,
faith-based organizations and schools are taking
action to make healthy choices easier for their
neighbors, employees, congregants and students.
EVIDENCE-BASED PROGRAMS CAN IMPROVE NUTRITION, INCREASE PHYSICAL ACTIVITY AND
REDUCE OBESITY
n The New York Academy of Medicine (NYAM) identified
84 peer-reviewed studies of effective, community-based
disease-prevention programs.300 For example:
s In Pawtucket, Rhode Island, the Pawtucket Heart Health
Program conducted an intervention to educate 71,000
people about heart disease through a mass media campaign and community programs. Five years into the intervention, the risks for cardiovascular disease and coronary
heart disease had decreased by 16 percent among members of the randomly selected intervention population.
s Researchers at Ohio State University recruited 60 women
in their forties for a 12-week walking program that took
place on the college’s campus. At 3 months, the intervention
group saw a 1 percent decrease in body mass index, a 3.4
percent decrease in hypertension, a 3 percent decrease in
cholesterol, and a 5.5 percent decrease in glucose.
s The Rockford Coronary Health Improvement Project
in Rockford, Illinois was a community-based lifestyle
intervention program aimed at reducing coronary risk,
especially in a high risk group. The intervention consisted
of a 40-hour educational curriculum delivered over a
30-day period with clinical and nutritional assessments
before and after the educational component, in which
participants were instructed to optimize their diet,
quit smoking, and exercise daily (walking 30 minutes
per day). At the end of the 30-day intervention period,
stratified analyses of total cholesterol, LDL, triglycerides,
blood glucose, blood pressure and weight showed
significant reductions with the greatest improvements
among those participants at highest risk.
n CDC’s Community Preventive Services Taskforce conducts
a systematic review and evaluation process to determine
effective programs and policies for improving health and
preventing disease. Its Community Guide has identified
a series of evidence-based, community approaches that
have resulted in increased physical activity, good nutrition
promotion, lowering diabetes rates, reducing obesity and
other prevention goals.301
Spotlight on Evidence-Based Prevention:В Diabetes Prevention Program (DPP)302
One of the most promising evidence-based programs in
the country is the National Diabetes Prevention Program
(National DPP).В It is based on the Diabetes Prevention Program Research Study that was led by NIH and supported by
CDC. The study demonstrated that modest weight loss of 5
percent to 7 percent and increased physical activity to 150
minutes a week through a lifestyle change program reduced
the risk of developing type 2 diabetes by approximately 58
percent. The National DPP was developed to move this
research into practice. It is a great example of public-private
partnership; National DPP includes community organizations, private insurers, employers, healthcare organizations,
and government agencies working together to reduce the
number of new cases of type 2 diabetes.
The lifestyle change program component is delivered by a
trained lifestyle coach in a group setting over 12 months that
includes 16 weekly core sessions and 6 monthly maintenance
sessions. Part of the National DPP, the Diabetes Preven-
tion Recognition Program, assures quality and fidelity to the
science and aids in facilitating reimbursement. Another key
part of the program is working closely with employers to
offer the lifestyle change program as a covered health benefit
and engaging insurers to reimburse organizations delivering
the lifestyle change program using a pay for performance
model of reimbursement, both are critical to long-term sustainability of preventing type 2 diabetes in this country.
The YMCA of the USA and UnitedHealth Group (UHG)
are inaugural partners in the National DPP. In the past two
years, the YMCA’s DPP (partially funded by CDC and UHG)
has trained more than 800 lifestyle coaches, started more
than 300 classes in 30 states around the country, and served
nearly 6,000 participants, one-third of whom have finished
the program. Participants in the Y’s program lost an average
of 4.8 percent of their body weight, while hundreds of individuals lost an average of 7 percent of body weight.
75
1. Examples of Some New Evidence-Based Prevention Programs in Communities
The following are examples of how local
communities have launched prevention
initiatives to focus on obesity, nutrition and/
or physical activity, and in some cases have
leveraged resources from CDC grants and
other support.
Increasing Access to Healthy Foods in the Community
n In late 2011, two pilot public farmers’
markets selling fruits and vegetables opened
in Birmingham, Alabama. Additional
communities have been identified for market
development in the coming year, with
estimates that they could potentially reach
96,000 Birmingham residents.
n Over 60,000 North Little Rock, Arkansas
residents may benefit from increased access
to and support for community gardens and
limited agricultural activity.
n Community gardens in San Diego, California can now be established on any piece of
vacant commercial or residential land, with
the exception of land in coastal communities,
and growers will be able to sell their produce
in commercial and industrial zones.
nC
hicago, Illinois now allows produce sales
at community gardens, adds flexibility in the
fencing and parking requirements for urban
farms, and permits innovative food production techniques such as aquaponics, which is a
system of cultivating both fish and produce.
n Residents of Evansville, Illinois celebrated
the opening of Riverside Foods, a newly renovated corner store that accepts SNAP benefits.
Fresh fruits and vegetables are now available
to residents in nearby underserved neighbor-
hoods, including more than 11,000 low-income
African-American children and adults.
n A grand opening was held for the revitalization
of one of the oldest gardens in Boston, Massachusetts. Nightingale Community Garden
is now a hub for building a strong social community through activities such as neighborhood
cookouts, gardening classes and Senior Fit4Life
group classes. It is estimated that at peak, each
plot will produce approximately $430 worth of
fresh produce, totaling $54,000 in 2012 alone.
n In Hamilton County, Ohio, over 9,000
residents now benefit from increased access
to farmers markets and community gardens,
new playground equipment in public spaces,
and a partnership with community churches
to purchase basketball hoops and benches for
installation in church parking lots.
n Six counties that make up the Mid-Ohio Valley region in West Virginia finalized agreements between individual convenience stores
and the Mid-Ohio Valley Health Department
that requires stores to sell fresh fruits and
vegetables for two years and display “Change
the Future WV” signage. Over 140,000
residents live within the region and will have
greatly improved access to fruits and vegetables at their local convenience stores.
Increasing Access to Healthy Foods in School and Child Care
n School districts in Tri-County, Colorado
substantially enhanced school district wellness policies to align with IOM standards for
school nutrition, benefiting over 200,000
students. Tri-County schools now promote
non-food or healthy food-related parties or
rewards in the classroom, opportunities for
increased weekly physical activity, a district
wellness council, enhanced communications
with parents, standards for school-based food
marketing and staff wellness.
n Child care providers in Bartholomew County,
Indiana now ensure children in these programs
receive at least 60 minutes to 120 minutes of
physical activity every day, healthy food options,
nutritionally appropriate beverages, and less than
76
30 minutes of screen time per week for children
over two years old.
n Every public school student in Portland,
Maine now has access to a fruit and vegetable
bar or a more traditional salad bar as part of the
lunch program. This initiative not only aims to
increase fruit and vegetable consumption for
about 7,000 students, but incorporates locally
grown food through Farm-to-School Programs.
n In Philadelphia, Pennsylvania, Get Healthy
Philly introduced 91 breakfast carts in 60
schools to improve participation in the district’s free meal program. These carts make
healthy breakfasts available to more than
37,000 children as they enter school grounds.
Improving the Built Environment to Increase Physical Activity
n During the fall of 2011, Portland, Maine unveiled its first StoryWalks in two parks in the Portland Housing Authority neighborhood. A StoryWalk is a path along which signs are posted
showing pages of a book, as well as suggested exercises children can do to mimic the characters and actions in the book.
n The New Balance Hubway Bike-Sharing Network began to support active transportation while providing residents with more
opportunities to be physically active in Boston, Massachusetts.
The new bike-sharing network is made up of 61 stations and more
than 600 bikes. At least seven stations are located in low-income
neighborhoods and subsidized memberships are available for any
low- income Boston resident wishing to become a member.
n A new establishment in Minneapolis, Minnesota Venture
North Bike Walk & Coffee, offers new and pre-owned
bikes, safety riding equipment and all types of walking gear
at affordable prices for local residents. In addition, they repair bikes, and provide jobs and training for local youth.
n Henderson City, Nevada is working to ensure a welldistributed system of local trails and implement street, pedestrian, and bicycle connections between neighborhoods
and services, parks, and transit. The current population of
Henderson is 277,502, of which 86 percent now live within
a half-mile of a trail.
n The Nashville, Tennessee GreenBikes initiative officially
launched with an expansion from two to six locations and
over 50 bikes. Participation has been robust with more than
500 people who have used the program. It is estimated that
at the final expansion of the program over 635,000 Nashville residents will have access to the free GreenBikes to
improve their levels of physical activity.
n The 51,000 residents of La Crosse, Wisconsin became
the first Wisconsinites to benefit from “Green Complete
Streets,” which blends multimodal transportation planning
and design with best practices in storm water management.
YMCA HEALTHY CHANGES IMPACT UP TO 46 MILLION PEOPLE303
Communities around the country engaged in the YMCA’s
Healthier Communities Initiatives (Pioneering Healthier Communities, Statewide Pioneering Healthier Communities, and
ACHIEVE) are making healthy choices easier for families.304
A sample of 153 of the Y’s sites found that local leadership
has helped make more than 26,000 improvements to communities.305 This work has been carried out with funding
from CDC and RWJF.
Some of the changes local leaders have made have helped
communities by:306
1. Increasing the amount of fresh fruit and vegetables available in neighborhoods.
s 86 new or improved grocery options
s 459 new community gardens
s 40 new healthy corner stores or bodegas
s 77 pricing strategies –either incentive or disincentives—
to promote the purchase of healthier foods
2. Encouraging changes in the built environment.
s 194 sidewalks designed or improved
s 61 zoning guidelines to encourage increased physical activity or availability of health eating options
s 123 “Complete Streets” projects to improve access to
streets for all users including bicyclists, pedestrians and
people with disabilities
3. Working with schools to increase physical education and
physical activity.
s 75 new schools that are located to encourage walking
and biking to school
s 1,132 schools added or improved physical education criteria
s 715 schools have instituted classroom physical activity breaks
s 285 schools have added or expanded recess
4. Working with schools to improve access to healthier
food and drinks.
s 1,009 schools changed the food available in their vending
machines or sold outside of the lunch line
s 1,334 schools changed their lunch menus to offer
healthier choices
s 345 schools expanded their participation in the USDA free/
reduced breakfast or in the afterschool snack program
5. A
dvancing changes in early childhood or afterschool
programs to incorporate more physical activity and offer
healthier foods and beverages.
s 2,091 early childhood or afterschool sites have made
their snacks or meals more healthy
s1
,107 early childhood or afterschool sites have made
water the primary beverage of choice for snacks and meals
s 1,427 early childhood or afterschool programs limit the
amount of screen time
s 2,280 early childhood or afterschool programs have added
or increased the amount of physical activity to their curricula
6. H
elping worksites incorporate healthier food/beverage
options and improving opportunities for physical activity.
s5
19 worksites increased the number of healthy vending
machine options
s 625 worksites improved food choices available in meetings
s 1,127 worksites created incentives for employees to be
active or learn about nutrition
s 268 worksites encouraged employees to commute in
more active ways
s 212 worksites promote and support breastfeeding
77
2. Examples of Small Business Approaches to Supporting Wellness in the
Workplace and Beyond
Businesses around the country are feeling the
strain of high health care costs. Many companies provide wellness programs because they
can simultaneously save money while helping
employees improve their health.
Chronic diseases such as diabetes, heart disease and cancer are a key driver of health costs.
Wellness programs help not only by lowering
costs but also by improving employee morale
and productivity.
Wellness programs can be especially important to
small businesses: these companies employ about
half of the country’s private sector workers and
face growing health care costs and lost productivity related to obesity.307 However, they can also
present unique challenges. Currently, 65 percent
of small businesses offer at least some kind of wellness program, compared with 90 percent of large
businesses.308 The definition of small business
can vary depending on the sector; for instance for
wholesale, small businesses have a maximum of
100 to 500 employees and in manufacturing, the
maximum can range from 500 to 1,500 depending on the type of product manufactured.309
In December 2011, TFAH and the Small Business
Majority convened more than 20 experts from government, business, public health, unions, insurers,
insurance brokers and small business owners to
discuss opportunities and challenges for increasing the update of and participation in workplace
wellness programs by small businesses, particularly
through opportunities available through the implementation of the Affordable Care Act.310 The
meeting focused on concerns that small businesses
with 100 or fewer employees may have.
The group of experts identified a number of
challenges small businesses face when considering wellness programs, including:
n There is a lack of data on how wellness programs help small businesses, in terms of
health and the bottom line;
n There is often little information easily available to small businesses about how to set up a
program and what it should include;
n Many small business owners and employees
remain unaware of the potential benefits of
wellness programs;
n Many small businesses lack the resources to
set up their own program;
n There are few models designed to work for
the various sizes of small business;
78
n Small business owners often feel that they
don’t have the resources or the money to set
up and run wellness programs; and
n In some cases, given the relatively small number of employees, some owners have concerns
that wellness programs will impinge on privacy.
The expert panel also suggested several solutions, including:
n Federal, state and local governments can offer
increased tax credits and other incentives and
assistance to help small business wellness programs get off the ground;
n Insurance plans can offer incentives to small
businesses who offer wellness programs;
n
Community-based organizations such as
YMCAs can collaborate with small businesses
to increase opportunities to exercise;
n Local hospitals can offer free health screenings and classes on nutrition;
n Federal, state and local governments and
health and community organizations can
educate small businesses about the benefits
of wellness programs; and
n Wellness programs can become a key part of the
Health Insurance Exchanges that are due to arrive in 2014 as part of the Affordable Care Act.
Other key issues raised at the meeting include::
n Small businesses can have advantages over
larger companies in setting up wellness programs. Because smaller companies don’t
have as many management layers, setting up a
wellness program is often simpler, and having
fewer employees makes it easier to communicate the program’s importance and benefits;
n At many small companies, employees form a
close-knit group, so it is easier to change workplace culture. One employee’s success — reducing weight or stopping tobacco use — can
reverberate throughout the entire company
in a way that is less likely to occur at a larger
operation; and
n Small businesses may have more incentive
than large companies to develop effective wellness programs. Because small companies have
fewer employees, when one person is absent or
less productive due to a health problem, this
has a larger effect on the bottom line.
In 2011, CDC announced a $9 million, twoyear program to help 100 small, mid-sized, and
large businesses around the country set up and
run evidence-based wellness programs. Known
as the National Health Worksite Program
(NHWP), the effort will provide expertise, support and funding to select companies.311
The following are three examples of small businesses
that have independently started workplace wellness
programs to help their employees improve health.
Creative Craftsmen
Creative Craftsmen, a custom metal fabrication
company in Evansville, Indiana, makes parts for a
range of products, including reclining chairs, lawn
mowers and automobile assembly lines. It has
operated as a small business since Eisenhower
was president.
One key to the company’s longevity has been its
skilled workforce. Keeping this workforce healthy is
crucial to its continued success.
Most of the company’s 18 employees are middleaged males — the average age is a little over 50.
According to Melody Waggoner, the company’s
human resources manager, about two-thirds of
these workers are either obese or overweight.
Like many smaller companies, Creative Craftsmen
does not have a large staff or budget for human
resources or health care. It is a family-owned
business, and Waggoner, who is the daughter of
one of the owners, wears several hats, including
human resources manager and accountant.
In response, Creative Craftsmen started a wellness
program in 2007 to help employees exercise more,
eat healthier foods and stop smoking. The company hired a local health care provider, Deaconess
Hospital, to set up and run the program. By taking this step, Creative Craftsmen is rather unique:
according to a 2011 survey by the Kaiser Family
Foundation, just 12 percent of small businesses set
up their own wellness programs. The rest have
programs that are provided by their health plan.312
Waggoner said the company started the program because its owners believe that healthier,
happier employees are more productive. Again,
this puts the company in the minority: the
Kaiser survey also found that one-quarter of
small employers offered a wellness program
to improve employees’ health, while 9 percent
offered it to improve morale and productivity.
Nearly half said they offered a wellness program
because it was part of their health plan.313
Currently, the company, whose annual sales
range between $2.5 million and $3.5 million,
spends about $4,000 a year on its wellness
program. Through 2011, Creative Craftsmen
was reimbursed for half the cost of its program
thanks to an Indiana tax credit that helped defray companies’ wellness program costs. However, that credit was suspended for 2012.314
The program is managed by Emily Boyd, a health
coach at Deaconess. With her help, the company
now has a solid program.
One key piece of the effort is an annual screening program that checks employees’ BMI and
body fat levels, and tests for diabetes, high
blood pressure and high cholesterol. Waggoner
said that 90 percent of employees participate
in the screenings. Through the screenings and
conversations with employees, Boyd found that
a significant number of Creative Craftsmen’s
employees needed to manage their weight, exercise more and improve their diet.
She helped them develop plans to improve on
areas that fell into the risky category, and regularly checks in on the participants' progress.
Spouses are also eligible for the screenings, as
well as a free flu shot.
In some cases, the screenings have had a significant impact. For instance, two years ago,
tests revealed that the company’s owner and
founder, Tom Pfender, had diabetes. At the
time, Pfender (who is Waggoner’s father) had
no idea that he had the disease. Since then, he
has begun exercising and is eating healthier. As
a result of these changes, and the medication he
now takes, his diabetes is under control.
Boyd said that employees at Creative Craftsmen are sometimes set in their ways, and can be
reluctant to alter their behavior. In 2012, she is
trying a new, incentive-based approach to make
it easier for them to make healthier choices.
She said that some of the company’s employees
have quit smoking or lost a significant amount
of weight. In some cases, however, they have
started smoking again or regained the lost weight.
But Boyd remains optimistic about their longterm success. “[The backsliding] usually has to do
with stress,” she said. “I want to help them figure
out how to make more lasting changes.” This
year, she has focused especially on working with
employees who continue to use tobacco.
79
Every year, the company holds wellness contests, with varying rules and goals. Some have
focused on losing weight and decreasing body
fat, while others have focused on increasing time
spent exercising. One competition awarded
contestants points for every 15 minutes they
spent exercising; for every serving of fruits or
vegetables they ate; for every 8 ounces of water
they consumed; and for every driving trip they
took while wearing a seat belt. Points were also
awarded for not eating red meat. Some contests
involve teams, while others are individual. Prizes
have included gift cards and up to $100 in cash.
This year, the company is holding a contest that
runs from April to September. Every month,
workers are eligible to earn entries into two
separate drawings. One awards relatively small
prizes such as gift cards. The other will give
out a single, larger prize: an extra personal day.
Boyd structured the contest so that every employee can participate.
In April, as part of the contest, Boyd tested entrants on a range of strength and flexibility measures, including grip and biceps strength. Because
80
metalwork involves a fair amount of upper body
manual labor, workers at Creative Craftsmen
generally scored high on strength measures. But
the tests showed that many workers lacked flexibility. Afterwards, Boyd showed workers how
to stretch. In September she will retest them to
see whether they improved.
In addition to these contests, the company has a
standing offer: a $100 bonus to any overweight
or obese worker who loses weight and keeps it
off for three months — or to any employee who
quits smoking for six months.
This year, Boyd also set up “lunch and learn”
sessions, in which a speaker talks to employees
about a wellness topic. Recently she brought in
a physical therapist to explain the importance of
stretching to prevent injuries — both on the job
and during leisure time.
Boyd firmly believes in the value of company
wellness programs. “At a lot of companies I’ve
worked with, insurance claims go down,” she said.
“Employees’ health can really improve through
these programs. And the companies save money.”
Explorer Pipeline
As human resources manager for Explorer Pipeline in Tulsa,
Oklahoma, Michelle Griffith oversees the company’s wellness
program, which includes an incentive program for employees
who exercise, seminars, a health fair and an email newsletter.
Griffith, a fitness buff, is an enthusiastic participant in the program herself. Among other activities, she runs several times a
week during lunch with a group of Explorer employees.
Griffith takes pride in her company’s program. “We’ve had
people quit smoking,” she said. “We’ve had people lose
weight, and we’ve had people start exercising more.”
The company owns and runs a pipeline that transports crude
oil, jet fuel, diesel fuel and other petroleum products from
Port Arthur, Texas to Indiana. Nearly 1,900 miles long, the
pipeline handles about 200 million barrels a year. Half of the
company’s 200 employees work in Tulsa, while the other
half work at seven locations spread along the length of the
pipeline. These workers run the gamut, from accountants to
secretaries to pipeline repair experts.
Although it has a dispersed workforce, the company feels a
strong loyalty to its employees. “Since we’re a small company, we’re close-knit,” said Griffith. “We’re like a family.
And we want to take care of our family.”
Explorer’s wellness program was started in 2007 by former
CEO Tim Felt. A former U.S. Army captain who graduated
from West Point, Felt believes strongly in the value of wellness
and the importance of healthy living.
Felt said that the wellness program not only helps employees’
health, but can also improve the bottom line. “The company is
paying a significant amount of employee health care costs,” he said.
“That means I’ve got a vested interest in keeping workers healthy.
So there’s a financial interest — and it’s just the right thing to do.”
There is evidence to support him: in a 2010 review of studies on wellness, researchers at the Harvard School of Public
Health found that for every dollar a company spends on wellness programs, it saves about $3.27 in medical costs and about
$2.73 on absentee costs.315
Felt, who is now the CEO at Colonial Pipeline outside Atlanta,
said that the idea for the program first occurred to him at a
company meeting at which donuts were the featured snack.
Afterwards, one overweight employee came up to Felt and
said it was hard to lose weight in an environment in which
high-calorie foods were the only choice. “From that point on,”
Felt said, “I decided that if the company was paying for the
food, there was going to be a healthy alternative.” At future
meetings, fruit and water were always part of the offerings.
Felt said the new policy made a difference. “It’s amazing how
many people will eat the fruit or drink the water, if you make
it available,” he said.
Felt, who regularly bikes, lifts weights and works on an elliptical trainer, then expanded Explorer’s program beyond serving
healthier food at meetings. A committee of eight employees
began developing ideas, and in 2008, Explorer rolled out its
program. The effort includes an incentive program that pays employees $30 per quarter if they reach certain health-related targets, such as taking an annual physical, participating in a wellness
seminar, running in road races, and taking certain vitamins, as well
as prescribed medicines. Every week, Griffith sends employees a
weekly email that includes articles on wellness and health recipes.
In the past two years, Griffith has added new features to Explorer’s effort. Every month, the company holds seminars on
a range of health- and wellness-related topics. Recent seminars have focused on strategies to improve diet and nutrition,
and stress management. The meetings take place at the Tulsa
headquarters; to ensure that workers in other locations don’t
miss out, the seminars are videotaped and webcast.
Explorer also puts on an annual health fair. It offers flu shots, and
screenings for high blood pressure, high cholesterol, diabetes, and
other ailments. In 2011, Griffith helped start a lunchtime walking
and running program. A few times a week, groups of employees
in the Tulsa office walk or run together for between 30 minutes
and an hour. “It’s a great way to break up the day,” said Griffith.
The program also reimburses employees up to $50 a month for
their health club membership. To get the discount, workers must
go to the club at least eight times a month.
So far, she said, about one-quarter of the company’s workers
are participating in at least some part of the voluntary
wellness program.
To entice employees to participate, the program includes
regular health challenges. Every three months, Explorer encourages workers to improve on a specific aspect of wellness:
eating five servings of fruits and vegetables a day, or exercising
for at least 30 minutes at least five times a week.
A significant percentage of the company’s employees work
outside; these workers have somewhat different health concerns than do more sedentary office workers. In the summer
of 2011, for instance, the company focused on encouraging
employees to drink enough water every day — something that
is especially important for those working outside in the heat.
Griffith said that it is difficult to gauge how much money the
wellness program has saved the company. But she notes that
the company’s health insurance costs have not risen over the
past few years. The overall number of health insurance claims
filed by employees has also dropped.
Felt, the company’s former CEO, agrees that calculating
savings from wellness programs is tricky. But he is confident
that the programs can have a positive influence on employees
— so confident that he has started a wellness program at his
new company too.
“This is about helping employees to go in the right direction in
terms of their health,” he said.
81
Corporate Network Services
Three years ago, Karen Kalantzis decided that she wanted to do
something to encourage her employees to improve their health.
The majority owner and CEO of Corporate Network Services
(CNS), an information technology services firm with offices
in suburban Washington, D.C. and Florida, Kalantzis saw that
many of her employees were not as healthy as they could be.
They weren’t getting enough exercise, and weren’t eating as
well as they could either.
Many of the company’s 47 employees are in their 20s and 30s,
but Kalantzis worried that they were on the road to a range of
health problems, such as diabetes, cancer and heart disease.
IT work tends to be sedentary, with employees spending
hours at their desks staring at computer screens.
The company began by holding an employee health fair. Each
year, the fair features a variety of stations, including a table for
checking vision; one for gauging blood pressure; another that
allowed workers to try on “beer goggles” that simulated how
alcohol effects perception and coordination; and a space where a
Zumba instructor demonstrated the popular exercise technique.
Kalantzis, who formerly worked for Hewlett-Packard and
other large IT companies, hopes the program, which costs
about $4,500 a year, will make the company more efficient,
ultimately saving money. She said that while it may not lower
health insurance premiums, there are other ways in which it
can save money. “Increasing presenteeism is our goal,” she
said. “We think that this will increase our employees’ efficiency, and their energy for their jobs.”
Kalantzis also said that the program, which is called “Your
Wellness Counts,” makes her company more attractive to potential employees. The IT industry is growing, and as a result,
companies are competing vigorously for top workers. “We’re
all trying to recruit the same employees,” she said. “I’m a big
believer in branding, and wellness is a great way to differentiate our company from others. It’s just another good reason
to work here.” She said that some employees have told her
that the wellness program was a major reason they chose
CNS when they had more than one job offer.
In 2010, CNS began having regular “lunch and learn” wellness
sessions; employees gather in a conference room at the company’s headquarters in Poolesville, Maryland to hear speakers on a
range of topics, including yoga, women’s health and stretching at
work. Last year, Kalantzis brought in an expert from an organic
market to talk about how certain foods have especially healthy
characteristics. The sessions are videotaped and webcast, so
that workers in Florida and Ft. Detrick, Maryland (where many
CNS employees are now based) can also take part.
82
Although the wellness program is voluntary, Kalantzis encourages CNS workers to take part. Last year, she began tracking
participation. By collecting and using these metrics, she hopes
to learn to reach those who so far aren’t interested. “If we
see we’re not reaching our goals,” she said, “we follow up
with people.”
For the past two years, the company has held a holiday weightloss competition that begins before Thanksgiving and lasts until
after New Year’s Day. Employees put in $20 each, and the
company matches half of that. Any employee who loses weight
is eligible to win some of the money. Kalantzis estimates that
during the 2011 contest, about 15 people lost weight, winning
between $20 and $40 each. “People were into it,” she said.
As part of the contest, the company holds a healthy holiday
potluck party, in which people bring in low-calorie versions
of their favorite recipes. For instance, someone might bring
in a dip that uses reduced-fat cream cheese rather than the
full-calorie version. After the party, the company posts the
recipes on its internal website.
Her efforts are garnering notice. In 2011, the Washington
Business Journal named CNS one of its 40 healthiest employers in the Washington area.316
CNS encourages health in other ways too. It added medical
monitoring equipment to its offices, including blood pressure
cuffs, a BMI monitor and a scale. The company reimburses
employees for the cost of running in local races, and provides
support to local charitable athletic events, such as a 5K race in
Poolesville and an all-night relay race to raise money to help
those who have cancer. Last year, the company held two events
involving physical activity: employees dug trenches to help install
rain barrels at a farm a few miles from company headquarters,
and played laser tag and other games at an amusement park.
CNS also encourages employees to take advantage of the preventive features of their health insurance. For instance, the
company’s provider offers an online assessment to help members analyze their health status.
CNS computer engineer Damien Ancruem said CNS’ wellness
program has made a difference in his life. He said he realized
that he needed to watch his cholesterol and exercise more.
Since taking the survey, he has begun to take long walks with
his wife, and plays more on weekends with his highly energetic
6-year-old son. “They’re definitely more concerned about your
wellbeing than other companies I’ve worked for,” he said. “That
makes a big difference. They honestly care about your health.”
3. Examples of Faith-Based Organizations Supporting Health
One area of focus for Let’s Move! is neighborhood and faith-based organizations.
Let’s Move Faith and Communities includes supporting “Wellness Leadership,” which asks leaders to:
n Establish wellness as a priority for their organization and provide leadership through
consistent messaging;
n Identify a Wellness Ambassador and direct
that person to create and lead a Wellness
Council or Ministry; and
n Organize a Wellness Council.
Let’s Move! suggests several “Ideas for Action,”
such as hosting nutrition education classes,
using church or other neighborhood grounds
to grow healthy food and incorporating exercise into weekly activities. The following are five
examples of health-focused, faith-based prevention and wellness initiatives.
First African Methodist Episcopal Church: Reducing Health Disparities through Education and Empowerment
First African Methodist Episcopal (FAME)
Church, the oldest church founded by African
Americans in Los Angeles, California, with a
congregation of more than 19,000 members,
is working to improve health outcomes and
reduce health disparities for the communities it
serves. Through FAME Assistance Corporation,
its community and economic development arm,
FAME is inspiring Californians to make healthier
choices every day.
FAME has created several programs and initiatives to increase awareness of the crisis of preventable diseases that disproportionately affects
low-income and ethnic minority communities,
as well as educate and empower individuals to
make healthy choices where they live, work,
learn, play and worship.
To connect widely and impact the greatest
number of people throughout Los Angeles and
California, FAME’s outreach extends beyond
its immediate congregation and neighborhood.
Through a broad coalition of community partners, including a multi-denominational network
of churches, energized leaders and complimentary agencies, FAME reaches the underserved
and is committed to creating healthy individuals,
families and neighborhoods. FAME’s approach is
to work both with individuals and within existing
institutions to create new environments that will
lead to a lifetime of better health.
Where We Live
Partnering with the Housing Authority of the
City of Los Angeles, FAME offers a series of
training programs and community events at local
public housing projects to create appreciation
for and commitment to the benefits of healthy
eating and physical activity.
Offered free-of-charge, residents complete a
6-week Champion Empowerment Program in
order to serve as healthy lifestyle ambassadors
and change agents in their community. Ambassadors help plan and execute complimentary
community health fairs and healthy living classes.
The curriculum encompasses nutrition, healthy
cooking, physical activity/exercise, presentation
skills, entrepreneurship, community advocacy,
and the link between diet and disease. With
funding provided by the Network for a Healthy
California, Kaiser Permanente and the UCLA
Center for Health Equity, FAME impacts thousands of individuals.
Where We Shop
Every Saturday and Sunday, FAME transforms its
parking lot into a produce market where congregants and community members can purchase
fresh and affordable produce. The market helps
people gain access to healthy foods, promotes
fruit and vegetable consumption, and showcases
FAME’s health programs.
In March 2012, in association with Mayor Antonio Villaraigosa’s Good Food Day LA, FAME
delivered “Healthy Heritage,” a cooking demonstration and food sampling featuring chefs
preparing ethnic foods in a healthier way. Chefs
demonstrated how to make healthy tweaks to
traditional African American, Latino and Korean
favorites to show families how to improve nutrition without compromising flavor. Food samples
were provided for all to enjoy.
83
Where We Learn
When First Lady Michelle Obama started Let’s
Move! to reverse the epidemic of childhood obesity in one generation, FAME responded to the
call to action by launching Let’s Move L.A.!. Over
the last two years, FAME has facilitated the dissemination of nutrition education materials and
led physical activities at schools and community
events focused on creating healthier environments for children and instilling healthy habits
that last a lifetime.
In May 2012, FAME further engaged young
people with the Let’s Move Youth Summit. The
Youth Summit encouraged young people to take
charge of their health, set and achieve fitness
goals, and become leaders in their community
that advocate for better health.
Where We Play
An outgrowth of Let’s Move L.A.!, FAME launched
Let’s Move California! in June 2012 with a series
of events aimed at uniting and invigorating Californians to eat healthier and be more active. Let’s
Move California! will create a statewide framework to educate citizens, streamline access to
healthy lifestyle resources, and provide training
to incorporate Let’s Move California! programming into existing infrastructure.
Central to the Let’s Move California! launch is
Fitness Feria, a one-day intensive program to introduce children and parents to the “movement
ABCs,” a fundamental step in early childhood development that enables participation and success
in athletics. Families participated in more than 40
sports and fitness-related activities, and learned
how to engage more fully in the U.S. athletic
84
system. During the program, parents and children receive instruction on many Olympic Sports
and information on where to obtain non-profit
resources and support. In addition, thousands
of parents learn how to enroll their children in
community athletic programs and how to help
their families practice a healthy lifestyle. В Where We Worship
A core audience for FAME’s programs and message is its broad-based network of churches.
Begun at home and now expanded throughout
Southern California, FAME is dedicated to making church a place of physical as well as spiritual
well-being.
The Body&Soul collaborative brings a series of
initiatives and programs to local churches that include health messaging from the pulpit; monthly
newsletters; food policies; healthy cooking and
exercise classes; community health fairs; and an
exercise break during worship services.
In partnership with the University of California,
Los Angeles, with support from the Centers
for Disease Control and Prevention, FAME
created an Instant Recess® video — designed
to get people to take 10-minute physical activity breaks. Instant Recess has been adopted by
congregations all over the city with plans for
national distribution through Let’s Move! Faith
and Communities. The video, which has a spiritual and gospel flair, provides churches with fun
and active ways to spend 10 minutes exercising
while worshiping, specifically during children’s
Sunday School, Sunday worship service, choir
rehearsal, special events and celebrations, and
Bible study meetings.
H.O.P.E. Initiative and the National Baptist Convention
The National Baptist Convention USA (NBCUSA),
incorporated through its Congress of Christian Education, is committed to ensuring all National Baptist churches have health and wellness ministries. A
major component is the NBC Health Outreach
and Prevention Education (H.O.P.E.) Initiative,
which is a partnership among churches, medical professionals and public health organizations.
H.O.P.E. adopted the “Mississippi Model” for faithbased health and wellness mobilization championed
by an association of NBCUSA church Usher Federation (UF) ministries in Northwest Mississippi.
Through H.O.P.E., the NBCUSA reaches out across
their denomination to educate and inspire Baptists
to commit to healthier lifestyles through health and
wellness education; referral sources and collateral
material; and facilitators and resource persons.
The framework of the H.O.P.E. Initiative began
in Northwest Mississippi in the late 1990s. As
NBCUSA churches worked to include health and
wellness in worship, they found that, while people liked the idea of improving health, they didn’t
know what to do. So, in 2002, the UF created a
health and wellness observers calendar. Pulling
information from Healthy People 2000 and other
public health research organizations, the calendar
was fashioned to include monthly observances.
It worked fairly well the first year, but usage
took off in the second year. In the second iteration of the calendar, they added more options
and ways for people to make healthy choices.
Next, the UF created a companion guide to go
along with the calendar. Both pieces provide
easy-to-understand tips on how to incorporate
health into worship and daily lives. For example,
September includes Sickle Cell Sabbath and November includes Diabetes ID (I Decide) Day.
The signature event of the calendar and guide
is Taste Test Sunday, focused on diabetic safe
desserts. The event includes a blind taste test of
desserts made with and without sugar. Organizers found that men in the congregation couldn’t
tell the difference and even preferred the diabetic
safe desserts. In the past year, other diabetic safe
foods have been to the taste test and have proved
popular. Along with the calendar and guide, the
NBC created the What’s Cooking? Initiative with
the American Diabetes Association aimed at promoting healthy ingredients in meals.
No Fry Zones
In addition, some Baptist churches have created “no fry” zones in their congregations. One
church in Mississippi resisted the change initially
but eventually made the switch thanks to the
leadership of their pastor.
Dr. Michael Minor, a special health assistant to
the president of the National Baptist Congress,
said the idea of the no fry zone was a way to
get his foot in the door, talk about health and
wellness and demonstrate how the church
could take a stand. He viewed the fry ban as
similar to when churches stopped using wine for
communion to help congregants with alcohol
issues. “We are trying to work with people who
have health challenges and keep others from
having those challenges,” Dr. Minor said.
Using Church and Community Grounds to
Benefit Health and Wellness
The Church and Community Garden Project promotes the development of gardens to increase access to and consumption of fruits and vegetables. It
has the added bonus of helping congregants become
physically active through gardening and allowing for
shared use of the land for exercise and play.
In addition, some congregants wanted to walk
around church grounds, so ministers have been
encouraged to measure off distances so congregants can track how far they are walking. Some
ministers have gone so far as to create paths linking churches, grounds and cemeteries to ensure
congregants have safe places to walk and exercise.
“The bottom line is we need to spend more
time focused on reaching a common ground and
making lives better,” said Dr. Minor. “We can all
rally around health to make our community better. Who wouldn’t want a healthier nation?”
Health Ambassadors
After the NBC published the calendar and the
guide, congregants began exploring ways to benefit their communities as a whole. That sparked the
creation of health ambassadors, representatives of
each church that are trained as health promoters.
In addition, the NBC created the “First Ladies for
the First Lady,” a group of local church first ladies
advocating on behalf of Let’s Move!. To mark the
two-year anniversary of Let’s Move!, First Lady
Michelle Obama spoke at Northland Church in
Longwood, Florida and asked the National Baptist
Convention to train and deploy 10,000 health
ambassadors in 10,000 churches by September
2012. By the end of April, 2012, NBCUSA state
and district affiliates representing more than 3,000
churches have committed to this training.
85
The Jewish Community Center Association’s Discover: CATCH
Early Childhood Program
To tackle obesity, the Jewish Community Center (JCC) Association focused on one simple
premise: it’s much easier to create good
health habits than it is to change bad ones.
foods with their children and asking schools to
serve healthier foods. Encouraged by these results, JCC Association added an education piece
on farming and farm-to-table initiatives.
JCCs consider health and wellness inherent to
their tradition and cultural values; staying healthy
and taking care of their bodies is an aspect of
respecting their faith, making healthy living part
of their heritage.
In November 2010, JCC Association started
“JCC Grows” to encourage JCCs to establish
gardens and encourage members to support
fresh food projects and be physically active. A
significant portion of the harvests from the gardens are donated to local food pantries.В Three years ago, the JCC Association partnered
with the University of Texas School of Public
Health and its Coordinated Approach to Child
Health (CATCH) Program. Together, they created Discover: CATCH Early Childhood, a child
wellness program aimed at encouraging healthy
habits in the youngest members of the community and their families.
JCC Association’s version of Discover: CATCH is
based on a foundation of Jewish values. The evidence-based model that CATCH has pioneered
attempts to instill an appreciation for physical
activity in children ages 3 to 5 and encourages
them to develop life-long healthy eating habits.
As part of the program, children learn to have
fun while exercising. They are also taught to differentiate between “go” foods, which are good
for them and “whoa” foods that are less healthy.
The program is focused on young children, but it
seeks to engage the adults in their lives, including
parents and educators. The JCC Association has
created a series of parent tip sheets to bring lessons home and help the entire family think more
carefully about food, nutrition and exercise. The
model positions JCCs as a wellness provider to the
community. JCCs have been able to reach families
with older children as well by incorporating Discover: CATCH into teen after-school programs.
While the Discover: CATCH program is just
finishing the final stages of the pilot phase, the
responses across the board have been positive.
Based on surveys sent to members before and
after the program began, there has been a cultural
shift in the way early childhood classes are being
taught. For instance, young children no longer play
“elimination games” (such as Duck, Duck, Goose)
where a large portion of children are not participating at any given time. Children are also growing
their own fruits and vegetables for snacks.
The pilot communities are also seeing a change
in how early childhood educators and staff work
with parents. Parents are sending healthier
86
The JCC Movement also has one of the largest networks of day and resident camps in North America.
Since starting their partnership with Discover:
CATCH, camps have gotten rid of the old “bug juice
and greasy grilled cheese” in favor of healthier food,
some of which comes from their own gardens.
Health and Wellness at Local JCCs
The Shaw Jewish Community Center in
Akron, Ohio held a Discover: CATCH Wellness Fair on January 22, 2012. More than 1,000
people took part and learned about all different
aspects of health and wellness.
Discover: CATCH was a natural complement
to the Shaw JCC’s Ethical Start Early Childhood Program. According to Lisa Pesantez,
who teaches a group of two-year olds and a
class of third-, fourth- and fifth-graders, “For
my [two-year olds] I think the biggest thing has
been showing them that exercising can be fun! I
believe that the purpose is to give wholeness and
completeness to physical activity, spirituality, and
nutrition for both the students and the teachers.”
The Asheville Jewish Community Center in
North Carolina took the JCC Grows initiative and
created an entire Jewish Children’s Garden Curriculum. They started by forming a volunteer committee of parents and interested teaching staff with
garden design, art therapy and Judaic experience.
The Asheville JCC is in a busy downtown area
with just two narrow grassy areas (one 20’ x
70’ and the other 20’ x 25’) which became their
children’s garden. The community helped fund
the garden through a Children’s Garden Legacy
Campaign, which offered naming opportunities
for each section. The JCC also solicited volunteers
to help build the garden, including a teen youth
group, preschool teachers, parents, landscapers,
gardeners, and many others. The garden provides
healthy foods for the entire community and educational opportunities for children.
Adventists InStep for Life – the Seventh-day Adventist Church
To help families address the obesity epidemic, the North
American Division of the Seventh-day Adventist (SDA) Church
created Adventists InStep for Life, which forms partnerships
between churches, schools and the public health community
to reduce childhood obesity and inspire healthy eating along
with physical activity.
They have set four goals centered on increasing physical
activity and the consumption of fruit and vegetables:
1. Accumulating 2 millionВ physical activity milesВ through walking, biking, swimming, running and other physical activities;
2. Having 60 percent of Adventist students achieve Individual Active Lifestyle awards by either qualifying for the theВ Presidential
Active Lifestyle Award, which В requires participants to commit
to physical activity five days a week for six weeks, or the NAD
Active Lifestyle Award, which rewards people for reaching
mile milestones ranging from 100 miles of exercise to 2,000;
3. Launching 100В summer feeding sites, which provide nutritious summer meals to children who rely on the National
School Breakfast and Lunch Programs; and
4. Starting 100 vegetable gardens or farmers’ markets.
Local Ministries
The Allegheny East Conference Churches started their
“Let’s Move Day” at 4:00 a.m. with a 20 minute exercise
routine followed by worship and a 32-block walk to 15th
and Christian Streets in South Philadelphia. Pastor Colin
Brathwaite and his wife, Jeannie, joined the West Philadelphia
members on the entire walk. While members were given bus
tokens to ride back to the West Philadelphia Church, they
were so excited about completing the initial walk to south
Philadelphia that they decided to walk back. In total, they
hiked more than seven miles. In Texas, Killeen SDA Church,
which is close to Fort Hood, the largest military base in the
United States, planned their event in just three weeks but got
nearly 80 people to complete their 5K run/walk.
Orlando Junior AcademyВ (OJA), in Orlando, Florida, has
begun to focus on getting students “in step for life.” All pre-K
through eighth-grade students participate in a school garden
that won first place in the 2011 Florida School Garden Competition. In addition, OJA has created healthy eating experiences for students through partnerships with a local chef,
dietitian and nutritionist. Together, the educators provide
healthy vegetarian food, a cooking class elective and a hands-
on nutrition health curriculum.В The 22 students at Cleburne
Adventist Christian School, located inВ Cleburne, Texas
run one mile every day, and then play sports or participate in
other activities for at least an hour a day. Students accumulate
credits and can earn rewards for their participation.
The Filipino Capital SDA Church in Beltsville, Maryland, has
focused on helping children understand what a healthy lifestyle
means. Once a month, they host a healthy eating potluck featuring mainly vegetarian dishes. In addition, the SDA hosts quarterly cooking demos that make the preparation of healthy foods
fun. Going beyond food, the SDA promotes an “In Step for
Life” program; on the last Sunday of every month, congregants
wear pedometers to count their total steps when walking.
In the Washington, D.C. Metro Area, the Emmanuel Brinklow Church recently organized a presentation from an Ironman competitor during the “Health Minute” segment of their
worship. In addition, Brinklow created a fitness class under
the direction of a personal trainer. The class was so successful
that they now hold another class twice weekly for the entire
community. The church also utilizes nearby Brinklow Walking Trail, which wraps around 30 acres that will eventually
house the Emmanuel Brinklow health and fitness campus. The
church has also used their land to sponsor more than 20 community gardens and has incorporated a healthy lifestyles unit in
the science curriculum.
The Kettering Adventist Church in Ohio has created a
Health MinistryВ team under the guidance of their Faith Community Nurse, Mel Miller. The team is planning a Community
Garden project, during which church members will be encouraged to bring garden produce that will be delivered to
the McKinley United Methodist Church (UMC) in downtown
Dayton, Ohio. In addition, they will set up a farmers’ market
to sell fresh produce for a small fee, with all proceeds from
the market being donated to the McKinley UMC.
Palm Harbor SDA Church in Florida recently challenged
its members to participate in a half marathon or five-kilometer
race. Participants could run or walk with proceeds going to
the Childhood Obesity Foundation. “My first 5k was a great
experience,” said one participant. “When our Pastor first announced the 5k event and explained that it was a three mile
walk, I said there is no way I could walk three miles.В But the
next week when it was mentioned again, I decided I would try
it. So at age 80, I started practice for the three mile walk…I
was able to complete the event.В Now I am looking forward
to another marathon.”
87
AmpleHarvest.org
Many Americans lack access to fresh and affordable
fruits and vegetables. At the same time, there are
more than 40 million Americans who grow food
and often can’t use everything they grow. AmpleHarvest.org was created to connect those growers
with those who need the food the most. Since
2009, AmpleHarvet.org has connected thousands
of home gardens with more than 5,000 registered
local food pantries—70 percent of which are run
by faith-based organizations—across all 50 states.
AmpleHarvet.org didn’t create anything new, per
se, but connected the dots between those who
wanted to and could donate and those who need
fresh foods. The donations help food pantries save
money and invest in other necessities. AmpleHarvet.org enables anyone to be a philanthropist:
with a $2 pack of seed, someone can grow $50
worth of food and donate what they don’t need.
At no cost to donors, pantries or taxpayers, AmpleHarvest.org has:
nR
egistered nearly 5,100 food pantries;
n In 2011, helped growers donate more than 21
million pounds of freshly harvested produce; and
nH
elped millions of pantry clients feed their
families fresh food.
Gary Oppenheimer, AmpleHarvest.org founder
and executive director, “urges communities to
engage their policy-makers in getting local sourced
foods to those in need.”
AmpleHarvest.org connects growers with pantries to ensure those without fresh food gain
access. “We are trying to change the system of
how people are getting healthy food. Once a
grower starts, he will donate food for the rest of
his gardening life. Working with growers and food
pantries has created a permanent sustainable solution,” said Oppenheimer. “Please visit www.AmpleHarvest.org/waystohelp to learn how you can
help AmpleHarvest.org help your community.”
4. Examples of Improving Nutrition and Physical Activity in Schools
Nearly 23 million children and teens in the
United States are considered overweight or
obese—a problem that is exacerbated when
junk food and sugary drinks are sold in schools.
The Alliance for a Healthier Generation, which
provided the following examples of how some
schools have focused on improving the quality
of food and drinks they serve, is a non-profit
organization founded by the American Heart
Association and William J. Clinton Foundation.
For the past seven years, the Alliance has worked
with families, schools, doctors, and communities
to achieve its goal of reducing the prevalence of
childhood obesity by 2015.В While the USDA works to create a common set
of improved nutrition standards for “competitive foods” (all foods and beverages available
outside of school meals, such as those sold in
vending machines, cafeteria Г la carte lines
and school stores), many schools have already
started replacing unhealthy items with more nutritious choices on their own. As the examples
below show, students are responding positively
by purchasing and eating healthier foods.
Healthy Schools Program Interim Evaluation Shows Progress
88
The Healthy Schools Program, created by the Alliance for a Healthier Generation and receives major
funding from RWJF. It is the largest program in the
nation focusing on school-based obesity prevention.
The program targets schools with predominantly
low-income and minority students. In an effort to
evaluate the effectiveness of the program, researchers conducted an interim study to measure the
progress of schools that enrolled in the program in
2007-2008 and 2008-2009 school years.
beverages, health education, physical education,
physical activity outside of physical education,
before- and after-school programs and school
employee wellness. Results of the interim study
show that schools made significant changes in all
content areas.317 The most significant improvements were made to school employee wellness
and school meals, with the least amount of progress in physical education, policies and systems,
and before- and after-school programs.318
The Healthy Schools Program provides training
and technical assistance at no-cost to schools for
four years in eight content areas: policies and
systems, school meals, competitive foods and
The more training and technical assistance a school
received, the more progress it made in improving
health policies, practices and environments.319
DeLong Middle School, Eau Claire, Wisconsin
Student Population: 895
Student Demographics: 41% eligible for free or reduced-price
lunch; 81% white; 11% Asian, 4% Black
School Snapshot
Five years ago, a curious student at DeLong Middle School
asked his science teacher why the apple he ate for lunch was
grown in Washington, not Wisconsin. In addition to raising the
school’s awareness about the source of foods, this question
sparked a movement to improve the health and nutrition policies for all DeLong students. That science teacher, Mikki Brettingen, was inspired to create and advise the Wellness Warriors,
a group of students committed to healthy eating and active living. While the group got their start getting the cafeteria to serve
locally grown apples, their focus has evolved and expanded.
Thanks to the Wellness Warriors’ latest efforts, DeLong no longer sells junk food in vending machines, at concessions stands,
or at the school store. The school now offers healthier options,
such as pretzels, granola bars, water and small bottles of 100%
juice. Students also have started a vegetable garden, held health
and wellness fairs, and encouraged their teachers and parents to
follow their example. “Delong Middle School students are very
proud to go to a school where healthy habits are encouraged
and healthy choices are available,” said Brettingen.
Wisconsin Snapshot
In Wisconsin, 31 schools participate in the Healthy Schools
Program. In 2011, two schools from the state received a
national-level award from the Alliance for a Healthier Generation for their efforts to make their campuses healthier.
Rio Hondo Elementary School, Arcadia, California
Student Population: 850
Student Demographics: 81% eligible for free or reduced-price
lunch; 67% Hispanic; 21% Asian
School Snapshot
Since joining the Healthy Schools Program, Rio Hondo Elementary
School has made a lot of changes in the Г la carte foods offered
during breakfast and lunch. Gone is the chocolate milk, junk foods
and sugary beverages. Instead, students have only bottled water
in the vending machines and healthy options in the cafeteria,
including a large, fresh salad bar that includes lots of fruits and
vegetables, and even pre-portioned salad dressing. Brian Bettger,
Rio Hondo’s principal, said the district’s Food and Nutrition Department is very responsive and works closely with the school to
ensure everything meets the nutritional guidelines. In fact, after
receiving a note from a student asking for more seeds, raisins, and
other healthy toppings to spruce up the salad, Bettger put a call in
to the nutrition director and the very next day, they found dried
fruits, nuts and even more choices of salad dressing. Other school
efforts include a weekly delivery of fresh fruits and vegetables, and
a new initiative designed to increase physical activity called “P.E.
Buddies”. The program, started with the help of one of Rio Hondo’s P.E. teachers, partners the younger primary school students
with older, middle school student mentors who give them help
and inspiration as they do all the activities during their P.E classes.
California Snapshot
In California, more than 500 schools participate in the Healthy
Schools Program. In 2011, 14 schools from the state, including
two in the El Monte School District, received a national-level
award from the Alliance for a Healthier Generation for their efforts to make their campuses healthier.
Lewis Frasier Middle School, Hinesville, Georgia
Student Population: 815
Student Demographics: 66% eligible for free or reduced-price
lunch; 62% Black; 27% white; 8% Hispanic
School Snapshot
Lewis Frasier Middle School’s Healthy Schools Program initiative has an enthusiastic leader in Peggy Rayman, the school
nurse, who has enjoyed support from both the prior and current school principal. Lewis Fraiser has increased the selection
of fresh fruits and vegetables that students receive in the cafeteria. The school has also worked with vendors to make sure
that beverages sold in vending machines are compliant with
the Alliance’s School Beverage Guidelines. According to Rayman, the school is encouraged that the healthier options, such
as water and 100 percent juice, have sold just as well and have
not impacted the profitability of the vending machines or store.
Other school efforts include a 50-day Health Challenge, which
uses the USDA’s Choose My Plate website to motivate staff
to earn points for exercising and staying within their recommended daily calorie range. Because teachers and staff to serve
as role models for the students, the program encourages the
entire school to get involved to create a healthy environment.
Georgia Snapshot
In Georgia, nearly 300 schools participate in the Healthy
Schools Program. In 2011, 17 schools from the state received
a national-level award from the Alliance for a Healthier Generation for their efforts to make their campuses healthier.
89
Loring Community School, Minneapolis, Minnesota
Student Population: 435
Student Demographics: 69% eligible for free or reduced-price
lunch; 44% Black; 25% White; 17% Hispanic
School Snapshot
Loring Community School has cultivated a garden and offers
organic cooking classes to students. The school also has an
active health wellness council that includes students. Some
of the council’s efforts include encouraging students to carry
water bottles and mentoring younger students in the school
garden. In addition, the school has made an effort to ensure
their students have opportunities to be more active during
the school day. In order to increase opportunities for physical
activity, the school moved recess up in the schedule—before
lunch, which encourages students to eat more of their lunch
and return to the classroom calmer and ready to learn. The
school also encourages teachers to offer academic movement
games during which students move while they learn and have
a chance to release some energy.
Minnesota Snapshot
In Minnesota, more than 65 schools participate in the Healthy
Schools Program. In 2011, four schools from the state, including Loring Community School, received a national-level award
from the Alliance for a Healthier Generation for their efforts
to make their campuses healthier.
Lotts Creek Community School, Hazard, Kentucky
Student Population: 240
Student Demographics: 71% eligible for free or reduced-price
lunch
School Snapshot
Lotts Creek Community School’s commitment to healthy eating and physical activity is evident everywhere on campus. In
the cafeteria Г la carte line, students can now purchase fruits
and yogurt, and the school vending machines are stocked with
foods, such as cereal and granola bars, that adhere to the Alliance’s Competitive Foods Guidelines. According to the school
director, Alice Whitaker, Lotts Creek families are proud
that the school eliminated food-based fundraisers. Instead
of doughnuts, kitchen knives are now one of the fundraising
options. “Many parents have told me how much they appreciated the switch,” said Whitaker.
In addition to school events like wellness fairs and field days,
and a staff weight- loss competition, which netted 676 pounds
lost among participants in 2011, the school recently hired a
second physical education teacher to provide more exercise
opportunities for students. The school even makes its stateof-the-art fitness center available to the public free of charge.
Kentucky Snapshot
In Kentucky, 100 schools participate in the Healthy Schools
Program. In 2011, five schools from the state received a
national-level award from the Alliance for a Healthier Generation for their efforts to make their campuses healthier.
Seaman High School, Topeka Kansas
Student Population: 1,158
Student Demographics: 27% eligible for free or reduced-price
lunch; 93% White; 2% Black; 2% Hispanic
School Snapshot
Seaman High School created a healthier environment for students by offering fresh fruit during breakfast and lunch, as well as
Г la carte items and meals that are prepared with lower-calorie,
lower-fat ingredients. In addition, the school is working to ensure that drinks sold in vending machines on campus adhere to
the Alliance’s School Beverage Guidelines. According to Claudia
Welch, a P.E. teacher at Seaman High School, adjusting the
selection available in vending machines has been challenging
because it involves changing the vending contract. “We’re
90
determined to follow through because we want to create an
environment that reinforces healthy lifestyle choices at school
and at home,” said Welch.
Seaman High School also has established Wellness Wednesdays
and Fitness Fridays, activities that are designed to incorporate
nutrition and fitness information into the school day. Students and
educators at Seaman High School are committed to promoting
healthy behaviors and lifestyle choices through ongoing education.
Kansas Snapshot
In Kansas, more than 60 schools participate in the Healthy
Schools Program. In 2011, three schools from the state received a national-level award from the Alliance for a Healthier
Generation for their efforts to make their campuses healthier.
John M. Sexton Elementary School, St. Petersburg, Florida
Student Population: 718
Student Demographics: 71% eligible for free or reduced-price
lunch; 57% White; 23% Black; 11% Asian; 7% Hispanic
School Snapshot
The Г la carte options at John M. Sexton Elementary School
used to include sugary beverages and ice cream. This year,
the options include low-fat yogurt, 100 percent frozen fruit
popsicles, granola bars and trail mix instead. According to Beth
Bates, the cafeteria’s food service director, the switch was well
received by students, and the new products sold so well that
the cafeteria made a profit. Moreover, Bates now feels so enthusiastic about increasing the availability of healthier Г la carte
options in the cafeteria line that each time the school introduces a new fruit or vegetable, she dresses up to help promote
the produce. So far, she has dressed up as a green bean queen,
purple sweet potato punk rocker, and a pomegranate princess.
Other school efforts have included successfully replacing foodbased fundraisers with healthy, earth friendly alternatives like
“Grow Your Own Garden” kits. John M. Sexton Elementary
also helped encourage students to be more active by implementing a Walking School Bus program before and after school.
Florida Snapshot
In Florida, more than 200 schools serving 180,000 students participate in the Healthy Schools Program. In 2011, 46 schools from the
state, including John M. Sexton Elementary, received a nationallevel award from the Alliance for a Healthier Generation for their
efforts to make their campuses healthier. Notably, 40 of 46 celebrated schools from Florida were from Miami-Dade County.
Southeast Polk High School, Pleasant Hill, Iowa
Student Population: 1,731
Student Demographics: 27% eligible for free or reduced-price
lunch; 93% White; 3% Hispanic
School Snapshot
Last year, Glenn Dietzenbach, as former principal of Southeast
Polk Junior High School, worked closely with the previous food
services director to make sure that all foods served in the cafeteria Г la carte line and vending machines complied with the
Alliance’s guidelines for competitive foods in K-12 schools. Students are now able to purchase healthier snacks, such as popcorn and granola bars, instead of chips and cookies. In addition,
the school eliminated soda machines and concessions featuring
junk foods. According to Dietzenbach, replacing unhealthy options with healthier ones still yielded profits for the school.
Other major accomplishments included expanding the school’s
breakfast program, which now offers every student the option
of a healthy breakfast, enhancing school fitness facilities, and
eliminating food-based parties as a classroom reward.
Iowa Snapshot
In Iowa, nearly 60 schools participate in the Healthy Schools
Program. In 2011, four schools from the state, including
Southeast Polk Junior High School, received a national-level
award from the Alliance for a Healthier Generation for their
efforts to make their campuses healthier.
Southside Middle School, Florence, South Carolina
Student Population: 821
Student Demographics: 59% eligible for free or reduced-price
lunch; 49% Black; 48% White
School Snapshot
The vending machines at Southside Middle School used to offer
only sugary beverages. This year, there are healthier, lowercalorie options, such as water and 100 percent fruit juice.
And, in the cafeteria, the food service director now offers an
additional fruit or vegetable option during lunch and only uses
unsaturated fat cooking oil to prepare meals. Other school efforts have included the creation of a school garden, a walking
program before school and during lunch, and various fitness
programs - such as a dance club and participation in Fuel Up to
Play 60. Southside also promotes physical activity by broadcasting a “Jamming Minute” produced by students every Friday.
South Carolina Snapshot
In South Carolina, more than 100 schools serving nearly
60,000 students participate in the Healthy Schools Program.
In 2011, only three schools from the state including Southside
Middle School received a national-level award from the Alliance for a Healthier Generation for their efforts to make their
campuses healthier.
91
West Bolivar Middle School, Rosedale, Mississippi
Student Population: 298
Student demographics: 96% eligible for free or reduced-price
lunch; 96% Black; 4% White
School Snapshot
With the high obesity rates in Mississippi, students and staff
at West Bolivar Middle School knew they needed to make
improvements. Glenda Atkins, the school counselor, helped
coordinate a variety of efforts including: removing soda from
the vending machines and adding water; changing cooking
techniques in the cafeteria—more baking instead of frying;
and asking parents to comply with school wellness guidelines
when they send in foods for celebrations. In addition, every
classroom now receives a healthy afternoon snack—typically
a basket of fruits or vegetables, such as kiwis, melons, carrots
or cucumbers. “Students enjoy the healthy snacks and the baskets are usually empty by the end of period.” said Atkins.
West Bolivar has been able to focus on physical activity as
well. The students have physical education every day and a
new track at the school has inspired kids to walk a mile a day.
The recent improvements also have motivated many teachers
to exercise regularly and eat healthier foods. The school district now holds monthly breakfasts to inform the community
of the healthy changes taking place on campus and to ask for
input on other issues to tackle.
Mississippi Snapshot
According to the National Survey of Children’s Health,
Mississippi has the highest childhood obesity rate in the
nation—44.4 percent. Currently, more than 100 schools in the
state participate in the Healthy Schools Program, and in 2011
one school from the state (Lyon Elementary School) received
a national level award from the Alliance for a Healthier
Generation for its efforts to make its campus healthier.
Additional Alliance for a Healthier Generation Stories: Staff Wellness Successes
nA
t CTA Goodman Elementary School in Chandler, Arizona320 the staff started an Employee Wellness Boot Camp
program. Administrators hoped that the staff would be able
to lead by example through adopting healthy behaviors. The
PE teacher leads the staff Boot Camp twice a week for all employees. At first there was limited participation, but interest in
the class expanded beyond the athletic department to include
many cafeteria workers as well. Staff wellness programs have
expanded to include “Gator Wellness,” which is a bulletin
board in the cafeteria that has healthy recipes and ideas on
how to be healthy. The school also has plans to plant a garden
with the hopes of supplementing their lunch program, as well
as providing fresh produce to community families in need.
n In Charlotte, North Carolina the teacher-parent
basketball game at Idlewild Elementary School has
become a popular tradition.321 In an effort to increase
opportunities for staff wellness as well as have a healthy
fundraiser, the elementary school decided to host a
teacher-parent basketball game. The game was such a success the school plans to hold another game, which will also
include a student tournament. Not only did they have fun
while being physically active, the school also raised $800
from healthy snacks and beverages they sold at the game.
The school plans to use the money they raised to purchase
additional PE and recess equipment.
n Eau Claire Area School District in Wisconsin322 recently launched a district-wide employee wellness program.
The district hired two wellness coordinators to focus on
92
physical activity, healthy eating, stress management and
reduction of tobacco use among employees. More than
500 employees and their family members have already
enrolled in the “Step into Wellness Pedometer Program.”
The district is also conducting a health risk assessment and
employees who participate receive a $50 gift certificate and
reduced health insurance premium.
nA
dministrators at Carson High School in Carson City,
Nevada323 meet as a school wellness council to come up
with attainable health goals for the school. One year after
setting up the wellness council, employees participate in a
variety of activities, including weekend hikes, yoga, spin and
other fitness classes, and the school encourages employees
to join their bike-to-work contest. In the fall, the school
plans to begin offering a low-fat cooking class for employees to take advantage of before the holidays, and they will
add another fitness course called “Drums Alive,” which
combines aerobics, drumming and dance.
n Healthy competition is supported at Woodstock
School District in Woodstock, Illinois.324 The school
district has hosted a health fair for district employees, conducted employee wellness surveys and created the “Maintain Don’t Gain Holiday Challenge.” They started the school
year with a physical activity challenge for staff; putting together teams and having participants log all their physical activity online. During the 12-week program, the most active
team was awarded a golden foot trophy every two weeks.
Spotlight on School Nurses and Strategies to Reduce
Childhood Obesity
The National Association of School Nurses (NASN)
recognizes that school nurses are in important positions to impact the childhood obesity epidemic,
reach ethnically diverse children and provide for
better care and outcomes for students.325 School
nurses are uniquely able to care for children and
teens who are overweight and obese, especially by
accessing community resources and collaborating
with the health care community.326
The NASN recently partnered with the United
Health Foundation (UHF) to undertake an innovative school health model to address the childhood obesity epidemic, which was first piloted
in 2011 in six sites in Texas, Georgia and Florida.
Key components of this model included an educational session for school nurses about evidencebased practices, advocacy and leadership skills;
wellness coordinators in each site; strategies to
engage families, stakeholders, and the community
at large; and awarding micro-grants to school
nurses for school-based programs addressing
childhood overweight and obesity issues.
“Great support and participation from
the local community and the parents.
School staff and school nurses have
also recognized the relationship among
health, physical activity and academic
achievement.”
–School Nurse Participant
School nurse administrators and wellness coordinators were charged with facilitating and
coordinating the childhood obesity program
in each school district to promote program
engagement, engage school nurses, provide
wellness classes to the local community and link
program services to participating families. The
school nurses acted as wellness resources to the
superintendent, district leadership, school staff,
educators and local community leadership, all of
which help sustain programming at the school.
To receive the micro-grants, school nurses submitted
proposals and budgets to NASN, which received,
evaluated and disseminated the awards to each site. A
total of $60,000 was available to fund proposals, with
the average micro-grant totaling $2,500.
The project emphasizes an innovative approach,
stressing the importance of creating collaborations beyond the school from the outset as well
as having wellness coordinators to help manage
the programs. Collaborations have included a
wide range of partners, including home improvement stores, churches, other school clubs, college extension services, parks and recreation,
school food services, Parent Teacher Associations, a dairy council, county health departments,
the chamber of commerce, grocery stores,
local restaurants, and even a photographer who
helped create a photo journal of the project.
Some of the projects included:
n Improvements to a 2.1 mile designated trail connecting three schools, including better marking
on the existing path and new fitness stations;
nA
walking club for all grades during recess
times chaperoned by a teacher and a jump
rope club for upper grades;
nE
very day physical activities using Chinese
jump ropes, hula-hoops, recess videos, kick
balls, and resistance bands;
nP
layground equipment and fitness field with
portable drinking fountains;
nV
egetable and fruit gardens, portions of which
were then served in the cafeteria;
n Jogging and walking during “Wellness
Wednesdays”;
n Choosing Healthy Habits Student Planners; and
nH
ealth Fairs.
“I’m just so excited
about this. The high
school and elementary
teachers met with high
school and elementary school students,
parents, a nutrition professor and
master gardeners to discuss the garden.”
–School Nurse Participant
NASN and UHF are planning to continue the
project and underscore that the most sustained
programs included strong relationships with
partners, consistency and persistence.
93
Conclusions and
Recommendations
O
besity rates have grown dramatically over the past 15 to 20 years and are
on track to grow significantly more in the next 20 years.
The modeling study in this report shows what’s
at stake. The potential rise in obesity-related
diseases and health care costs is stunning. The
study also demonstrates the return we could see
–in terms of saving both lives and money — if we
dramatically increased the nation’s investment in
obesity prevention. We’re at a new tipping point
in the effort to prevent obesity and reverse the
epidemic. Seventy-nine million Americans are
pre-diabetic, and millions more are on the verge
of heart disease, stroke, cancer, hypertension, arthritis and other obesity-related conditions. Billions of health care dollars hang in the balance.
Unfortunately, funding for obesity prevention is
heading in the wrong direction. Federal, state and
local public health departments have faced significant cuts in recent years that are undermining the
progress being made to fight the epidemic. Even
when factoring in the Affordable Care Act’s Prevention and Public Health Fund, federal funding
for public health initiatives overall, which includes
those directed at obesity prevention, has remained
4
Section
at a relatively flat and insufficient level for years.
The budget for CDC has decreased from a high
of $6.62 billion in 2005 to $6.12 billion in 2011.327
Forty states decreased their public health budgets
from FY 2009-10 to FY 2010-11, 30 states decreased
budgets for a second year in a row, and 15 decreased
for a third year in a row.328 Combined state and local
public health job losses total 49,310 between 2008
and 2011.329 In addition, most federal programs
face automatic, across-the-board cuts of 8 percent
to 10 percent in January 2013 unless Congress restores the cuts. В This could mean a cut approaching
$500 million to CDC; according to CDC director
Thomas Friedan, such an outcome “will risk costly
and deadly spread of disease and failures to prevent
tragic and expensive health problems.” 330
TFAH and RWJF call on policymakers at all levels to
invest in obesity prevention in a way that is commensurate with the severity of the health and financial toll
the epidemic takes on the nation. In addition, TFAH
and RWJF support the following policy recommendations for addressing the obesity crisis in America:
A. Fully Implement the Healthy, Hunger-Free Kids Act, including implementation
of school meal standards on schedule and updated Nutrition Standards for
Competitive Foods
In December 2010, President Obama signed the
Healthy, Hunger-Free Kids Act (HHFKA) into law,
which reauthorizes child nutrition programs—including the national school lunch and breakfast
programs—for the next five years. The law authorized an additional $4.5 billion to provide funding
for schools that meet updated nutrition standards
for school meals. In January 2012, USDA finalized
updated nutrition standards for the school meals
programs with many of the changes being phased
in during the 2012-2013 school year. USDA, states
and districts must ensure that full implementation
continues as scheduled and adequate training and
technical assistance are provided to food service operators. Additional provisions in the HHFKA increased
the number of eligible children for school meals,
strengthened school wellness policies, and provided
training for food service workers. It also provided
USDA with the authority to update nutrition standards for all food and beverages sold in schools.
However, USDA had not yet issued required
rules for updated nutrition standards for:
n Competitive foods sold outside school meal
programs, such as those served in Г la carte
lines, in vending machines and school stores;
n Meals and snacks provided as part of the Child
and Adult Care Food Program (CACFP) that
serves more than 3 million lower-income infants,
children and impaired or older adults.
TFAH and RWJF recommend USDA issue a
draft rule for competitive foods that would
align standards with the most current Dietary
Guidelines for Americans and be based on recommendations from the Institute of Medicine.
The proposed rule should be released as soon
as possible so the public can weigh in, standards
can be finalized and implementation can begin
in schools across the country.
95
B. P
rotect the Prevention and Public Health Fund
The Prevention and Public Health Fund
(PPHF), a provision of the Affordable Care
Act, is the nation’s largest single investment
in prevention. The PPHF provides more than
$12.5 billion in mandatory appropriations over
the next 10 years to improve public health and
prevent chronic illnesses, including obesity and
related diseases, through increased screenings,
counseling and care and community-based prevention programs. PPHF dollars also provide
investments to expand and offer additional
training for the public health workforce. More
than $2 billion has been distributed from the
PPHF since 2010.
In 2012, Congress enacted legislation that cut
more than $5 billion from the PPHF to partially
offset the cost of extending certain tax cuts and
unemployment insurance, as well as the Medicare
“doc fix,” which maintains a high reimbursement
rate to doctors who accept Medicare patients. Several additional attempts have been made to eliminate the PPHF entirely or repurpose its priorities
to cover funding shortfalls in other programs.
Given the importance of the PPHF and its potential to transform the public health landscape,
TFAH and RWJF recommend that the PPHF be
preserved in full, and that it not be used to offset or justify cuts to other programs.
C. I ncrease Investments in Effective, Evidence-Based Obesity-Prevention
Programs, Including Community Transformation Grants
As the state policy tracking and stories sections
of this report demonstrate, efforts in neighborhoods around the country are helping to make
healthy choices easier for millions of Americans. Policy changes and initiatives led by Let’s
Move, the Alliance for a Healthier Generation,
the Y of the USA and ChildObesity180 are providing people with significant opportunities to
improve nutrition and increase physical activity.
These efforts show that everyone can make a difference — from employers to places of worship
to schools and out-of-school programs.
However, our modeling shows that existing efforts are not bending the obesity health and cost
curves sufficiently. We need to do more -- and do
it fast — if we’re going to put our children and
our country on a path to a healthier future. Our
health and wealth are inextricably tied. A thriving workforce and controlling health costs are two
of the most significant factors in the nation’s economic recovery. However, we cannot and will not
see improvements in health care costs or disease
rates until we make a more serious investment in
addressing the obesity epidemic.
96
Effective, evidence-based policies must be significantly expanded and engage a wide spectrum
of partners to reach their full potential.
For instance, Community Transformation Grants
(CTGs), launched in 2011 through the Affordable Care Act’s Prevention and Public Health
Fund, include a performance measure for all
funded nutrition and physical activity programs
to reduce the rate of obesity among their target
populations by 5 percent. The grants require
communities to use evidence-based approaches
and include an evaluation to ensure they meet
measurable, achievable outcomes. In the first
year of the program, more than 2,000 communities applied for CTGs, but there was only enough
funding for 61. As the modeling study in the report shows, evidence-based programs like CTGs
can reduce the incidence of obesity and its related diseases while lowering health care costs.
TFAH and RWJF recommend increased funding for CTGs and similar evidenced-based programs, provided that the increase is not the
result of a cut to another PPHF funding stream.
D. Fully Implement the National Prevention Strategy and Action Plan
The National Prevention, Health Promotion and
Public Health Council, chaired by the Surgeon
general and composed of representatives from
17 federal agencies, released the groundbreaking National Prevention Strategy in 2011, which
for the first time laid out a comprehensive action
plan for improving the health of all Americans.
The Strategy also serves as a policy guide; for instance, all programs supported by the Prevention
and Public Health Fund must be aligned with the
Strategy’s goals. The Council released a follow-up
Action Plan in 2012 that identified more than 200
specific ways in which the federal government is
working to implement the Strategy’s goals, which
include promoting healthy eating and active living. Key federal actions under way include:331
Healthy Eating
n The Department of Defense is improving
nutrition standards across the military by
updating menu standards at all base dining
facilities and providing nutrition education
and obesity counseling to all military retirees.
n HHS is implementing a program to encourage
federal agencies to purchase and serve foods
that meet standards consistent with the Dietary
Guidelines for Americans. In addition, USDA
is working to better align agriculture policies
with the nutrition goals of the DGA.
n The Federal Trade Commission (FTC) is
monitoring and analyzing food and beverage
marketing practices aimed at children to provide the latest trends data and inform future
policy discussions.
n The Department of Labor is enforcing Section
7 of the Fair Labor Standards Act to ensure
that covered female employees have reasonable time and space for expressing breast milk.
n The Food and Drug Administration is finalizing menu labeling provisions of the Affordable
Care Act to help provide consistent facts about
food choices in chain restaurants.
Active Living
n The Department of Transportation is providing funding for states and communities to increase active transportation options such as
walking paths and bike lanes.
n HHS is incorporating physical activity recommendations into Head Start and other early
childhood education programs and disseminating resources to promote the National
Physical Activity Guidelines for Americans.
n The Department of Veterans Affairs is implementing weight management programs such
as screenings and support groups for veterans
who are overweight or obese.
TFAH and RWJF recommend continued implementation of the National Prevention Strategy
across all of the 17 participating federal agencies.
E. Finalize the Interagency Working Group on Food Marketed to Children Guidelines
The Interagency Working Group on Food Marketed to Children (IWG), comprised of representatives from the FTC, CDC, FDA and USDA,
was directed by Congress to develop recommendations for standards for food marketed
to children. Last year, the IWG issued a set of
proposed voluntary principles to help guide
industry efforts to improve the nutritional profile of foods marketed to children. During the
public comment period, members of the food
and beverage industry proposed a separate set
of standards that were not as rigorous as those
suggested by IWG.
Finalized recommended guidelines from the
IWG were expected in late 2011. However, in an
omnibus FY 12 appropriations bill, Congress required the IWG to complete a cost-benefit analysis on its recommendations prior to releasing
its final recommendations, which has delayed
their release indefinitely.
TFAH and RWJF recommend that the IWG finalize and release strong, voluntary guidelines for
food marketed to children. In the interim, food
and beverage companies should work together
with scientific, public health and consumer groups
to strengthen industry standards on their own.
97
F. E
xpand Opportunities to Promote Physical Education and Physical Activity
in Schools
The Elementary and Secondary Education Act
(ESEA), first enacted in 1965 and last reauthorized in 2002 as the No Child Left Behind
Act, authorizes all federal education programs.
States and localities are largely responsible for
determining core education standards in the
United States—and provide the bulk of funding toward that end—but there is a role for the
federal government to set educational benchmarks that states and schools must meet. Should
Congress take up reauthorization legislation in
2013, there are a number of important ways
in which ESEA could be strengthened to provide additional funding to states and support
to schools to promote physical education and
physical activity without usurping state control.
For instance, the next ESEA authorization
should include provisions of the FIT Kids Act
that require local education agencies and school
boards to publish how much progress they have
made in meeting national standards for physical education and physical activity. The bill also
would provide federal funding for schools to
hire more trained physical education teachers,
as well as for researchers to further study how
physical education and physical activity affect
academic achievement.
Additionally the Carol M. White Physical Education Program, currently the centerpiece
ESEA program that supports physical activity in
schools, should be expanded. Additional proposals worth considering include the authorizing of a new Office of Safe and Healthy Students
at the U.S. Department of Education, giving
schools the option of using Title I and Title II
funds to support physical education, and ensuring that School Improvement Grant funding
can be used to encourage school environments
that foster physical health.
TFAH and RWJF urge Congress to make physical education and physical activity a priority as
it reauthorizes the Elementary and Secondary
Education Act.
G. F
ully Support Healthy Nutrition in Federal Food Programs
A range of programs included in the Agriculture Appropriations Act and the Farm Bill,
such as the Supplemental Nutrition Assistance
Program and SNAP Nutrition Education, the
Emergency Food Assistance Program, the Fresh
Fruit and Vegetable Program, and the Healthy
Food Financing Initiative, can have a major
impact on improving nutrition for millions of
Americans, particularly lower-income families.
SNAP funding, for example, has swelled during
recent years because the economic downturn
has caused millions of additional Americans to
rely on its services. Opponents are concerned
about the potential waste of federal resources.
Particularly in times such as these, federal assistance must be carefully scrutinized to prevent
fraud, maximize accountability, and ensure that
funding is directed towards eligible beneficiaries. The bottom line, however, is that providing
full support for these programs is essential to
98
promoting healthier food options for all Americans. At a minimum, current SNAP eligibility,
benefit levels, and program integrity should be
maintained to ensure that low-income Americans have the resources necessary to afford a
nutritious diet and prevent hunger.
Additionally, TFAH and RWJF support the inclusion of HFFI in the final Farm Bill. HFFI
provides one-time financing through grants
and loans to a variety of healthy food retailers, from full-service supermarkets, corner
stores and farmers markets that want to set
up shop or need to renovate or expand their
stores in low income urban or rural communities. This initiative helps boost employment
and maintain the vitality of rural communities
and urban neighborhoods. HFFI was included
in the Senate version of the Farm Bill and we
endorse this approach.
H. E
ncourage Full Use of Preventive Services and Connect Clinical Care with
Obesity-Prevention Outside of the Doctor’s Office
Under the ACA, starting in 2014, public and private insurers will be required to cover preventive
services recommended by the U.S. Preventive
Services Task Force—such as obesity counseling for children and adults—at no charge to
policyholders.
Making sure Americans access and use these services will require a significant public education
and outreach effort. A number of studies have
shown that even when free preventive services are
available, a lack of knowledge about their availability precludes many individuals from taking advantage of these services.332 Education campaigns are
particularly important to reach lower-income and
minority communities that have been traditionally
underserved by the health care system.
In June 2012, the USPTF recommended coverage for community-based obesity counseling.
Primary care physicians need to know that these
programs are now recommended and covered
for their patients. At the same time, the public
health community should be communicating
with health care providers about the specific programs to which their patients can be referred.
In addition, Medicare, Medicaid and private
insurers are all exploring new ways of providing a better continuum of care to patients. Pre-
venting obesity and managing obesity-related
diseases requires a balance between receiving
clinical health care and making healthy lifestyle
choices. Providing direct support for effective,
evidence-based programs—as well as payments
for beneficiaries to participate in them—is critical to achieving this goal.
TFAH and RWJF recommend the Centers for
Medicare and Medicaid Services (CMS) promote
increase use of cost effective, community-based
prevention, health education and counseling for
Medicare and Medicaid beneficiaries, including
by expanding the scope of practitioners who are
eligible to be reimbursed for services for intensive behavioral therapy for obesity (IBTO), to
include care beyond the doctor’s office or other
clinical care settings. This would be consistent
with the new June 2012 U.S. Preventive Services
Task Force recommendation that doctors either
provide direct counseling on nutrition and activity to their patients who are obese — or “offer
healthful diet and physical activity interventions
by referring these patients to community-based
organizations.” CMS would also be setting a
strong precedent for how private insurers can
provide better support for their beneficiaries
through community prevention as well.
Recommendations from the Institute of Medicine and
Bipartisan Policy Center (BPC)
Earlier this year, two organizations — the IOM
and the Bipartisan Policy Center (BPC) — issued
notable sets of recommendations for tackling the
obesity epidemic among scientists, public health
experts and across the political spectrum.
In May 2012, a group of leading policy, research
and public health experts developed the IOM’s
groundbreaking Accelerating Progress on
Obesity Prevention: Solving the Weight of the
Nation, which identified faster ways to prevent
obesity and related health concerns.
In June 2012, the BPC issued Lots to Lose: How
America’s Health and Obesity Crisis Threatens our
Economic Future, which includes ideas to reduce
rates of obesity and chronic diseases. The BPC issued the report as part of its Nutrition and Physical
Activity Initiative, led by former Agriculture Secretaries Dan Glickman and Ann M. Veneman, former
Health and Human Services Secretaries Mike
Leavitt and Donna E. Shalala, and various other
experts, policymakers and stakeholders.
TFAH and RWJF commend the important recommendations from the IOM and BPC.
99
IOM Committee on Accelerating Progress in Obesity Prevention
Recommendations
The IOM was charged with developing goals, recommendations, strategies and action steps that can be implemented in
the short term to accelerate progress in obesity prevention
over the next 10 years.333
The committee put together five goals:
n Make physical activity an integral and routine part of life;
n Create food and beverage environments to ensure that
healthy food and beverage options are the routine, easy
choice;
n Transform messages about physical activity and nutrition;
n Expand the role of health care providers, insurers and
employers in obesity prevention; and,
n Make schools a national focal point for obesity prevention.334
Recommendations and strategies to help the nation achieve
the five goals include:335
Recommendation 1: Communities, transportation officials, community planners, health professionals and
governments should make the promotion of physical
activity a priority by substantially increasing access to
places and opportunities for such activity.
n Enhance the physical and built environment
n Provide and support community programs to increase
physical activity
n Adopt physical activity requirements for licensed child
care providers
n Provide support for the science and practice of physical
activity
Recommendation 2: Governments and decision makers
in the business community/private sector should make
a concerted effort to reduce unhealthy food and beverage options and substantially increase healthier food
and beverage options at affordable, competitive prices.
100
n Introduce, modify and utilize health-promoting food and
beverage retailing and distribution policies
n Broaden the examination and development of U.S. agriculture policy and research to include implications for the
American diet
Recommendation 3: Industry, educators, and
governments should act quickly, aggressively and in
a sustained manner on many levels to transform the
environment that surrounds Americans with messages
about physical activity, food and nutrition.
n Develop and support a sustained, targeted physical
activity and nutrition social marketing program
n Implement common standards for marketing foods and
beverages to children and adolescents
n Ensure consistent nutrition labeling for the front of
packages, retail store shelves, menus and menu boards
that encourages healthier food choices
n Adopt consistent nutrition education policies for federal
programs with nutrition education components
Recommendation 4: Health care and health service
providers, employers and insurers should increase
the support structure for achieving better population
health and obesity prevention.
n Provide standardized care and advocate for healthy community environments
n Ensure coverage of, access to, and incentives for routine
obesity prevention, screening, diagnosis and treatment
n Encourage active living and healthy eating at work
n Encourage healthy weight gain during pregnancy and breastfeeding, and promote breastfeeding-friendly environments
n Adopt policies and implement practices to reduce overconsumption of sugar-sweetened beverages
Recommendation 5: Federal, state and local government and education authorities, with support from
parents, teachers and the business community and
the private sector, should make schools a focal point
for obesity prevention.
n Increase the availability of lower-calorie and healthier
food and beverage options for children in restaurants
n Require quality physical education and opportunities for
physical activity in schools
n Utilize strong nutritional standards for all foods and beverages sold or provided through the government, and ensure that these healthy options are available in all places
frequented by the public
n Ensure strong nutritional standards for all foods and beverages sold or provided through schools
n Ensure food literacy, including skill development, in schools
Obesity Recommendations from the Bipartisan Policy Center336
Healthy Families
nH
HS and USDA should extend federal guidelines for diet
and physical activity to all children under six and enhance
public awareness and understanding of these guidelines.
n Public-sector institutions should continue to lead by example, promoting healthy foods and physical fitness as a means
to enhance employee performance, both in the military and
within the civilian workforce.
n USDA should ensure that all its nutrition assistance programs reflect and support federal dietary guidelines.
n Families and local governments should make creative use of
technology to increase physical activity.
n All key institutions—including hospitals, workplaces, communities, government and insurance providers—should support and
promote breastfeeding with the goal of substantially increasing
U.S. breastfeeding rates for the first six months of an infant’s life.
n Local governments should use the planning process to change
the built environment in ways that promote active living.
Healthy Schools
n Childcare providers should improve nutrition and physical
activity opportunities for preschool-aged children.
n Schools should improve food and nutrition education by aggressively implementing the Healthy Hunger-Free Kids Act.
n Schools should improve nutrition and physical activity offerings, in partnership with the private sector.
nF
ederal, state and local governments, along with private
partners should explore all available avenues to increase
quality physical activity in schools.
Healthy Workplaces
n CDC, in partnership with private companies, should develop
a database of exemplary workplace wellness programs with a
rigorous cost/benefit analysis to help scale up exiting best practices in both the private sector and within government. The
Small Business Administration should provide support here.
n The federal government should both scale up successful
workplace wellness programs and continue exploring innovative approaches.
Healthy Communities
n Nutrition and physical activity training should be incorporated in all phases of medical education—medical schools,
residency programs, credentialing processes and continuing
education requirements.
n Nonclinical, community-based care is a critical tool in preventing obesity and chronic disease. We need to train and deploy
a prevention workforce to deliver this kind of preventive care.
n Public and private insurers should structure incentives to
reward effective, community-based, prevention-oriented
services that have demonstrated capacity to reduce costs
significantly over time.
nL
arge, private-sector institutions should procure and serve
healthier foods, using their significant market power to shift
food supply chains and make healthier options more available and cost-competitive.
Public Awareness and Marketing
n The food industry should adopt uniform standards for what
constitutes “better for you” foods using the Institute of Medicine Phase 2 report as a starting point and making sure industry standards are aligned with the U.S. Dietary Guidelines.
n The Ad Council or similar organizations should coordinate a
multi-media campaign to promote healthy diet and physical
activity, funded by leading private sector companies in collaboration with federal agencies.
n Food retailers should adopt in-store marketing and product
placement strategies to promote the purchase of healthier,
lower calorie products.
n States and localities should continue to innovate and experiment
with ways to promote healthier foods in the marketplace.
Food and Farm Policy
n USDA, in collaboration with other stakeholders, should
identify and address barriers to increasing the affordability
and accessibility of fruits, vegetables and legumes.
n USDA should identify and pursue further opportunities to
promote health and nutrition through nutrition assistance
programs.
n Congress should continue sustained support for relevant
research by offices of USDA.
Information Sharing and Analysis
n CDC and HHS should continue robust efforts to collect and
disseminate information on food, physical activity and health—
including information on the social determinants of health and
future costs—and Congress should continue to support these
monitoring and information-gathering functions.
n Public- and private-sector organizations active in this field
should partner to establish a national clearinghouse on
health-related nutrition and physical activity initiatives. The
clearinghouse should provide links to further resources,
technical assistance, coordination and partnership opportunities, and up-to-date research findings.
101
APPENDIX A: PHYSICAL ACTIVITY AND NUTRITION TRENDS
W
eight is determined by an energy balance between what an individual
eats and how active he or she is. The trend in America over the past 20
years to 30 years has been a decrease in physical activity combined with an increase
in food intake, particularly of less nutritious food. The following section outlines
how patterns have changed and current recommendations for improving health.
A. Physical Activity
Sixty percent of Americans are not active
enough to achieve health benefits, and more
than a quarter of adults do not engage in any
leisure-time physical activity.337, 338
In 2010, fewer than 50 percent of adults met the
2008 federal physical activity guidelines for aerobic activity (based on leisure-time activity).339
In 2011, only 29 percent of high school students
had participated in at least 60 minutes per day
of physical activity on each of the seven days
before the survey, while 14 percent had not
participated in 60 or more minutes of any kind
of physical activity on any day during the week
before the survey.340
SOME KEY TRENDS IN INSUFFIENT PHYSICAL ACTIVITY IN AMERICA
Adults
n More than a quarter of U.S. adults do not engage in any leisuretime physical activity (i.e., any physical activities or exercises
such as running, calisthenics, golf, gardening or walking).341
s The percentage of adults who do not engage in any leisuretime physical activity is higher among Blacks (31.9 percent)
and Latinos (34.6 percent) than Whites (22.2 percent).342
n A study of more than 30,000 healthy adult U.S. women
found that middle-aged women need at least an hour of
moderate activity a day to maintain a healthy weight without restricting calories.343
s For more than 66 percent of middle-aged women who are
already overweight or obese, even more exercise is recommended to avoid gaining weight without eating less.344, 345
n Physical activity is significantly associated with better survival and function among the very old (age > 85 years).346
s “Non-leisure-time physical activity” is defined as energy
spent in a normal day outside of sports, exercise and recreation. This includes manual labor on the job, walking
and biking to work and household chores.350
n A majority of U.S. adults ages 20 to 74 walk less than two
to three hours per week and accumulate less than 5,000
steps per day.351 U.S. physical activity guidelines call for
adults to walk 10,000 steps daily.
n Car usage has significantly reduced physical activity by its
frequent use for short trips for shopping, going to the cleaners and other errands, and taking children to school.352
Youth
n Current studies show that most youth do not meet physical
activity guidelines that recommend engaging in 60 minutes or
more of moderate-to-vigorous physical activity per day. 353,354
n Sedentary adults pay $1,500 more per year in health care
costs than physically active adults.347
n An analysis of accelerometer data for children and adults
shows that the amount of time spent in moderate-to-vigorous
physical activity plummets as children reach adolescence.355
n Studies suggest that moderate-to-high levels of physical activity substantially reduce, or even eliminate, the mortality
risk of obesity.348
n The number of children walking to and from school has declined dramatically over the past 40 years, from 48 percent
of students in 1969 to 16 percent of students in 2001.356
n Non-leisure time physical activity has decreased substantially in the past 20 years to 30 years due to increasing
mechanization at work and at home.349
n There is substantial evidence that physical activity has a positive effect on students’ academic performance, including
grades and standardized test scores, according to a review
of 50 studies conducted by CDC.357
102
THE IMPACT OF THE BUILT ENVIRONMENT ON PHYSICAL ACTIVITY
Physical Activity
nL
ess safe neighborhoods were associated with decreased
levels of physical activity according to a study of more than
12,000 students in grades 8-10 who live in urban, suburban
and rural neighborhoods.358
s The same study found students’ perception of safety as
they traveled to and from school also was associated
with physical activity levels.359
n Neighborhoods with high levels of poverty are significantly
less likely to have places where children can be physically active, such as parks, green spaces and bike paths and lanes.361
n In general, states with the highest levels of bicycling and walking have the lowest levels of obesity, high blood pressure and
diabetes, and have the greatest percentage of adults who meet
the recommended 30-plus minutes a day of physical activity.362
n Children and teens living in neighborhoods with more green
space, such as parks, playing fields, trails and schoolyards,
were less likely to be overweight than their counterparts in
less-green neighborhoods.360
Walking in America: Only a Pastime?
Number of Steps
Walking is free and just a few of the proven benefits include
a lower risk of Alzheimer’s, improved academic performance, reduced depression, lower blood pressure and
increased self-esteem, yet, for many Americans, walking has
become just a means of getting to the car.363
20000
18000
16000
14000
12000
10000
8000
6000
4000
2000
0
Average Steps Per Day
Australian
adults
Swiss
Japanese
Average Old order American Canadian Child in
Britain
child
American Amish
child
6-19 yrs. 5-19 yrs. 8-11 yrs.
* Old Order Amish do not drive cars.  Note: Rates for children’s number of steps show a reported low-to-high range.
Americans take the fewest steps of any industrialized nation. В Recent pedometer studies show adults in Australia
and Switzerland average almost 10,000 steps a day, with
adults in Japan averaging more than 7,000, but in the United
States adults manage little more than 5,000 steps per day.364В В Children take significantly more steps than adults; steps per
day range between 9,000 and 13,000 for American children
and youth, which is similar to children in Britain and Canada,
who average between 11,000 and 13,000.365В In an effort to
compare how much Americans walk today as opposed to
the past, a study in Medicine & Science in Sports and Exercise
reports that researchers provided pedometers to a group
of Old Order Amish in Canada who do not drive cars and
found that they averaged 18,000 steps per day.366В The previous studies include most of the limited statistics
currently available about the state of walking in America.
Trying to figure out exactly how much Americans walk, and
why walking has decreased so dramatically, is difficult with
limited data, but, while walking statistics are hard to come
by, there is more robust information on changes in driving.
The National Household Travel Survey reveals that in 1969 a
person averaged 2.32 trips and 20.64 miles in a car per day,
which increased to 3.35 trips and 32.73 miles in 2001.367
While there are various organizations dedicated to advocating for bicyclists, there are few advocacy groups working
solely for the rights of walkers.368 Scott Bricker, director of
the nonprofit organization America Walks says that, “Walking is not something that people rally around — it’s very pedestrian.”369 The lack of excitement also may be the cause
of the limited statistics surrounding walking in America. According to Bricker, “[the] collection of information around
walking is quite poor and inconsistent.”370 The U.S. Census
reports the most accurate measures of walking, but they
only measure walks that are a part of a work commute.
Unfortunately, those questions miss out on a lot of walks, as
commuting accounts for less than 15 percent of all trips.371
Twenty-eight percent of all trips taken in America are under
a mile, yet most of these trips are taken in the car.372
103
2008 PHYSICAL ACTIVITY GUIDELINES FOR AMERICANS
In 2008, the U.S. Department of Health and Human Services
issued the first-ever Physical Activity Guidelines for Americans.373
The Guidelines provide information on the types and amounts
of physical activity that provide substantial health benefits
for Americans age 6 and older. The main idea behind the
Guidelines is that regular physical activity over months and
years can produce long-term health benefits.
Adults
n The guidelines recommend that adults engage in a minimum
of two-and-a-half hours each week of moderate-intensity
exercise, or one-and-a-quarter hour of vigorous physical
activity.
s Brisk walking, water aerobics, ballroom dancing and general gardening are examples of moderate-intensity aerobic activities. Vigorous-intensity aerobic activities include
race walking, jogging or running, swimming laps, jumping
rope and hiking uphill or with a heavy backpack.
n Aerobic activity should be performed in episodes of at least
10 minutes.В nF
or more extensive health benefits, adults should increase
their aerobic physical activity to five hours per week of
moderate-intensity or two-and-a-half hours per week of
vigorous-intensity aerobic physical activity.
n Adults should incorporate muscle strengthening activities
such as weight training, push-ups, sit-ups, carrying heavy
loads or heavy gardening at least two days per week.
Older Adults
n Older adults should follow the guidelines for other adults
when it is within their physical capacity. If a chronic condition prohibits their ability to follow those guidelines, they
should be as physically active as their abilities and conditions
allow. If they are at risk of falling, they should also do exercises that maintain or improve balance.
Pregnant Women
nD
uring pregnancy and the time after delivery, healthy
women should get at least two-and-a-half hours of moderate-intensity aerobic activity per week, preferably spread
throughout the week.
n Pregnant women who habitually engage in vigorous aerobic
activity or who are highly active can continue during pregnancy and the time after delivery, provided they remain
healthy and discuss with their health care provider how and
when activity should be adjusted over time.
104
Adults with Disabilities
n Adults with disabilities who are able should get at least twoand-a-half hours of moderate aerobic activity per week, or
one-and-a-quarter hour of vigorous aerobic activity per week.
n Adults with disabilities should incorporate muscle-strengthening activities involving all major muscle groups two or
more days per week.
n Those who are not able to meet the guidelines should engage in regular physical activity according to their abilities
and should avoid inactivity.
Adults with Chronic Medical Conditions
n Adults with chronic conditions get important health benefits
from regular physical activity. They should do so with the
guidance of a health care provider.
Children and Adolescents
n Children and adolescents should engage in 60 minutes or
more of physical activity daily.
s Aerobics: Most of the 60 or more minutes should include
either moderate- or vigorous-intensity aerobic physical
activity, and should include vigorous-intensity physical activity at least three days a week. Examples of moderateintensity aerobic activities include hiking, skateboarding,
rollerblading, bicycle riding and brisk walking. Vigorousintensity aerobic activities include bicycle riding, jumping
rope, running and sports such as soccer, basketball and
ice or field hockey.
s Muscle-strengthening: The 60 or more minutes of daily
physical activity should include muscle-strengthening
activities at least three days a week. Examples of musclestrengthening activities for younger children include:
gymnastics, playing on a jungle gym and climbing a tree.
Examples of muscle-strengthening activities for adolescents
include; push-ups, pull-ups and weightlifting exercises.
s Bone-strengthening: The 60 or more minutes of daily
physical activity should include bone-strengthening activities at least three days a week. Examples include jumping
rope, running and skipping.
n Encouraging young people to participate in physical activities that offer variety, are enjoyable, and are age-appropriate can increase the amount of time children and youths
spend being active.
Are Physicians Encouraging Physical Activity?
Data collected through the National Health Interview Survey (NHIS) show improved trends in
sharing information about physical activity from
physician to patient over the past 10 years.374 In
2010, almost one-third of adults who had seen a
physician or health professional in the previous
12 months were advised to start or continue an
exercise program.375 These figures improved
significantly and showed an increase of approximately 10 percent from 2000 to 2010.376
Physicians or other health providers improved
the rates among all age groups and ethnicities, as
well as for both males and females. Physicians
were more likely to discuss physical activity
programs with patients who were either overweight or obese, but continued to advise all patients about the benefits of physical activity.377
The trends show that the health community is
making efforts to improve communication between patients and physicians about the importance of physical activity, yet physicians are still
only discussing physical activity with less than
half of their patients.
Get Active to Feel Good
A recent study in the Journal of Sports and Exercise Psychology found that undergraduates
who were more active felt better than their
less-active peers.378 Almost 200 college-aged
students kept journals for eight days, tracking
their physical activity, the amount of sleep they
got each night and their overall mental state and
then turned the journals over to researchers.379
The researchers found that physical activity was
also associated with more positive moods.380
105
B. NUTRITION
TRENDS IN AMERICAN’S UNHEALTHY EATING PATTERNS
The American diet has skewed towards large portion sizes that
are high in fat and calories. The USDA reports that Americans
are not meeting the 2005 Dietary Guidelines for Americans. In
order to meet them, Americans would need to substantially
lower their intake of added fats, refined grains, sodium and added
sugars and sweeteners, and increase their consumption of fruits,
vegetables, whole grains and low-fat milk and milk products.381
Some unhealthy eating habits that have developed over the
past few decades include:
More Calories and Fat
nA
mericans’ average daily caloric intake is 300 calories higher
than it was in 1985 and 600 calories higher than in 1970, according to 2008 USDA data.382
nA
mericans consumed an average of 640 calories worth of
added fats per person per day in 2008.383
nC
hildren ages 2–18 consume almost three snacks a day, and
snacking accounted for up to 27 percent of children’s daily
caloric intake.384
Bigger Portion Sizes
nA
ccording to National
Heart Lung and Blood Institute (NHLBI), an individual
who consumes the following meal today compared
to 20 years ago would consume almost 1,600 more
calories in one day.385В s Breakfast: a bagel
(6 inches in diameter)
and a 16-ounce coffee
with sugar and milk.
sL
unch: two pieces of pepperoni pizza and a
20-ounce soda.
s Dinner: a chicken
Caesar salad and a
20-ounce soda.
Portion Distortion
20 Years ago
Bagel
Today
3 inches (diam.) 6 inches (diam.)
Cheeseburger
4.5 ounces
8 ounces
Popcorn
5 cups
11 cups
Soda
n A July 2012 survey found that Americans are trying to eat
more fruits and vegetables, but they are still consuming less
than half of national recommendations.388
More Sugar
n Consumption of “added sugars,” which are sugars and
syrups that are added to foods or beverages when they
are processed or prepared and does not include naturally
occurring sugars such as those in milk and fruits, is nearly
three times the USDA recommended intake.389
n Average consumption of added sugars increased 14 percent
from 1970 to 2008.390
A Large Increase in Soda, Fruit Juice and Other
Sugar-Sweetened Beverage Consumption
n Sugar-sweetened beverages make up nearly 11 percent of
children’s total caloric consumption.391
n Adults who drink a soda or more per day are 27 percent
more likely to be overweight than those who do not drink
sodas, regardless of income or ethnicity.392
n From 1988-1994, adults ages 20 and older increased their
consumption of sugar-sweetened beverages by 58 percent,
and from 1999-2004 consumption of sugar-sweetened beverages increased by 63 percent among the same population.393
n By 1999–2004, adults ages 20-24 consumed 12 percent of
their total daily intake from sweetened beverages.394
n Children who reduced their consumption of added sugar by
the equivalent of one can of soda per day had improved glucose
and insulin levels. This means that parents can reduce the risk of
type 2 diabetes in their children by eliminating one can of soda
per day, regardless of any other diet or exercise changes.395
A Major Increase in Eating Out
6.5 ounces
20 ounces
Fewer Fruits, Vegetables and Whole Grains
n From 2005-2008 adults consumed 1.1 to 1.8 servings of fruit per
day and 1.3 to 2.2 servings of vegetables per day.386 Teenagers
eat only 0.9 cups. Overall, adolescents consume 0.9 to 1.1 cups
of vegetables, with only 4 percent of those 15-19 eating 2 or
more cups of fruits per day and less than 2 percent of all children
eating 2.5 or more cups of vegetables per day.387В The recommended values are two cups of vegetables and two cups of fruits
106
per day for an individual who consumes 2,000 calories a day, and
someone who consumes about 1,400 daily calories should have
11/2 cups of vegetables and 11/2 cups of fruits per day.
n Since the 1960s, the money Americans spend on foods eaten
outside the home has nearly doubled; the average American
household spent $2,505 on food away from home in 2010.396,397
n More than 40 percent of adults report that restaurants are
an essential part of their lifestyle.398
n As of 2004, 63 percent of children ages 1–12 ate out at a
restaurant one to three times per week.399
n For 2012, restaurants project food and drink sales of $631.8
billion, compared with just $379 billion in 2000.400
NUTRITION: BIOCHEMICAL INDICATORS
In 2012, CDC released the second report in a
series on biochemical indicators.В The goal of The
National Report on Biochemical Indicators of Diet
and Nutrition in the U.S. Population is to inform
physicians, scientists, public health officials and
policymakers about varying levels of biochemicals
in a person or group of people, and how those
levels affect health outcomes.401В The results help
inform experts on the need for diet and nutrition
recommendations to address disease, obesity and
improve health. The information in the report,
which was collected through the NHANES, contains information for 58 biochemical indicators.В Some of the key findings include the
following:402
nV
itamin B6, iron and vitamin D are the three
nutrients for which the greatest number of
people were deficient.
n Vitamin A, vitamin E and folate are the three nutrients with the lowest prevalence of deficiency.
nV
itamin C and vitamin B12 had intermediate
prevalence of deficiency.
Folate is naturally occurring in leafy green vegetables, fruits, peas and dried beans and is especially
important during pregnancy and infancy. To reduce the risk of neural-tube defects in newborns,
FDA began fortifying foods with folic acid in 1998.
Key findings from the report about folate
include the following:403
nO
f all age groups, older people had the highest blood folate levels.
nF
emales generally had higher levels than males.
nN
on-Hispanic Blacks had the lowest, nonHispanic Whites had the highest, and Mexican
Americans had intermediate folate status.
Vitamin D is naturally occurring in fish-liver oils,
fatty fishes, mushrooms, egg yolks and liver, and
is commonly added to milk and other foods in
the United States. Ultraviolet rays from the sun
help vitamin D transport from the skin to the
liver. Vitamin D is essential for bone health, and
may be important for muscle strength and protecting against cancer and type 2 diabetes.
Key findings from the report about vitamin
D include the following:404
n Levels generally decreased as age increased.
n Males and females had similar levels.
n Among three racial and ethnic groups studied
in the report, non-Hispanic Blacks had the
lowest vitamin D levels, Mexican Americans
were in the middle and non-Hispanic Whites
had the highest levels.
Iron is an important nutrient that is needed to
carry oxygen to tissue, and iron deficiency is
linked to reduced physical capacity, poor pregnancy outcomes and poor cognitive development among infants and adolescents.
Key findings from the report about iron include the following:405
n Children ages 6 to 11 had the lowest iron
levels compared with other age groups.
n Regardless of the indicator selected for iron
measurement, the likelihood of being iron
deficient varied by race/ethnic group.
n While children and women of childbearing
age were at risk for iron deficiency, men were
at risk for iron excess.
Iodine is an essential element that takes part in
regulating the body’s metabolic processes related
to growth and development. Globally, iodine
is added to salt and seafood, but in the United
States it is not mandatory, so most people rely on
dairy products and bread for their iodine intake.
Iodine deficiency is the most preventable cause
of mental retardation, and also is related to hypothyroidism, goiter, cretinism and other growth
and developmental abnormalities.
Key findings from the report about iodine
include the following:406
n The lowest levels of iodine were observed in
young women, while the highest levels were
observed in children.
n No consistent pattern was observed with
regard to race or ethnicity.
n Urine iodine levels have been relatively stable
since the late 1980s.
107
THE IMPACT OF THE BUILT ENVIRONMENT ON NUTRITION
nA
systematic review of nearly 50 studies
examining the built environment found that
increasing supermarket access for disadvantaged individuals or areas, identified by low
socioeconomic status, black race or Hispanic
ethnicity, had potential to reduce obesityrelated health disparities.407
nA
large-scale study of New York City adults
found that increasing the density of healthy
food outlets, such as supermarkets, fruit and
vegetable markets, and natural food stores is
associated with lower BMIs and lower prevalence of obesity.408
n A 2003 study showed a direct relationship
between living near at least one supermarket
and meeting the U.S. Dietary Guidelines for
Americans for fruit and vegetable intake.В The
presence of each additional supermarket was
related to a 32 percent increase in fruit and
vegetable consumption among Blacks and an
11 percent increase among Whites.409
n A study of nearly 700 neighborhoods found that
lower-income areas have access to half as many
supermarkets as the wealthiest areas. Predominantly minority and racially mixed communities
have access to fewer supermarkets compared
with predominantly White communities.410
2010 DIETARY NUTRITION GUIDELINES FOR AMERICANS
The Dietary Guidelines for Americans are a joint
initiative of the Department of Health and Human
Services and the Department of Agriculture.411
The Dietary Guidelines, which have been published every five years since 1980, provide people
with advice about how good dietary habits can
promote health and reduce risk for major chronic
diseases. They serve as the basis for federal food
and nutrition education programs.
Key Recommendations
n Consume a variety of nutrient-dense foods
and beverages within and among the basic
food groups, while picking foods that limit the
intake of saturated and trans fats, cholesterol,
added sugars, salt and alcohol.
nC
onsume more dark green vegetables, orange vegetables, legumes, fruits, whole grains,
and low-fat milk and milk products.
nE
at fewer calories, refined grains, added sugars, and total fats. Eat foods lower in sodium.
n Build healthy eating patterns during each stage of
life—childhood, adolescence, adulthood, pregnancy and breastfeeding and older age—to meet
nutrient needs and appropriate calorie amounts.
n Increase physical activity and reduce time
spent in sedentary behaviors.
Specific Recommendations for Adults
nA
n adult consuming 2,000 calories per day
should have two cups of fruit and two-and-ahalf cups of vegetables.
108
n Consume three or more ounce-equivalents of
whole-grain products per day. At least half of
grain intake should come from whole grains.
n Consume three cups per day of fat-free or
low-fat milk or milk products.
n Increase dietary intake of calcium, potassium,
fiber, magnesium, and vitamins A, C, and E.
n Avoid inactivity and sedentary behaviors;
some physical activity is better than none, but
it’s recommended that adults should engage
in at least 150 minutes a week of moderateintensity or 75 minutes a week of vigorousintensity aerobic activity.
Specific Recommendations for Children
and Adolescents
n At least half of grains consumed should be
whole grain. Children ages 2–3 should consume two cups per day of fat-free or low-fat
milk or milk products, children ages 4-8
should drink 2.5 cups, and children age 9 and
older should drink three cups per day.
n Reduce intake of sugar-sweetened beverages
and monitor the intake of 100 percent fruit juice.
n Increase dietary intake of calcium, potassium,
fiber, magnesium and vitamin E.
n Participate in one hour or more a day of moderate- to- vigorous physical activity.
APPENDIX B: Methodology for Behavioral Risk Factor
Surveillance System for Obesity, Physical Activity,
and Fruit and Vegetable Consumption Rates
Methodology for Obesity and Other Rates Using BRFSS
Annual Data
Data for this analysis were obtained from the
Behavioral Risk Factor Surveillance System
(BRFSS) dataset (publicly available on the web
at www.cdc.gov/brfss). The data were reviewed
and analyzed for TFAH and RWJF by Daniel
Eisenberg, Ph.D., Associate Professor, Health
Management and Policy at the University of
Michigan School of Public Health.
BRFSS is an annual cross-sectional survey designed to measure behavioral risk factors in the
adult population (18 years of age or older) living in households. Data are collected from a
random sample of adults (one per household)
through a telephone survey. The BRFSS currently includes data from 50 states, the District
of Columbia, and Puerto Rico.
Variables of interest included BMI, physical inactivity, diabetes, hypertension, and consumption of fruits and vegetables 5 or more times a
day. BMI was calculated by dividing self-reported
weight in pounds by the square of self-reported
height in inches, then multiplied by 703. Obesity
is defined as BMI greater than or equal to 30.
An overweight adult was defined as one with a
BMI between 25 and 30. For the physical inactivity variable a binary indicator equal to one was
created for adults who reported not engaging in
physical activity or exercise during the previous
thirty days other than their regular job. For diabetes, researchers created a binary variable equal
to one if the respondent reported ever being told
by a doctor that he/she had diabetes. Cases of
gestational and borderline diabetes were not
counted as diabetes, and cases where the individual was unsure or refused to answer were excluded from the analysis.Similarly, to calculate
prevalence rates for hypertension, researchers
created a binary variable equal to one if the respondent answered “Yes” to the following question: “Have you ever been told by a doctor, nurse or
other health professional that you have high blood pressure?” People reporting to have been borderline
hypertensive and women who reported being diagnosed with hypertension only while pregnant
were not counted as having hypertension.
All estimates were adjusted to account for the
sample design and survey nonresponse using
the sample probability weight, _LLCPWT.
The following is a Question and Answer Document Provided by CDC for the methodology
used for 2011 BRFSS data
Frequently Asked Questions AboutChanges
to the Behavioral Risk Factor Surveillance
System
Q: What is the BRFSS?
A: The Behavioral Risk Factor Surveillance System is the largest ongoing telephone health
survey in the world. It is a state-based system of
health surveys established by the Centers for
Disease Control and Prevention in 1984. BRFSS
completes more than 400,000 adult interviews
each year.
For most states, BRFSS is their only source of population-based health behavior data about chronic
disease prevalence and behavioral risk factors.
BRFSS surveys a sample of adults in each state
to get information on health risks and behaviors, health practices for preventing disease,
and healthcare access mostly linked to chronic
disease and injury. The sample is representative
of the population of each state.
Q: What are the changes that have been made
to BRFSS?
A: The two BRFSS changes have been made to
keep the data accurate and representative of
the total population. These are making survey
calls to cell-phone numbers and adopting an
advanced weighting method.
n The first change is including and then growing the number of interview calls made to cell
phone numbers. Estimates today are that 3
in 10 U.S. households have only cell phones.
n The second change is to replace the “poststratification” weighting method with a more
advanced method called ”iterative proportional fitting,” also sometimes called “raking.” 109
Q: Why is it necessary to increase the number of
survey calls to cell-phone numbers?
A: During 2003—2009, the proportion of U.S.
adults who lived in cell phone-only households
increased by more than 700%, and this trend is
continuing. Estimates are that currently 3 in 10
U.S. households have only cell phones.
These households increasingly were left out of the
population that BRFSS seeks to characterize—
adults 18 years of age or older who do not live in
institutional settings. Using cell phones only is especially strong in younger age groups and among persons in certain racial and ethnic minority groups.
Because of differences in the characteristics
of people living in households with or without
landline telephones, all telephone surveys in
the United States have had to adapt their methods in response to the significant increase in
households that use cell phones only.В Q: Why is it necessary to adopt a different
method of data weighting?
A: For the past several decades, BRFSS used a
statistical weighting method called “post-stratification.” However, the advent of easily accessible
ultra-fast computer processors and networks
has allowed the BRFSS to adopt an advanced
weighting method called iterative proportional
fitting, also known by its nickname, “raking.” Raking differs from post-stratification because
it incorporates adjustor variables one at a time
in an iterative process, rather than imposing
weights for demographic subgroups in a single
process.В A key advantage of raking is that many
more variables are used than post stratification.
In addition to the standard demographic variables of age, gender, and race and ethnicity, raking uses variables such as education level, marital
status, renter or owner status, and phone source.
Q: What steps were taken to implement these
BRFSS changes?
A: In 2004 a panel of national survey experts
recommended that CDC make the two changes
to ensure BRFSS data remained valid and useful. Beginning in 2006, how to best design and
implement the changesВ went through an extensive development process with experts, collaboration with the state BRFSS coordinators to pilot
test the new methods, and training to ensure
that state BRFSS coordinators understood the
changes and the rationale for them.В 110
The changes were discussed at the annual
BRFSS Conferences in 2007, 2008, 2009, 2010
and 2011; with CDC and state members of the
BRFSS Working Group; at training sessions; and
at meetings of NACCHO, APHA, CSTE, and the
American Association of Polling and Opinion
Research (AAPOR) in 2009, 2010, and 2011.
In September 2011, BRFSS provided states and
CDC programs with preliminary datasets that incorporated the new methods so that early assessment
could be made of the effects of the new methods.
The 2011 BRFSS dataset will be released by CDC
in June 2012. It will incorporate both changes: cell
phone responses and the new weighting method.
Q: How will these two changes affect each
state’s dataset?
A: Including cell phone interviews and using the
new weighting method will keep BRFSS data accurate and meaningful. Specifically, BRFSS data
will better represent lower-income and minority
populations, as well as populations with lower levels of formal education.В The size and direction
of the effects will vary by state, the behavior under
study, and other factors. Although generalizing is
difficult because of these variables, it is likely that
the changes in methods will result in somewhat
higher estimates for the occurrence of behaviors
that are more common among younger adults
and to certain racial and ethnic groups.
Q: When will we first see BRFSS data that reflects the two changes?
A: The first data reflecting the changes is the
BRFSS 2011 dataset that CDC releases in June
2012.
Q: Can the 2010 BRFSS dataset be compared
with 2011 dataset?
A: It is always difficult to discern long-term trends
by comparing one year to the next. Such comparisons will be especially difficult to make for 2010
and 2011, given the change in BRFSS methods.
Changes in the 2011 data are likely to show indications of somewhat higher occurrences of
risk behaviors common to younger adults and
to certain racial or ethnic minority groups. Such
effects will vary for each state survey. CDC anticipates small increases for health-risk indicators
such as tobacco use, obesity, binge drinking,
HIV, asthma, and health status.
Shifts in observed prevalence from 2010 to 2011
for BRFSS measures will likely reflect the new
methods of measuring risk factors, rather than
true trends in risk-factor prevalence.
Q: Where can I learn more about the BRFSS
changes?
A: The BRFSS changes are discussed in detail
in the June 7, 2012, MMWR Policy Note “Methodologic Changes in the Behavioral Risk Factor
Surveillance System in 2011 and Potential Effects on Prevalence Estimates.”
APPENDIX C: METHODOLOGY FOR OBESITY AND RELATED
DISEASE AND COST FORECASTING FOR 2020 AND 2030
As prepared by the research team from the National Heart Forum:
The alarming growth of obesity around the
globe has caused some to describe it as an obesity
epidemic. One recent study examined trends in
BMI from 1980 to 2008 for 199 countries and
found an increase in overweight and obesity
in almost all countries, and estimated that 500
million adults worldwide were obese in 2008.412
Of the high income countries in the study, the
USA had the highest BMI. The most recently
published data from the National Health and
Nutrition Examination Survey (NHANES) has
indicated that US adults had a mean body mass
index (BMI; kg/m2) in the overweight range
(28.7) and that nearly 36% were obese.413 Furthermore, the NHANES data suggests that the
rise in obesity may still be continuing in the USA,
with men and women from some ethnic groups
continuing to show a positive linear trend in
BMI and obesity rates even in the last decade.414
Obesity is a significant risk factor for many diseases, contributing to a global health burden.
Epidemiological studies have identified obesity
as a specific risk factor for cardiovascular diseases (e.g. hypertension, coronary heart disease
and stroke), diabetes mellitus, osteoarthritis,
several types of cancer and other diseases too
numerous to be listed here.415,416,417,418,419,420,421
Given the current trend of global increases in
obesity, the burden of these diseases is expected
to continue to overwhelming levels. The full
extent of this burden is, as yet, unclear, but the
economic impact will include decreased quality
of life and fewer working years as well as rapidly
rising healthcare costs.
Predicting future rates of obesity, disease and
healthcare costs are helpful in order to guide
policy towards ameliorating the epidemic, and
planning the most fair and effective division of
resources. In a previous report, we used a simulation model to project the likely health and economic consequences over the next two decades,
if obesity were to continue to rise according to
current trends.422 This model predicted that
there would be 65 million more obese adults
in the United States by the year 2030 and that
the medical costs associated with obesity-related
diseases would increase by 48 to 66 billion US
dollars every year. The simulation model also
detailed what could be expected if interventions
were able to reduce BMI by either 1 percent or
5 percent across the U.S. population, indicating
that 2.4 million cases of diabetes and 1.7 million
cardiovascular diseases could be prevented.
Given evidence that obesity trends may differ
between men and women, and between different ethnic groups, it is now important to
make future predictions at a micro-level. This
paper reports the result of micro-simulations
projecting obesity rates, disease prevalence and
associated healthcare costs up to 2030, for 51
American states and territories.
METHOD: BRFSS AND MODELING OVER TIME
An individual’s body mass index (BMI) is
defined as:
data from the BRFSS, BMI was grouped in the
following three categories:
BMI"=w/h2 x 703 ,
1) BMI < 25 : (normal weight)
where w and h correspond to individual’s weight
and height, respectively. BMI provides a simple
measure of a person’s “fatness” or “thinness”. Although BMI is measured on a continuous scale,
it is commonly grouped in three categories,
namely, “underweight,” “normal-weight,” “overweight” and “obese.” In adults, BMI increases
slowly with age and age-independent cut-offs
can be used to grade obesity.423 These cut-off
points are related to health risk but also are convenient round numbers.424 For the purpose of
estimating the trends for obesity in adults using
2) BMI > 25 < 30 : (overweight)
3) BMI >30 : (obese)
All models were fitted on bias-corrected BMI
measurements, which were obtained by calculating BMI after correcting BRFSS data of height
and weight for potential bias due to self-reporting. Bias for height and weight was assessed
by gender and age group (18-19, 20-24, 25-29,
30-34, 35-39, 40-44, 45-49, 50-54, 55-59, 60-64,
65-69, 70-74, 75-79, 80+), and was estimated as
the difference between means in population
111
height and weight obtained from BRFSS and
the National Health and Nutrition Examination Survey data collected over the time period
1999-2010. This method of estimating bias has
been discussed by Ezzati.425 Figure 1 illustrates
the extent of bias for height in men and women
due to self-reporting. Height was over-reported
in BRFSS both in men and women, particularly
in the older age groups. Figure 2 shows the
extent of bias for weight in men and women.
BRFSS measurements for weight were under-reported by women by an average of 5 kilograms.
This discrepancy between actual and reported
weight was persistent up to age 65, after which
self-reporting was decreased with age. Bias by
gender and age group was not found to change
over time during the period from 1999 to 2010.
Pregnant women were not excluded from the
analyses, and the estimation of obesity trends
was stratified by gender and age group (20-39,
40-59, 60+).
Let g=1,2,3, denote BMI group for normal
weight, overweight and obese, respectively. Let
,p-g.(t) be the percentage of individuals with
BMI values which correspond to group g at calendar year t. Multinomial regression was used to
model the percentage of individuals in each BMI
group over time, using the following equations:
Thus, all percentages ,p-1.,t., ,p-2.,t., ,p-3.,t., are
bound within [0,1], and add up to unity. The
group of obese individuals (BMI>30) was further divided into two subgroups, namely those
with 30<BMI<40, and those with BMI>40 (morbidly obese). Let s=1,2, denote BMI subgroup
30<BMI<40 and BMI>40, respectively. Amongst
those with BMI>30, let ,q-g.(t) be the percentage
of individuals with BMI values corresponding to
subgroup s at time t. The percentage of morbidly
obese individuals amongst those classified as
obese was modelled using logistic regression by
Equation (3) implies that q_2 (t)=exp[(a_0+a_1
t})]/{1+exp{a_0+a_1 t}} . Using Bayes’ rule of
conditional probabilities, the prevalence of
112
morbidly obese individuals amongst all adults
is P("BMI" >40)=P("BMI" >40-|I"BMI">30)
P("BMI" >30)=p_2 (t) q_2 (t).
To cover the complete range of ages and because data for children were not available in
BRFSS, trends for obesity in children aged
0-17 were modelled using national data from
NHANES. A model for the prediction of obesity levels covering an individual’s life span was
required for the micro-simulation process.
The underlying assumption which allows the
forecasting of obesity levels in the future is that
the fitted model can provide valid estimates
using extrapolation. This involves the assumption that the effect of any factor that may affect
obesity levels will remain constant over time. Examples of such factors include the demographic
characteristics by gender and age group of the
studied population, governmental policies, and
secular lifestyle changes. Any attempt of extrapolation from a fitted model may involve assumptions which may be hard to verify and which may
influence the validity of the attempted projections. Therefore, the forecasted levels of obesity
should be treated with caution. Nevertheless,
having faith in that our methodology is valid,
and observing that the current levels of obesity
show a clear increasing trend, we believe that
our reported forecasts may prove very useful in
future healthcare policy decisions.
For the micro-simulation study, a virtual population was generated with demographic characteristics matching those of the observed data.
Health trajectories were simulated over time
allowing virtual individuals to contract, survive
or die from a set of obesity related diseases and
types of cancer (coronary heart disease, stroke,
breast cancer, kidney cancer, colorectal cancer,
oesophageal cancer, endometrial cancer, gall
bladder cancer, diabetes, arthritis, hypertension,
liver cancer, and pancreatic cancer). In this stochastic process, the risk of dying or contracting
a medical condition was adjusted for obesity
levels as forecasted by models (1), (2), and (3).
Simulating BMI growth at an individual’s level,
involved the assumption that people’s BMI
changes throughout their lives in such a way
that they always stay on the same BMI percentile.
This rule may not be too far from the truth and
it means that fat people stay fat and thin people
stay thin. Moreover, the micro-simulation process was carried out so that when virtual individuals progressed through different age groups, the
simulation utilised the forecasted obesity levels
of the new age group. The micro-simulation was
performed under three distinct scenarios:
Scenario 0: Individuals’ trajectories were simulated
over the period between 2010 and 2030, using BMI
growth as predicted by models (1), (2), and (3).
Scenario 1: Individuals’ trajectories were simulated over the period between 2010 and 2030,
assuming a 1% population BMI reduction relative to Scenario 0.
Scenario 2: Individuals’ trajectories were simulated over the period between 2010 and 2030,
Figure 1: Self-reporting bias for height (m). Solid
lines correspond to mean height levels reported in
NHANES. Dashed lines connect mean levels reported in BRFSS. Height is over-reported in BRFSS
by both men and women.
assuming a 5% population BMI reduction relative to Scenario 0.
The disease prevalence and health care costs
have been modelled for 13 diseases across all 51
states. The costs have been predicted up to 2030
and have been simulated for three scenarios.
Throughout this report, all figures for cost are
presented as millions of US Dollars.
Figure 2: Self-reporting bias in weight (Kg). Solid
lines correspond to mean weight levels reported
in NHANES. Dashed lines connect mean levels
reported in BRFSS. Weight is under-reported in
BRFSS by women.
113
Endnotes
114
1 For individuals, obesity is defined as a body mass
index rate above 30. On an individual level, an adult
reducing BMI by one percent is the equivalent to a
weight loss of 2.2 pounds (for an adult of average
weight). According to CDC, the average weight of
men is 194.7 and women is 164.7. http://www.cdc.
gov/nchs/fastats/bodymeas.htm
2 Babey, SH, et al. A Patchwork of Progress: Changes in
Overweight and Obesity Among California 5th, 7th, and
9th graders, 2005-2010. California Center for Public
Health Advocacy and the UCLA Center for Health
Policy Research. 2011. http://www.publichealthadvocacy.org/research/patchworkdocs/OFT%20
brief_final.pdf (accessed April 2012).
3 “Obesity in K-8 Students — New York City, 2006-07 to
2010-11 School Years.” MMWR Weekly. 2011: 60(49);
1673-1678. http://www.cdc.gov/mmwr/preview/
mmwrhtml/mm6049a1.htm?s_cid=mm6049a1_e (accessed April 2012).
4 Center for Mississippi Health Policy. “Assessing the
Impact of the Mississippi Healthy Students Act on Childhood Obesity: Year Three Report.” http://www.mshealthpolicy.com/year-3-report.htm (accessed July 30, 2012).
5 The New York Academy of Medicine. A Compendium
of Proven Community-Based Prevention Programs. http://
www.nyam.org/news/docs/Compendium-of-ProvenCommunity-Based-Prevention-Programs.pdf (accessed August 2012).
6 Baicker K, Cutler D and Song Z. Workplace Wellness
Programs Can Generate Savings. Health Affairs, 29,
no.2 (2010):304-311.
7 Ogden CL, Carroll MD, Kit BK, Flegal KM.В Prevalence of Obesity in the United States, 2009-2010.В NCHS data brief, no 82.В Hyattsville, MD: National
Center for Health Statistics, 2012.
8 “Obesity and Cancer Risk.” National Cancer Institute. http://www.cancer.gov/cancertopics/factsheet/Risk/obesity (accessed June 12, 2012).
9 “Body Measurements.” U.S. Centers for Disease
Control and Prevention. http://www.cdc.gov/nchs/
fastats/bodymeas.htm (accessed August 2012).
10 O
gden CL, Carroll MD, Kit BK, Flegal KM. Prevalence of Obesity and Trends in Body Mass Index
Among US Children and Adolescents, 1999-2010.
Journal of the American Medical Association. 2012;307(5).
11 Ibid.
12 Franks PR, Hanson W, Knowler M, et al. “Childhood
Obesity, Other Cardiovascular Risk Factors, and
Premature Death.” New England Journal of Medicine,
362(6):485-93, 2010.
13 Freedman et al. “Cardiovascular Risk Factors and
Excess Adiposity among Overweight Children and
Adolescents: The Bogalusa Heart Study.”
14 Gilliland F, Berhane K, Islam T, et al. “Obesity and
the Risk of Newly Diagnosed Asthma in School-Age
Children.” American Journal of Epidemiology, 158(5):
406-15, 2003.
15 Redline S, Tishler P, Schluchter M, et al. “Risk Factors for Sleep-Disordered Breathing in Children:
Associations with Obesity, Race and Respiratory
Problems.” American Journal of Respiratory and Critical
Care Medicine, 159(5): 1527–32, 1999.
16 Whitaker RC, Wright JA, Pepe MS, et al. “Predicting
Obesity in Young Adulthood from Childhood and
Parental Obesity.” New England Journal of Medicine,
337(13): 869–73, 1997.
17 Ibid.
18 P
uhl R and Latner J. “Stigma, Obesity, and the Health
of the Nation’s Children.” Psychological Bulletin,
133(4): 557-80, 2007.
19 Ibid.
20 Ibid.
21 W
ang YC, Orleans CT and Gortmaker SL. Reaching
the Healthy People Goals for Reducing Childhood
Obesity: Closing the Energy Gap. Am J Prev Med,
doi: 10.1016/j.amepre.2012.01.018, 2012.
22 W
ang YC et al. Health and Economic Burden of the
Projected Obesity Trends in the USA and the UK.
The Lancet, 378, 2011.
23 F
legal KM, Carroll MD, Ogden CL, et al. Prevalence
and Trends in Obesity among U.S. Adults, 19992008. Journal of the American Medical Association,
303(3): 235-41, 2010.
24 N
ational Center for Health Statistics. “Prevalence
of Overweight, Obesity and Extreme Obesity among
Adults.”
25 O
gden CL, Carroll MD, Kit BK, Flegal KM. Prevalence of Obesity in the United States, 2009-2010. NCHS
data brief, no 82. Hyattsville, MD: National Center
for Health Statistics, 2012.
26 O
gden CL, Carroll MD, Curtin LR, Lamb MM and
Flegel KM. Prevalence of High Body Mass Index in
US Children and Adolescents, 2007-2008. Journal of
the American Medical Association. 303(3): 242-249, 2010.
27 Ibid.
28 Ibid.
29 Ibid.
30 D
escription of BRFSS and changes in methodology
provided by CDC.
31 Merrill RM and Richardson JS. Validity of Self-reported
Height, Weight, and Body Mass Index: Findings from
the National Health and Nutrition Examination Survey, 2001-2006. Preventing Chronic Disease, 6(4):2009.
http://www.cdc.gov/pcd/issues/2009/oct/08_0229.
htm (accessed March 12, 2010).
32 Stunkard, A. J. and T. A. Wadden, eds. Obesity:
Theory and Therapy. Second ed. New York, NY:
Raven Press, 1993.
33 N
ational Research Council. Diet and Health: Implications for Reducing Chronic Disease Risk. Washington,
D.C.: National Academy Press, 1989.
34 Ibid.
35 B
arlow, S.E. “Expert Committee Recommendations
Regarding the Prevention, Assessment, and Treatment of Child and Adolescent Overweight and Obesity: Summary Report.” Pediatrics 120, suppl 4 (2007):
S164-S192.
36 Parker-Pope, T. “Watch Your Girth.” The New York
Times, May 13, 2008.
37 Organization for Economic Cooperation and Development Health Data 2011. Obesity Updated 2012.
http://www.oecd.org/dataoecd/1/61/49716427.
pdf (accessed February 29, 2012).
38 Ibid.
39 Ibid.
40 Ibid.
41 Ibid.
42 T
rust for America’s Health and Robert Wood Johnson
Foundation. F as in Fat: How Obesity Threatens America’s
Future — 2011. http://www.tfah.org/report/88/ (accessed July 2012). Based on data using the previous
BRFSS methodology in use from 2008-2010.
43 N
ational Survey of Children’s Health, 2007. Overweight and Physical Activity Among Children: A Portrait
of States and the Nation 2009, Health Resources and
Services Administration, Maternal and Child Health
Bureau. http://www.cdc.gov/nchs/slaits/nsch.htm
(accessed May 24, 2011).
44 U
.S. Centers for Disease Control and Prevention.
Youth Risk Behavior Surveillance -- United States,
2011. Morbidity and Mortality Weekly Report, MMWR
61(SS 4): 1-162, 2012
45 Ibid.
46 U.S. Centers for Disease Control and Prevention.
“Trends in the Prevalence of Obesity, Dietary Behaviors,
and Weight Control Practices National YRBS: 19912011.” http://www.cdc.gov/healthyyouth/yrbs/pdf/
us_obesity_trend_yrbs.pdf (accessed August 2012).
47 Ogden CL, Carroll MD, Kit BK. and Flegal KM. Prevalence of obesity and trends in body mass index among
U.S. children and adolescents, 1999-2010. Journal of the
American Medical Association, 307(5): 483-490, 2012.
48 Barker LE, Kirtland KA, Gregg EW, et al. Geographic
Distribution of Diagnosed Diabetes in the U.S.: A Diabetes Belt. Am J Prev Med, 40(4):434-439, 2011.
49 Ibid.
50 O
gden, CL et al. Prevalence of Obesity in the
United States. 2009-2010. In U.S. Centers for Disease
Control and Prevention. http://www.cdc.gov/nchs/
data/databriefs/db82.htm (accessed July 2012).
51 “ Obesity and Cancer Risk.” National Cancer Institute.
http://www.cancer.gov/cancertopics/factsheet/Risk/
obesity (accessed June 12, 2012).
52 W
ang YC et al. Health and Economic Burden of the
Projected Obesity Trends in the USA and the UK.
The Lancet, 378, 2011.
53 Ibid.
54 Note: Hypertension and arthritis were not included
in The Lancet study, but were included in the stateby-state analysis. The methodology for determining
potential new cases of hypertension and arthritis were
calculated using the same process as used for diabetes, chronic heart disease and stroke and cancer.
55 E
zzati, M. Trends in national and state-level obesity
in the USA after correction for self-report bias: analysis of health surveys. J R Soc Med.В 2006 May;В 99(5):
250–257. http://www.ncbi.nlm.nih.gov/pmc/articles/PMC1457748/ (accessed July 2012).
56 F
inkelstein EA, Khavjou OA, Thompson H, et al.
Obesity and Severe Obesity Forecasts Through 2030.
Am J Prev Med, 42(6): 563-570, 2012.
57 Ibid.
58 Ibid.
59 W
ang YC et al. Health and Economic Burden of the
Projected Obesity Trends in the USA and the UK.
The Lancet, 378, 2011.
60 Ibid.
61 C
awley J and Meyerhoefer C. “The Medical Care
Costs of Obesity: An Instrumental Variables Approach.” Journal of Health Economics, 31(1): 219-230,
2012; And Finkelstein, Trogdon, Cohen, et al. “Annual Medical Spending Attributable to Obesity”.
62 F
inkelstein, Trogdon, Cohen, et al. “Annual Medical Spending Attributable to Obesity”.
63 Ibid.
64 Ibid.
65 T
rasande L. and Chatterjee S. “The Impact of Obesity on Health Service Utilization and Costs in Childhood.” Obesity, 17(9):1749–54, 2009.
66 Marder W and Chang S. Childhood Obesity: Costs,
Treatment Patterns, Disparities in Care, and Prevalent
Medical Conditions. Thomson Medstat Research
Brief, 2006. http://www.medstat.com/pdfs/childhood_obesity.pdf (accessed March 22, 2010.)
67 Trasande L, Liu Y, Fryer G, et al. “Effects of Childhood Obesity On Hospital Care and Costs, 1999–
2005.” Health Affairs, 28(4): w751–60, 2009.
68 Chenoweth & Associates. The Economic Costs of Overweight, Obesity, and Physical Inactivity among California
Adults -- 2006. Oakland, CA: The California Center
for Public Health Advocacy, 2009.
69 Cawley J, Rizzo JA, and Haas K. “Occupation-specific Absenteeism Costs Associated with Obesity and
Morbid Obesity.” Journal of Occupational and Environmental Medicine, 49(12):1317–24, 2007.
70 Gates D, Succop P, Brehm B, et al. “Obesity and
Presenteeism: The Impact of Body Mass Index on
Workplace Productivity.” Journal of Occupational and
Environmental Medicine, 50(1):39-45, 2008.
71 The Robert Wood Johnson Foundation, the American Stroke Association, and the American Heart Association. A Nation at Risk: Obesity in the United States,
A Statistical Sourcebook. Dallas, TX: American Heart
Association, 2005. http://www.americanheart.org/
downloadable/heart/1114880987205NationAtRisk.
pdf (accessed April 14, 2008).
72 Ostbye T, Dement JM, and Krause KM. “Obesity
and Workers’ Compensation: Results from the Duke
Health and Safety Surveillance System.” Archives of
Internal Medicine, 167(8): 766-73, 2007.
73 Pronk NP, Martinson B, Kessler RC, et al. “The Association between Work Performance and Physical
Activity, Cardiorespiratory Fitness, and Obesity.”
Journal of Occupational and Environmental Medicine,
46(1):19-25, 2004.
74 Aldana SG and Pronk NP. “Health Promotion Programs, Modifiable Health Risks, and Employee Absenteeism.” Journal of Occupational and Environmental,
43(1): 36-46, 2001.
75 Gordian Health Solutions. Managing the Obesity Problem: A Case Study with Measurable Results. Nashville,
TN: Gordian Health Solutions, 2007.
76 Wang F, McDonald T, Champagne LJ, et al. “Relationship of Body Mass Index and Physical Activity to Health
Care Costs among Employees.” Journal of Occupational
and Environmental Medicine, 46(5): 428-36, 2004.
77 Burton WN, Chen CY, Schultz AB, et al. “The Economic Costs Associated with Body Mass Index in a
Workplace.” Journal of Occupational and Environmental Medicine, 40(9): 786-92, 1998.
78 Ibid.
79 Berger E. “Emergency Departments Shoulder Challenges of Providing Care, Preserving Dignity for the
�Super Obese.’” Annals of Emergency Medicine, 50(4):
443-45, 2007.
80 Zezima K. “Increasing Obesity Requires New Ambulance Equipment.” The New York Times, April 8, 2008.
81 Ibid.
82 U.S. Centers for Disease Control and Prevention.
National diabetes fact sheet: national estimates and
general information on diabetes and prediabetes in the
United States, 2011. Atlanta, GA: U.S. Department
of Health and Human Services, Centers for Disease
Control and Prevention, 2011.
83 Ibid.
84 Ibid.
115
116
85 U
.S. Centers for Disease Control and Prevention.
Number of Americans with Diabetes Projected to
Double or Triple by 2050. Press Release, October
2010. http://www.cdc.gov/media/pressrel/2010/
r101022.html (accessed March 11, 2011).
86 U.S. Centers for Disease Control and Prevention.
Annual Number (in Thousands) of New Cases of Diagnosed Diabetes Among Adults Aged 18–79 Years,
United States, 1980–2010. http://www.cdc.gov/diabetes/statistics/incidence/fig1.htm.
87 U.S. Centers for Disease Control and Prevention.
National diabetes fact sheet: national estimates and
general information on diabetes and prediabetes in
the United States, 2011. Atlanta, GA: U.S. Department of Health and Human Services, Centers for
Disease Control and Prevention, 2011.
88 American Diabetes Association. “Total Prevalence
of Diabetes & Pre-Diabetes.” American Diabetes Association. http://diabetes.org/diabetes-statistics/
prevalence.jsp (accessed April 18, 2008).
89 Ibid.
90 National Institutes of Diabetes and Digestive and
Kidney Diseases. “Do You Know the Health Risks of
being Overweight?” U.S. Department of Health and
Human Services. http://win.niddk.nih.gov/publications/health_risks.htm (accessed April 18, 2007).
91 Type 2 diabetes. In Medline Plus, National Institutes
of Health. http://www.nlm.nih.gov/medlineplus/
ency/article/000313.htm (accessed May 2012).
92 I nsulin Resistance and Prediabetes. In National Diabetes
Information Clearinghouse, National Institute of Diabetes and
Digestive and Kidney Diseases. http://diabetes.niddk.nih.
gov/dm/pubs/insulinresistance/ (accessed May 2012).
93 The Diabetes Prevention Program Research Group.
“The Diabetes Prevention Program.” Diabetes Care,
25(12): 2165-71, 2002.
94 Weintrub WS et al. AHA Policy Statement: Value of
Primordial and Primary Prevention for Cardiovascular Disease. Circulation, 124: 967-990, 2011.
95 Diabetes Diet — type 2. In Medline Plus, National
Institutes of Health. http://www.nlm.nih.gov/medlineplus/ency/article/007429.htm (accessed May 2012).
96 Do You Know the Health Risks of Being Overweight?
97 Insulin Resistance and Prediabetes. In National
Diabetes Information Clearinghouse, National Institute
of Diabetes and Digestive and Kidney Diseases, National
Institutes of Health. http://diabetes.niddk.nih.gov/
dm/pubs/insulinresistance/ (accessed May 2012).
98 TODAY Study Group. A Clinical Trial to Maintain
Glycemic Control in Youth with Type 2 Diabetes.
NEJM, 10.1056/NEJMoa1109333, 2012.
99 Ibid.
100 Ludwig J, Sanbonmatsu L, Gennetian L, et al.
Neighborhoods, Obesity, and Diabetes—A Randomized Social Experiment. The New England Journal of Medicine, 365(16): 1509-1519, 2011.
101 Ibid.
102 Do You Know the Health Risks of Being Overweight? In National Institute of Diabetes and Digestive
and Kidney Diseases, National Institutes of Health.
http://win.niddk.nih.gov/publications/health_
risks.htm (accessed May 2012).
103 Weintrub WS et al. AHA Policy Statement: Value
of Primordial and Primary Prevention for Cardiovascular Disease. Circulation, 124: 967-990, 2011.
104 Do You Know the Health Risks of Being Overweight? In National Institute of Diabetes and Digestive
and Kidney Diseases, National Institutes of Health.
http://win.niddk.nih.gov/publications/health_
risks.htm (accessed May 2012).
105 H
eart Disease and Diet. In Medline Plus, National Institutes of Health. http://www.nlm.nih.gov/medlineplus/
ency/article/002436.htm (accessed May 2012).
106 “ High Blood Pressure,” In Mayo Clinic. http://www.
mayoclinic.com/health/high-blood-pressure/HI00062
107 U
.S. Centers for Disease Control and Prevention.
Vital signs: prevalence, treatment, and control of
hypertension—United States, 1999-2002 and 20052008. MMWR. 2011;60(4):103-8.
108 K
urukulasuriya LR, Stas S, Lastra G, et al. Hypertension in obesity. Medical Clinics of North America,
95(5): 903-17, 2011.
109 Y
our Guide to Lowering Blood Pressure. Bethesda,
MD: National Heart, Lung, and Blood Institute,
National Institutes of Health, 2003.
110 E
xpert Answers: Can weight loss reduce the need
for blood pressure medication? In Mayo Clinic
http://www.mayoclinic.com/health/blood-pressure-medication/AN01496 (accessed May 2012).
111 Felson DT and Zhang Y. “An Update on the Epidemiology of Knee and Hip Osteoarthritis with a View to Prevention.” Arthritis and Rheumatism, 41(8):1343–55, 1998.
112 U
.S. Centers for Disease Control and Prevention.
“NHIS Arthritis Surveillance.” U.S. Department
of Health and Human Services. http://www.cdc.
gov/arthritis/data_statistics/national_data_nhis.
htm#excess (accessed June 26, 2008).
113 Centers for Disease Control and Prevention. Prevalence of Obesity Among Adults with Arthritis—United
States, 2003-2009. MMWR, 60(16): 509-513, 2011.
114 D
o You Know the Health Risks of Being Overweight?
115 Arthritis Awareness and Action. In U.S. Centers for
Disease Control and Prevention. http://www.cdc.gov/
Features/ArthritisAwareness/ (accessed May 2012).
116 Centers for Disease control and Prevention. StateSpecific Prevalence of No Leisure Time Physical
Activity Among Adults With and Without Doctor-Diagnosed Arthritis. MMWR, 60(48): 1641-1645, 2011.
117 Do You Know the Health Risks of Being Overweight?
118 Arthritis Awareness and Action. In U.S. Centers for
Disease Control and Prevention. http://www.cdc.gov/
Features/ArthritisAwareness/ (accessed May 2012).
119 Warner J. “Small Weight Loss Takes Big Pressure off
Knee.” WebMD Health News.  http://www.webmd.
com/osteoarthritis/news/20050629/small-weightloss-takes-pressure-off-knee (accessed June 26, 2008).
120 A
merican Cancer Society. Cancer Facts and Figures, 2012.
Atlanta, GA: American Cancer Society; 2012.” And also
please change endnote 121 to the following: “Centers
for Disease Control and Prevention, (2012). Report to
the nation finds continuing declines in cancer death
rates since the early 1990s: Special feature highlights
cancers associated with excess weight and lack of sufficient physical activity. [Press Release]. http://www.cdc.
gov/media/releases/2012/p0328_Cancer_deathrates.
html (accessed September 12, 2012).
121 http://www.cdc.gov/media/releases/2012/p0328_
Cancer_deathrates.html
122 U.S. Centers for Disease Control and Prevention.
“Obesity in the News: Helping Clear the Confusion.” Power Point Presentation, May 25, 2005.
123 Kochanek KD, Xu J, Murphy SL, et al. Deaths:
Preliminary Data for 2009. National Vital Statistics
Reports, 59(4), 2011.
124 Obesity and Cancer Risk. In National Cancer Institute.
http://www.cancer.gov/cancertopics/factsheet/
Risk/obesity (accessed June 6, 2012).
125 I nternational Agency for Research on Cancer. Weight
Control and Physical Activity Volume 6. IARCPress, 2002.
126 Physical Activity and Cancer. In National Cancer Institute. http://www.cancer.gov/cancertopics/factsheet/
prevention/physicalactivity (accessed June 6, 2012).
127 F
riedenreich CM et al. “Inflammatory marker
changes in a yearlong randomized exercise intervention trial among postmenopausal women.”
Cancer Prev Res (Phila). 2012 Jan;5(1):98-108. Epub
2011 Oct 7. http://www.aicr.org/press/pressreleases/getting-up-from-your-desk.html
128 Owen N, Sugiyama T, Eakin EE, et al. Adults’ Sedentary Behavior: Determinants and Interventions. American Journal of Preventive Medicine, 41(2): 189-196, 2011.
129 Physical Activity and Cancer. In National Cancer Institute. http://www.cancer.gov/cancertopics/factsheet/
prevention/physicalactivity (accessed June 6, 2012).
130 A
merican Cancer Society Guidelines for Nutrition
and Physical Activity to Prevent Cancer. http://
www.cancer.org/acs/groups/cid/documents/
webcontent/002577-pdf.pdf (accessed June 2012).
131 C
ampbell KL, Foster-Schubert KE, Alfano CM, et
al. Reduced-Calorie Dietary Weight Loss, Exercise,
and Sex Hormones in Postmenopausal Women:
Randomized Controlled Trial. Journal of Clinical
Oncology, doi: 10.1200/JCO.2011.37.9792, 2012.
132 Ibid.
133 Key T, Appleby P, Barnes I, et al. Endogenous
Hormones and Breast Cancer Collaborative Group:
Endogenous sex hormones and breast cancer in
postmenopausal women: Reanalysis of nine prospective studies. J Natl Cancer Inst, 94: 606-616, 2002.
134 C
ampbell KL, Foster-Schubert KE, Alfano CM, et
al. Reduced-Calorie Dietary Weight Loss, Exercise,
and Sex Hormones in Postmenopausal Women:
Randomized Control Study. Journal of Clinical Oncology, doi: 10.1200/JCO.2011.37.9792, 2012.
135 T
rust for America’s Health. Healthy Women: The
Path to Healthy Babies: The Case for Preconception
Care. Washington, D.C.: TFAH, 2008.
136 U
.S. Centers for Disease Control and Prevention.
“Maternal and Infant Health Research: Pregnancy
Complications.” http://www.cdc.gov/reproductivehealth/maternalinfanthealth/PregComplications.htm#obesity (accessed March 10, 2011).
137 U
.S. Centers for Disease Control and Prevention.
“Recommendations to Improve Preconception
Health and Health Care--United States.” Morbidity
and Mortality Weekly Report, 55(4): RR-6, 2006.
138 Haeri S, Guichard I, Baker AM, et al. “The Effect of
Teenage Maternal Obesity on Perinatal Outcomes.”
Obstetrics & Gynecology, 113(2): 300-4, 2009.
139 C
hu SY, Bachman DJ, Callaghan WM, et al. “Association between Obesity during Pregnancy and Increased Use of Health Care.” New England Journal
of Medicine, 358(14): 1444-53, 2008.
140 Ibid.
141 U
.S. Centers for Disease Control and Prevention.
Does Breastfeeding Reduce the Risk of Pediatric
Overweight? Research to Practice Series (4): 2007.
142 U
.S. Centers for Disease Control and Prevention.
Breastfeeding Report Card -- United States, 2010. Atlanta, GA: CDC, 2010.
143 I p S, Chung M, Raman G, et al. Breastfeeding and
Maternal and Infant Health Outcomes in Developed
Countries. Rockville, MD: Agency for Healthcare
Research and Quality, 2007.
144 Moreno MA. Breastfeeding as Obesity Prevention. Archives of Pediatrics & Adolescent Medicine, 165(8): 2011.
145 Ibid.
146 Ibid.
147 Ibid.
148 Parker-Pope T. “Timing of Baby Food Tied to Obesity
Risk.” The New York Times February 8, 2011. http://
well.blogs.nytimes.com/2011/02/08/timing-of-babyfood-tied-to-obesity-risk/ (accessed April 12, 2012).
149 Ibid.
150 Ibid.
151 Ibid.
152 United States Breastfeeding Committee, (2010).
Preventing Obeisty Begins at Birth through Breastfeeding.” [Press Release]. http://www.usbreastfeeding.org/NewsInfo/NewsRoom/201002Preven
tingObesityBeginsatBirth/tabid/169/Default.aspx
(accessed April 16, 2012).
153 Breastfeeding Among U.S. Children Born 2000—
2008, CDC National Immunization Survey. In U.S.
Centers for Disease Control and Prevention. http://
www.cdc.gov/breastfeeding/data/NIS_data/index.
htm (accessed April 16, 2012).
154 United States Breastfeeding Committee, (2010). Preventing Obeisty Begins at Birth through Breastfeeding.”
[Press Release]. http://www.usbreastfeeding.org/NewsInfo/NewsRoom/201002PreventingObesityBeginsatBi
rth/tabid/169/Default.aspx (accessed April 16, 2012).
155 U.S. Department of Health and Human Services. The
Surgeon General’s Call to Action to Support Breastfeeding.
Washington, DC: U.S. Department of Health and
Human Services, Office of the Surgeon General; 2011.
156 Ibid.
157 Ibid.
158 Beydoun et al. “Obesity and Central Obesity as Risk
Factors for Incident Dementia and Its Subtypes”.
159 Petry et al. “Overweight and Obesity Are Associated
with Psychiatric Disorders”.
160 Ibid.
161 Whitmer RA, Gustafson DR, Barrett-Connor E,
et al. Central obesity and increased risk of dementia more than three decades later. Neurology.
71(14):1057-64, 2008.
162 Yoon DH, Choi SH, Yu JG, et al. The relationship between visceral adiposity and cognitive
performance in older adults. Age and Ageing, doi:
10.1093/ageing/afs018, 2012.
163 Xu WL, Atti AR, Gatz M, et al. Midlife overweight
and obesity increase late-life dementia risk: a
population-based twin study. Neurology, 76(18):
1568-1574, 2011.
164 R
olland, Y et al. “Physical Activity and Alzheimer’s Disease: From Prevention to Therapeutic Perspectives.”
JAMDA. DOI: 10.1016/j.jamda.2008.02.007 and Buchman AS et al. Total daily physical activity and the risk
of AD and cognitive decline in older adults. Neurology. 2012 Apr 24;78(17):1323-9. Epub 2012 Apr 18.
165 Preventing Alzheimer’s: Exercise is Still Best. In Mayo
Clinic Alzheimer’s Blog, 2008.
166 Brunner EJ, Marmot MG, Nanchahal K, et al. Social inequality in coronary risk: central obesity and
the metabolic syndrome. Evidence from the Whitehall II study. Diabetologia, 40(11): 1341-49, 1997.
167 Daubenmier J, Kristeller J, Hecht FM, et al. Mindfulness Intervention for Stress Eating to Reduce
Cortisol and Abdominal Fat among Overweight
and Obese Women: An Exploratory Randomized
Controlled Study. Journal of Obesity, 2011.
168 Ibid.
169 Watson NF, Harden KP, Buchwald D, et al. Sleep
Duration and Body Mass Index in Twins: A GeneEnvironment Interaction. Journal Sleep, doi.
org/10.5665/sleep.1810, 2012.
117
118
170 Ibid.
171 Ibid.
172 Wang et al. “Association between Obesity and Kidney Disease”.
173 Ibid.
174 National Digestive Diseases Information Clearinghouse (NDDIC). “Nonalcoholic Steatohepatitis.”
http://digestive.niddk.nih.gov/ddiseases/pubs/
nash/ (accessed March 12, 2010).
175 Ibid.
176 Crum-Cianflone NF, Roediger M, Eberly LE, et al.
“Obesity among HIV-infected Persons: Impact of
Weight on CD4 Cell Count.” AIDS (epub ahead of
print): 2010.
177 Andreyeva T, Puhl RM, and Brownell KD.
“Changes in Perceived Weight Discrimination
among Americans: 1995-1996 through 2004-2006.”
Obesity, 16(5):1129-34, 2008.
178 Puhl RM, Adnreyeva T, and Brownell KD. “Perceptions of Weight Discrimination: Prevalence and
Comparison to Race and Gender Discrimination
in America.” International Journal of Obesity, 32(6):
992-1000, 2008.
179 Puhl RM and Heuer CA. Obesity Stigma: Important Considerations for Public Health. Am J Public
Health, 100: 1019-1028, 2010.
180 Puhl RM and Heuer CA. “The Stigma of Obesity:
A Review and Update.” Obesity, 17(5): 941-64, 2009.
181 P
uhl RM and Brownell KD. “Confronting and Coping
with Weight Stigma: An Investigation of Overweight
and Obese Adults.” Obesity, 14(10): 1802-15, 2006.
182 R
oehling MV, Roehling PV, and Pichler S. “The
Relationship between Body Weight and Perceived
Weight-Related Employment Discrimination: The
Role of Sex and Race.” Journal of Vocational Behavior,
71(2): 300-18, 2007.
183 P
ingitore R, Dugoni R, Tindale S, et al. “Bias
against Overweight Job Applicants in a Simulated
Employment Interview.” Journal of Applied Psychology,
79(6): 909-17, 1994.
184 Baum CL and Ford WF. “The Wage Effects of
Obesity: A Longitudinal Study.” Health Economics,
13(9):885-99, 2004.
185 Foster GD, Wadden TA, Makris AP, et al. “Primary
Care Physicians’ Attitudes about Obesity and Its
Treatment.” Obesity Research, 11(10): 1168-77, 2003.
186 Brown I. “Nurses’ Attitudes towards Adult Patients
Who Are Obese: Literature Review.” Journal of Advanced Nursing, 53(2): 221-32, 2006.
187 Wear D, Aultman JM, Varley JD, et al. “Making
Fun of Patients: Medical Students’ Perceptions and
Use of Derogatory and Cynical Humor in Clinical
Settings.” Academic Medicine, 81(5): 454-62, 2006.
188 Chambliss HO, Finley CE, and Blair SN. “Attitudes
towards Obese Individuals among Exercise Science
Students.” Medicine and Science in Sports and Exercise,
36(3): 468-74, 2004.
189 Harvey EL, Summerbell CD, Kirk SF, et al. “Dietitians’ Views of Overweight and Obese People
with Reported Management Practices.” Journal of
Human Nutrition and Dietetics, 15(5): 331-47, 2002.
190 Puhl RM, Peterson JL, Luedicke J. Parental
Perceptions of Weight Terminology That Providers Use With Youth. Pediatrics, DOI: 10.1542/
peds.2010-3841, 2011.
191 Neumark-Sztainer D, Story M, and Harris T. “Beliefs
and Attitudes about Obesity among Teachers and
School Health Care Providers Working with Adolescents.” Journal of Nutrition Education, 31(1): 3-9, 1999.
192 O
’Brien KS, Hunter JA, and Banks M. “Implicit
Anti-Fat Bias in Physical Educators: Physical Attributes, Ideology, and Socialisation.” International
Journal of Obesity, 31(2): 308-14, 2007.
193 S
tunkard AJ, Faith MS, and Allison KC. “Depression
and Obesity.” Biological Psychiatry, 54(3): 330-7, 2003.
194 C
arr D and Friedman MA. “Is Obesity Stigmatizing? Body Weight, Perceived Discrimination, and
Psychological Well-Being in the United States.” Journal of Health and Social Behavior, 46(3): 244-59, 2005.
195 A
nnis NM, Cash TF, and Hrabosky JI. “Body
Image and Psychosocial Differences among Stable
Average Weight, Currently Overweight, and Formerly Overweight Women: the Role of Stigmatizing Experiences.” Body Image, 1(2): 155-67, 2004.
196 P
uhl RM, Moss-Racusin CA, and Schwartz MB. “Internalization of Weight Bias: Implications for Binge Eating
and Emotional Well-Being.” Obesity, 15(1): 19-23, 2007.
197 R
osenberger PH, Henderson KE, and Grilo CM.
“Correlates of Body Image Dissatisfaction in Extremely Obese Female Bariatric Surgery Candidates.” Obesity Surgery, 16(10): 1331-6, 2006.
198 M
atthews KA, Salomon K, Kenyon K, et al. “Unfair
Treatment, Discrimination, and Ambulatory Blood
Pressure in Black and White Adolescents.” Health
Psychology, 24(3): 258-65, 2005.
199 K
ung HC, Hoyert DL, Xu JQ, and Murphy SL. Deaths:
final data for 2005. National Vital Statistics Reports 2008.
Atlanta, GA: Centers for Disease Control and Prevention, 2008. http://www.cdc.gov/nchs/data/nvsr/
nvsr56/nvsr56_10.pdf (accessed July 14, 2010).
200 V
eugelers PJ and Fitzgerald AL. Effectiveness of
School Programs in Preventing Childhood Obesity:
A Multilevel Comparison. American Journal of Public
Health, 95(3): 432-35, 2005.
201 N
ew Mexico Legislature, http://www.nmlegis.gov/
Sessions/07%20Regular/final/HB0208.pdf (accessed May 24, 2011).
202 Ibid.
203 W
hy Salad Bars? In Let’s Move Salad Bars to Schools.
http://saladbars2schools.org/why (accessed April
3, 2012).
204 Ibid.
205 H
udson W. “For Schoolchildren, Where’s the
Water?” CNN April 18, 2011. http://www.cnn.
com/2011/HEALTH/04/18/water.school.children/ (accessed April 18, 2011).
206 Ibid.
207 Ibid.
208 H
udson W. “For Schoolchildren, Where’s the
Water?” CNN April 18, 2011. http://www.cnn.
com/2011/HEALTH/04/18/water.school.children/ (accessed April 18, 2011).
209 Ibid.
210 Ibid.
211 P
atel AI, Bogart LM, Elliot MN, et al. Increasing
the Availability and Consumption of Drinking
Water in Middle Schools: A Pilot Study. Preventing
Chronic Disease, 8(3): 1-9, 2011.
212 Ibid.
213 Ibid.
214 Ibid.
215 U
.S. Government Accountability Office. School Meal
Programs: Competitive Foods Are Available in Many
Schools; Actions Taken to Restrict Them Differ by State
and Locality. Washington, D.C.: U.S. Government
Accountability Office, 2004. http://www.gao.gov/
new.items/d04673.pdf (accessed May 21, 2009).
216 Ibid, p. 2.
217 Ibid, p. 12.
218 Kids’ Safe & Healthful Foods Project, (2012). Poll
shows strong voter support for nutrition standards for
food and beverages sold in school vending machines
and a la carte lines: Finds come as USDA prepares to
release proposed standards. [Press Release]. http://
www.rwjf.org/files/research/kshfsurveysnacksandbeveragesapril2012.pdf (accessed May 10, 2012).
221 K
ids’ Safe & Healthful Foods Project and Health
Impact Project. Health Impact Assessment: National
Nutrition Standards for Snack and a la Carte Foods
and Beverages Sold in Schools. Robert Wood Johnson
Foundation and PEW Health Group, 2012.
222 Ibid.
223 J oshi A., Kalb M, Beery M. Going Local: Paths to Success for Farm to School Programs. Los Angeles: Occidental College and Community Food Security Coalition,
2006. http://departments.oxy.edu/uepi/cfj/publications/goinglocal.pdf (accessed March 19, 2009).
224 Ibid.
225 U
pstream Public Health. HB 2800: Oregon Farm to
School and School Garden Policy. May 2011. http://
www.upstreampublichealth.org/F2SHIA (accessed
August 24, 2012).
226 H
awkins B. “’Farm to School’: Moving from pink
slime to purple beets.” Minnpost March 22, 2012.
227 “ Free teen gardening workshop starts May 1.” The
Herald-Tribune March 28, 2012.
228 F
itz Simons J. “Farms on Wheels Brings Agriculture to Schools.” San Diego Reader March 26, 2012.
229 Johnston LD, O’Malley PM, Terry-McElrath YM, &
Colabianchi N. School policies and practices to improve
health and prevent obesity: National secondary school survey
results, school years 2006–07 through 2009 –10. Volume 2.
Bridging the Gap Program, Survey Research Center,
Institute for Social Research, Ann Arbor, MI, 2012.
230 U
.S. Centers for Disease Control and Prevention.
Youth Risk Behavior Surveillance – United States,
2011. Morbidity and Mortality Weekly Report, MMWR
61(SS 4): 1-162, 2012.
231 M
ahar MT, Murphy SK, Rowe DA, et al. Effects of
a classroom-based program on physical activity and
on-task behavior. Medicine and Science in Sport and
Exercise, 38(12): 2086-94, 2006.
232 Ibid.
233 Ibid.
234 K
elder SH, Sringer AS, Barroso CS, et al. Implementation of Texas Senate Bill 19 to increase physical activity in elementary school. Journal of Public
Health Policy, 30: S221-247, 2009.
235 Turner L and Chalouka FJ. Activity Breaks: A Promising
Strategy for Keeping Children Physically Active at School—A
BTG Research Brief. Chicago, IL: Bridging the Gap
Program, Health Policy Center, Institute for Health Research and Policy, University of Illinois at Chicago, 2012.
236 Ibid.
237 A
merican Association of Health Education. Comprehensive School Health Education: A Position Statement
of the American Association of Health Education, 2003.
238 U
.S. Centers for Disease Control and Prevention.
“SHPPS 2006: Health Education.” http://www.cdc.gov/
healthyyouth/shpps/2006/factsheets/pdf/FS_HealthEducation_SHPPS2006.pdf (accessed May 21, 2009).
239 U
.S. Centers for Disease Control and Prevention.
The Association Between School Based Physical Activity,
Including Physical Education, and Academic Performance. Atlanta, GA: U.S. Department of Health and
Human Services; 2010.
240 C
haddock L, Erickson EI, Prakash RS, et al. Basal Ganglia Volume is Associated with Aerobic Fitness in Preadolescent Children. Dev Neurosci, 32(3): 249-56, 2010.
241 Ibid.
242 Rampey B, Dion G, and Donahue P. NAEP 2008
Trends in Academic Progress. Washington, D.C., U.S.
Department of Education, 2008.
243 The Association Between School-Based Physical Activity,
Including Physical Education, and Academic Performance. Atlanta, GA: U.S. Department of Health
and Human Services, 2010.
244 Welk G. Cardiovascular Fitness and Body Mass Index
are Associated with Academic Achievement in Schools.
Dallas, Texas: Cooper Institute, March 2009.
245 American Academy of Pediatrics. “Policy Statement:
Prevention of Pediatric Overweight and Obesity.” Pediatrics 112, no. 2 (2003):424-430 and Murray, R. “Response to �Parents’ Perceptions of Curricular Issues
Affecting Children’s Weight in Elementary Schools.’”
Journal of School Health 77, no. 5 (2007):223.
246 Institute of Medicine, Preventing Childhood Obesity.
247 Berger M, Konty K, Day S, et al. Obesity in K-8 Students—New York City, 2006-07 to 2010-11 School
Years. Morbidity and Mortality Weekly Report, 60(49):
1673-1678, 2011.
248 Ibid.
249 Ibid.
250 Ibid.
251 Ibid.
252 Laughlin L. Who’s minding the Kids? Child care arrangements: Spring 2005/summer 2006. Washington,
D.C.: Current Population Reports, U.S. Census
Bureau, 2010.
253 Gabor V and Mantinan K. State Efforts to Address
Obesity Prevention in Child Care Quality Rating and
Improvement Systems. Washington, D.C.: Altarum
Insistute, 2012.
254 Ibid.
255 Ibid.
256 Ibid.
257 Waters E, de Silva-Sanigorski A, Hall BJ, et al. Interventions for preventing obesity in children. Cochrane
Database of Systematic Reviews, 12, 2011.
258 Ibid.
259 Ibid.
260 Wang YC, Orleans CT and Gortmaker SL. Reaching the Healthy People Goals for Reducing Childhood Obesity: Closing the Energy Gap. Am J Prev
Med, doi: 10.1016/j.amepre.2012.01.018, 2012.
261 Ibid.
262 Ibid.
263 Ibid.
264 Ibid.
265 For more information, see Chriqui et al., Local Wellness Policies: Assessing School District Strategies for Improving Children’s Health. School Years 2006-07 and 2007-08.
Chicago, IL: Bridging the Gap Program, Health
Policy Center, Institute for Health Research and Policy, University of Illinois at Chicago, 2009. Available:
http://www.bridgingthegapresearch.org/.
266 Ibid.
267 Bridging the Gap Program, Institute for Health Research and Policy, University of Illinois at Chicago,
2012. Available at: www.bridgingthegapresearch.org.
268 Jacobson MH and Brownell KD. Small Taxes on
Soft Drinks and Snack Foods to Promote Health.
American Journal of Public Health, 90(6): 854-57, 2000.
119
120
269 Congressional Budget Office. Health Care Budget
Options, Volume 1. Washington, D.C.: U.S. Congress, 2008, p. 206.
270 B
rownell KD, Kersh R, Ludwig DS, et al. Personal Responsibility and Obesity: A Constructive Approach to a
Controversial Issue. Health Affairs, 29(3): 379-87, 2010.
271 Brown PL. “Plan to Tax Soda Gets a Mixed Reception.” NY Times June 2, 2012. http://www.nytimes.
com/2012/06/03/us/richmond-calif-seeks-to-taxsweetened-beverages.html (accessed August 24, 2012).
272 Allen, S. “Proposed El Monte soda tax draws criticism.” Los Angeles Times. July 26, 2012. http://
articles.latimes.com/2012/jul/26/local/la-mesoda-tax-20120726 (August 27, 2012).
273 Brown PL. “Plan to Tax Soda Gets a Mixed Reception.” NY Times June 2, 2012. http://www.nytimes.
com/2012/06/03/us/richmond-calif-seeks-to-taxsweetened-beverages.html (accessed August 24, 2012).
274 Vartanian LR, Schwartz MB, Brownell KD. Effects
of soft drink consumption on nutrition and health:
a systematic review and meta-analysis. Am J Public
Health, 97:667-675, 2007.
275 Schulze MB, Manson JE, Ludwig DS, et al. Sugarsweetened beverages, weight gain, and incidence
of type 2 diabetes in young and middle-aged
women. JAMA, 292: 927-934, 2004.
276 Fung TT, Malik V, Rexrode KM, et al. Sweetened
beverage consumption and risk of coronary heart disease in women. Am J Clin Nutr, 89: 1037-1042, 2009.
277 Schulze MB, Manson JE, Ludwig DS, et al. Sugarsweetened beverages, weight gain, and incidence
of type 2 diabetes in young and middle-aged
women. JAMA, 292: 927-934, 2004.
278 Fung TT, Malik V, Rexrode KM, et al. Sweetened
beverage consumption and risk of coronary heart disease in women. Am J Clin Nutr, 89: 1037-1042, 2009.
279 Mattes RD, Popkin B. Nonnutritive sweetener consumption in humans: effects on appetite and food
intake and their putative mechanisms. AM J Clin
Nutr, 89: 1-14, 2009.
280 The American Medical Association. “AMA Adopts
Policies to Promote Healthier Food Options to
Fight Obesity in America.” News Release June 27,
2007. http://www.ama-assn.org/ama/pub/category/17768.html (accessed May 27, 2008).
281 Rudd Center for Food Policy and Obesity. “Menu
Labeling Laws.” http://yaleruddcenter.org/what_
we_do.aspx?id=124 (accessed March 26, 2009).
282 W
almart, (2012). Walmart Unveils “Great For You’
Icon: Icon to appear on hundreds of food items and
provide simple way to make healthier food choices;
Update on progress made over past year. [Press Release]. http://www.walmartstores.com/pressroom/
news/10818.aspx (accessed April 12, 2012).
283 National Restaurant Association. “House Vote to
Prevent Frivolous Lawsuits against Restaurants,
Food Manufacturers: Just Plain Common Sense.”
Press Release, March 10, 2004.
http://www.restaurant.org/pressroom/print/index.cfm?ID=833
(accessed April 25, 2008).
284 U.S. Centers for Disease Control and Prevention
(CDC). Barriers to Children Walking and Biking to
School--United States, 1999. Morbidity and Mortality
Weekly Report, 51(32):701-4, 2002.
285 National Center for Safe Routes to School and
Safe Routes to School National Partnership. “U.S.
Travel Data Show Decline In Walking And Bicycling To School Has Stabilized.” Press Release,
April 8, 2010. http://www.saferoutespartnership.org/media/file/NHTS-SRTS-Press-Release-04082010.pdf (accessed April 9, 2010).
286 Ibid.
287 Powell KE, Martin L, Chowdhury PP. Places to Walk:
Convenience and Regular Physical Activity. American Journal of Public Health, 93(9):1519-21, 2003.
288 G
iles-Corti B and Donovan RJ. The Relative Influence of Individual, Social, and Physical Environment Determinants of Physical Activity. Social
Science & Medicine, 54(12):1793-1812, 2002.
289 R
obert Wood Johnson Foundation (RWJF). Grant Results: Researchers Review State Policies on Promoting Walking
and Biking - Identify Five with Greatest Potential to Work.
Princeton, NJ: RWJF, 2005, http://www.rwjf.org/reports/grr/046958.htm (accessed April 10, 2008).
290 W
endy L. Johnson-Askew et al., “Decision Making in Eating Behavior: State of the Science and
Recommendations for Future Research,” Annals of
Behavioral Medicine 38, Suppl. (2009).
291 The National Academies, “Food Marketing Aimed
at Kids Influences Poor Nutritional Choices, IOM
Study Finds; Broad Effort Needed to Promote
Healthier Products and Diets,” press release, 6 Dec.
2005, www8.nationalacademies.org/onpinews/newsitem.aspx?RecordID=11514 (viewed 26 Mar. 2007).
292 M
ontgomery K and Chester J. Digital Food Marketing
to Children and Adolescents: Problematic Practices and Policy Interventions. National Policy & Legal Analysis Network to Prevent Childhood Obesity, October 2011.
293 Ibid.
294 P
olacsek M, O’Rourke K, O’Brian L, Blum JW, Donahue S. Examining Compliance With a Statewide Law
Banning Food and Beverage Marketing in Maine
Schools. Public Health Reports, 127: 216-223, 2012.
295 P
olacsek M, O’Rourke K, O’Brian L, Blum JW, Donahue S. Examining Compliance With a Statewide Law
Banning Food and Beverage Marketing in Maine
Schools. Public Health Reports, 127: 216-223, 2012.
296 Ibid.
297 Ibid.
298 Ibid.
299 R
obert Wood Johnson Foundation and PEW
Health Group. “Health Impact Assessment: National Nutrition Standards for Snack and a la Carte
Foods and Beverages.” June 2012. http://www.
rwjf.org/childhoodobesity/product.jsp?id=74532
(accessed August 2012).
300 A
Compendium of Proven Community-Based Prevention
Programs. New York, NY: The New York Academy
of Medicine, 2009.
301 C
ommunity Guide to Preventive Services. U.S. Centers
for Disease Control and Prevention, 2011. http://
www.thecommunityguide.org/index.html (accessed January 17, 2012).
302 YMCA, (2012). YMCA’s Diabetes Prevention Program
Results Show Group Behavior Changes Can Improve
Individual Health and Potentially Save Billions in Future Health Care Costs. [Press Release]. http://www.
ymca.net/news-releases/20120530-diabetes-prevention-results.html (accessed August 24, 2012).
303 Y
MCA Press Release. “26,749 Changes Impact Up
to 46 Million Lives: YMCA of the USA’s Healthier
Communities Initiatives (HCI).”
304 Ibid.
305 Ibid.
306 Ibid.
307 F
requently Asked Questions about Small Business.
In Small Business Administration. http://www.sba.gov/
sites/default/files/sbfaq.pdf (accessed May 2012).
308 Claxton G, Rae M, Panchal M, et al. Employer Health
Benefits 2011 Annual Survey. Menlo Park California, Chicago: Kaiser Family Foundation, Health
Research and Educational Trust and the National
Opinion Research Center, 2011.
309 S
mall Business Administration. “What is SBA’s
definition of a small business concern.” http://
www.sba.gov/content/what-sbas-definition-smallbusiness-concern (accessed August 2012).
310 Trust for America’s Health and Small Business Majority. “Striving for a Healthier America Through Availability and Uptake of Workplace Wellness Programs
in the Small Business Community.” December 2011.
311 C
omprehensive Workplace Health Programs to Address Physical Activity, Nutrition, and Tobacco Use in
the Workplace. In U.S. Centers for Disease Control and
Prevention. http://www.cdc.gov/workplacehealthpromotion/nhwp/index.html (accessed May 2012).
312 Claxton G, Rae M, Panchal M, et al. Employer Health
Benefits 2011 Annual Survey. Menlo Park California, Chicago: Kaiser Family Foundation, Health
Research and Educational Trust and the National
Opinion Research Center, 2011.
313 Ibid.
314 Small Employer Qualified Wellness Program Tax
Credit. In Indiana State Department of Health. http://
www.state.in.us/isdh/25139.htm (accessed April 2012).
315 Baicker K, Cutler D, Song Z. Workplace wellness
programs can generate savings. Health Affairs,
29(2): 304-11. 2010.
316 Greater Washington’s Healthiest Employers. In Washington Business Journal. http://www.bizjournals.com/
washington/event/38641 (accessed April 2012).
317 Beam M, Ehrlich G, Black JD, et al. Evaluation of
the Healthy Schools Program: Part I. Interim Progress. Prev Chronic Dis, 9, 2012.
318 Ibid.
319 Ibid.
320 Success Stories. In Alliance for a Healthier Generation.
https://schools.healthiergeneration.org/resources__
tools/success_stories/ (accessed April 9, 2012).
321 Ibid.
322 Ibid.
323 Ibid.
324 Ibid.
325 National Association of School Nurses (2011). Role
of the school nurse (Position Statement).
326 National Association of School Nurses. (2011).
Overweight and Obesity in Youth in Schools - The
Role of the School Nurse (Position Statement).
Retrieved from http://www.nasn.org/PolicyAdvocacy/PositionPapersandReports/NASNPositionStatemen tsFullView/tabid/462/ArticleId/39/
Overweight-and-Obesity-in-Youth-in-Schools-TheRole-of-the-School-Nurse-Revised-2011
327 Adjusted for inflation.
328 Trust for America’s Health. Investing in America’s
Health: A State-By-State Look at Public Health Funding
and Key Health Facts. March 2012. http://www.
tfah.org/report/94/ (accessed August 2012).
329 Budget Cuts Continue to Affect the Health of Americans: Update November 2011. Washington, D.C.: Association of
State and Territorial Health Officials, November 2011.
330 Research America! Sequestration: Health Research at the Breaking Point. http://www.researchamerica.org/uploads/
RASequestrationReport.pdf (accessed August 2012)
331 National Prevention Council. National Prevention
Council Action Plan: Implementing the National Prevention Strategy. U.S. Department of Health and
Human Services. June 2012.
332 Maciosek, MV, et al. “Greater Use Of Preventive
Services In U.S. Health Care Could Save Lives At
Little Or No Cost.” Health Affairs. 29, NO. 9 (2010):
1656–1660; U.S. Centers for Disease Control and
Prevention, Administration on Aging, Agency for
Healthcare Research and Quality, and Centers for
Medicare and Medicaid Services. Enhancing Use of
Clinical Preventive Services Among Older Adults.
Washington, DC: AARP, 2011; Institute of Medicine.
“Preventive Services for Women.” July 2011.
333 Glickman D, Parker L, Sim LJ, et al. Accelerating Progress in Obesity Prevention: Solving the Weight of the Nation.
Washington, D.C.: The National Academies, 2012.
334 Ibid.
335 Ibid.
336 Bipartisan Policy Center. Lots to Lose: How America’s
Health and Obesity Crisis Threatens our Economic Future.
Washington, D.C.: Bipartisan Policy Center, 2012.
337 U.S. Department of Health and Human Services,
Public Health Service, Centers for Disease Control
and Prevention, National Center for Chronic Disease Prevention and Health Promotion, and Division of Nutrition and Physical Activity. Promoting
Physical Activity: A Guide for Community Action. Vol.
1. Champaign, IL: Human Kinetics, 1999.
338 U.S. Centers for Disease Control and Prevention. “U.S.
Physical Activity Statistics: Summary of Physical Activity, 2008.” http://apps.nccd.cdc.gov/PASurveillance/
StateSumResultV.asp (accessed March 22, 2010).
339 Barnes PM, Ward BW, Freeman G, Schiller JS.
Early release of selected estimates based on data
from the Jan-Sept 2011 National Health Interview
Survey. National Center for Health Statistics,
March 2012.
340 Centers for Disease Control and Prevention. Youth
Risk Behavior Surveillance—United States, 2011.
MMWR, 61(SS-4), 2012.
341 U.S. Centers for Disease Control and Prevention. “U.S.
Physical Activity Statistics: Summary of Physical Activity, 2008.” http://apps.nccd.cdc.gov/PASurveillance/
StateSumResultV.asp (accessed March 22, 2010).
342 U.S. Centers for Disease Control and Prevention.
“U.S. Physical Activity Statistics: All States: Recommended Physical Activity by: Race.” http://apps.
nccd.cdc.gov/PASurveillance/DemoCompareResultV.asp?State=0&Cat=4&Year=2008&Go=GO (accessed March 22, 2010).
343 Lee IM, Djoussé L, Sesso HD, et al. “Physical Activity and Weight Gain Prevention.” Journal of the
American Medical Association, 303(12): 1173-79, 2010.
344 Lee IM, Djoussé L, Sesso HD, et al. “Physical Activity and Weight Gain Prevention.” Journal of the American Medical Association, 303(12): 1173-79, 2010.
345 В Flegal KM, В Carroll MD, Ogden CL, Curtin LR.В Prevalence and Trends in Obesity Among US
Adults, 1999-2008.В JAMA, 303(3):235-241, 2010.В 346 Stessman J, Hammerman-Rozenberg R, Cohen A,
et al. “Physical Activity, Function, and Longevity
among the Very Old.” Archives of Internal Medicine,
169(16):1476-83, 2009.
347 Anderson LH, Martinson BC, Crain AL, et al.
“Health Care Charges Associated with Physical
Inactivity, Overweight, and Obesity.” Preventing
Chronic Disease, 2(4): A09, 2005.
121
348 Lee DC, Sui X, and Blair SN. “Does Physical Activity Ameliorate the Health Hazards of Obesity?” British Journal of Sports Medicine, 43(1): 49-51, 2009.
349 Jeffrey RW and Utter J. “The Changing Environment and Population Obesity in the United
States.” Obesity Research, 11(Suppl): 12S-22S, 2003.
350 Ross R, and Janssen I. “Physical Activity, Fitness,
and Obesity.” Chap. 11, In Physical Activity and
Health, edited by Bouchard C, Blair SN and Haskell
WL. 1st ed. Vol. 1, 173-189. Champaign, IL:
Human Kinetics, 2007.
351 Hedley, Ogden, Johnson, et al. “Prevalence of
Overweight and Obesity among U.S. Children,
Adolescents, and Adults; 1999-2002.”
352 Haskell W L, Blair SN, and Bouchard C. “An
Integrated View of Physical Activity, Fitness and
Health.” Chap. 23, In Physical Activity and Health, edited by Bouchard C, Blair SN and Haskell WL. Vol.
1, 359-374. Champaign, IL: Human Kinetics, 2007.
353 U.S. Centers for Disease Control and Prevention.
“Youth Risk Behavior Surveillance — United
States, 2007.” Morbidity and Mortality Weekly Report, 57(SS-4): 2008.
354 U.S. Centers for Disease Control and Prevention.
“Physical Activity Levels among Children Aged
9-13years — United States, 2002.” Morbidity and
Mortality Weekly Report, 52(33):785, 2003.
355 Troiano R, Berrigan D, Dodd K, et al. “Physical Activity
in the United States Measured by Accelerometer.” Medicine & Science in Sports & Exercise, 40(1): 181-8, 2008.
356 M
cDonald NC. “Active Transportation to School:
Trends among U.S. Schoolchildren, 1969-2001.” American Journal of Preventive Medicine, 32(6): 509-16, 2007.
357 U.S. Centers for Disease Control and Prevention.
The Association between School-based Physical Activity, Including Physical Education, and Academic
Performance. Atlanta, GA: U.S. Department of
Health and Human Services, 2010.
358 Slater SJ, Ewing R, Powell LM, et al. “The Association Between Community Physical Activity Settings
and Youth Physical Activity, Obesity, and Body Mass
Index.” The Journal of Adolescent Health (epub ahead
of print), 2010.
359 Ibid.
360 Bell JF, Wilson JS, and Liu GC. “Neighborhood
Greenness and 2-Year Changes in Body Mass Index
of Children and Youth.” American Journal of Preventive Medicine, 35(6): 547-553, 2008.
361 Powell L, Slater S, and Chaloupka F. “The Relationship between Community Physical Activity Settings
and Race, Ethnicity and Socioeconomic Status.” Evidence-Based Preventive Medicine, 1(2): 135-44, 2004.
362 Bicycling and Walking in the United States. Washington, D.C.: Alliance for Biking & Walking, 2010.
http://www.peoplepoweredmovement.org/site/
index.php/site/benchmarkingdownload/ (accessed April 13, 2010).
363 Walking: A Step in the Right Direction. In National
Institute of Diabetes and Digestive and Kidney Diseases.
http://win.niddk.nih.gov/publications/PDFs/
WIN_Walking.pdf (accessed April 11, 2012).
364 Bassett DR, Wyatt HR, Thompson H, Peters JC and
Hill JO.В Pedometer-Measured Physical Activity and
Health Behaviors in U.S. Adults. Medicine and Science in Sports and Exercise, 42(10): 1819-1825, 2010.
122
365 V
anderbilt T.В The Crisis in American Walking:
How we got off the pedestrian path.В Slate.com April
10, 2012.В http://www.slate.com/articles/life/walking/2012/04/why_don_t_americans_walk_more_
the_crisis_of_pedestrianism_.htmlВ (accessed April
11, 2012).В And Duncan MJ, Al-Nakeeb Y, Woodfield L, Lyons M.В Pedometer determined physical
activity levels in primary school children from central England.В Prev Med, 44(5): 416-420, 2007.
366 B
assett DR, Schneider PL and Huntington GE.В Physical Activity in an Older Amish Community.В Medicine
and Science in Sports and Exercise, 36(1): 79-85, 2004.
367 S
antos A, McGuckin N, Nakamoto HY, et al. Summary of Travel rends: 2009 National Household Travel
Survey. Washington, D.C.: U.S. Department of
Transportation, 2011.
368 V
anderbilt T. The Crisis in American Walking: How
we got off the pedestrian path. Slate.com April 10, 2012.
http://www.slate.com/articles/life/walking/2012/04/
why_don_t_americans_walk_more_the_crisis_of_pedestrianism_.html (accessed April 11, 2012).
369 Ibid.
370 Ibid.
371 Ibid.
372 Ibid.
373 U
.S. Department of Health and Human Services.
2008 Physical Activity Guidelines for Americans.
Washington, D.C.: U.S. Department of Health and
Human Services, 2008.
374 B
arnes PM and Schoenborn CA. Trends in Adults
Receiving a Recommendation for Exercise or
Other Physical Activity From a Physician or Other
Health Professional. NCHS Data Brief, 86, 2012.
375 Ibid.
376 B
arnes PM and Schoenborn CA. Trends in Adults
Receiving a Recommendation for Exercise or
Other Physical Activity From a Physician or Other
Health Professional. NCHS Data Brief, 86, 2012.
377 Ibid.
378 C
onroy DE, Elavsky S, Hyde AL, and Doerksen SE.
The Dynamic Nature of Physical Activity Intentions: A Within-Person Perspective on IntentionBehavior Coupling. Journal of Sport & Exercise
Psychology, 33: 807-827, 2011.
379 C
onroy DE, Elavsky S, Hyde AL, and Doerksen SE.
The Dynamic Nature of Physical Activity Intentions: A Within-Person Perspective on IntentionBehavior Coupling. Journal of Sport & Exercise
Psychology, 33: 807-827, 2011.
380 P
enn State, (2012). Physical activity yields feelings of excitement, enthusiasm. [Press Release].
http://www.eurekalert.org/pub_releases/2012-02/
ps-pay020812.php (accessed April 12, 2012).
381 W
ells HF and Buzby JC. Dietary Assessment of Major
Trends in U.S. Food Consumption, 1970-2005. Economic Information Bulletin No. 33. Washington,
D.C.: Economic Research Service, U.S. Department
of Agriculture, 2008.
382 U.S. Department of Agriculture, Economic Research Service. “Loss-Adjusted Food Availability:
Spreadsheets -- Calories.” http://www.ers.usda.gov/
Data/foodconsumption/spreadsheets/foodloss/
Calories.xls#Totals!a1 (accessed March 5, 2010).
383 E
conomic Research Service. “Loss-Adjusted Food
Availability.”
384 P
iernas C and Popkin BM. “Trends in Snacking
among U.S. Children.” Health Affairs, 29(3): 398404, 2010.
385 N
ational Heart, Lung and Blood Institute.В Larger
Portion Sizes Contributing to U.S. Obesity Problem.В http://www.nhlbi.nih.gov/health/public/heart/
obesity/wecan/news-events/matte1.htmВ (accessed
August 7, 2012).В 386 A
merican Heart Association.В Nutrition and Cardiovascular Diseases: Statistical Fact Sheet 2012 Update.В http://www.heart.org/idc/groups/heart-public/@
wcm/@sop/@smd/documents/downloadable/
ucm_319591.pdfВ (accessed July 10, 2012).В 387 Ibid.
388 H
ellmich N.В Americans need to try harder
to eat fruits, vegetables.В USA Today July 9,
2012. В В В http://www.usatoday.com/news/health/
story/2012-07-10/eating-fruits-and-vegetableshealthy/56118742/1 (accessed August 7, 2012).
389 W
ells and Buzby, Dietary Assessment of Major Trends,
p. 7-8
390 E
conomic Research Service. “Loss-Adjusted Food
Availability.”
391 W
ang YC, Bleich SN, and Gortmaker SL. “Increasing Caloric Contribution from Sugar-Sweetened
Beverages and 100 Percent Fruit Juices among U.S.
Children and Adolescents, 1988-2004.” Pediatrics,
121(6): 1604-14, 2008.
392 Babey SH, Jones M, Yu H and Goldstein H. Bubbling
Over: Soda Consumption and Its link to Obesity in California. UCLA Center for Health Policy Research, 2009.
393 B
leich SN, Wang CY, Wang Y et al. Increasing
consumption of sugar-sweetened beverages among
US adults: 1988–1994 to 1999–2004. Am J Clin Nutr
89,372–381, 2009.
394 Ibid.
395 B
remer AA, Auinger P, and Byrd RS. “Relationship between Insulin Resistance–Associated
Metabolic Parameters and Anthropometric Measurements with Sugar-Sweetened Beverage Intake
and Physical Activity Levels in U.S. Adolescents.
Findings from the 1999-2004 National Health and
Nutrition Examination Survey.” Archives and Pediatric and Adolescent Medicine, 163(4): 328-35, 2009.
396 G
uthrie JF, Lin BH, and Frazao E. “Role of Food
Prepared Away from Home in the American Diet,
1977–78 versus 1994–96: Changes and Consequences.” Journal of Nutrition Education and Behavior, 34(3):140–50, 2002.
397 N
ational Restaurant Association. 2012 Restaurant
Industry Pocket Factbook. http://www.restaurant.
org/pdfs/research/PocketFactbook_2012.pdf (accessed July 10, 2012).
398 Ibid.
399 G
uthrie JF, Lin BH, and Frazao E. “Role of Food
Prepared Away from Home in the American Diet,
1977–78 versus 1994–96: Changes and Consequences.” Journal of Nutrition Education and Behavior, 34(3):140–50, 2002.
400 N
ational Restaurant Association. 2012 Restaurant
Industry Pocket Factbook. http://www.restaurant.
org/pdfs/research/PocketFactbook_2012.pdf (accessed July 10, 2012).
401 Centers for Disease Control and Prevention.В Second
National Report on Biochemical Indicators of Diet and Nutrition in the U.S. Population 2012.В Atlanta, GA: National Center for Environmental Health, April 2012. В 402 Ibid.
403 Ibid.
404 Ibid.
405 Ibid.
406 Ibid.
407 L
ovasi GS, Hutson MA, Guerra M, Neckerman KM.
Built Environments and obesity in disadvantaged
populations. Epidemiol Rev. 31: 7-20, 2009.
408 R
undle A, Neckerman KM, Freeman L, et al.
Neighborhood food environment and walkability
predict obesity in New York City. Environ Health
Perspect, 117(3): 442-447, 2008.
409 M
orland K, Wing S, and Diez Roux A. “The Contextual Effect of the Local Food Environment on
Residents’ Diets: The Atherosclerosis Risk in Communities Study.” American Journal of Public Health,
92(11): 1761-7, 2002.
410 M
oore L and Diez Roux A. “Associations of Neighborhood Characteristics with the Location and
Type of Food Stores.” American Journal of Public
Health, 96(2): 325-31, 2006.
411 U
.S. Department of Health and Human Services and
U.S. Department of Agriculture. Dietary Guidelines for
Americans, 2010. 7th Edition, Washington, D.C.: U.S.
Government Printing Office, December 2010.
412 F
inucan MM, Stevens GA, Cowan MJ, et al. National, regional, and global trends in body-mass
index since 1980: systematic analysis of health
examination surveys and epidemiological studies
with 960 country-years and 9В·1 million participants.
Lancet, 377(9765): 557-567, 2011.
413 O
gden CL, Carroll MD, Kitt BK, Flegal KM. Prevalence of Obesity in the United States, 2009-2010.
NCHS Data Brief, 82: 1-8, 2012.
414 Ibid.
415 K
rauss RM and Eckel RH. The obesity problem. N
ENgl J Med, 338(16): 1156-1158, 1998.
416 H
artz AJ, Rupley DC, Kalkhoff RD, Rimm AA.
Relationship of obesity to diabetes: influence of
obesity level and body fat distribution. Prev Med,
12(2): 351-357, 1983.
417 L
ementowski PW and Zelicof SB. Obesity and osteoarthritis. Am J Orthop, 37(3): 148-151, 2008.
418 Z
illi T, Chagnon M, Van Nguyen T, et al. Influence
of abdominal adiposity, waist circumference, and
body mass index on clinical and pathologic findings
in patients treated with radiotherapy for localized
prostate cancer. Cancer, 116(24): 5650-5658, 2010.
419 Ni Mhurchu, Bennett D, Lin R, et al. Obesity and
health-related quality of life: results from a weight
loss trial. N Z Med J, 117(1207): U1211, 2004.
420 Steppan CM, Bailey ST, Bhat S, et al. The hormone resistin links obesity to diabetes. Nature, 409
(6818): 307-312, 2001.
421 Suk SH, Sacco RL, Boden-Albala B, et al. Abdominal obesity and risk of ischemic stroke: the
Northern Manhattan Stroke Study. Stroke, 34(7):
1586-1592, 2003.
422 Wang YC et al. Health and Economic Burden of
the Projected Obesity Trends in the USA and the
UK. The Lancet, 378, 2011.
423 Sedden R, Penfound J, Garrow JS. The Harrow
Slimming Club: analysis of the results obtained in
249 members of a self-financing, non-profit-making
group. J Hum Nutr, 35(2): 128-133, 1981.
424 Cole TJ, et al. Establishing a standard definition
for child overweight and obesity worldwide: international survey. BMJ. 320, 1240–1243, 2000.
425 Ezzati M, Martin H, Skjold S. Trends in national
and state-level obesity in the USA after correction
for self-report bias: analysis of health surveys. J R
Soc Med, 99(5): 250-257, 2006.
123
1730 M Street, NW, Suite 900
Washington, DC 20036
(t) 202-223-9870
(f) 202-223-9871
© Copyright 2026 Paperzz