CHILDHOODOBESITYINTEXAS
TheCosts,ThePolicies,andaFrameworkfortheFuture
by
Abigail Arons
PreparedfortheChildren’sHospitalAssociation
ofTexas(CHAT)
January,2011
Childhood Obesity in Texas: The Costs, The Policies, and a Framework for the Future
The Children’s Hospital Association of Texas (CHAT) is an organization of regional not for
profit children’s hospitals in Texas. CHAT’s mission is to advance pediatric health care services
for the benefit of children in Texas.
To further its mission, CHAT works to inform and educate the public and state decision makers
about issues in pediatric health care. To recognize the leadership of the late
Senator Lloyd Bentsen in child health, CHAT supports occasional research reports by public
policy students at the LBJ School of Public Affairs on selected pediatric health care issues.
The research and opinions expressed in the reports are those of the authors and are made
available by CHAT to further the discussion and understanding of child health public policy
issues. The reports do not represent an official statement or position of the CHAT Board or
membership.
2
TABLEOFCONTENTS
EXECUTIVE SUMMARY ......................................................................................................................... 4 INTRODUCTION ................................................................................................................................... 8 DEFINING OVERWEIGHT AND OBESITY ............................................................................................................... 9 CHILDHOOD OBESITY IN TEXAS ....................................................................................................................... 10 COSTS OF CHILDHOOD OBESITY ......................................................................................................... 11 HEALTH COSTS ............................................................................................................................................ 11 Obesity’s effect on a child’s body ....................................................................................................... 11 Medical costs of childhood obesity .................................................................................................... 12 COSTS AT SCHOOL AND WORK ....................................................................................................................... 15 Costs at school .................................................................................................................................... 16 Costs at work ...................................................................................................................................... 17 POLICY SOLUTIONS FOR CHILDHOOD OBESITY ................................................................................... 17 TREATMENT ............................................................................................................................................... 17 UPSTREAM INTERVENTIONS .......................................................................................................................... 19 Energy‐In policies................................................................................................................................ 20 Energy‐Out policies ............................................................................................................................. 26 COMPREHENSIVE STRATEGIES ........................................................................................................................ 30 CONCLUSIONS AND RECOMMENDATIONS ......................................................................................... 34 APPENDICES ....................................................................................................................................... 36 APPENDIX A: SELECTED ENACTED TEXAS LEGISLATION RELATING TO CHILDHOOD OBESITY (1993‐2010) .................... 37 APPENDIX B: SELECTED TEXAS RULES AND REGULATIONS RELATING TO CHILDHOOD OBESITY .................................... 39 APPENDIX C: TEXAS PUBLIC SCHOOL NUTRITION POLICY .................................................................................... 40 APPENDIX D: WIC FOOD PACKAGE UPDATES .................................................................................................... 42 APPENDIX E: LIST OF ACRONYMS ................................................................................................................... 43 APPENDIX F: REFERENCES ............................................................................................................................. 44 3
EXECUTIVE SUMMARY
One in three Texan children is overweight or obese, including almost half of Hispanic children in
the state. These children have greater than a two-thirds chance of remaining obese at age 35.
These children will suffer lifelong health and productivity consequences. Already by 2005, obese
adults cost Texas businesses $3.3 billion per year. Today’s obese children are poised to triple
Texas’ current adult obesity rate by 2040, and obesity-related expenses are projected to skyrocket
accordingly.
Fortunately, obesity is a preventable condition. Innovative policies can reach children while they
are still young, reversing their unhealthy weight trends, and preventing weight gain in the first
place. Texas has taken bold first steps toward reducing childhood obesity, yet more work
remains. With the right combination of actions, the state could avert future costs for Texas and
its businesses, and improve the next generation’s quality of life.
Costs of childhood obesity to Texas
Obese children’s bodies suffer impairments that lead to a lifetime of chronic disease, and their
academic performance suffers, leading to a lifetime of lowered productivity. Not only does
obesity diminish children’s quality of life, but its costs pose a lifetime of high expenses to Texas.
п‚·
Costs to children’s health: The health consequences of childhood obesity are so severe that
researchers believe the childhood obesity epidemic will lower life expectancy within a
generation. During childhood, obese and overweight children have increased risk of joint
problems, gallbladder problems, and obstructive sleep apnea. Obese children are especially
prone to metabolic syndrome, a key precursor to chronic disease in adulthood: 29% of obese
adolescents have metabolic syndrome, compared to 0.1% of normal-weight adolescents.
п‚·
Medical costs: Childhood obesity-associated health care is expensive. During childhood,
obese children’s hospitalization expenses are higher, due to longer lengths of stay and other
increased costs. Obese children with asthma have 29% higher hospitalization costs than other
children hospitalized for asthma. When children become obese adults, their medical costs are
42% higher than for normal-weight adults. In 2005, obesity-related medical costs in Texas
exceeded $1.37 billion.
п‚·
Costs at school and work: Childhood obesity is associated with increased absences, lower
grades, and lower TAKS scores. Children, and especially adolescents, who are overweight
and obese suffer from stigma, which can diminish self confidence, resulting in lowered goals
and performance. When obese children grow up, their productivity and wages are lower than
for people who were healthy-weight as children. Continued stigma takes a toll, reducing
obese females’ wages by as much as 15%. Chronic diseases translate to absences and
presenteeism.
4
Policy solutions for childhood obesity in Texas
The most promising policy solutions for childhood obesity address the unhealthy environment in
which children live. The childhood obesity epidemic was brought on by changes in this
environment, beginning in the 1970s. Some changes led children to consume more calories; for
example, shifts in food availability, marketing, and prices all pushed diets to include more edible
oils, animal-derived foods, and sweeteners. Other changes led children to burn off fewer calories;
the proliferation of new technologies such as air conditioning, television, video games and
computers all contributed to an increase in sedentary behaviors, and a decrease in physical
activity. The result of these changes is an energy imbalance of 110 to 165 Calories per day that
children consume, but do not burn off.
The goal of childhood obesity policies is to bring children’s Energy-in (food intake) back in
balance with their Energy-out (calories burned throughout the day). This may be accomplished in
the medical setting by changing behaviors, and treating symptoms, or in the community, by
tackling those aspects of children’s environments that promote unhealthy choices.
п‚·
Medical treatment: Childhood obesity interventions in the health care setting show promise,
though the optimal medical solution remains unclear. Obesity is a medical problem, so the
health care system is a natural choice for solution. Many programs and research projects are
underway at Texas children’s hospitals and elsewhere, searching for the best medical
intervention. However, today medical care for obese children is costly and rarely reimbursed,
thus it is frequently reserved for the most severely obese children, and those children
suffering from co-morbidities.
п‚·
Energy-in policies: Energy-in policies encourage healthy diets for children. Texas policies
already ensure that school meals are healthy, and restrict the availability of unhealthy food
sold on campus. Recent data show that as a result, Texas’ children are eating healthier food at
school than in the past. However, children obtain the majority of their food from non-school
sources, and that food remains unhealthy. Texas’ energy-in policies have only recently begun
to address away-from-school food, and more work remains.
п‚·
Energy-out policies: Energy-out policies encourage children to engage in physical activity
rather than sedentary behaviors. Texas’ energy-out policies focus on physical activity at
school. The average elementary and middle schools exceed 135 minutes of physical activity
per week, and almost all schools test and report children’s physical fitness each year. Still,
Texas’ energy-out policies could be strengthened to further promote physical activity.
п‚·
Comprehensive strategies: The goal of anti-obesity policy is to strike a balance between
energy-in and energy-out, thus the most effective policies are comprehensive, incorporating
both sides of the equation. Texas has taken a strong first step in requiring Coordinated School
Health Programs (CSHPs), which push schools to consider the big picture of child health.
CSHPs include nutrition, physical activity, health care, and parent involvement components,
and when implemented well, they can reduce Body Mass Index (BMI). Through highquality, community-wide CSHP implementation, El Paso has already become the first region
in the nation to show a population-wide reduction in childhood obesity. Texas could
implement new policies to make the most of CSHPs.
5
Recommendations for Texas
Texas can do more to reduce childhood obesity by addressing gaps and strengthening current
policies.
1. Address away-from-school food: Texas can help families obtain healthier foods for
children. Texas could increase access to grocery stores and farmers markets, such as by
creating incentives to build grocery stores in underserved areas. Crucially, Texas could
solve children’s energy imbalance by helping eliminate one 150 Calorie can of soda from
their diets each day. A fee on sugar-sweetened beverages could reduce soda consumption
by as much as 20%, and raise over $1 billion in revenue for the state.
2. Strengthen in-school physical activity: Texas can strengthen the effect of its existing
physical activity policies. Requiring more physical activity in higher grades—an
additional two semesters in middle school, and an additional half credit in high school—
could improve low levels of fitness among older children. New reporting and analysis of
existing Fitnessgram data could motivate schools to improve the quality of children’s
physical activity.
3. Capitalize on the promise of CSHPs: Texas can get more out of CSHPs. Encouraging
community involvement in CSHPs could help ensure that children have a healthy
environment both in and out of school. Extending CSHPs to childcare settings could
teach families and teachers to start healthy habits early. In all grades, Texas could
encourage high-quality CSHP implementation by holding schools accountable and
rewarding top-performing schools.
Table 1 (next page) summarizes the state of anti-childhood obesity policy in Texas today,
showing Texas’ early accomplishments, areas that Texas has begun to address, and new issues
Texas must take on to effectively reduce childhood obesity.
6
Table 1. The state of anti-childhood obesity policy in Texas.
Texas has
already
accomplished
Policy goal
Room for
improvement
Future step
for Texas
Energy-in policies: Reduce the number of unhealthy calories that children consume.
Healthy food at school
Require healthier school menus
Restrict and prohibit competitive foods at
schools (vending machines, snack bars,
etc.)
x
x
Healthy food away from school
Provide healthy food to families on WIC
Increase access to farmers markets
Increase access to grocery stores
Promote healthy beverage choices
x
x
x
x
Energy-out policies: Increase the number of calories that children burn off.
Physical activity at school
Require pre-K and elementary school PE
Require middle school PE
Require high school PE
Support high-quality PE instruction
x
x
x
x
Physical activity away from school
Promote active transport to/from school
Encourage community support for afterschool physical activity
Implement strategies to reduce
sedentary behavior at home
x
x
x
Comprehensive Policies: Address both sides of the energy imbalance at once.
Implement Coordinated School Health
Programs (CSHPs)
Incentivize high-quality CSHP
implementation
Strengthen community involvement to
enhance CSHP effects
Extend CSHP to childcare settings in
early childhood
x
x
x
x
7
INTRODUCTION
Obesity is an epidemic facing Texans, and children are no exception. Childhood obesity poses
high costs to the well-being of young Texans: obesity negatively affects children’s health, and
causes chronic disease as children grow older. Childhood obesity also incurs high economic costs
to individuals, the public, and private businesses in Texas. Further, people who are obese during
childhood have a very high likelihood of remaining obese as adults, so many children suffer the
negative consequences of obesity throughout their lives. In 2009, the Texas State Demographer
wrote that “If we do not arrest the increase of the burden of obesity, we will lower the quality of
life for Texas’ population, decrease the economic competitiveness of the state by increasing the
burden of health care costs on the state’s employers, and increase the burden on the health care
system.”1
But there is good news too. The Institutes of Medicine (IOM) calls childhood obesity “a largely
preventable condition.”2 Though some obesity prevention strategies are costly, prevention is
dramatically cheaper compared with the costs of allowing children to become obese adults.3
Interventions like the CATCH comprehensive health program in schools have shown to be costeffective for reducing obesity rates among children. Fortunately for Texas children, their state is a
national leader on anti-childhood obesity policy.
Texas’ focus on children is a smart obesity intervention strategy. First, interventions that reach
children early can prevent children from ever becoming overweight or obese. Second,
interventions in childhood can reverse the obesity trend by preventing already overweight and
obese children from becoming overweight and obese adults. Intervening during childhood can
have a bigger impact than later action, because it reverses children’s weight trajectory before they
have suffered a lifetime’s worth of health and economic consequences from obesity. The first
section of this report documents the extensive costs of obesity that children incur throughout their
life course. Texas’ goal of reducing childhood obesity will avert these substantial costs. Keeping
children from becoming obese adults gives Texas a healthier and more productive future.
At its root, childhood obesity comes from an imbalance of energy-in and energy-out. That is,
children consume more calories than they expend each day.4 Texas policies address both energyin and energy-out, reducing the unhealthy calories children consume, and increasing the calories
they expend through physical activity. The goal of the policies, according to Texas Comptroller
Susan Combs, is to “ensure tomorrow’s adults develop healthy minds and bodies by eating
nutritious food and engaging in physical activity.”5
Yet Texas’ childhood obesity rates remain high. The second section of this report documents the
steps Texas has already taken, and seeks to explain why these steps have not yet resulted in a
reduction in childhood obesity. The report concludes with several recommendations for
improving Texas’ childhood obesity policies. These recommendations, along with the inevitable
future evolution of policies, could lead to real reductions in Texas’ childhood obesity rate.
8
Defining overweight and obesity
This report uses the official Centers for Disease Control and Prevention (CDC) definitions for the
terms “overweight” and “obese” (See Table 1). The CDC thresholds are based on Body Mass
Index (BMI) distributions from national surveys that were gathered prior to the obesity epidemic.6
Some of the childhood obesity literature uses alternate definitions for “overweight” and “obese,”
as well as alternate terms, such as “at risk for overweight.” In this report, any alternate
terminology from cited research has been adapted to conform to the CDC definitions.
Table 2. CDC Definitions for child weight status, for children ages 2-19
Underweight
At or below 5th BMI percentile for age/sex/height
Normal Weight
6th-84th BMI percentile for age/sex/height
Overweight
85th-94th BMI percentile for age/sex/height
Obese
At or above 95th BMI percentile for age/sex/height
Source: CDC (2010)
9
Childhood obesity in Texas
The rate of childhood obesity increased dramatically after the 1970s, across age, income, racial
and ethnic groups. Between 1971-1974 and 1999-2000, the national obesity rate more than
doubled for children ages 2 to 5 and 12 to 19, and tripled for children ages 6 to 11.7 While
preliminary evidence indicates that the national childhood obesity rate may have stabilized in the
past decade (since 1998), the rate of
childhood obesity remains very high.8
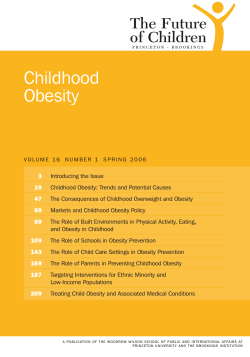
OverweightВ andВ obesityВ prevalenceВ amongВ TexasВ children
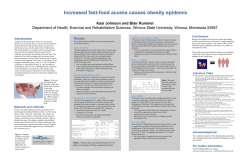
As of 2007, national surveys show
that 32% of Texas children between
the ages of 10 and 17 are overweight
or obese, putting Texas in the worse19%
performing half of states for obesity
18%
prevalence.9 Data from the School
16%
Overweight
Physical Activity and Nutrition
Obese
(SPAN) study, which monitors
23%
childhood obesity in Texas using
10%
18%
17%
more rigorous methodology than
5%
national surveys, present an even
starker picture. The SPAN III study,
TargetВ level 4thВ graders 8thВ graders 11thВ graders
representing a statewide sample of
Source: DSHS Obesity Data Sheet (May 2010), data from SPAN III 2004-2005.
children enrolled in public schools in 2004-05,
42%guidelines.
of Texas 4th graders, 39% of
Targetshowed
level basedthat
on CDC
Texas 8th graders and 36% of Texas 11th graders are overweight or obese.10
In Texas, Hispanic children have the highest rates of overweight and obesity: 47% of Texas
Hispanic children were obese based on 2007 national data, compared to 26% of black nonHispanic children, and 23% of white non-Hispanic children.11 This is echoed in the SPAN
studies. 12 In Texas and nationally, Hispanic boys have the highest rate of obesity among boys,
and black non-Hispanic girls have the highest rate of obesity among girls.13,14 This fact is
particularly troubling given that the share of Texas children who are Hispanic is increasing
rapidly.15
It is important to consider the rate of adult obesity when discussing childhood obesity, for the
simple reason that children will become adults. Today, two-thirds of Texas adults are either
overweight or obese, including almost 30% of adult Texans who are obese. 16,17 The rate of adult
obesity in Texas increased 120% between 1990 and 2005.18 The Office of the State Demographer
projects that by 2040, 15 million adult Texans (or 43% of all adult Texans) will be obese.19
Today’s obese children are tomorrow’s obese adults. One rigorous study shows that obese
children and adolescents have a greater than two-thirds chance of being overweight at age 35.20
While today most obese adults became obese in adulthood, as the proportion of obese children
increases, a greater share of obese adults will have begun their obesity during childhood.21
10
COSTS OF CHILD
DHOOD OBESITY
O
Obesity iss considered
d a disease beecause of its strong negaative impact on health. T
This negativee
impact co
osts children physically. In addition, childhood oobesity posess high econoomic costs too
Texans no
ot only from
m direct mediical expensess, but by dettracting from
m performancce at school and
at work. This
T section explores thee costs of chiildhood obessity on healtth and produuctivity, withh two
importantt consideratio
ons in mind.. First, it is im
mportant to consider botth costs incuurred during
childhood
d and costs in
ncurred overr the life cou
urse. Therefoore, this secttion includess informationn on
obesity-atttributable co
osts for adullts, as well ass for childreen. Second, ppolicymakers need to knnow
who bearss the costs of obesity. Th
hus, where possible,
p
thiss section breaaks down the proportionns of
costs born
ne by the pub
blic sector, the
t private seector, and inndividuals.
Health co
osts
Obesity’s effect on a child’s bodyy
Obesity iss a disease with
w lifelong health conseequences; thhese consequuences are soo severe thatt the
obesity ep
pidemic is ex
xpected to lo
ower life exp
pectancy for children borrn today. Acccording to tthe
IOM, “thiis generation
n of children
n is the first to
t have shortter lives thann their parennts.”22
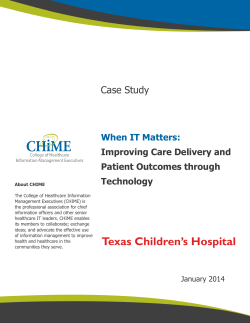
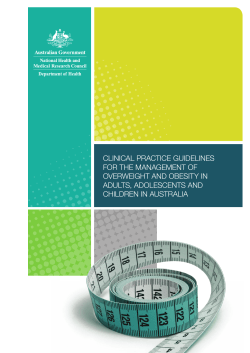
Of particcular concern
n is the high rate of
metabolic syndrome among obesse and
ght children. Metabolic
overweig
syndrome is diagnoseed when a peerson
has at leaast 3 of 5 meetabolic
abnormalities (elevatted blood preessure,
a low hig
gh-density lip
poprotein (H
HDL)
cholesterrol level, a high triglycerride
level, a high
h
fasting glucose
g
leveel, and
abdominal obesity). Studies
S
in ad
dults
show thaat metabolic syndrome offten
PercentВ ofВ childrenВ withВ MetabolicВ Syndrome
Even in ch
hildhood, ob
bese and oveerweight chilldren have inncreased riskk of joint prooblems,
gallbladdeer problems,, and obstrucctive sleep ap
pnea.23 In itss seminal 20005 report, P
Preventing
Childhood
d Obesity: Health
H
in the Balance, the IOM summ
marized whaat researcherrs know abouut the
health con
nsequences of
o childhood
d obesity (em
mphasis addeed):
“Several
“
tho
orough review
ws…have fo
ound childhoood obesity tto be associaated with a w
wide
array
a
of diso
orders that afffect multiple organ systtems. These disorders include
hypertension
h
n, dyslipidem
mia, glucose intolerance//insulin resisstance, hepattic steatosis,,
cholelithiasi
c
s, sleep apneea, menstruaal abnormalitties, impaireed balance, aand orthopeddic
problems.
p
So
ome of thesee conditions produce clinnical symptooms in obesee children, w
while
others
o
do not; however, the metabolic and physsiologic chaanges associiated with
childhood
c
obesity,
o
alon
ng with the obesity
o
itsellf, tend to trrack into ad
dult life and
24
eventually
e
enhance
e
the risks of dissease, disabiility, and deeath.”
Childreen ages 12‐119 with mettabolic syyndrome by weight statu
us
29%
7%
0..1%
Normal‐weight
Ovverweight
Obese
Sourrce: Cook, S. et al.. (2003). “Prevalennce of a Metabolicc Syndrome Phenootype
in Adolescents.”
A
Archiives of Pediatric aand Adolescent Meedicine (157) 821--827.11
progresses to type 2 diabetes and atherosclerosis. Adults with metabolic syndrome have a
dramatically increased risk for morbidity and mortality from cardiovascular disease.25
In Health in the Balance, the IOM states that “Ultimately, it may be the association of childhood
obesity with the metabolic syndrome, rather than exclusively with diabetes, that may comprise the
greatest physical health threat of childhood obesity.”26
Medical costs of childhood obesity
Due to its severe health consequences, obesity has become a major determinant of medical costs
in Texas. Many of these costs are seen in adulthood; increasingly, the medical costs of obesity
also accrue during childhood.
According to the 2007 report Counting Costs and Calories by Texas Comptroller Susan Combs,
the medical costs in Texas attributable to adult obesity exceeded $1.37 billion for 2005. This
accounted for 4.7% of all medical spending in Texas that year.27 In 2006, medical spending was
$1429 greater for each obese person compared with a normal-weight person. Medical costs are
42% higher for each obese person than for persons of normal-weight.28 Multiple studies show that
for adults over 18, inpatient costs, outpatient costs, and prescription drug costs are higher for
obese people than for normal-weight people. 29 Most of these adult medical costs are due to
treating the diseases that result from obesity, rather than from treating obesity itself.30 Over the
next few decades, the medical costs of obesity are expected to increase, when today’s obese
children become obese adults.31
During childhood, the most expensive obesity-related medical costs are due to hospitalization.
Nationwide, obesity-associated* hospital costs for children ages 6 to 17 were 7 times higher in
2005 than in 1979 (adjusting for inflation).32 By 2005, obesity-associated hospital costs for
children were $237.6 million per year. 33 This increase was not only due to rising medical costs,
but also because a greater proportion of children’s hospitalizations are now associated with
obesity. 34 The hospitalization rate for children with a primary diagnosis of obesity increased 24%
per year between 1999 and 2005, while the hospitalization rate for children with a secondary
diagnosis of obesity increased 12% per year. 35
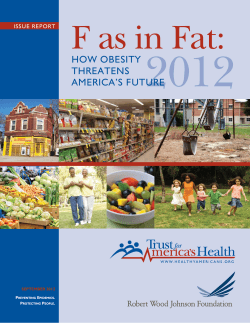
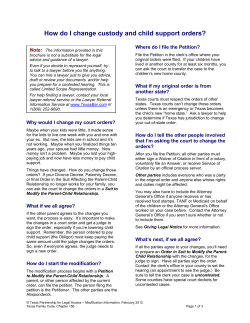
Crucially, the cost of hospitalizing obese children is higher than the cost of hospitalizing a
normal-weight child. Children hospitalized with a secondary diagnosis of obesity have 29%
higher costs for asthma, 26% higher costs for pneumonia, and 28% higher costs for appendicitis,
than children with the same primary diagnoses, but no obesity diagnosis.36 With asthma and
pneumonia the second and third most common causes for childhood hospitalizations, the
increased costs due to obesity are cause for concern.37 Obese children remain hospitalized longer
than normal-weight children: on average children with a secondary diagnosis of obesity stay .85
days longer than normal-weight children with the same primary diagnosis.38
*
In reference to hospitalization costs, “obesity” refers to the medical diagnosis of obesity as an illness, based on the
judgment of providers and payers. The clinical definition of obesity differs from the CDC standard definition.
(Trasande et al., 2009)
12
PrimaryВ Diagnosis
HospiitalizationВ co
ostsВ forВ obesseВ childrenВ ccomparedВ to
oВ non
n‐obese child
drenВ withВ saameВ primaryyВ diagnosis
Appe
endicitis
Pneu
umonia
ChildreenВ withВ second
dary
obesit yВ diagnosis
Asthma
A
ChildreenВ withВ noВ obeesity
diagnoosis
0%
50%
100%
1500%
RelaativeВ costsВ ofВ h
hospitalization
n
Source: Woollford et al. (2007)
The reporrted hospitaliization costss are conserv
vative estimaates, becausee they are baased on claim
ms
data. Whiile the coding
g of obesity as a primary
y or secondaary diagnosiss has increassed in recentt
years (esp
pecially follo
owing the fed
deral govern
nment’s recoognition of oobesity as an illness in 20004),
39
obesity reemains underrcoded as a diagnosis.
d
For instancee, less than 22% of asthm
ma
hospitalizzations of chiildren betweeen 1999 and
d 2005 listedd obesity as a co-morbiddity; one wouuld
expect thee proportion of obese astthma patientts to mirror oor exceed thee proportionn of obese
children in
n the generaal population
n, which wass about 20% between 1999 and 20055.40
Recently, researchers have begun
n to estimate obesity-relaated medical costs incurrred during
childhood
d besides hosspitalization. According to one new study, whenn compared tto normal-weight
children, obese
o
and ov
verweight ch
hildren have higher outppatient visit eexpendituress, higher
prescriptio
on drug expeenditures, an
nd higher em
mergency rooom expendittures. The coost increases
range from
m an averagee of $25 morre to $194 more
m
per yearr, dependingg on age andd expense-typpe.41
In addition, obese children are lik
kely to have more
m
office visits per yeear than otheer children.422
Considereed as a whole, the populaation of obesse children m
may not actuually incur higher medical
costs than
n normal weiight children
n. Because ob
bese and oveerweight chiildren are ovverrepresenteed in
poor and minority
m
gro
oups who aree less likely to access carre, these chiildren are lesss likely to
accumulate outpatientt expenditures, yet moree likely to ac cumulate inppatient expeenditures.43 If
access to care were im
mproved, and
d obese child
dren began tto be treated according too expert
recommen
ndations, thee medical co
ost of obesity
y during chilldhood couldd increase.44
The biggeest cost-driveer for childh
hood obesity is the fact thhat children are young. B
Because theyy
become unhealthy
u
at an
a early age and remain so throughoout their lifettime, obese cchildren incuur
many morre years’ wo
orth of obesitty-related co
osts than obeese adults. O
One study esttimates that tthe
cohort of obese childrren in the U.S. who weree 12 years olld in 2005 w
would incur $$6.24 billionn over
45
their lifetiime, in direcct medical ex
xpenditures alone.
a
Connversely, a reeduction in oobesity amonng
children has
h huge cost-saving pottential, becau
use it saves ccosts over chhildren’s enttire lifetime. The
same stud
dy estimates that a 1 perccentage poin
nt reduction iin obesity am
mong this 122-year-old coohort
would ressult in $260.4
4 million sav
vings over th
heir lifetime,, with $86 m
million of thee savings
achieved during child
dhood, and th
he remainderr achieved dduring adulthhood.46
13
Who pays the medical costs of childhood obesity?
Childhood obesity has a high price-tag, and the medical costs are paid by multiple payers. Both
the public and private sectors pay significant portions of the cost, while individuals bear the
remaining cost. Because children often do not develop obesity-associated chronic disease until
adulthood, obesity frequently goes untreated during childhood. However, the underuse of
outpatient care in childhood could lead to higher medical costs from obesity-attributable disease
during adulthood. In 2004, the diagnosis of obesity increased when the Centers for Medicare and
Medicaid Services (CMS) issued a statement classifying obesity as a disease, although diagnosis
remains low, particularly for privately insured children. 47 One study found that in 2004, about 1%
of privately and Medicaid-insured children were treated for a diagnosis of obesity, with a slightly
lower rate for privately insured children. This rate was far below the 16% of all children who
were obese in 2004.48 Researchers have only recently begun to examine how costs are divvied up
among payers, so the complete breakdown is not yet clear.
Public sector
Medicaid is the primary public payer of obesity costs incurred during childhood. Medicaid
children are treated for obesity at higher rates than privately insured children. Medicaid’s share of
children diagnosed with obesity is 5 to 10% higher than Medicaid’s share of children in the
general population.49
Even with only a small fraction of obese children actually being treated for obesity, total national
Medicaid spending in 2004 for children diagnosed as obese was $470 million, almost double the
$280 million paid by private insurers.50 Childhood obesity-related hospitalizations cost Medicaid
$118.1 million in 2005, a 120% increase since 2001.51 If this rate of increase continued, Medicaid
would have spent $260 million on obesity hospitalizations in 2009. The large increase in
spending appears to be driven by the increasing number of obese children. 52
Short of hospitalization, obesity-related Medicaid costs incurred during childhood remain low.
For children on Texas Health Steps (Texas Medicaid’s Early and Periodic Screening Diagnosis
and Treatment (EPSDT) program), only treatment of obesity’s co-morbidities is covered; Texas
Health Steps does not cover treatment of obesity itself. A study of all states’ EPSDT programs in
2008 found that Texas is one of 10 states unlikely to cover recommended childhood obesity
treatment in its program. The study, which examined states’ EPSDT-specific documents, found
that Texas does “not address reimbursement of nutritional assessment and treatment in [its]
published materials and did not include relevant CPT codes in [its] fee schedules.” The study
concluded that EPSDT could cover all of the expert recommended prevention, assessment, and
treatment for childhood obesity, but very few states actually do. 53 Texas Health Steps only
“requires Body Mass Index (BMI) measurement, nutritional counseling, and anticipatory
guidance for every well-child visit.”54 Medicaid’s costs for obesity during childhood might
increase if the program began to fully cover expert-recommended obesity care under Texas
Health Steps; however, as the baseline costs are unknown, the degree of cost increase is difficult
to estimate.
14
As children age and their medical expenses increase, public insurance pays much more
substantial amounts. Nationally, Medicare and Medicaid pay about half of the cost of obesity in
adults.55 In Texas, in 2003 adult obesity accounted for 11.7% of Medicaid expenditures, or $1.1
billion. That same year, Medicare spent $1.2 billion for adult obesity in Texas. 56
Private sector
Researchers predict that privately insured children are less likely to be diagnosed with obesity
than Medicaid children.57 Thus, the cost of obesity during childhood to private insurers is most
likely low. When obese children are hospitalized, private payers do pay a larger share than
Medicaid if obesity is listed as a primary diagnosis; however, the reverse is true when obesity is
listed as a secondary diagnosis.58 Beyond hospitalization, private insurers typically do not cover
recommended treatment. A survey in 2005 found that just 1 of 11 major health insurers had a
comprehensive weight management program for children, although several more insurers had
similar programs in development as of 2006.59
In adulthood, private insurers pay substantial costs for obese patients. In 2006, researchers
estimate that 12.9% of all private payer medical spending went toward obesity-attributable
causes, accounting for between $49 billion and $74 billion in medical spending that year. 60 In
Texas, adult obesity accounted for $1.4 billion in private insurer medical spending in 2005.61
Insurers might pass on obesity-related costs incurred during childhood to employers, as
employers pay the cost of covering obese children on employee health plans. For one large
national employer in 2008, children accounted for 28% of enrollees and 17% of gross claims cost.
For the same company, average claims for obese children were $2,970, almost twice as much as
for non-obese children ($1,640).62
Individuals
Few analyses measure the proportion of medical costs of childhood obesity that falls to
individuals, but it is conceivable that individual Texans bear at least some of the medical cost. For
example, any increases in insurance rates might be passed on to employees. Given that insurers
might be unlikely to cover recommended treatment, some families might choose to pay out-ofpocket for recommended treatment.
Costs at school and work
Beyond health costs, childhood obesity costs Texans in other ways. At school, obesity increases
absenteeism and lowers academic performance. Parents of obese children lose productivity and
time at work. When obese children grow up and enter the workforce, as obese adults their
productivity and (for females) their wages, will be low compared with normal-weight adults. In
15
short, obese children not only face a less healthy, shorter life than their normal-weight
counterparts, but also a less productive life.
Costs at school
Obesity imposes costs on schools by lowering academic achievement and by increasing
absenteeism. Not only do schools suffer the consequences of diminished performance, but
children themselves achieve lower, thereby reducing their productivity later in life. According to
the National Association of State Boards of Education, “Health and success in school are
interrelated. Schools cannot achieve their primary mission of education if students and staff are
not healthy and fit physically, mentally, and socially.” 63
First, obesity is associated with increased absenteeism. In one study of over 1000 students in
Philadelphia, obese and overweight children spent significantly more time absent from school
than normal-weight children.64 The consequences of increased absenteeism include lowered
academic performance, as well as loss of daily attendance payments for schools.
In addition, obesity is thought to directly lower academic achievement. Several studies show that
obese children score lower on standardized tests than non-obese children.65 One study of nearly
1000 middle schoolers in an urban Texas district found that course grades in Math, Reading,
Science and Social Studies, and Texas Assessment of Knowledge and Skills (TAKS) scores in
Reading, Writing, and Math were lower for obese students.66 A similar study for children in
elementary schools also found that both course grades and TAKS scores were lower for obese
children, and the effect persisted when researchers controlled for race, socioeconomic status, and
conduct.67 The extent to which obesity lowers achievement is unclear. Because of the high
prevalence of obesity in disadvantaged groups, the effect of obesity is difficult to separate from
the effect of other forms of disadvantage. At the same time, obesity takes an emotional toll which
likely diminishes student performance.
Obesity is strongly stigmatized, especially among adolescents.68 Several studies demonstrate that
obesity can cause low self esteem and result in diminished life goals, particularly for adolescent
and pre-pubescent girls. Body weight appears to be a “primary factor” in causing depressive
symptoms in these girls.69 Obese adolescents are more likely to self-report that they are poor
students than non-obese adolescents.70 Some evidence suggests that effects of obesity on
academic performance depend on the school context. If overweight or obesity is the norm at a
school, then heavier students perform as well as their lighter-weight peers.71 This finding singles
out the negative effect of stigma on a child’s academic performance, and supports the hypothesis
that the emotional costs of obesity indeed lower academic achievement.
The emotional toll, in addition to the effects of diminished health and increased absenteeism,
likely lowers academic performance, beyond the effects of disadvantage. In future years,
researchers will work to disentangle the complex interrelationship of low socioeconomic status,
low self-esteem, low academic performance, and obesity.72
16
Costs at work
Children with reduced performance in school become less productive adults. There is strong
evidence that for females, obesity decreases wages. Thus, a girl who is obese faces a lifetime of
lower earning potential, compared to a normal-weight child. The magnitude of the wage decrease
ranges in studies from a 2% to 15% reduction in wages, compared to non-obese females. 73 For
example, if a normal-weight woman earned $30,000, her obese counterpart experiencing a 6%
wage reduction would earn $1,800 less, or $28,200. The evidence that obesity has a similar effect
on wages for males is mixed, and the effect may be insignificant for males.74
Having obese children takes a toll on their parents’ productivity, which costs parents’ employers.
For example, parents of obese children may spend more time away from work taking their
children to receive health care services. The number of annual physician and hospital visits is
higher for obese children: one study showed that privately insured obese children had 4.4 visits
per year, compared to 2.4 visits per year for all privately insured children. For Medicaid-insured
children, the increase was 3.6 visits per year for obese children compared to 1.7 visits for all
Medicaid children.75
POLICY SOLUTIONS FOR CHILDHOOD OBESITY
Texas policymakers recognize the importance of halting the childhood obesity epidemic. The
state’s commitment to ending childhood obesity is reflected in numerous legislative and
regulatory actions in the past decade (see Appendices A and B). Texas leaders share a goal of
lowering childhood obesity rates, through shared public, private, and individual actions.76
Yet, it remains unclear whether Texas’ groundbreaking policies of the past 10 years have had an
effect on the childhood obesity rate. Over the past decade, Texas’ year-to-year childhood obesity
rates might have declined for some groups, but there was no consistent trend for any group.
According to SPAN III data, between 2000-02 and 2004-05, the prevalence of obesity increased
for 8th and 11th graders, but dropped slightly for 4th graders.77 More recent data is not yet
available, so changes in obesity prevalence since 2005 cannot yet be determined.
The following section seeks to answer three questions on many policymakers’ minds: What has
Texas done; where are the gaps in Texas’s efforts; and what more should Texas do to
substantially lower childhood obesity rates?
Treatment
Obesity is a medical condition, thus many intervention proposals involve medical care. Yet, after
decades of research, effective clinical treatment remains elusive. Part of the reason why treatment
is limited is that medical payers have not treated obesity as a disease, thus funding for medical
treatment is scare. The difficulty of funding treatment is keenly felt at smaller practices that are
unable to absorb costs. Accordingly, much of the treatment that does exist occurs in the hospital
17
setting. As a result, medical treatment has been reserved for severely obese children, children
with co-morbidities, and for children whose obesity is the result of medical treatment of a
different disease. Today, many in the medical system see medical treatment as a last resort for
obesity, when other interventions have failed.
Intervention messages have the potential to be very strong in the medical setting, because families
trust their medical providers on health issues. However, the most successful clinical treatments
are often intensive, and possibly impractical for generalization to a large population of children.
Those in the health care system, including hospitals and physician groups in Texas, have begun to
pursue solutions beyond medical care because, in the words of one national researcher, “The
magnitude of obesity in most societies has already surpassed the ability of any healthcare system
to cope with it from the clinical perspective.”78
The medical system remains an important tool for fighting obesity, thus efforts are underway to
implement more effective treatment practices. Both the Texas Pediatric Society and the American
Academy of Pediatrics have spent the past decade developing toolkits for providing obesity care;
these toolkits are used by physicians across the state.79 In 2007, the CDC, along with the
American Medical Association and the U.S. Health Resources and Service Administration, jointly
released expert clinical recommendations for the prevention and treatment of childhood
overweight and obesity. The expert recommendations break childhood obesity treatment into four
stages, depending on the severity of weight status, and the child’s responsiveness to treatment.
Each stage requires increased office visits for physician monitoring, along with progressively
more intensive lifestyle interventions, with the final stage including drastic steps such as
medication or surgery. 80
Although expert recommendations now exist, truly effective treatments for childhood obesity
have not yet been discovered. In the preface to the recommendations, the panel of experts
explains:
“Scientists continue to study obesity but, given its complex causes, years or decades may
pass before the most effective intervention or prevention strategies are identified. The
recommendations presented here are evidence based where evidence is available; where
evidence is not available or is incomplete, the expert committee has combined data with
clinical judgment, including selected interventions when such interventions are
reasonable and are unlikely to cause harm.” 81
In addition, the cost of fully implementing the expert recommendations would be very high. For
every overweight or obese child, the recommendations call for 1 to 6 additional office visits per
year, plus many additional lab tests. The additional laboratory tests would cost $820 million, for
all children under age 10.82
Several current projects in Texas seek to identify new, cost-effective methods of obesity
treatment. Texas Children’s Hospital’s Center for Childhood Obesity provides coordinated care
including nutrition, medical, and mental health treatment, to overweight and obese children. The
Center provides individualized weight management programs, and its researchers use Electronic
Health Record information to investigate new, effective treatments for childhood obesity. Dell
Children’s Medical Center of Central Texas runs a similar treatment and research center, the
Texas Center for the Prevention and Treatment of Childhood Obesity. In Tarrant County, Cook
18
Children’s Hospital subsidizes obese children to participate in a 14 week physical activity and
nutrition program, with parent involvement. Driscoll Children’s Hospital’s Healthy Kidz Obesity
project partners with a large primary care practice to serve 300 overweight and obese children in
Nueces and San Patricio counties.
The State of Texas is helping to advance obesity treatment as well. In 2009, the Texas Legislature
appropriated $1.5 million (the amount was reduced to $1.1 million in 2010), for a pilot project
within Medicaid to “evaluate the effectiveness of prevention efforts within primary care settings
in reducing the rate of obesity, improving nutritional choices, and increasing physical activity
levels of participants.” 83 The pilot, which began in Travis County in November, 2010 will serve
overweight and obese Medicaid children who have no co-morbidities. A key component of the
project will be the evaluation of cost-effectiveness for treating obesity in the primary care
setting.84
Clinicians generally agree that medical treatment is warranted for the most severe cases of
childhood obesity. The ACES (Activating Children Empowering Success) program at Dell
Children’s Medical Center of Central Texas works with severely obese children ages 2-18. The
comprehensive program includes medical monitoring, nutrition counseling, physical therapy and
activity counseling, social services, and behavior change and mental health counseling.85
Similarly, Children’s Medical Center of Dallas recently decided to re-focus its childhood obesity
efforts on the most severely obese children, and those with co-morbidities.
Despite recent efforts for effective treatment, clinicians find that the pervasive causes of obesity
often supersede clinical intervention efforts. According to the expert recommendation committee,
“providers often feel overwhelmed by obesity care in the face of the environmental forces that
promote it.”86 Texas children’s hospitals recognize this reality as well and have turned to
community-based programming for prevention and early intervention of childhood obesity,
partnering with schools and community organizations to educate families, and promote healthy
lifestyles.
Upstream interventions
By turning to community outreach beyond the hospital, children’s hospitals recognize that
upstream interventions may be a feasible approach for reducing childhood obesity. Medical care
is a “downstream” intervention, because it treats obesity once it has already occurred; conversely,
“upstream” interventions tackle the root causes of obesity. By focusing on changing the unhealthy
factors which cause obesity in the first place, upstream policies make effective use of resources to
prevent and reverse obesity in the broader population of children. 87
Researchers generally agree that environment is the cause of the obesity epidemic. Obesity is
genetically linked, with almost 250 known genes working in a complex interplay to determine a
person’s susceptibility to obesity.88 However, genes have not changed since the start of the
obesity epidemic in the 1970s—what has changed is environment.89 Shifts in food availability,
marketing, and prices have all pushed diets to include more edible oils, animal-derived foods, and
sweeteners.90 At the same time, the proliferation of new technologies such as air conditioning,
19
television
n, video games and comp
puters contrib
buted to an iincrease in ssedentary behaviors, andd a
91
decrease in
i physical activity.
a
Obesity occurs when a child’s eneergy intake (amount
(
of ccalories conssumed) is noot balanced w
with
his energy
y output (am
mount of calo
ories expended). The envvironmental changes of tthe past 30 yyears
have transslated to a well-documen
w
nted increasee in energy iintake and deecrease in ennergy outputt.
While a healthy,
h
grow
wing child’s “energy-in” normally suurpasses “ennergy-out,” tooday childreen’s
energy-in exceeds theeir energy-out by 110 to
o 165 Caloriees more thann it should, eeach day.92
Upstream
m policies foccus on chang
ging the enviironment in w
which childrren live, as w
well as childdren’s
responsess to their env
vironment, in
n order to red
duce their ennergy-in andd increase theeir energy-out.
The follow
wing section
n breaks dow
wn Texas’ up
pstream policcies into threee categoriess: those
attempting
g to reduce energy-in,
e
th
hose designeed to increasee energy-outt, and policiees which takke a
compreheensive approach, integratting both eneergy-in and eenergy-out sstrategies.
Energy-In
n policies
Texas Pub
blic School Nutrition
N
Po
olicy
In 2004, the
t Texas Deepartment off Agriculturee (TDA) issuued the Texaas Public Schhool Nutritioon
Policy (TP
PSNP), regu
ulating food served at alll Texas publiic schools. T
The TPSNP rrestricts schools
from serv
ving minimallly nutritiouss foods and requires
r
schoools to servee nutritious ffoods such aas
fruit, vegeetables, and milk. In 200
08-09, these polices affeccted meals sserved to an average of 22.9
million ch
hildren in pu
ublic and
private scchools acrosss Texas
ChangeВ inВ nutrientВ avaailabiltyВ atВ sschoolsВ afterrВ 9
each day.93
For all chiildren,
TP
PSNP
TPSNP allso limits thee
availabilitty of unhealtthy food,
VitaminВ A
by prohibiting unhealthy
SSodium
competitiv
ve foods in vending
v
Carbohydrates
machines and at snack
k bars. 94
Calcium
(See Appeendix C for a detailed
VittaminВ C
descriptio
on of TPSNP
P). The
Texas sch
hool food reg
gulations
TotalВ caloriess
are some of the stricteest in the
Iron
U.S.95
Choolesterol
According
g to TDA, Texas
T
schools haave “overwh
helmingly
complied with state nu
utrition
policies,” and many schools
have adop
pted even strricter
96
policies. A statewid
de study
corroboraates TDA’s findings.
f
The study
y examined
Fiber
TotalВ fatt
SaturatedВ fat
0%
‐30
‐20%
‐10%
0%
10%
%В chaangeВ inВ availab
bilityВ onВ schoo
olВ menus
0%
20
Source: Hang
griff and Murphy ((2007)
20
implementation of TPSNP guidelines in the first year of the policy (2004-05) at primary and
secondary schools in 11 large and small school districts in Texas. Fewer portions of high-fat
vegetables such as french fries, were served to students in reimbursable meals (school lunch and
breakfast), with larger districts reducing servings more than small districts. For other fruits and
vegetables, servings were unchanged. The percentage of schools selling large bags of chips
decreased from 43% of secondary schools immediately prior to TPSNP to 9% one year later; after
TPSNP, sales of baked chips increased.97 The study’s findings demonstrate that schools adhered
to the restrictions, although the schools did not encourage students to eat more fruits and
vegetables (which was not a TPSNP requirement). Similarly, an analysis of 186 school menus at
elementary and secondary schools in the 2006-07 school year (the 3rd year of TPSNP
implementation) found that nutrients served at schools changed significantly after TPSNP. In
accordance with the prior study, the 2006-07 menus study found the biggest changes were in
nutrients directly impacted by TPSNP.98 The menu study also found decreases in available
calories, which demonstrates the success of portion size control. 99
While the aforementioned studies concluded that schools indeed changed their food offerings to
comply with TPSNP, neither study examined whether student eating habits changed
correspondingly. An additional study indicates that student eating habits indeed changed. A study
of middle school students at three schools in Southeast Texas found that two years after
implementation (2005-06), the TPSNP positively affected student nutritional intake. The
percentage of energy intake from fat was significantly lower, and the consumption of protein,
fiber, calcium, Vitamins A and C, vegetables, and milk were significantly higher. Consumption of
sweetened beverages decreased as well.100
Of the three schools in the study, intake of energy-dense foods decreased the most at the
moderate- and high-socioeconomic status (SES) schools, while the TPSNP had a smaller, but still
significant, effect on nutritional intake at the predominantly low-SES school. This may be
because students at the higher SES schools had more money to spend on vending machines and
snacks prior to TPSNP, thus the new restrictions on competitive foods affected their diets more.
Finally, the study found that students consumed significantly more federally reimbursable meals
(i.e., National School Lunch Program meals), and consumed less food from vending machines
and school snack bars.101 Additional larger-scale studies will be needed to fully ascertain the
effect of TPSNP on Texas children’s eating habits.
WIC guidelines
Recently, Texas has begun another new energy intake initiative, with an update to the Texas
Women Infants Children Nutrition Program (WIC). In October, 2009 the WIC food package was
revised to align with the Dietary Guidelines for Americans and the American Academy of
Pediatrics’ current dietary guidance for feeding infants. The package of food is available to at-risk
children between the ages of 0 and 5 and their mothers, with incomes lower than 185% of the
federal poverty level.102 According to the Texas Department of State Health Services, “The
overall goals of the changes were to encourage consumption of fruits and vegetables, emphasize
the need for whole grains and to lower saturated fat intake, in addition to promoting the
21
establishment of long-term breastfeeding and adapting the food packages to appeal to diverse
populations.”103 (See Appendix D for a detailed description of the new WIC food package).
Researchers at the Texas A&M School of Rural Public Health expect that the new WIC
guidelines will lead retailers in high-WIC areas to dedicate greater shelf space and increase
display profiles of the healthy foods in the new WIC food packages. The researchers also expect
that WIC consumers will change purchasing and consumption behaviors to include healthier
foods.104 Over the next three years, the A&M researchers will evaluate the actual impact of the
WIC guidelines, as part of the Texas Childhood Obesity Prevention Policy Evaluation Project (TCOPPE), a $1 million initiative funded by the Robert Wood Johnson Foundation. In 2009, TCOPPE evaluators completed the first round of surveys, with 5,000 completed questionnaires
from all 73 local WIC agencies in Texas; the second round of surveys rolled out in Summer
2010.105 In addition to the updated food package, the Texas WIC program has also implemented a
protocol for WIC dieticians to identify and counsel children over age 2 who are obese.106
TDA Nutrition Outreach grants
The TDA Nutrition Outreach Program gives two types of grants to support nutrition education.
Best Practices in Nutrition Education grants provide up to $10,000 to a public school campus for
expanding existing nutrition education programs. Nutrition Education grants provide up to $5,000
to schools (public and private) and childcare institutions, to implement new nutrition education
programs.107 TDA awarded its first round of grants in August, 2010; the second round application
opened in October, 2010.108
What’s missing from Texas energy-in policy?
Today, Texas children eat more nutritious food at school than in decades past, yet their obesity
rate remains high. Most likely, TPSNP’s lack of impact on obesity rates is because children
receive most of their calories from non-school sources; Texas children’s away-from-school
caloric intake remains unhealthy. Two areas for improvement are sugar-sweetened beverage
consumption, and access to healthy foods.
Consumption away from school
Research shows that for adolescents, home is the main source of calories, followed by food from
restaurants/fast food, while school sources account for only 8% of their calories.109 Younger
children may receive more of their calories from school sources than adolescents, but even
younger children receive the majority of their calories from non-school sources.110 Thus, healthier
food at school does not lead to fully healthy diets for children. For example, the TPSNP study on
three middle schools in southeast Texas found that after TPSNP, when schools provided healthier
food, students brought significantly more soft drinks, desserts, and chips from home.111
22
Another ty
ype of study
y
So
ourcesВ ofВ tottalВ caloriesВ fforВ adolesceents,В agesВ 12
2‐18
also suggeests that
StoreВ (EaatenВ VendinggВ Out))
children’ss unhealthy
Machine
Other 5%
increases in BMI occu
ur
1%
6%
m school. Th
he
away from
study analyzed data on
children in
n kindergartten
School
and first grade,
g
8%
comparing
g BMI
increases during the
school year with
Restaurant/fas
R
tВ food
increases during
AtВ Home
19%
61%
summer vacation.
v
Increases in BMI werre
slower, with
w less
variation across raciall
and ethnicc groups,
during thee school yearr.
Sou
urce: Neilson, Sieg
ga-Riz, and Popkinn (2002)
During th
he summer,
when chilldren spent most
m of theirr time at hom
me, the BMI increases acccelerated, w
with especially
112
high ratess of increase for black an
nd Hispanic children.
c
The study’s author speculates that thhe
less-structtured enviro
onment at home allows children to coontinuously consume foood throughout
the day, raather than du
uring schedu
uled eating tiimes. If this were the case, structureed programm
ming
during non-school hou
urs, such as summer and
d after schoool programs, might lead tto reductions in
caloric inttake, and possibly reducctions in obessity. Researcch to confirm
m this hypothhesis is
underway
y.
Access to healthy food
ds
xas have limiited access to
o healthy foood when theey are not at school. Studdies
Many children in Tex
nd more fast--food restaurrants in a neighborhood increase thee
show thatt fewer groceery stores an
population
n’s BMI, altthough the siize of this efffect remainss unclear.113 In Texas, grrocery storess are
unevenly distributed, with prelimiinary data sh
howing that low-incomee neighborhooods in both rural
and urban
n areas have disproportio
onately low supermarket
s
t access.114
One soluttion for increeasing the av
vailability off out-of-schoool healthy ffood would bbe to providee
incentivess for establisshing grocery
y stores in underserved
u
aareas. For exxample, groccery store
incentivess in Pennsylv
vania and Neew York hav
ve led to inccreased healtthy food acceess, as well aas
job creatio
on.115 Anoth
her way to in
ncrease accesss to healthyy foods is thrrough farmerrs market
programs. Already, TDA and the Texas Healtth and Humaan Services C
Commissionn have initiatted a
pilot projeect in which participantss can use theeir electronicc SNAP (foood stamps) annd Temporarry
Assistance for Needy Families (T
TANF) beneffits at farmerrs markets.1116 Further exxpansion of
m
into underserved
u
d areas could
d increase he althy food aaccess even m
more.
farmers markets
23
Sugar-sweetened beverages
One notable source of away-from-school calories is sugar-sweetened beverages (SSBs), including
soft drinks, sports drinks, and sugar-sweetened juices. Children primarily obtain SSBs from home
(55-70% of all SSB calories are from home, compared with 7-15% from school sources).117 In
Texas, the proportion SSBs from school sources is likely lower, due to TPSNP’s restrictions on
SSB availability at schools.
At 150 Calories per can, SSB consumption could account for most or all of children’s daily
energy imbalance.118 On a typical day, 79% of all US children consume SSBs, and, along with
fruit juice, SSBs account for 10-15% of children’s total caloric intake. Adolescents have the
highest SSB intake of any child age group; adolescents consume an average of 30 oz. of SSB
each day, accounting for 16% of their total energy intake. 119
Excess calories derived from SSBs are particularly dangerous because sugar in liquid form does
not satiate the soda drinker. That is, a child does not feel full after consuming SSB calories, so the
child still consumes the food calories he ordinarily would, plus the additional SSB calories.120
Because of this effect, according to Yale researcher Dr. Kelly Brownell, the scientific link
between obesity and SSB consumption is stronger than for any other food or beverage.121 For
each additional can of SSB a child drinks per day, the child’s risk of obesity increases by 60%.122
While the complexity of the body’s metabolism makes proving a causal relationship between SSB
consumption and obesity very complicated, many studies show that an increase in SSB
consumption leads to an increase in BMI, while other methodologies show no effect on BMI. 123
However, studies showing that sweetener-derived calories are no different health-wise than other
calories have been funded by the beverage industry.124 According to the World Health
Organization, it is “probable” that SSB consumption increases obesity risk.125 Perhaps most
tellingly, a steep increase in SSB intake coincided with the obesity epidemic—daily intake more
than doubled since the 1970s.126 Further, SSBs account for 80% of the increase in sweetener
consumption since the 1970s.127 For this reason, the CDC identifies decreased SSB consumption
as a target area for the reduction of obesity in states.128
Since a substantial portion of children’s excess energy-in comes from SSBs (10-15% of all
calories), and this SSB intake most likely leads to obesity, it makes sense that limiting SSB intake
would be a goal of anti-childhood obesity policy. Further, because children obtain the vast
majority (over 90%) of their SSB calories from non-school sources, anti-SSB policies must limit
SSB intake beyond the school environment. One commonly suggested means for limiting awayfrom-school SSB consumption is a fee on SSBs.
The idea behind an SSB fee is that it forces consumers to opt-in to unhealthy choices, rather than
having unhealthy choices be their default option.129 Currently, SSBs cost equal or less than
healthier beverage options—SSB prices have fallen 34% relative to the Consumer Price Index
since 1978.130 Thus, a consumer saves money by making the unhealthy choice of drinking an
SSB. Moreover, consumers, especially children, often fail to realize how unhealthy SSB
consumption can be.131 For these reasons, both an increase in price relative to healthier options,
plus education on the harmful health impacts of SSBs, would theoretically cause consumers to
more carefully consider whether they are willing to undertake the health risks associated with
SSBs. Making healthy choices the default option reflects Texas’ Nutrition, Physical Activity &
24
Obesity Prevention Program’s vision of ensuring that “healthy foods and an active lifestyle are
the easy choice throughout Texas communities.”132
Studies of SSB fees uphold the theory. First, a review of 14 studies found that, on average a 10%
price increase for SSBs leads to an 8-10% decrease in consumption.133 An exploratory study of
children in the 26 states that already apply a higher tax on soda than on other food, gives an idea
of the effect of an SSB fee on reducing children’s SSB consumption. In most of these states,
including Texas, soda is not exempt from sales tax while other food is exempt.134 As a result, the
tax difference between soda and healthier options averaged at only 3.5 percentage points, much
lower per ounce than proposed fees specifically designed to reduce SSB consumption. Still, the
study found that even the modest price increases for SSBs had a small effect on reduced
consumption and reduced BMI, with the largest effects among at-risk subgroups such as lowincome, and black children. The effects in the study were small, because the taxes on SSBs were
low. Based on the results of this study, a higher tax rate, such as the 18% proposed by New York,
would have a population-wide 20% reduction on excess BMI gain. 135
The most promising effects of an SSB price increase occur when SSB shelf prices are raised,
rather than when taxes are applied at the cash register.136 A recent study of a 45-cent fee on SSBs
in a hospital cafeteria showed that SSB purchases declined by 26%. Moreover, when the 45-cent
fee was combined with education about the negative health consequences of SSB consumption,
purchases declined an additional 10 percentage points, for an overall consumption decline of
36%.137
If the hospital study were replicated in Texas, with an approximately 2-cent per ounce fee on all
SSBs sold in 2010, Texas would collect $1.7 billion in revenue.138 Even a 1-cent per ounce fee
would generate $1.1 billion in revenue for Texas, based on 2010 SSB consumption. 139 A flat fee,
as in the hospital study, rather than a percentage-based tax, would allow for predictable revenue,
because the amount collected would not fall if beverage companies adjusted prices.140 Part of this
revenue could be used for an education campaign, which appears to strengthen the effect of a fee
acting alone. In addition, revenue from a fee on SSBs could offset the state’s additional costs for
obesity-related health care caused by SSB consumption. For instance, the American Heart
Association estimates that heart disease related to SSB consumption added as much as $550
million in health care spending over the past decade.141 With Medicaid and Medicare paying
about half of obesity-attributable medical costs nationally, SSB consumption poses a significant
cost that could be recouped through an SSB fee. To the extent that reduced SSB consumption
would prevent future cases of obesity, the fee could further avert additional Medicaid costs.
Some important considerations arise when considering the practicality of a fee to promote healthy
SSB consumption decisions. First, the fee must be designed in such a way that promotes healthy
substitution. For instance, if sports drinks were exempted from the fee, people might replace soft
drinks with sports drinks that are equally high in sweetener-calories. Thus, the fee must ensure
that healthy options such as water and diet soda remain cheaper, while all unhealthy options are
affected by the fee.142 Next, revenue predictions must take into account reductions in SSB
consumption that would result from the fee. Because fewer SSBs would be consumed under a
higher fee, the 2-cent fee is not predicted to generate twice as much revenue as a 1-cent fee ($1.7
billion predicted for a 2-cent fee compared to $1.1 billion for a 1-cent fee). 143 Finally, an equity
issue arises, because a flat fee applied equally for all Texans purchasing SSBs would impact
25
lower-income Texans more strongly. However, in this case the regressive nature of the fee is
desirable, because the fee would most burden those families at greatest risk for obesity.144 These
families are also heavily represented in publicly financed health care programs.145 The higher
burden means that low-income, disproportionately minority consumers would react most strongly
to the fee, and reduce their SSB consumption more than other groups. 146
Energy-Out policies
Physical activity in schools
As with public school nutrition, Texas is a national leader in public school physical activity.
Texas has three policies in place which require physical activity for public school students. The
state requires elementary students to participate in physical activity for 30 minutes per day, or
135 minutes per week. Middle schoolers also must participate in physical activity for 30 minutes
per day, 135 minutes per week, or 225 minutes every two weeks, during four of their six
semesters in middle school. High school students are required to complete one credit of physical
education (PE) in order to graduate.
The first of the policies, the elementary school requirement, was passed as Senate Bill (SB) 19 in
2001, in response to concerns that schools were reducing PE time in order to make room for
standardized test preparation. 147 Four years later, in 2005, the Legislature passed SB 42, the
middle school requirement. 148 The Legislature did not appropriate funding to schools for
implementing either requirement. 149
In the years following SB 19
and SB 42, two studies
AverageВ weeklyВ PEВ inВ TexasВ schools
examined their
implementation, and found
that the majority of Texas
Requirement
schools were adhering to, or
exceeding, the physical
ElementaryВ Schools
activity time requirements.
While SB 42 allows middle
schools to exempt students
MiddleВ Schools
from the requirement, the
study found that most schools
0
50
100
150
200
250
300
did not permit exemptions.
minutesВ ofВ PEВ perВ week
Both elementary and middle
school officials reported high Source: Elementary Schools, data from 2005-06, Kelder et al. (2009); Middle Schools, data from
2006-08 Barroso et al. (2009)
levels of awareness about the
requirements. In particular, the studies closely examined implementation at schools in two border
regions. In these border regions, most schools met the federally recommended goal of spending at
least 50% of PE class time engaged in moderate-to-vigorous physical activity. Despite the
adherence to physical activity requirements, the studies found no corresponding decrease in
childhood obesity rates in either of the border regions. 150
26
Fitnessgram
In 2007, legislation (SB 530) added an assessment component to Texas’ physical activity policy.
The state selected Fitnessgram, a battery of fitness tests, to be administered to all children in
grades 3 to 12 each year.151 By the 2009-10 school year, 92% of districts in Texas were
submitting Fitnessgram data.152 Currently, the Texas Education Agency (TEA) publicly reports
Fitnessgram data aggregated at the statewide level.
Texas Fitness Now grants
Also in 2007, the Texas Legislature began appropriating money to TEA for economically
disadvantaged middle schools to implement high-quality physical activity programs. Since 2007,
the Texas Fitness Now grants have provided $10 million per year, based on a noncompetitive
formula, to those Texas middle schools in which more than 60% of students are economically
disadvantaged.153 Typical funding ranges from $11 to $27 per student.154 As of 2010, the grants
have been awarded to 85% of eligible schools, reaching 41% of all middle school children in
Texas. 155 Grant guidelines emphasize encouraging moderate-to-vigorous physical activity for as
many students as possible.156 In the upcoming budget cycle, TEA has slated the grants for
reduction. 157
Safe Routes to School
Texas benefits from the federal Safe Routes to School (SRTS) program, which is designed to
encourage children to use active transport (walking or riding their bicycles) to get to school. Since
federal funding commenced in 2005, Texas has received $44.8 million, with an additional $15
million expected in 2010. The Texas Department of Transportation (TxDOT) distributes the
SRTS funds, which may be used for engineering and enforcement (to ensure safety of active
transport), encouragement (to motivate children to use active transport), or evaluation.158 The
majority of SRTS funds go to infrastructure improvement projects. In 2009, TxDOT awarded
SRTS funds to 119 infrastructure projects, 82 non-infrastructure projects, and 4 statewide noninfrastructure projects. 159
In three studies in California, SRTS programs have indeed increased the number of children using
active transport.160 Research shows that active transport to school increases moderate-to-vigorous
physical activity by about 20 minutes per day. While the same research shows that active
transport has a positive effect on children’s cardiovascular fitness, evidence of a direct link
between active transport and BMI is weak.161 In Texas, T-COPPE (the same Robert Wood
Johnson initiative that is evaluating the WIC updates) is supporting a team at The University of
Texas School of Public Health to evaluate the effect of SRTS on childhood obesity; the
evaluation will be complete by 2013. 162
27
What’s missing from Texas energy-out policies?
Texas’ energy-out policies reach every child in Texas public schools. Children in Texas
elementary and middle schools regularly participate in moderate to vigorous activity at school,
and some children actively commute to and from school. Yet today, almost a decade after Texas
policymakers began their push for physical activity with the passage of SB 19, childhood obesity
rates remain high. Texas’ physical activity requirements have not yet reduced childhood obesity;
for example, after the middle school requirements were enacted, no significant change in BMI
took place. 163
The lack of physical activity impact is not limited to Texas. A broad literature review shows
mixed results of the effects of in-school physical activity programs on BMI and weight status.
Some studies show weak evidence of a reduction in weight, while others demonstrate no
impact.164 For example, in a systematic review of 15 different physical activity interventions for
children, researchers find that only 3 had a significant effect on BMI for all children (and 2 more
had a significant effect on BMI for girls only).165 The lack of impact could be that the “dose” of
physical activity is too low—Texas requires 30 minutes of moderate-to-vigorous physical
activity, while the US Department of Health and Human Services recommends 60 minutes of
moderate-to-vigorous physical activity per day for children and adolescents.166
Although it may not yet directly reduce obesity, physical activity remains an important
component of child health. Many studies show that physical activity built into the school day
improves fitness and has positive health benefits such as reducing blood pressure, increasing
muscle mass, increasing bone density, increasing aerobic capacity, and improving flexibility. 167
168
Many studies demonstrate that increased physical activity at school improves children’s’
academic performance.169 Further, schools seem to be particularly effective at ensuring physical
activity policy has a broad reach.170
Beyond “dosage,” perhaps weaknesses in Texas’ energy-out policies have precluded dramatic
results on childhood obesity. Researchers point to three areas in which the policies fall short:
physical activity programs are not well-implemented in schools, the physical activity
requirements weaken as children age into adolescence, and Texas policies do not address out-ofschool physical activity.
Low-quality implementation
Implementing high-quality PE programs is costly for schools; most likely, this prevents some
schools in Texas from complying with physical activity rules in a way that benefits students.
According to the director of the Texas Association for Health, Physical Education, Recreation and
Dance, “There are two major challenges for our professionals to deliver a quality physical
education program in Texas schools; one is funding, and the other is the large teacher to student
ratio.”171 Other evidence shows that many PE teachers in Texas obtain professional development
in sports coaching, rather than in delivering PE.172
Some researchers suggest that increased accountability would lead schools to implement higherquality physical activity programs. 173 Much as how public reporting and sanctions based on
28
TAKS scores drive schools to improve their academic performance, Dr. Steven Kelder of The
University of Texas School of Public Health, contends that accountability for physical activity
would drive schools to improve the quality of PE. The first step to accountability might be to
publicly report Fitnessgram results at the school level, and to send children’s individual
Fitnessgram results home to their parents. Dr. Kelder further suggests adding a PE test to the
TAKS battery, so that schools would be subject to the same sanctions and incentives for physical
activity as they are for other subjects.174
Weaker requirements as children age
Texas requires physical activity for all elementary-age children, yet middle school children are
permitted to forgo physical activity for two of their six semesters in middle school. At the high
school level, the PE credit requirement for graduation was reduced by half a credit in 2009;
starting this year, high schoolers are only required to complete one credit of PE throughout their
four years of high school. TEA’s analysis of Fitnessgram data hints at the importance of
maintaining strong physical activity requirements across all grades: 78% of Texas 4th graders are
in healthy cardiovascular fitness zone, compared with only 20% of 12th graders. 175 Senator Jane
Nelson (R-Flower Mound) called the high school Fitnessgram results “alarming,” and claimed the
results “show why this is a bad time to be cutting PE requirements.”176
Texas could remedy the issue by strengthening physical activity standards for middle and high
schools. For instance, middle schoolers might be required to participate in physical activity for all
six of their semesters in middle schools. Similarly, the high school PE credit requirement might
be reinstated at 1.5 credits, or higher. These policy changes would not cost state funds, although
they could create scheduling conflicts for schools and children.177 Further, strengthening physical
activity requirements might improve obesity rates in older children, but it would not remedy the
already-high overweight and obesity rates for elementary-age children.
Out-of-school physical activity
Though children in Texas spend time during the school day engaged in physical activity, at home
they continue to engage in sedentary behaviors, such as TV viewing, video game playing, or
computer use. For example, the study of SB 42 implementation at Texas middle schools showed
that while physical activity indeed increased, there was no change in time spent watching TV.
The study’s authors conclude that this “underscore[es] the continued challenges for changing
individual-level behavior change outside the school setting.”178 Some physical activity programs,
including CATCH and Spark which are used at many schools in Texas, show encouraging results
in decreasing sedentary behaviors. Still, communities can take additional steps to ensure that
children are occupied in healthy activities rather than sedentary behaviors. For example, opening
school gymnasiums before and after school allows children to take advantage of existing
facilities, and has been shown to increase physical activity.179
29
Comprehensive strategies
Perhaps the reason why Texas’ strong physical activity policies have not led to a decrease in
childhood obesity is that energy-in is much more influential in determining obesity than energyout. For perspective, the 110 to 165 Calorie energy gap at the root of childhood obesity could be
eliminated by removing one can of soda (150 Calories) per day from a child’s diet. On the other
hand, a child would need to spend almost 2 hours walking to school to burn off 150 Calories in
energy-out.180
That physical activity alone cannot make up for the excess calories from unhealthy diets
underscores the importance of a comprehensive childhood obesity strategy. The relationship
between poor diet, lack of physical activity, and childhood obesity is too complex to tackle by
focusing on energy-in or energy-out in isolation. While the correlation between reduced physical
activity and childhood obesity is well-documented, some evidence indicates that increased BMI
from poor diet leads to a reduction in physical activity, and not the other way around. 181 This
indicates that children become obese because of their diets, and subsequently abandon physical
activity. Thus, increasing physical activity without addressing diet cannot counter the underlying
cause of children’s obesity. This conclusion is supported by studies demonstrating that even those
physical activity programs which reduce children’s BMI in the short-run do not create lasting
changes in children’s BMI. 182 Without addressing crucial dietary changes, physical activity
efforts will be overpowered by poor nutrition.183
For this reason, the most successful anti-obesity policies recognize that healthy weight is a
balance of multiple factors. These policies take a comprehensive approach, incorporating
nutrition, physical activity, and education. By unifying the energy-in and energy-out policies,
children learn the connection between the nutritious food in the cafeteria, and their participation
in physical activity. The best comprehensive strategies tie together the reforms at school, and
include parents and community members in the effort.
Obesity Prevention grants
The Texas Department of State Health Services (DSHS) Obesity Prevention grant program takes
a holistic view of obesity prevention, awarding competitive grants to communities across Texas.
Of the 11 grants awarded in 2010, in amounts ranging from $150,000 to $300,000, at least five
focused on improvements to the built environment to promote physical activity, and four focused
on improving access to healthy foods. In the previous cycle, in 2009, two grants focused on
breastfeeding promotion, one supported a farmers market, and another grant supported nutrition
education. The 81st Legislature appropriated $4.7 million for the grants in the 2010-11 biennium;
DSHS has requested $4 million for the grants in the next biennium.184
30
Coordinated School Health Programs
In addition to physical activity requirements, SB 19
and SB 42 required districts to adopt Coordinated
School Health Programs (CSHPs). A CSHP must
include eight elements (See sidebar). In 2007, TEA
approved four CSHPs that districts may implement
in grades K-8, or districts may develop their own
program.185 The four approved programs are
Bienestar Health Program, CATCH, Spark +
Healthy and Wise, and The Great Body Shop. Of
these, CATCH is the most popular, having been
implemented at over half of Texas elementary
schools.186
EightВ (8)В requiredВ CSHPВ elements:В 1. NutritionВ ServicesВ 2. PhysicalВ EducationВ 3. HealthВ EducationВ 4. HealthВ ServicesВ 5. HealthyВ andВ SafeВ SchoolВ EnvironmentВ 6. CounselingВ andВ MentalВ HealthВ ServicesВ 7. StaffВ WellnessВ PromotionВ 8. ParentВ andВ CommunityВ InvolvementВ Source: DSHS (2008)
All four of the approved CSHPs have been shown to influence healthy behaviors in children. Of
the four, CATCH is the only program that has shown to have an effect on BMI, by reducing the
rate of children’s BMI increase. CATCH is also the most cost-effective childhood obesity
intervention available, considering the low cost of implementation, and the high value of a
lifetime of reduced medical costs and increased productivity.187 Research shows that both
Bienestar and The Great Body Shop reduce target unhealthy behaviors, although they have not
shown to affect BMI. Healthy and Wise (the coordinated health element of the Spark + Healthy
and Wise CSHP) has not been peer reviewed.188
Some evidence indicates that schools have had difficulty adhering to the CSHP requirements. A
study in elementary schools conducted three years after the requirement was announced, and one
year before enforcement began, found that while most school officials were aware of the CSHP
requirement, substantial numbers of school officials did not know the components that a CSHP
entailed. For example, over 40% of surveyed school officials did not know that CSHPs must
include a parental involvement component.189 At the time (one year prior to enforcement) only
43% of surveyed schools reported having adopted a CSHP.190 A different survey of districts in
southeast Texas found that shortly before the 2007 deadline, 79% had adopted a CSHP.191
Community-school partnership approaches
Of all the comprehensive strategies for reducing childhood obesity, those that have shown the
most success include a community element, in partnership with school involvement. Three
community-school partnership studies have shown stronger results in reducing childhood obesity
than any other programs yet studied.
Results from the first year of the Shape Up Somerville program show decreases in children’s
BMI: participating children gained one pound less than the control group children (because
children are growing, it is expected that they will gain a certain amount of weight each year).
Shape Up Somerville is a community-wide childhood obesity reduction effort in Somerville,
Massachusetts. The program’s extensive community component involves many community
31
organizations, the local media, city government, local restaurants and health care providers. The
effort has led to changes in zoning laws to promote active transport, reduced portion sizes at local
restaurants, and farmers market promotion.192
In three years between 2003 and 2006, the slightly less-intensive Be Active Eat Well program in
Australia also reduced weight gain, and flattened the social gradient of obesity. The program took
a community capacity-building approach, working to build both skills and relationships between
community organizations, health organizations, schools, and other stakeholders. The program
cost approximately $100,000 per year for each of the three years of intervention.193
A third community-school partnership, CATCH El Paso, showed the strongest results of any
program yet. In addition to implementing CATCH in El Paso schools, the Paso del Norte Health
Foundation spent over $1.4 million to fund a media campaign, the Walk El Paso walking
encouragement program, and Que Sabrosa Vida, a healthy eating program.194
Two separate evaluations documented the program’s significant effects. In the first three years of
implementation, for girls in CATCH schools there was only a 2% increase in overweight/obesity
prevalence, compared to a 13% increase for girls in control schools. That is, CATCH lowered the
rate of increase for overweight/obesity prevalence by 11 percentage points. For boys, CATCH
lowered the rate of prevalence increase by 8 percentage points.195 Two years later, researchers
documented an actual decrease in overweight/obesity prevalence. SPAN III results from the fifth
year of CATCH El Paso show that El Paso’s 4th graders dropped from 25.8% obese in 2000 to
18.8% obese in 2005, a 7 percentage point decrease in obesity prevalence. The SPAN results are
the first US documentation of a population-wide decrease in childhood obesity prevalence.196
It is not surprising that adding intensive community involvement to a school-based program leads
to strong results in reducing childhood obesity. Studies of children’s eating habits show that the
environment out of school—at home, and in the broader community—matters as much or more
than the school environment. A community-school partnership ensures that a child’s environment
supports healthy living both at school, and beyond school. The Somerville model made structural
changes to the community environment, such as increased walkability and availability of healthy
foods. The El Paso format ensures that families and community members participate in modeling
and encouraging healthy choices for children.
To achieve their remarkable results, the Somerville, Australia, and El Paso programs each took
advantage of substantial funding and community buy-in. Yet, many communities in Texas would
be unable to sustain such an intensive approach. Recently, researchers at The University of Texas
School of Public Health sought to implement a community-school partnership with a much less
intensive community role.
The CATCH Travis County study compared 30 schools, half of which had the typical CATCH
program, and half of which included CATCH plus a minimal community involvement
component. At the community partnership schools, a Community Action Team made up of
community partners attended community workshops and put on one evidence-based activity per
semester. Examples of activities included after-school physical activity programs, school
gardening programs, and healthy food tastings. 197
32
The school-community partnership schools had results similar to CATCH El Paso, with an 8.3
percentage point decrease in overweight/obesity prevalence after one year of intervention. This
impact was much greater than the 1.3 percentage point decrease in prevalence at the schools with
CATCH but no community partnership. The researchers found that children at communitypartnership schools changed their diets more drastically, and the classroom component of the
CATCH curriculum was implemented more fully than at non-partnership schools.198
Both El Paso and Travis County studies showed success in reducing obesity among the most atrisk children, in predominantly low-income, minority schools. These two communities were
highly receptive to the efforts, thus their programs showed great success. Not every Texas
community could support a program in the way that El Paso and Travis County did. Schools
should have the flexibility to work with their own community to tailor the solution that works
best for them.
Early childhood coordinated health
Implementing coordinated health programs for young children in the child care setting would
have important benefits. First, it is easier to intervene as early as possible in a child’s life, so that
he develops healthy behaviors from the start, and does not have to overcome bad habits later in
life. In addition, early childhood is a crucial physiological period to the development of
obesity.199 Even before kindergarten, Texas children show high rates of overweight and obesity.
Finally, coordinated health programs would provide much needed caregiver training. Often child
care providers are unaware of how to encourage healthy behaviors in children; educator training
is a key element of coordinated health programs. 200
CSHPs have shown to
positively affect the energy-in
and energy-out behaviors of
older children. These same
programs have already been
translated into programs for
younger children. Spark has
developed an early childhood
physical activity program, and
CATCH has developed a
comprehensive early
childhood program.201 As
with Texas policies in older
grades, early childhood
coordinated health would
Prevalence of overweight and obesity among low‐
income Texas children in WIC (ages 0‐5)
11%
11%
11%
9%
10%
Overweight
7%
9%
7%
AllВ WIC
children
10%
11%
Black
7%
Hispanic White
(allВ races)
Obese
6%
Asian
Other
include nutrition, physical
Source: DSHS (2010) based on 2007 WIC data
activity, parent and child education.
33
CONCLUSIONS AND RECOMMENDATIONS
In the past decade, Texas has worked hard to reduce obesity among its children. This dedication
stems not only from concern for the well-being of Texans, but from an acknowledgement of the
high costs of obesity to the state. Texas leaders realize that obesity leads to chronic diseases that
carry a high medical price tag for both public and private payers. Obesity also reduces
productivity, both at work, and for the next generation, at school. To reduce these costs, Texas
policymakers have made the smart decision to focus on reducing obesity in children. Not only do
children incur medical and productivity costs themselves, but they are very likely to become
costly obese adults.
Texas has turned to upstream solutions that address the root, environmental causes of obesity.
While medical treatment of obesity is crucial for certain children, clinical intervention remains a
costly and impractical solution for the large-scale epidemic of childhood obesity. By addressing
the causes of obesity, upstream solutions show promise as cost-effective population-based
approaches. In the past decade, Texas has done much to change the environment at public
schools, to ensure that children eat healthy and exercise during the school day. According to one
of the state’s leading childhood obesity researchers, Dr. Deanna Hoelscher, “The programs and
policies implemented in Texas helped to stabilize the prevalence of obesity among all grade
levels in all regions. However, the rate of child obesity in all counties is greater than the targeted
national health goal of 5 percent prevalence." 202
In light of unchanging childhood obesity rates, Texas must do more to strengthen and support its
current childhood obesity policies.
п‚·
Address away-from-school food: Texas must address the calories children consume from
non-school sources, in addition to those consumed at school. While healthy food at school is
important, children obtain most of their food away from school. For too many children, that
food remains unhealthy. Two recommendations could alleviate this reality. First, Texas
could increase access to healthy food by promoting farmers markets and grocery stores in
underserved areas. Second, Texas could discourage consumption of unhealthy foods such as
by imposing a fee on sugar-sweetened beverages. Healthy choices could be cheaper than
soda and push families to confront their unhealthy consumption decisions. This option would
also create significant revenue for the state, as well as avert future health care costs.
п‚·
Strengthen in-school physical activity: Texas must strengthen its existing physical activity
policies, to ensure that all children are physically fit and expend appropriate amounts of
energy. Such policy improvements might include increasing the required number of physical
activity semesters for middle school and high school students. In addition, Texas could
enhance the quality of physical activity offerings by leveraging the Fitnessgram as an
accountability tool, to motivate schools to improve quality. Resources, such as the Texas
Fitness Now grants are vital components of ensuring that schools are able to offer highquality physical activity programming.
п‚·
Capitalize on the promise of CSHPs: Texas must build on the promise of CSHPs as
effective, comprehensive strategies to reduce childhood obesity. In all grades, Texas could
encourage high-quality CSHP implementation by holding schools accountable and rewarding
34
top-performing schools. Following best-practice evidence, Texas could encourage schools to
incorporate community involvement into their CSHPs, through public-private partnerships,
or with community advisers. Finally, already-available early childhood versions of CSHPs
could be implemented in childcare settings, in order to help the youngest Texans develop
healthy habits early.
35
APPENDICES
36
Appendix A: Selected enacted Texas legislation relating to childhood obesity (1993-2010)
Area of Impact
Session
77R
Bill
Treatment
EnergyIn
SB
19
SB
474
x
SB
1357
x
EnergyOut
x
Comprehensive
x
x
78R
79R
SB
42
HB
2313
x
x
x
x
x
x
HB
3618
x
SB
415
x
530
SB
556
Permits State Board of Education to enact a
135 minute/week physical activity requirement
for elementary schools. Requires school
districts to establish a School Health Advisory
Council. Requires elementary schools to
implement a Coordinated School Health
Program (CSHP).
Establishes a joint interim committee to study
nutrition and health in public schools.
Requires school districts to make publicly
available policies regarding physical activity
requirements, vending machine and food
service guidelines, and penalties for the use of
tobacco products by students. Clarifies
composition and role of School Health Advisory
Councils (SHACs).
Permits State Board of Education to enact a
physical activity requirement at the middle
school level. Requires CSHPs at the middle
school level. Requires schools to report health
and physical activity requirements, and enacts
measures for ensuring greater compliance with
TDA nutrition policies. Establishes a state-level
SHAC.
Designates the second full week in September
as Obesity Awareness Week.
Requires DSHS to adopt criteria for the
development of a diabetes intervention pilot
program for school districts that are located on
the Texas-Mexico border and that have a
population of less than 600,000.
Updates Risk Assessment for Type II Diabetes
program, which screens public school children
for Type II diabetes risk factors.
80R
SB
Detailed Description
Requires districts to assess physical fitness
[using Fitnessgram]. Requires TEA to analyze
Fitnessgram results to find correlations
between results, academics, behavior, and
school policies. Requires TEA and the statelevel SHAC to research and report on ways to
provide 30 minutes of physical activity outside
the school day.
x
x
Establishes Interagency Obesity Council
including TDA, DSHS, and TEA.
37
Area of Impact
Session
Bill
Treatment
HB
3
1622
x
SB
282
x
SB
SB
343
395
870
SB
891
SB
1016
SB
1027
EnergyOut
Comprehensive
Detailed Description
Reduces high school PE requirement from 1.5
credits to 1 credit.
x
HB
SB
81R
EnergyIn
Requires TDA to develop and implement a
children's access to nutritious food program to
award grants to nonprofit organizations for the
purpose of allowing food banks to provide
children at risk of hunger or obesity with access
to nutritious food outside the school day.
Authorizes TDA to develop an outreach
program to promote better health and nutrition
programs and prevent obesity among children
in Texas. Requires TDA to develop grants to
public school campuses and participants in the
Child and Adult Care Food Program, Head Start
program, or other early childhood education
programs.
x
Requires HHSC and TDA to jointly establish a
healthy food advisory committee to study and
provide recommendations regarding areas of
Texas where the availability of healthy foods is
limited ("food deserts") and the impact of the
limited availability on proper nutrition and on
obesity and related chronic illnesses.
x
x
Establishes the Early Childhood Health and
Nutrition Interagency Council, charged with
researching, reporting, and creating a
statewide plan on health, nutrition, and
physical activity for children under 6, including
practices in childcare settings.
x
Makes changes to Interagency Obesity
Council's duties and requires HHSC and DSHS
to establish an obesity prevention pilot program
in one or more health care service regions in
the state. [Travis County Pilot]
x
x
x
x
x
Specifies requirements for PE curriculum,
including emphasis on promoting a lifetime of
physical activity, in and out of school. Extends
elementary school physical activity
requirements to pre-kindergarten. Requires
schools to establish goals, objectives, and
safety plans for PE classes.
Authorizes TDA to develop an outreach
program to promote better health and nutrition
and prevent obesity among Texas children.
Establishes an interagency farm-to-school
coordination task force (including TDA, TEA,
and DSHS) charged with developing and
implementing a plan to facilitate the availability
of locally grown food products in public schools.
38
Appendix B: Selected Texas rules and regulations relating to childhood obesity
Agency
Rule
Effective
Date
TDA
4 T.A.C. Subchapter A
2/26/09
TEA
19 T.A.C. Section 103.1003
8/28/08
TEA
19 T.A.C. Chapter 74 (f)
8/23/10
Nutrition Services Policy No.
FD: 12.0
10/1/09
DSHS
Rule Description
Sets forth Texas Public School
Nutrition Policy (see Appendix C for
details)
Sets student physical activity
requirements and exemptions for
grades K-8
Sets physical education requirements
and exemptions for high schools
Sets forth new WIC food packages
(see Appendix C for details)
39
Appendix C: Texas Public School Nutrition Policy
From "Texas Public School Nutrition Policy at a Glance," Texas Department of Agriculture
SY09-10
Type of food
Elementary Schools
Middle Schools
Foods of minimal
nutritional value,
including any
carbonated beverage,
and all candy
Not allowed to be provided to students any time
anywhere on school premises by anyone until after
the end of the last scheduled class.
Not allowed anywhere
on school premises from
30 minutes before to 30
minutes after meal
periods. All food,
beverages and snack
items must comply with
the nutrition standards
and portion size
restrictions in this policy.
High Schools
Not allowed to be provided
to students any time
anywhere until after the
end of the last scheduled
class.
Not allowed during meal
periods in areas where
reimbursable meals are
served and consumed. All
food, beverages and snack
items must comply with
the nutrition standards and
portion size restrictions in
this policy.
Competitive foods (All
food and beverages that
are not
provided by school food
service.)
Not allowed to be
provided to students any
time anywhere on school
premises until after the
end of the last scheduled
class.
Fats
Individual food items must not contain more than 23 grams of fat with an
exception of one individual food item per week. No food items can exceed 28
grams of fat at any time. (See the full policy for peanut butter exemption.)
Deep-fat frying
Must be eliminated as a method of on-site preparation at all schools (end of
transition period for facilities requiring extensive changes).
French fries and other
previously fried potato
products (Baked potato
products that have not
been pre-fried, flashfried or deep-fat fried
may be served without
restriction.)
Not allowed to be
provided to students any
time anywhere on school
premises until after the
end of the last scheduled
class.
Trans fats
Trans fat information must be requested in all product specifications and the
purchase of products containing trans fats must be reduced.
Fruits and vegetables
Must be offered daily on all points of service, preferably fresh. Frozen and canned
fruits should be packed in natural juice, water or light syrup whenever possible.
Milk
Schools may offer whole milk but must also offer 2 percent, 1 percent or skim milk
at all points where milk is served.
Fruit and vegetable
juices
Portions may not exceed
3 oz., may only be
served three times per
week, and may only be
purchased by students
one serving at a time.
Must be baked for onsite preparation.
Portions may not exceed 3
oz. and may only be
purchased by students one
serving at a time. Must be
baked for on-site
preparation.
All beverages must be
milk, unflavored water
and 100% fruit/vegetable
juice. No electrolyte
replacement beverages
(sports drinks) may be
served or sold.
40
Type of food
Elementary Schools
Middle Schools
High Schools
The maximum portion size and nutrient restrictions below apply to all foods and beverages served or
made available via vending machines, fundraisers, snack bars, a la carte or any other service point.
These restrictions do not apply to food items served as part of a reimbursable school meal unless
they are individually sold.
Chips (fried or baked)
Other (crackers,
popcorn, cereal, trail
mix, nuts, seeds, dried
fruit, jerky, pretzels)
Cookies/cereal bars
Bakery items (e.g.
pastries, muffins)
Frozen desserts, ice
cream, frozen yogurt,
pudding, or gelatin
Whole milk, flavored or
unflavored
Reduced fat milk,
flavored or unflavored
Beverages other than
milk
Frozen fruit slushes
(must contain at least
50 percent fruit juice)
1.5 oz (no more than 7.5 grams of fat per bag)
1.5 oz
2 oz. Total fat must not exceed 30 percent of calories or 3 grams per 100 calories;
saturated fat must not exceed 10 percent of calories or 1 gram per 100 calories;
sugar must not exceed 10 grams per ounce. See the full policy for grain/bread
exemptions at breakfast.
3 oz. (see note for Cookies/cereal bars)
4 oz.
8 fl. oz. Flavored milks must not contain more than 30 grams of sugar per 8 fl. oz.
16 fl. oz. Flavored milks must not contain more than 30 grams of sugar per 8 fl.
oz.
6 fl. oz. Must not contain
more than 30 grams total
sugar per 6 fl. oz. Juices
must be 100 percent fruit
12 fl. oz. Must not contain more than 30 grams of
and/or vegetable juice.
sugar per 8 fl. oz. No limit on non-carbonated,
No limit on nonunflavored water.
carbonated, unflavored
water. Electrolyte
replacement beverages
are not allowed.
6 fl. oz.
8 fl. oz.
12 fl. oz.
41
Appendix D: WIC food package updates
From Texas Department of State Health Services, WIC “Summary of Food Changes” (2010)
Alignment with national dietary recommendations
п‚· Increases fiber by adding:
o Fresh and frozen fruits, and vegetables;
o Whole grain bread, oatmeal, brown rice, corn and whole wheat tortillas;
п‚· Reduces saturated fat and cholesterol by decreasing amounts of:
o Milk (low-fat milk for women and children age 2 and over;
o Eggs;
o Cheese;
п‚· Delays introduction of infant cereal
п‚· Adds infant foods, including fruits, vegetables, and meats
п‚· Eliminates infant juice
Better promotion and support for the establishment of long-term breastfeeding
п‚· Breast pumps and breastfeeding support provided, as needed
п‚· For exclusively breastfeeding women,
o Increased amount of food;
o Addition of salmon
п‚· For exclusively breastfed infants,
o Increased amounts of infant fruits and vegetables;
o Addition of infant meats
Accommodate cultural food preferences
п‚· Tofu and soy milk as an option instead of milk
Better accommodate special needs participants
п‚· Supplemental foods in addition to formula
42
Appendix E: List of acronyms
BMI
Body Mass Index
CATCH
Coordinated Approach to Child Health
CDC
Centers for Disease Control and Prevention
CMS
Centers for Medicare and Medicaid Services
CSHP
Coordinated School Health Program
DSHS
Texas Department of State Health Services
EPSDT
Early and Periodic Screening Diagnosis and Treatment
HB
House Bill
HRSA
Health Resources and Services Administration
IOM
Institute of Medicine
MVPA
Moderate-to-Vigorous Physical Activity
PA
Physical Activity
PE
Physical Education
SB
Senate Bill
SES
Socioeconomic status
SNAP
Supplemental Nutrition Assistance Program (food stamps)
SPAN
School Physical Activity and Nutrition study
SRTS
Safe Routes to School program
SSB
Sugar-Sweetened Beverage
T-COPPE
Texas Childhood Obesity Prevention Policy Evaluation
TAKS
Texas Assessment of Knowledge and Skills
TDA
Texas Department of Agriculture
TEA
Texas Education Agency
TPSNP
Texas Public School Nutrition Policy
TxDOT
Texas Department of Transportation
WIC
Texas Women Infants Children Nutrition Program
43
Appendix F: References
1
Esbach, K. and Fonseca, V. (Jan. 2009). Findings on the Obesity Epidemic in Texas. Methodist Healthcare
Ministries of South Texas, Inc. and Texas Health Institute, retrieved from
http://txsdc.utsa.edu/download/pdf/obesity/THI_Obesity_Summary.pdf.
2
Koplan, J.P, Liverman, C.T, and Kraak, V.I. (Eds.) (2005). Preventing Childhood Obesity: Health in The Balance.
Institute of Medicine, The National Academies Press, p. 72.
3
Cawley, J. (Mar. 2010). “The Economics Of Childhood Obesity.” Health Affairs 29(3) 364-371.
4
Wang, Y.C. et al. (Dec. 2006). “Estimating the Energy Gap Among US Children: A Counterfactual Approach.”
Pediatrics 118(6) e1721-e1733.
5
Texas Insider (Mar. 29, 2010). “Comptroller Combs, Texas PTA Reaffirms Priorities for Children.” Retrieved
from http://www.susancombs.com/media/comptroller-combs-texas-pta-reaffirms-priorities-children.
6
Koplan, J.P, Liverman, C.T, and Kraak, V.I. (Eds.) (2005). Preventing Childhood Obesity: Health in The Balance.
Institute of Medicine, The National Academies Press, p. 55.
7
Ogden, C. L. and Caroll, M. (Jun. 2010). “Prevalence of Obesity Among Children and Adolescents: United States,
Trends 1963-1965 Through 2007-2008.” National Center for Health Statistics, retrieved from
http://www.cdc.gov/nchs/data/hestat/obesity_child_07_08/obesity_child_07_08.htm.
8
Ogden, C. L. et al. (January 2010). “Prevalence of High Body Mass Index in US Children and Adolescents, 20072008.” Journal of the American Medical Association 303 (3) 242.
9
Childhood Obesity Action Network (2009). “Texas State Obesity Profile.” National Initiative for Children's
Healthcare Quality, Child Policy Research Center, and Child and Adolescent Health Measurement Initiative,
retrieved from http://nschdata.org/Viewdocument.aspx?item=565.
10
DSHS (May 2010). Texas Overweight and Obesity Statistics [data from SPAN III 2004-2005]. Texas Department
of State Health Services, retrieved from http://www.dshs.state.tx.us/obesity/pdf/DataFacts.pdf.
11
Childhood Obesity Action Network (2009). “Texas State Obesity Profile.” National Initiative for Children's
Healthcare Quality, Child Policy Research Center, and Child and Adolescent Health Measurement Initiative,
retrieved from http://nschdata.org/Viewdocument.aspx?item=565.
12
Hoelscher, D.M. et al. (June 2004). “Measuring the Prevalence of Overweight in Texas Schoolchildren.”
American Journal of Public Health 94(6) 1002-1008.
13
Hoelscher, D.M. et al. (June 2004). “Measuring the Prevalence of Overweight in Texas Schoolchildren.”
American Journal of Public Health 94(6) 1002-1008.
14
Ogden, C. L. and Caroll, M. (Jun. 2010). “Prevalence of Obesity Among Children and Adolescents: United States,
Trends 1963-1965 Through 2007-2008.” National Center for Health Statistics, retrieved from
http://www.cdc.gov/nchs/data/hestat/obesity_child_07_08/obesity_child_07_08.htm.
15
Esbach, K. and Fonseca, V. (Dec. 2008). Presentation: Current and Future Trends in Obesity in Texas. Presented
at Partnership for Healthy Texas, Obesity Health Policy Forum. Retrieved from http://txsdc.utsa.edu/presentations/ .
16
DSHS (May 2010). Texas Overweight and Obesity Statistics [data from 2009 Texas BRFSS]. Texas Department
of State Health Services, retrieved from http://www.dshs.state.tx.us/obesity/pdf/DataFacts.pdf.
17
Esbach, K. and Fonseca, V. (Jan. 2009). Findings on the Obesity Epidemic in Texas. Methodist Healthcare
Ministries of South Texas, Inc. and Texas Health Institute, retrieved from
http://txsdc.utsa.edu/download/pdf/obesity/THI_Obesity_Summary.pdf.
44
18
Combs, S. (Mar. 2007). Counting Costs and Calories. Texas Comptroller of Public Accounts, retrieved from
http://www.window.state.tx.us/specialrpt/obesitycost/96-1245costscalories.pdf.
19
Esbach, K. and Fonseca, V. (Jan. 2009). Findings on the Obesity Epidemic in Texas. Methodist Healthcare
Ministries of South Texas, Inc. and Texas Health Institute, retrieved from
http://txsdc.utsa.edu/download/pdf/obesity/THI_Obesity_Summary.pdf.
20
Guo, S. S. et al. (Sep. 2002). “Predicting overweight and obesity in adulthood from body mass index values in
childhood and adolescence.” American Journal of Clinical Nutrition 76(3) 653-658.
21
Serdula, M. K. et al. (1993). “Do Obese Children Become Obese Adults? A Review of the Literature.” Preventive
Medicine (22) 166-177.
22
Koplan, J.P, Liverman, C.T, and Kraak, V.I. (Eds.) (2005). Preventing Childhood Obesity: Health in The Balance.
Institute of Medicine, The National Academies Press, p. 23.
23
Daniels S.R., Arnett D.K., et al. (2005). “Overweight in Children and Adolescents: Pathophysiology,
Consequences, Prevention, and Treatment.” Circulation (111) 1999-2012.; Must, A. and Strauss, R.S. (1999).
“Risks and Consequences of Childhood and Adolescent Obesity.” International Journal of Obesity (23) Suppl 2, S2S11.
24
Koplan, J.P, Liverman, C.T, and Kraak, V.I. (Eds.) (2005). Preventing Childhood Obesity: Health in The Balance.
Institute of Medicine, The National Academies Press, p. 67.
25
Cook, S. et al. (2003). “Prevalence of a Metabolic Syndrome Phenotype in Adolescents.” Archives of Pediatric
and Adolescent Medicine (157) 821-827; Koplan, J.P, Liverman, C.T, and Kraak, V.I. (Eds.) (2005). Preventing
Childhood Obesity: Health in The Balance. Institute of Medicine, The National Academies Press, p. 69.
26
Koplan, J.P, Liverman, C.T, and Kraak, V.I. (Eds.) (2005). Preventing Childhood Obesity: Health in The Balance.
Institute of Medicine, The National Academies Press, p. 69.
27
Combs, S. (Mar. 2007). Counting Costs and Calories. Texas Comptroller of Public Accounts, retrieved from
http://www.window.state.tx.us/specialrpt/obesitycost/96-1245costscalories.pdf.
28
Finklestein, E.A., Trogdon, J.G., Cohen, J.W., and Dietz, W. (July 2009). “Annual Medical Spending Attributable
to Obesity: Payer- and Service-Specific Estimates.” Health Affairs 28(5) w822-w831.
29
Finklestein, E.A., Trogdon, J.G., Cohen, J.W., and Dietz, W. (July 2009). “Annual Medical Spending Attributable
to Obesity: Payer- and Service-Specific Estimates.” Health Affairs 28(5) w822-w831.
30
Trasande, L. (2010). “How Much Should We Invest in Preventing Childhood Obesity?” Health Affairs 29(3) 372378.
31
Flynn, M.A.T. et al. (Feb. 2006). “Reducing obesity and related chronic disease risk in children and youth: a
synthesis of evidence with �best practice’ recommendations.” Obesity Reviews 7(S1) 7-66.
32
Wang, G. and Dietz, W.H. (May 2002). “Economic Burden of Obesity in Youths Aged 6 to 17 Years: 1979–
1999.” Pediatrics 109(5) e81.
33
Trasande, L. Liu, Y, Fryer, G. and Weitzman, M. (July 2009). “Effects Of Childhood Obesity On Hospital Care
And Costs, 1999–2005.” Health Affairs 28(4) w751-w760.
34
Wang, G. and Dietz, W.H. (May 2002). “Economic Burden of Obesity in Youths Aged 6 to 17 Years: 1979–
1999.” Pediatrics 109(5) e81.
35
Trasande, L. Liu, Y, Fryer, G. and Weitzman, M. (July 2009). “Effects Of Childhood Obesity On Hospital Care
And Costs, 1999–2005.” Health Affairs 28(4) w751-w760.
45
36
Woolford, S.J. et al. (2007). “Incremental Hospital Charges Associated With Obesity as a Secondary Diagnosis in
Children.” Obesity (15) 1895-1901.
37
Abdullah, F. et al. (2010). “Analysis of 23 million US hospitalizations: uninsured children have higher all-cause
in-hospital mortality.” Oxford Journal of Public Health 32(2) 236-244.
38
Trasande, L. Liu, Y, Fryer, G. and Weitzman, M. (July 2009). “Effects Of Childhood Obesity On Hospital Care
And Costs, 1999–2005.” Health Affairs 28(4) w751-w760.
39
Trasande, L. Liu, Y, Fryer, G. and Weitzman, M. (July 2009). “Effects Of Childhood Obesity On Hospital Care
And Costs, 1999–2005.” Health Affairs 28(4) w751-w760.
40
Trasande, L. Liu, Y, Fryer, G. and Weitzman, M. (July 2009). “Effects Of Childhood Obesity On Hospital Care
And Costs, 1999–2005.” Health Affairs 28(4) w751-w760.
41
Trasande, L. and Chatterjee, S. (Sep. 2009) “The Impact of Obesity on Health Service Utilization and Costs in
Childhood.” Obesity 17(9) 1749-1754.
42
Thomson Medstat (2006). Childhood Obesity: Costs, Treatment Patterns, Disparities in Care, and Prevalent
Medical Conditions. Retrieved from http://www.medstat.com/pdfs/childhood_obesity.pdf.
43
Skinner, A.C. et al. (Feb. 2008). “Health Status and Health Care Expenditures in a Nationally Representative
Sample: How Do Overweight and Healthy-Weight Children Compare?” Pediatrics 121(2) e269-e277.
44
Cook, S. et al. (2009). “Medical Costs of Implementing Childhood Obesity Expert Recommendations” (Abstract
only). Circulation (120).
45
Trasande, L. (2010). “How Much Should We Invest in Preventing Childhood Obesity?” Health Affairs 29(3) 372378.
46
Trasande, L. (2010). “How Much Should We Invest in Preventing Childhood Obesity?” Health Affairs 29(3) 372378.
47
Trasande, L. Liu, Y, Fryer, G. and Weitzman, M. (July 2009). “Effects Of Childhood Obesity On Hospital Care
And Costs, 1999–2005.” Health Affairs 28(4) w751-w760.
48
Thomson Medstat (2006). Childhood Obesity: Costs, Treatment Patterns, Disparities in Care, and Prevalent
Medical Conditions. Retrieved from http://www.medstat.com/pdfs/childhood_obesity.pdf.
49
Woolford, S.J. et al. (2007). “Incremental Hospital Charges Associated With Obesity as a Secondary Diagnosis in
Children.” Obesity (15) 1895-1901.
50
Thomson Medstat (2006). Childhood Obesity: Costs, Treatment Patterns, Disparities in Care, and Prevalent
Medical Conditions. Retrieved from http://www.medstat.com/pdfs/childhood_obesity.pdf.
51
Trasande, L. Liu, Y, Fryer, G. and Weitzman, M. (July 2009). “Effects Of Childhood Obesity On Hospital Care
And Costs, 1999–2005.” Health Affairs 28(4) w751-w760.
52
Trasande, L. Liu, Y, Fryer, G. and Weitzman, M. (July 2009). “Effects Of Childhood Obesity On Hospital Care
And Costs, 1999–2005.” Health Affairs 28(4) w751-w760.
53
Lee, J.S, Sheer, J., Lopez, N. and Rosenbaum, S. (July 2010). “Coverage of Obesity Treatment: A State-by-State
Analysis of Medicaid and State Insurance Laws.” Public Health Reports (125) 596-604.
54
HHSC (Nov. 2010). Medicaid Childhood Obesity Prevention Pilot: Report to the Texas Legislature. Texas Health
and Human Services Commission. Retrieved from
http://www.hhsc.state.tx.us/reports/MedicaidChildObesityPreventionPilotReport.pdf
46
55
Rosenbaum, S. et al. (2005). “Reducing Obesity Risks During Childhood: The Role of Public and Private Health
Insurance.” George Washington University and the Robert Wood Johnson Foundation. Retrieved from
http://www.gwumc.edu/sphhs/departments/healthpolicy/chpr/downloads/Obesity%20Report%20Final.pdf.
56
Combs, S. (Mar. 2007). Counting Costs and Calories. Texas Comptroller of Public Accounts, retrieved from
http://www.window.state.tx.us/specialrpt/obesitycost/96-1245costscalories.pdf.
57
Sepulveda, M.J., Tait, F., Zimmerman, E. and Edington, D. (2010). “Impact of Childhood Obesity on Employers.”
Health Affairs 29(3) 513-521.
58
Trasande, L. Liu, Y, Fryer, G. and Weitzman, M. (July 2009). “Effects Of Childhood Obesity On Hospital Care
And Costs, 1999–2005.” Health Affairs 28(4) w751-w760.
59
National Institute for Health Care Management (2005). “Health Plans Emerging As Pragmatic Partners in Fight
Against Obesity.” NIHCM, p. 8, 9; Rosenbaum, S. et al. (2005). “Reducing Obesity Risks During Childhood: The
Role of Public and Private Health Insurance.” George Washington University and Robert Wood Johnson
Foundation. Retrieved from
http://www.gwumc.edu/sphhs/departments/healthpolicy/chpr/downloads/Obesity%20Report%20Final.pdf .
60
Finklestein, E.A., Trogdon, J.G., Cohen, J.W., and Dietz, W. (July 2009). “Annual Medical Spending Attributable
to Obesity: Payer- and Service-Specific Estimates.” Health Affairs 28(5) w822-w831.
61
Combs, S. (Mar. 2007). Counting Costs and Calories. Texas Comptroller of Public Accounts, retrieved from
http://www.window.state.tx.us/specialrpt/obesitycost/96-1245costscalories.pdf.
62
Sepulveda, M.J., Tait, F., Zimmerman, E. and Edington, D. (2010). “Impact of Childhood Obesity on Employers.”
Health Affairs 29(3) 513-521.
63
Bogden, J.F. (2000). “Fit, Healthy, and Ready to Learn: Part 1: Physical Activity, Healthy Eating, and TobaccoUse Prevention.” Centers for Disease Prevention and Control, retrieved from
http://www.cdc.gov/HealthyYouth/physicalactivity/pdf/roleofschools_obesity.pdf.
64
Geier, A.B. et al. (Aug. 2007). “The Relationship Between Relative Weight and School Attendance Among
Elementary Schoolchildren.” Obesity 15(8) 2157-2161.
65
Datar, A., Sturm, R., and Magnabosco, J.L. (Jan. 2004). “Childhood Overweight and Academic Performance:
National Study of Kindergartners and First-Graders.” Obesity Research 12(1) 58-68.; Crosnoe, R. and Muller, C.
(Dec. 2004). “Body Mass Index, Academic Achievement, and School Context: Examining the Educational
Experiences of Adolescents at Risk of Obesity.” Journal of Health and Social Behavior 45(4) 393-407.
66
Slate, J., Clark, D., and Viglietti, G.C. (2008) “Obesity Among Middle School Children: More cause for school
leaders’ concern?” National Council for Professors of Educational Administration, retrieved from
http://cnx.org/content/m17414/1.2/.
67
Clark, D., Slate, J.R. and Viglietti, G.C. (2009). “Children’s Weight and Academic Performance in Elementary
School: Cause for Concern?” Analyses of Social Issues and Public Policy 9(1) 185-204.
68
Crosnoe, R. and Muller, C. (Dec. 2004). “Body Mass Index, Academic Achievement, and School Context:
Examining the Educational Experiences of Adolescents at Risk of Obesity.” Journal of Health and Social Behavior
45(4) 393-407.
69
Koplan, J.P, Liverman, C.T, and Kraak, V.I. (Eds.) (2005). Preventing Childhood Obesity: Health in The Balance.
Institute of Medicine, The National Academies Press, p. 67.
70
Crosnoe, R. and Muller, C. (Dec. 2004). “Body Mass Index, Academic Achievement, and School Context:
Examining the Educational Experiences of Adolescents at Risk of Obesity.” Journal of Health and Social Behavior
45(4) 393-407.
47
71
Crosnoe, R. and Muller, C. (Dec. 2004). “Body Mass Index, Academic Achievement, and School Context:
Examining the Educational Experiences of Adolescents at Risk of Obesity.” Journal of Health and Social Behavior
45(4) 393-407.
72
Hunt Institute (Dec. 2008). Childhood Obesity and Academic Outcomes: A Brief Review of Research. James B.
Hunt Jr. Institute for Educational Leadership and Policy, Univ. of North Carolina at Chapel Hill, retrieved from
http://www.hunt-institute.org/elements/media/files/Hunt_Obesity_Memo.pdf.
73
Dor, A. et al (Sep. 2010). A Heavy Burden: The Individual Costs of Being Overweight and Obese in the United
States. The George Washington University, retrieved from
http://www.gwumc.edu/sphhs/departments/healthpolicy/pdf/HeavyBurdenReport.pdf.
74
Dor, A. et al (Sep. 2010). A Heavy Burden: The Individual Costs of Being Overweight and Obese in the United
States. The George Washington University, retrieved from
http://www.gwumc.edu/sphhs/departments/healthpolicy/pdf/HeavyBurdenReport.pdf.
75
Thomson Medstat (2006). Childhood Obesity: Costs, Treatment Patterns, Disparities in Care, and Prevalent
Medical Conditions. Retrieved from http://www.medstat.com/pdfs/childhood_obesity.pdf.
76
Nyberg, K., Burns, A.C. and Parker, L. (2009). “Childhood Obesity Prevention in Texas: Workshop Summary.”
Food and Nutrition Board, Institute of Medicine and the National Academies of Science.
77
DSHS (May 2010). Texas Overweight and Obesity Statistics [data from SPAN III 2004-2005]. Texas Department
of State Health Services, retrieved from http://www.dshs.state.tx.us/obesity/pdf/DataFacts.pdf.
78
Maziak, W., Ward, K.D., and Stockton, M.B. (2007). “Childhood Obesity: are we missing the big picture?”
Obesity Reviews (9) 25-42.
79
Edwards, K.A. et al. (2008). “Texas Pediatric Society Obesity Toolkit.” Texas Pediatric Society, retrieved from
https://www.txpeds.org/texas-pediatric-society-obesity-toolkit.; AAP (no date given). “Prevention and Treatment of
Childhood Overweight and Obesity: Clinical Resources.” American Academy of Pediatrics, retrieved from
http://www.aap.org/obesity/clinical_resources.html.
80
Barlow, S.E. and the Expert Committee (Dec. 2007). “Expert Committee Recommendations Regarding the
Prevention, Assessment, and Treatment of Child and Adolescent Overweight and Obesity: Summary Report.”
Pediatrics (120) S164-S192.
81
Barlow, S.E. and the Expert Committee (Dec. 2007). “Expert Committee Recommendations Regarding the
Prevention, Assessment, and Treatment of Child and Adolescent Overweight and Obesity: Summary Report.”
Pediatrics (120) S164-S192.
82
Cook, S. et al. (2009). “Medical Costs of Implementing Childhood Obesity Expert Recommendations” (Abstract
only). Circulation (120).
83
HHSC (Nov. 2010). Medicaid Childhood Obesity Prevention Pilot: Report to the Texas Legislature. Texas Health
and Human Services Commission, retrieved from
http://www.hhsc.state.tx.us/reports/MedicaidChildObesityPreventionPilotReport.pdf
84
HHSC (Nov. 2010). Medicaid Childhood Obesity Prevention Pilot: Report to the Texas Legislature. Texas Health
and Human Services Commission, retrieved from
http://www.hhsc.state.tx.us/reports/MedicaidChildObesityPreventionPilotReport.pdf
85
Dell Children’s Medical Center (2010). “ACES (Activating Children Empowering Success) Clinic.” Seton
Healthcare Network, retrieved from
http://www.dellchildrens.net/services_and_programs/texas_center_for_the_prevention_and_treatment_of_childhood
_obesity/_aces_activating_children_empowering_success_clinic/.
48
86
Barlow, S.E. and the Expert Committee (Dec. 2007). “Expert Committee Recommendations Regarding the
Prevention, Assessment, and Treatment of Child and Adolescent Overweight and Obesity: Summary Report.”
Pediatrics (120) S164-S192.
87
Flynn, M.A.T. et al. (Feb. 2006). “Reducing obesity and related chronic disease risk in children and youth: a
synthesis of evidence with �best practice’ recommendations.” Obesity Reviews 7(S1) 7-66.
88
Rankinen, T. et al. (2006). “The Human Obesity Gene Map: The 2005 Update.” Obesity (14) 529-644.
89
Flynn, M.A.T. et al. (Feb. 2006). “Reducing obesity and related chronic disease risk in children and youth: a
synthesis of evidence with �best practice’ recommendations.” Obesity Reviews 7(S1) 7-66.
90
Popkin, B.M. and Nielsen, S.J. (Nov. 2003). “The Sweetening of the World’s Diet.” Obesity Research 11(11)
1325-1332.; French, S.A., Story, M. and Jeffery, R.W. (2001). “Environmental Influences on Eating and Physical
Activity.” Annual Review of Public Health (22) 309-335.
91
Brown, H.S. et al. (May 2008). “Crime rates and sedentary behavior among 4th grade Texas school children.”
International Journal of Behavioral Nutrition and Physical Activity (5) 28.
92
Wang, Y.C. et al. (Dec. 2006). “Estimating the Energy Gap Among US Children: A Counterfactual Approach.”
Pediatrics 118(6) e1721-e1733.
93
TDA (no date given). TDA Food and Nutrition Program Statistics Summary. Texas Department of Agriculture,
retrieved from http://www.squaremeals.org/vgn/tda/files/2348/36541_FND%20summary%20updated.pdf.
94
4 Texas Administrative Code, Section 26.8 “Healthy Nutrition Environment.”
95
TDA (2010). “Authority for Districts to Establish Local Policy.” Texas Department of Agriculture, retrieved from
http://www.squaremeals.org/fn/render/channel/items/0,1249,2348_2351_0_0,00.html.
96
TDA (2010). “Authority for Districts to Establish Local Policy.” Texas Department of Agriculture, retrieved from
http://www.squaremeals.org/fn/render/channel/items/0,1249,2348_2351_0_0,00.html.
97
Cullen, K.W., and Watson, K.B. (Apr. 2009). “The Impact of the Texas Public School Nutrition Policy on Student
Food Selection and Sales in Texas.” American Journal of Public Health 99(4) 706-712.
98
Hanagriff, R.D. and Murphy, T.H. (Dec. 2007). 2006-2007 School Year Assessment of the Texas Public School
Nutrition Policy. Prepared for the Texas Department of Agriculture, Food and Nutrition Division, retrieved from
http://www.squaremeals.org/vgn/tda/files/2348/20013_Square_Meals_Menu_Analysis_2007_Report_FINAL.pdf
99
Hanagriff, R.D. and Murphy, T.H. (Dec. 2007). 2006-2007 School Year Assessment of the Texas Public School
Nutrition Policy. Prepared for the Texas Department of Agriculture, Food and Nutrition Division, retrieved from
http://www.squaremeals.org/vgn/tda/files/2348/20013_Square_Meals_Menu_Analysis_2007_Report_FINAL.pdf
100
Cullen, K.W., Watson, K., and Zakeri, I. (Jan. 2008). “Improvements in Middle School Student Dietary Intake
After Implementation of the Texas Public School Nutrition Policy.” American Journal of Public Health 98(1) 111117
101
Mendoza, J.A., Cullen, K.W., and Watson, K. (Mar. 2010). “Change in Dietary Energy Density after
Implementation of the Texas Public School Nutrition Policy.” Journal of the American Dietetic Association 110(3)
434-440.
102
DSHS (Sep. 2009). “WIC Eligibility.” Texas Department of State Health Services, retrieved from
http://www.dshs.state.tx.us/wichd/gi/eligible.shtm .
103
DSHS (Mar. 2010). “The New WIC Food Packages.” Texas Department of State Health Services, retrieved from
http://www.dshs.state.tx.us/wichd/approved_foods/ap_home.shtm.
49
104
Institute for Obesity Research and Program Evaluation (2010). “Texas Childhood Obesity Prevention Policy
Evaluation (T-COPPE).” Texas A&M University, retrieved from http://orin.tamu.edu/research/t_coppe/index.php.
105
Institute for Obesity Research and Program Evaluation (2010). “Texas Childhood Obesity Prevention Policy
Evaluation (T-COPPE).” Texas A&M University, retrieved from http://orin.tamu.edu/research/t_coppe/index.php.
106
WIC (no date given). Texas WIC High Risk Counseling protocol. Texas Department of State Health Services,
retrieved from http://www.dshs.state.tx.us/wichd/nut/pdf/protocol_obesity.pdf .
107
TDA (Sep. 3, 2010). “Request for Applications, Nutrition Education Grants.” Texas Department of Agriculture,
retrieved from http://www.agr.state.tx.us/agr/program_render/0,1987,1848_37007_0_0,00.html?channel=37007.
108
TDA (Aug. 16, 2010). “Press Release: Texas Department of Agriculture Awards $414,000 to School,
Community Organizations to Combat Childhood Obesity.” Texas Department of Agriculture, retrieved from
http://www.texasagriculture.gov/agr/media/media_render/0,1460,1848_17053_40082_0,00.html
109
Nielson S.J., Siega-Riz A.M., and Popkin, B.M. (2002). “Trends in food locations and sources among
adolescents and young adults.” Preventive Medicine (35) 107-113.
110
St-Onge, M.P., Keller, K.L., and Heymsfield, SB (Dec. 2003). “Changes in childhood food consumption
patterns: a cause for concern in light of increasing body weights.” American Journal of Clinical Nutrition 78(6)
1068-1073.
111
Cullen, K.W., Watson, K., and Zakeri, I. (Jan. 2008). “Improvements in Middle School Student Dietary Intake
After Implementation of the Texas Public School Nutrition Policy.” American Journal of Public Health 98(1) 111117.
112
Von Hippel, P.T. et al. (Apr. 2007). “The Effect of School on Overweight in Childhood: Gain in Body Mass
Index During the School Year and During Summer Vacation.” American Journal of Public Health 97(4) 696-702.
113
Ver Ploeg, M. et al. (Jun. 2009 ). Chapter 4: Food Access and Its Relationship to Diet and Health Outcomes. In
“Access to Affordable and Nutritious Food: Measuring and Understanding Food Deserts and Their Consequences,”
Economic Research Service, U.S. Dept. of Agriculture, retrieved from
http://www.ers.usda.gov/Publications/AP/AP036/.
114
Partnership for a Healthy Texas (2010). 2011 Legislative Agenda White Paper: 2011 Agenda for a Fit and
Healthy Texas. [Unpublished data from The Food Trust]. Retrieved from
http://www.partnershipforahealthytexas.org/pdf/PHT_2011_agenda.pdf.
115
Treuhaft, S. and Karpyn, A. (Mar. 2010). The Grocery Gap: Who has Access to Healthy Food and Why it
Matters. The Food Trust and Policy Link, retrieved from
http://www.thefoodtrust.org/catalog/download.php?product_id=171.
116
Suehs, T. (Dec. 2010). “Eligibility Update to the HHSC Council” [presentation]. Texas Health and Human
Services Commission, retrieved from http://www.hhsc.state.tx.us/news/meetings/past/2011/council/120810-4a.pdf.
117
Wang, Y.C. et al. (Jun. 2008). “Increasing Caloric Contribution from Sugar-Sweetened Beverages and 100%
Fruit Juices Among US Children and Adolescents, 1988-2004.” Pediatrics 121(6) e1604-e1614.
118
Sturm, R. et al. (Mar. 2010). “Soda Taxes, Soft Drink Consumption, and Children’s Body Mass Index.” Health
Affairs 29(5) 1052-1058.
119
Wang, Y.C. et al. (Jun. 2008). “Increasing Caloric Contribution from Sugar-Sweetened Beverages and 100%
Fruit Juices Among US Children and Adolescents, 1988-2004.” Pediatrics 121(6) e1604-e1614.
120
Brownell, K.D. et al. (Oct. 2009). “The Public Health and Economic Benefits of Taxing Sugar-Sweetened
Beverages.” The New England Journal of Medicine 361(16) 1599-1605.
50
121
Leonhardt, D. (May 18, 2010). “The Battle over Taxing Soda.” The New York Times.
122
Ludwig, D.S. et al. (Feb 2001). “Relation between Consumption of Sugar-Sweetened Drinks and Childhood
Obesity: a prospective, observational analysis.” The Lancet (357) 505-508.
123
Pereira, M.A. (2006). “The possible role of sugar-sweetened beverages in obesity etiology: a review of the
evidence.” International Journal of Obesity (30) S28–S36.
124
Popkin, B.M. and Nielsen, S.J. (Nov. 2003). “The Sweetening of the World’s Diet.” Obesity Research 11(11)
1325-1332.
125
WHO and UN, (2003). “Diet, Nutrition, and the Prevention of Chronic Disease.” World Health Organization and
the Food and Agriculture Organization of the United Nations, retrieved from
http://www.who.int/dietphysicalactivity/publications/trs916/en/gsfao_annex.pdf
126
Pereira, M.A. (2006). “The possible role of sugar-sweetened beverages in obesity etiology: a review of the
evidence.” International Journal of Obesity (30) S28–S36.
127
Popkin, B.M. and Nielsen, S.J. (Nov. 2003). “The Sweetening of the World’s Diet.” Obesity Research 11(11)
1325-1332.
128
DSHS (2008). Updates for the Strategic Plan for the Prevention of Obesity in Texas. Texas Department of State
Health Services, retrieved from http://www.dshs.state.tx.us/obesity/pdf/StrategicPlanUpdate.pdf.
129
Brownell, K.D. et al. (Oct. 2009). “The Public Health and Economic Benefits of Taxing Sugar-Sweetened
Beverages.” The New England Journal of Medicine 361(16) 1599-1605.
130
Leonhardt, D. (May 18, 2010). “The Battle over Taxing Soda.” The New York Times .
131
Rudd Center for Food Policy and Obesity (Fall 2009). “Rudd Report: Soft Drink Taxes, a policy brief.” Yale
University, retrieved from
http://www.yaleruddcenter.org/resources/upload/docs/what/reports/RuddReportSoftDrinkTaxFall2009.pdf
132
DSHS (Nov. 2009). “Nutrition, Physical Activity and Obesity Prevention Program.” Texas Department of State
Health Services, retrieved from http://www.dshs.state.tx.us/obesity/NPAOPprogrampage.shtm.
133
Andreyeva, T. et al. (Feb. 2010). “The Impact of Food Prices on Consumption: a systematic review of research
on price elasticity of demand for food.” American Journal of Public Health 100(2) 216-222.
134
ImpactTeen (Feb. 2010). State Snack and Soda Sales Tax Data [Excel file]. Bridging the Gap Program,
University of Chicago, retrieved from http://www.impacteen.org/obesitystatedata.htm.; 34 Texas Administrative
Code, Section 3.293 “Food; Food Products; Meals; Food Service.”
135
Sturm, R. et al. (Mar. 2010). “Soda Taxes, Soft Drink Consumption, and Children’s Body Mass Index.” Health
Affairs 29(5) 1052-1058.
136
Sturm, R. et al. (Mar. 2010). “Soda Taxes, Soft Drink Consumption, and Children’s Body Mass Index.” Health
Affairs 29(5) 1052-1058.
137
Block, J.P. et al. (Aug. 2010). “Point-of-Purchase Price and Education Intervention to Reduce Consumption of
Sugary Soft Drinks.” American Journal of Public Health 100(8) 1427-1433.
138
Chaloupka, F.J. (2010). “Revenue Calculator for Soft Drink Taxes.” Rudd Center for Food Policy and Obesity,
Yale University, retrieved from http://www.yaleruddcenter.org/sodatax.aspx.
139
Chaloupka, F.J. (2010). “Revenue Calculator for Soft Drink Taxes.” Rudd Center for Food Policy and Obesity,
Yale University, retrieved from http://www.yaleruddcenter.org/sodatax.aspx.
51
140
Rudd Center for Food Policy and Obesity (Fall 2009). “Rudd Report: Soft Drink Taxes, a policy brief.” Yale
University, retrieved from
http://www.yaleruddcenter.org/resources/upload/docs/what/reports/RuddReportSoftDrinkTaxFall2009.pdf
141
AHA (Mar. 2010). “Drinking sugar-sweetened beverages daily linked to diabetes, cardiovascular disease,
increased healthcare costs.” American Heart Association, retrieved from
http://www.newsroom.heart.org/index.php?s=43&item=976.
142
Brownell, K.D. and Frieden, T. R. (Apr. 2009). “Ounces of Prevention—the Public Policy Case for Taxes on
Sugared Beverages.” The New England Journal of Medicine 360(18) 1805-1808.
143
Chaloupka, F.J. (2010). “Revenue Calculator for Soft Drink Taxes.” Rudd Center for Food Policy and Obesity,
Yale University, retrieved from http://www.yaleruddcenter.org/sodatax.aspx.
144
Brownell, K.D. and Frieden, T. R. (Apr. 2009). “Ounces of Prevention—the Public Policy Case for Taxes on
Sugared Beverages.” The New England Journal of Medicine 360(18) 1805-1808.
145
HHSC (Jan. 2009). Texas Medicaid and CHIP in Perspective, 7th ed. Texas Health and Human Services
Commission, retrieved from http://www.hhsc.state.tx.us/medicaid/reports/PB7/BookFiles/Chapter%204.pdf.
146
Sturm, R. et al. (Mar. 2010). “Soda Taxes, Soft Drink Consumption, and Children’s Body Mass Index.” Health
Affairs 29(5) 1052-1058.
147
Kelder, S.H. et al. (Mar. 2009). “Implementation of Texas Senate Bill 19 to Increase Physical Activity in
Elementary Schools.” Journal of Public Health Policy 30(1) S221-S247.
148
Barroso, C.S. et al. (2009). “Senate Bill 42: Implementation and Impact on Physical Activity in Middle Schools.”
Journal of Adolescent Health (45) S82-S90.
149
Kelder, S.H. et al. (Mar. 2009). “Implementation of Texas Senate Bill 19 to Increase Physical Activity in
Elementary Schools.” Journal of Public Health Policy 30(1) S221-S247.; Barroso, C.S. et al. (2009). “Senate Bill
42: Implementation and Impact on Physical Activity in Middle Schools.” Journal of Adolescent Health (45) S82S90.
150
Kelder, S.H. et al. (Mar. 2009). “Implementation of Texas Senate Bill 19 to Increase Physical Activity in
Elementary Schools.” Journal of Public Health Policy 30(1) S221-S247.; Barroso, C.S. et al. (2009). “Senate Bill
42: Implementation and Impact on Physical Activity in Middle Schools.” Journal of Adolescent Health (45) S82S90.
151
TEA (Mar. 9, 2009). “Press Release: Physically fit students more likely to do well in school, less likely to be
disciplinary problems.” Texas Education Agency, retrieved from
http://www.cooperinstitute.org/ourkidshealth/documents/fitnessresults09.pdf .
152
TEA (2010). State Level Data Comparison. Texas Education Agency, retrieved from
http://www.tea.state.tx.us/index4.aspx?id=3975.
153
TEA (no date given). “Texas Fitness Now FAQs.” Texas Education Agency, retrieved from
http://www.tea.state.tx.us/index2.aspx?id=6784&ekfxmen_noscript=1&ekfxmensel=e105c3e3e_620_62.
154
Kelder, S. (Oct. 2010). Stuck in the Middle: The False Choice Between Health and Education in Texas Middle
Schools. RGK Foundation, retrieved from http://www.rgkfoundation.org/pdf/2010_Kelder.pdf.
155
Kelder, S. (Oct. 2010). Stuck in the Middle: The False Choice Between Health and Education in Texas Middle
Schools. RGK Foundation, retrieved from http://www.rgkfoundation.org/pdf/2010_Kelder.pdf.
156
TEA (no date given). “Texas Fitness Now FAQs.” Texas Education Agency, retrieved from
http://www.tea.state.tx.us/index2.aspx?id=6784&ekfxmen_noscript=1&ekfxmensel=e105c3e3e_620_62.
52
157
Kelder, S. (Oct. 2010). Stuck in the Middle: The False Choice Between Health and Education in Texas Middle
Schools. RGK Foundation, retrieved from http://www.rgkfoundation.org/pdf/2010_Kelder.pdf.
158
TxDOT (2010). “Guidebook.” Safe Routes Texas, Texas Department of Transportation, retrieved from
http://www.saferoutestx.org/guidebook.php.
159
Safe Routes to School National Partnership (2007). “Texas SRTS Program.” Retrieved from
http://www.saferoutespartnership.org/state/statemap/texas .
160
Watson, M. and Dannenberg, J.L. (Jul. 2008). “Investment in Safe Routes to School Projects: Public Health
Benefits for the Larger Community.” Preventing Chronic Disease 5(3) 1-7. ; Davidson, K.K. et al. (Jul. 2008).
“Children’s active commuting to school: current knowledge and future directions.” Preventing Chronic Disease 5(3)
1-11.
161
Davidson, K.K. et al. (Jul. 2008). “Children’s active commuting to school: current knowledge and future
directions.” Preventing Chronic Disease5(3) 1-11.
162
UT School of Public Health and Texas A&M System (Sep. 2010). Update on the Texas Childhood Obesity
Prevention Policy Evaluation (T-COPPE). Texas Obesity Research Update, retrieved from
http://www.sph.uth.tmc.edu/uploadedFiles/Redesign_Website/Research/Research_Centers/Michael_and_Susan_Del
l_Center_for_Advancement_of_Healthy_Living/TCOPPE%20Research%20Brief%20Sept%202010%20Prelim%20
data.pdf .
163
Barroso, C.S. et al. (2009). “Senate Bill 42: Implementation and Impact on Physical Activity in Middle Schools.”
Journal of Adolescent Health (45) S82-S90.
164
Summerbell, C.D. et al. (2005). “Interventions for preventing obesity in children.” Cochrane Database
Systematic Review (3); Harris, K.C. et al. (Mar. 2009). “Effect of School-Based Physical Activity Interventions on
Body Mass Index in Children: A Meta-Analysis.” Canadian Medical Association Journal 180(7) 719-726; Epstein,
L.H. and Goldfield, G.S. (1999). “Physical Activity in the Treatment of Childhood Overweight and Obesity: Current
Evidence and Research Issues.” Medicine & Science in Sports and Exercise 31(11) S553-S559; Kahn, E.B. et al.
(2002). “The Effectiveness of Interventions to Increase Physical Activity: A Systematic Review.” American Journal
of Preventive Medicine 22(4) S73-107.
165
Brown, T. and Summerbell, C. (Jan. 2008). “Systematic review of school-based interventions that focus on
changing dietary intake and physical activity levels to prevent childhood obesity: an update to the obesity guidance
produced by the National Institute for Health and Clinical Excellence.” Obesity Reviews 10(1) 110-141.
166
DHHS (2008). “Physical Activity Guidelines for Americans, Chapter 3: Children and Adolescents.” U.S.
Department of Health and Human Services, retrieved from
http://www.health.gov/paguidelines/guidelines/chapter3.aspx.
167
Harris, K.C. et al. (Mar. 2009). “Effect of School-Based Physical Activity Interventions on Body Mass Index in
Children: A Meta-Analysis.” Canadian Medical Association Journal 180(7) 719-726.
168
Summerbell, C.D. et al. (2005). “Interventions for preventing obesity in children.” Cochrane Database
Systematic Review (3); Harris, K.C. et al. (Mar. 2009). “Effect of School-Based Physical Activity Interventions on
Body Mass Index in Children: A Meta-Analysis.” Canadian Medical Association Journal 180(7) 719-726; Epstein,
L.H. and Goldfield, G.S. (1999). “Physical Activity in the Treatment of Childhood Overweight and Obesity: Current
Evidence and Research Issues.” Medicine & Science in Sports and Exercise 31(11) S553-S559; Kahn, E.B. et al.
(2002). “The Effectiveness of Interventions to Increase Physical Activity: A Systematic Review.” American Journal
of Preventive Medicine 22(4) S73-107.
169
CDC (2010). The Association Between School-Based Physical Activity, Including Physical Education, and
Academic Performance. U.S. Department of Health And Human Services, Centers for Disease Control and
Prevention, retrieved from http://www.cdc.gov/healthyyouth/health_and_academics/pdf/pa-pe_paper.pdf .
53
170
Kahn, E.B. et al. (2002). “The Effectiveness of Interventions to Increase Physical Activity: A Systematic
Review.” American Journal of Preventive Medicine 22(4) S73-107.
171
Combs, S. (Jul. 24, 2007). “Press Release: Comptroller Susan Combs Urges Texas Schools to Participate in
Texas Fitness Now Program.” Texas Comptroller of Public Accounts, retrieved from
http://www.window.state.tx.us/news2007/070724fitness.html.
172
Kelder, S. (Oct. 2010). Stuck in the Middle: The False Choice Between Health and Education in Texas Middle
Schools. RGK Foundation, retrieved from http://www.rgkfoundation.org/pdf/2010_Kelder.pdf.
173
Barroso, C.S. et al. (2009). “Senate Bill 42: Implementation and Impact on Physical Activity in Middle Schools.”
Journal of Adolescent Health (45) S82-S90.
174
Kelder, S. (Oct. 2010). Stuck in the Middle: The False Choice Between Health and Education in Texas Middle
Schools. RGK Foundation, retrieved from http://www.rgkfoundation.org/pdf/2010_Kelder.pdf.
175
TEA (Mar. 9, 2009). “Press Release: Physically fit students more likely to do well in school, less likely to be
disciplinary problems.” Texas Education Agency, retrieved from
http://www.cooperinstitute.org/ourkidshealth/documents/fitnessresults09.pdf .
176
Mellon, E. (Jul. 2, 2010). “Most Texas school kids failing in fitness.” Houston Chronicle, retrieved from
http://www.chron.com/disp/story.mpl/facebook/7089677.html .
177
Kelder, S. (Oct. 2010). Stuck in the Middle: The False Choice Between Health and Education in Texas Middle
Schools. RGK Foundation, retrieved from http://www.rgkfoundation.org/pdf/2010_Kelder.pdf.
178
Barroso, C.S. et al. (2009). “Senate Bill 42: Implementation and Impact on Physical Activity in Middle Schools.”
Journal of Adolescent Health (45) S82-S90.
179
Kelder, S. (Oct. 2010). Stuck in the Middle: The False Choice Between Health and Education in Texas Middle
Schools. RGK Foundation, retrieved from http://www.rgkfoundation.org/pdf/2010_Kelder.pdf.
180
Wang, Y.C. et al. (Dec. 2006). “Estimating the Energy Gap Among US Children: A Counterfactual Approach.”
Pediatrics 118(6) e1721-e1733.
181
Trost, S.G. et al. (2001). “Physical Activity and Determinants of Physical Activity in Obese and Non-Obese
Children.” International Journal of Obesity 25(6) 822-829.; Harris, K.C. et al. (Mar. 2009). “Effect of School-Based
Physical Activity Interventions on Body Mass Index in Children: A Meta-Analysis.” Canadian Medical Association
Journal 180(7) 719-726.
182
Brown, T. and Summerbell, C. (Jan. 2008). “Systematic review of school-based interventions that focus on
changing dietary intake and physical activity levels to prevent childhood obesity: an update to the obesity guidance
produced by the National Institute for Health and Clinical Excellence.” Obesity Reviews 10(1) 110-141.
183
Harris, K.C. et al. (Mar. 2009). “Effect of School-Based Physical Activity Interventions on Body Mass Index in
Children: A Meta-Analysis.” Canadian Medical Association Journal 180(7) 719-726.
184
DSHS (2010). “Bringing Healthy Back Communities.” Texas Department of State Health Services, retrieved
from http://www.dshs.state.tx.us/obesity/BHB2010.shtm.; Texas Senate Committee on Health and Human Services
(2010). Interim Report to the 82nd Legislature. The Senate of Texas, retrieved from
http://www.senate.state.tx.us/75r/senate/commit/c610/c610.InterimReport81.pdf.
185
19 Texas Administrative Code, Section 102.1031; DSHS (2008). Coordinated School Health Program: A Guide
for Texas Districts. Texas Department of State Health Services, retrieved from
http://www.dshs.state.tx.us/schoolhealth/pdf/CSHguide.pdf.
54
186
CATCH (Sept. 2010). Catch National Fact Sheet. University of Texas School of Public Health, retrieved from
http://www.sph.uth.tmc.edu/catch/PDF_Files/CATCH%20National%20Fact%20Sheet-9-29-2010.pdf.
187
Brown, S.H. et al. (Oct. 2007). “The cost-effectiveness of a school-based overweight program.” International
Journal of Behavioral Nutrition and Physical Activity 4(47).
188
Dauenhauer, B. (May 2005). A Review of Texas Education Agency Approved Coordinated School Health
Programs. American Cancer Society, retrieved from
http://www.tahperd.org/HOME_PDFs/Summary_Approved_CSHProg.pdf .
189
Kelder, S.H. et al. (Mar. 2009). “Implementation of Texas Senate Bill 19 to Increase Physical Activity in
Elementary Schools.” Journal of Public Health Policy 30(1) S221-S247.
190
Kelder, S.H. et al. (Mar. 2009). “Implementation of Texas Senate Bill 19 to Increase Physical Activity in
Elementary Schools.” Journal of Public Health Policy 30(1) S221-S247.
191
Trenta, L. (2007). Presentation: Coordinated School Health Programs in Southeast Texas School Districts. Kelsey
Research Foundation, retrieved from
http://apha.confex.com/recording/apha/135am/pdf/free/4db77adf5df9fff0d3caf5cafe28f496/paper148853_0.pdf
192
Economos, C.D. et al. (May 2007). “A Community Intervention Reduces BMI z-score in Children: Shape Up
Somerville First Year Results.” Obesity 15(5) 1325-1336.
193
Sanigorski, A.M. et al. (Jun. 2008). “Reducing unhealthy weight gain in children through community capacitybuilding: results of a quasi-experimental intervention program, Be Active Eat Well.” International Journal of
Obesity (32) 1060-1067.
194
UT Health (Aug. 21, 2010). “News: El Paso County serves as a model for obesity prevention.” University of
Texas School of Public Health, retrieved from http://www.sph.uth.tmc.edu/newsDetail.aspx?id=13860.; Coleman,
K.H. et al. (Mar. 2005). “Prevention of the Epidemic Increase in Child Risk of Overweight in Low-Income Schools:
The El Paso Coordinated Approach to Child Health.” Archives of Pediatric and Adolescent Medicine 159(3) 217224.
195
Coleman, K.H. et al. (Mar. 2005). “Prevention of the Epidemic Increase in Child Risk of Overweight in LowIncome Schools: The El Paso Coordinated Approach to Child Health.” Archives of Pediatric and Adolescent
Medicine 159(3) 217-224.
196
Hoelscher, D.M. et al. (Jul. 2010). “Changes in the Regional Prevalence of Child Obesity in 4th, 8th, and 11th
Grade Students in Texas From 2000–2002 to 2004–2005.” Obesity 18(7) 1360-1368.
197
Hoelscher, D.M. et al. (Feb. 2010). “Reductions in Child Obesity Among Disadvantaged School Children With
Community Involvement: The Travis County CATCH Trial.” Obesity 8(S1) S36-S44.
198
Hoelscher, D.M. et al. (Feb. 2010). “Reductions in Child Obesity Among Disadvantaged School Children With
Community Involvement: The Travis County CATCH Trial.” Obesity 8(S1) S36-S44.
199
Dennison, B.A. and Faith, M.S. (2009). “Prevention of Childhood Obesity in Child Care Settings.” In Jelalian, E.
and Steele, R.G. (Eds.). Handbook of Child and Adolescent Obesity (e-Book).
200
Dennison, B.A. and Faith, M.S. (2009). “Prevention of Childhood Obesity in Child Care Settings.” In Jelalian, E.
and Steele, R.G. (Eds.). Handbook of Child and Adolescent Obesity (e-Book).
201
SPARK (2009). “Early Childhood.” School Specialty, retrieved from http://www.sparkpe.org/early-childhood/. ;
CATCH (no date given). “CATCH Early Childhood.” University of California, retrieved from
http://catchinfo.org/pdf/cec%20flier.pdf.
55
202
UT Health (Aug. 21, 2010). “Press Release: El Paso County serves as a model for obesity prevention.” University
of Texas School of Public Health, retrieved from http://www.sph.uth.tmc.edu/newsDetail.aspx?id=13860.
56
© Copyright 2026 Paperzz