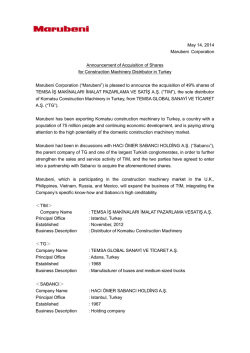
tepav The Economic Policy Research Foundation of Turkey Product space: A tool to identify where to look, not what to do Examples & Applications from TEPAV Projects Istanbul, 28 January 2014 Agenda A new tool to analyze why some countries are rich and others are poor What does product space tell about the evolution of Turkey’s productive structure? Three examples from TEPAV’s project portfolio that we utilized product space methodology The hidden structure in the comparative advantage of nations The hidden structure in the comparative advantage of nations What does this pattern mean? Some countries make few things, while others make many things Some products are made by many countries, other products are made by few countries Countries that make few products, make products made by many countries Countries that make many products, also make products made by few other countries The world does not specialize Countries Products Diversification Ubiquity Degree (Countries) Degree (Products) kc M cp p kc1=3 kc2=4 k p M cp c Product p1 kp1=2 Product p2 kp2=2 Country C1 Country C2 Product p3 kc3=1 kp3=1 Country C3 Product p4 Hidalgo CA, Hausmann R Proc. Natl. Acad Sci. (2009) 106(26):10570-10575 kp4=3 Countries Products Countries Capabilities Products Intuition Countries differ in the diversity of their capabilities and products require different sets of capabilities Countries that have more capabilities will be able to make more products They would be more diversified Products that require more capabilities will be made by fewer countries Products will be less ubiquitous Intuition (cont’d) Countries that have more capabilities will be able to make products that require more capabilities i.e. products that are less ubiquitous Hence, countries that have more capabilities will be more diversified and will make less ubiquitous products Diversification of countries and ubiquity of products are negatively correlated They are indirect measures of the capability set of countries Diversification and ubiquity - 2009 Economic complexity explains income per capita Deviations explain future growth Complexity in 1985, controlling for initial GDP per capita Hidalgo CA, Hausmann R Proc. Natl. Acad Sci. (2009) 106(26):10570-10575 Let us look inside Turkey (Cities) Sorted by Diversification 10 20 30 40 50 60 70 80 200 Source: data from TOBB 400 600 800 1000 1200 1400 1600 1800 2000 (Products) Sorted Products: sortedbybyUbiquity ubiquity Diversity vs. ubiquity 60 ARDAHAN TUNCELİ 50 Diversity and average ubiquity of Turkey's cities BİNGÖL IĞDIR HAKKARİ BAYBURT AĞRI 40 GÜMÜŞHANE MUŞ SİİRT BİTLİS ERZİNCAN 20 30 RİZE NİĞDE SİNOP KARS ŞIRNAK ARTVİN BARTIN BATMAN ADIYAMAN KASTAMONU ERZURUM VAN KARABÜK AKSARAY KIRŞEHİR OSMANİYE AMASYA GİRESUN KİLİS KARAMAN DİYARBAKIR ELAZIĞ ŞANLIURFA MARDİN NEVŞEHİR SİVAS TOKAT BURDUR ORDU DÜZCE YOZGAT ÇANAKKALE MUĞLA MALATYA ZONGULDAK ÇANKIRI ISPARTA EDİRNE BOLU KAHRAMANMARAŞ AFYON KIRIKKALE UŞAK TRABZON KÜTAHYA HATAY YALOVA KIRKLARELİ AYDIN ÇORUM ANTALYA DENİZLİ SAMSUN İÇEL BİLECİK SAKARYA BALIKESİR ESKİŞEHİR KAYSERİ MANİSA GAZİANTEP ADANA TEKİRDAĞ KONYA BURSA KOCAELİ ANKARAİZMİR 10 İSTANBUL 0 500 Source: Turkstat, Tepav Calculations 1000 k0 (diversification) 1500 Diversity explains GDP per capita differences within Turkey 8.5 KOCAELİ 8 BOLU 6.5 7 7.5 YALOVA İSTANBUL KIRKLARELİ İZMİR MUĞLA ANKARA ZONGULDAK EDİRNE BİLECİK ÇANAKKALE BURSA KIRIKKALE TEKİRDAĞ ESKİŞEHİR İÇEL MANİSA ADANA NEVŞEHİR SAKARYA ANTALYA ARTVİN BALIKESİR KARAMAN AYDIN DENİZLİ BURDUR NİĞDE RİZEKASTAMONUHATAY KİLİS SAMSUN ÇORUM KAYSERİ KONYA KARABÜKELAZIĞ KÜTAHYA ISPARTA GAZİANTEP AMASYA UŞAK TUNCELİ KAHRAMANMARAŞ KIRŞEHİRMALATYA TRABZON SİNOP GİRESUN TOKAT SİVAS AFYON DİYARBAKIR DÜZCE ÇANKIRI OSMANİYE ERZİNCAN BATMAN GÜMÜŞHANE ERZURUM AKSARAY SİİRT ORDU BARTIN BAYBURT ŞANLIURFA ADIYAMAN YOZGAT IĞDIR HAKKARİ KARS MARDİN VAN BİNGÖL ARDAHAN BİTLİS ŞIRNAKAĞRI MUŞ 6 Income per capita (logs) ln(gdppp) (2000) Diversity vs GDP per capita 2 4 6 Diversification (ln(k0)) Fitted values lngelir Diversification Source: Turkstat, Tepav Calculations 8 What makes growth difficult? The chicken and egg problem You cannot make new products because you lack the capabilities You don’t want to accumulate the capabilities because the products that need them are not being made Because of other missing capabilities How does the world deal with this? By moving towards “nearby” products Four elements of strategy How near is the product? How easy would it be to become good at it? How large is the global market in the product? How big is the potential gain? How sophisticated is the product? How big is the wage advantage with competitors? How profitable would it be if one succeeds to make it? How strategic is the product? How will it improve my position in the product space, putting me closer to other products? What is in the nearby forest? prody 16000 18000 14000 the is20000 How sophisticated 22000 product? Industrial, laboratory furnaces, ovens, incinerators Taps, cocks, valves for pipes, tanks, boilers, etc Medicaments, therapeutic, prophylactic use, n dosage Lifting, handling, loading Parts for machinery nes. use with lifting, moving machinery Plastic plate, sheet, film, foil, strip, cellular, ne 14000 16000 18000 mhopen_forestmin 20000 How strategic is the product? Bubbles are proportional to world trade in that product! Which industries in which Turkish cities are the most likely to emerge? Konya: Aluminum radiator 1 Kayseri: Food processing machinery Mus: PVC joinery 0.9 10 0.8 Cities (sorted by diversification) Adana: Lift components’ parts 20 0.7 30 0.6 40 0.5 50 0.4 0.3 60 0.2 70 0.1 Ardahan: Ready-mixed concrete 80 500 1000 1500 Products (sorted by ubiquity) 2000 Recap and the way forward… Turkey has a great position in the “Product Space” and has moved quickly in it It has very large internal differences across its many cities Diversification is the road forward at the national and city level This requires addressing the “chicken and egg problems” The quality of public-private collaboration in identifying opportunities and obstacles is the true foundation of sustainable competitiveness Four examples from TEPAV’s work on competitiveness 1. Identification of low hanging fruits for Turkey’s cities (with Ministry of Economy) 2. Diversification strategy design for Zafer Region (with Zafer Dev. Agency) 3. Increasing the competitiveness of Turkish machinery industry (with Ministry of Economy) 4. Tool kit for informing regional competitiveness agenda (with UNDP & GAP Regional Agency) What new industries could emerge in Turkey’s cities? We sought answers to this question for the Ministry of Economy The project was an application of product space methodology with one major modification World Turkey, Countries Turkey’s cities Productive structures of each city were put onto the product space and low hanging fruits for each city were estimated Three cities that have different levels of development on product space Ankara Denizli Diyarbakır Parts and accesories of weapons Bed, table, kitchen linens Grapes, fresh or dried Applications of Product Space Methodology in Turkish Economic Policy Making The project attracted high amount of media coverage and criticisms What were the major shortcomings of the project? City level export data is problematic Data is collected from customs and doesn’t indicate the productive structure of cities Product space is created using country level export data and embedded capabilities are relevant for countries not for cities The results were communicated with the press as if the Ministry has the magical formula for regional development Industrial policy strategy design for Zafer Region We worked with Zafer Regional Development Agency The purpose of the project was to identify potential industries that could emerge with the existing set of capabilities Informing the local competitiveness agenda Ambition: regional industrial policy strategy We implemented the product space techniques but paid attention not to repeat the mistakes of the previous project Developed new techniques and approaches along the way! Overview of the Zafer region 4 provinces: Manisa, Kütahya, Afyon, Uşak 2.8 million people (Albania), 4% of Turkey’s population USD 5 billion in exports (2012) 24 companies in «Turkey 1000 industrial list» 170 thousand non services employment Main industries Manisa: consumer electronics, home appliances Afyon: marbles Uşak: textile and leather Kütahya: ceramics and porcelain Limited backward and forward linkages Manisa OSB Manisa OSB Kütahya OSB Akhisar OSB Uşak OSB Afyon OSB Product Space of the Zafer Region – 4 cities Manisa Kütahya Afyon Uşak Challenge: A large variation in economic diversity within the region Share of top 10 sector in employment, 2011 Rank in Turkey, 2011 MANİSA %39.5 3 AFYON %53.7 22 KÜTAHYA %55.1 27 UŞAK %66.0 49 Positioning of the 4 Zafer provinces in vis-a-vis rest of Turkey Positioning of all Zafer counties in the policy matrix: ubiquity and open forest Filtering to find the good products method Use of Employment Data, 2011 Filter 1: Locality There should be some local capacity, but no stong presence (LQ < 1) Filter 2: Proximity Jumping should be to the nearby products, with density higher than average Filter 3: Quality Quality should be higher than the region’s average quality Caution: export vs. employment data Export data Advantages: Manufacturing industry is represented by more sectors Global analysis is possible Easy to access. Disadvantages: Provinces do not export everything they produce Registration problem (customs) Methodology: Compares economic structure of each city to that of developed countries Quality sectors are defined as sectors in advanced countries but not in the devleloping ones. Draws a roadmap for provinces to catch up with developed countries Employment data Advantages: A better representation of city’s production structure Lower level of missing data arising from registration problem Covers services sector Disadvantages: Manufacturing industry lacks sectoral representation. Not able to make global analysis Only for registered (formal) employment Methodology: The economic structure of provinces are compare to each other. Quality sectors are defined as sectors in advanced provinces but not in the developing ones. Draws a roadmap for backward provinces to catch up with developed provinces such as İstanbul and Bursa Filtering to find the good products results Localization Filter Proximity Filter Quality Filter Sektör adı Sıradanlık Yakınlık Örme (Trikotaj) ve tığ işi diğer giyim eşyası imalatı 4 %14.1 Örgü ve tığ işi kumaşların imalatı 6 %15.3 Haşere ilaçları ve diğer zirai-kimyasal ürünlerin imalatı 7 %13.8 Oluklu kağıt ve oluklu mukavva imalatı ile kağıt ve mukavvadan yapılan ambalaj kutuları imalatı 10 %12.8 Diğer baskı ve hakkaklık işleri (tabaklar ve diğer eşya üzerine baskı. hakkaklık ve işleme yapılması gibi) 10 %13.6 Doğal ve sentetik pamuk elyafının hazırlanması ve eğrilmesi 10 %17.5 Dokuma olmayan kumaşlar ile dokuma olmayan kumaştan yapılan ürünlerin imalatı. giyim eşyası hariç 11 %14.3 Plastik torba. çanta. poşet. çuval. kutu. damacana. şişe. makara vb. paketleme malzemelerinin imalatı 12 %13.4 Kağıt ve mukavva imalatı 12 %14.9 Halat. ip. sicim ve ağ imalatı 12 %17.9 Başka yerde sınıflandırılmamış diğer özel amaçlı makinelerin imalatı 13 %12.6 Diğer kauçuk ürünleri imalatı Metallerin dövülmesi. preslenmesi. baskılanması ve yuvarlanması, toz metalürjisi 13 %13.0 13 %13.7 Ağaç mantarı ürünleri imalatı, saz. saman ve benzeri malzemelerden örülerek yapılan ürünlerin imalatı 13 %14.4 Giyim eşyası dışındaki tamamlanmış tekstil ürünlerinin imalatı 13 %16.1 Ana demir ve çelik ürünleri ile demir alaşımları imalatı 14 %12.8 Sabun ve deterjan. temizlik ve parlatıcı maddeleri imalatı 14 %12.8 Nişasta ve nişastalı ürünlerin imalatı 14 %13.2 Metalden diğer tank. rezervuar ve büyük muhafaza kapları (kapasitesi >,=300 litre) imalatı 15 %13.1 Düz cam imalatı 16 %13.3 Motosiklet imalatı 16 %14.4 Hafif metalden paketleme malzemeleri imalatı 16 %16.0 Source: Turkstat Tepav Calculations Main findings from the Zafer Region Study New / potential products identified at the province and county level e.g. Kütahya province – accumulator and battery production (?) Caveat: Need deeper value chain analyses to see whether this is really feasible Framework conditions & capabilities Investment Climate Assessment Survey conducted at the region level World Bank’s methodology, but modified to the region’s context and our study’s objectives Key issues: high costs, access to finance, new product development, human resources Results from the Zafer Region’s Study – Investment climate assessment Tüm Firmalar Mikro Firmalar Maliyet Düşürme Yatırım İçin Ek Finans Yeni Ürün Geliştirme Nitelikli Uzman Personel İç Pazarda Büyüme Kalitenin İyileştirilmesi İlave İşletme Sermayesi Teknoloji İyileştirme Çalışanların İşbaşı Eğitimi Markalaşma Otomasyon Yurtiçi Ortaklık Dış Pazara Açılma Yurtdışı Ortaklık Yönetici Eğitimi İşletmenin Yeniden Yapılanması Elektronik Ticarete Geçiş Yeni Bir Alana Girme 0 5 10 15 20 25 Main recommendations – inputs for the local competitiveness agenda Value Chain Analysis Series (to complement product space) Export accelerator program (pilot countries, matchmaking & networking) Mobility grant program (to attract retired CEOs from Istanbul) Industrial technology centers (for key products) A program to activate local universities to focus on solutions to local problems Celebrating local successes on innovation Internationalization program for SMEs (training on foreign languages) Training for SMEs to benefit more from national grant programs on R&D Increasing the competitiveness of Turkish machinery industry A project that we do for TOBB with the support of the Ministry of Economy Local chambers are also involved (Institute of Collaborations) Approximately 200 machinery producers from 13 different cities We are conducting needs assessments for each and every company What do they need to become more competitive Needs assessment reports of TEPAV will form the basis for Ministries’ cluster specific supports Regional Industrial Policy Study Globally machinery sector is at the heart of the product space Using Feenstra et al. Trade Data: 132 Countries 1006 Products SITC-4 (1975-2000) CA Hidalgo, B Klinger, A-L Barabasi, R Hausmann Science (2007) Regional Industrial Policy Study Turkey lags behind key actors in the machinery sector Machinery Sector on Product Space for selected countries (2010) The focus sectors were selected from among 91 machinery sub sectors 5 step selection process to determine Machinery sub sectors 0 2 1 3 Importance on global trade Importance on Turkey’s Export Competition Arena (number of sectors) Large margin growing sectors in global trade Large margin growing sectors in Turkey’s trade Sectors where we can gain a competitive advantage 91 0 Source:Tepav Calculations 75 16 71 4 39 32 4 Import Density Access to market Sectors with low barriers to market entry 29 10 10 39 + = 39 sectors survived that filtering process Why is it important to gain competitiveness in these 39 sub-sectors? Source: Comtrade, Tepav Calculations We’re making our hands dirty What do we have in needs assessment reports? External economic environment analysis Sector analysis (global trends) Firm structure and performance analysis Value chain assessment Road map for gov’t supports Consultancy services Education services Overseas marketing activities (fair participation, customer visits etc…) The ultimate goal is to help emulator and innovative SMEs to become fast growing companies
© Copyright 2026 Paperzz