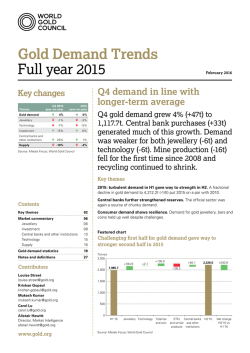
Gold Demand Trends First quarter 2016 Key changes Q1 2016 quarter-onquarter Tonnes Q1 2016 year-on-year Gold demand 21% 16% Jewellery -19% -27% Technology -3% -4% Investment 122% 201% Central banks and other institutions -3% -31% 4% Supply 5% Source: Metals Focus; World Gold Council May 2016 Gold demand’s best ever start to the year Gold demand grew 21% to 1,289.8t – the strongest Q1 on record. Investment drove gains. Jewellery fell sharply on higher prices and market-specific factors. Central bank buying slowed. 40t of hedging lifted mine supply. Key themes (more detail pages 2-5) ETF demand surged: 364 tonnes (t) of inflows more than reversed the cumulative outflows from 2014 and 2015. Investment drove price gains. Investors’ search for security fuelled gold’s Q1 rally, its best performance in almost 30 years. Contents 02 Indian consumers hamstrung. Indian demand was stifled as jewellers went on strike in protest at proposed excise duty. Market commentary 07 Jewellery07 Investment10 Central banks and other institutions 13 Technology14 Supply16 Featured chart Gains in investment demand outweighed declineselsewhere in other sectors Investment growth outweighed declines Key themes Gold demand statistics 19 Notes and definitions 26 Contributors Tonnes 1,400 1,200 400 www.gold.org 1,070.4 +1.7 -115.0 Krishan Gopaul [email protected] Alistair Hewitt Director, Market Intelligence [email protected] +219.4 -2.4 800 600 Carol Lu [email protected] 1,289.8 -2.9 1,000 Louise Street [email protected] Mukesh Kumar [email protected] +338.1 200 0 Q1’15 Jewellery Technology Bar and coin Source: Metals Focus; World Gold Council ETFs and similar Central banks Q1’16 Net change Q1’16 vs Q1’15 Key themes ETF investors rekindle their interest • China’s devaluation of the yuan fuelled fears over the country’s economic health and the potential impact on global growth. • And the pace of US interest rate rises is now widely expected to slow. Inflows into ETFs of 363.7t were the highest since Q1 2009 as sentiment towards gold improved markedly. Shifts in the global economic and financial landscape have created a positive environment for gold investment in recent months. Uncertainty abounds: The swirling uncertainty created by this mix of factors undermined confidence in traditional asset classes. Turbulence hit stock markets around the world. The impact of NIRP in particular significantly reduced the appeal of sovereign bonds as a stable, low-risk asset. Enter goldbacked ETFs. • The Negative Interest Rate Policies (NIRP) implemented by central banks in Japan and Europe represent a shift to ‘unconventional policies’ which create ‘great uncertainty’.1 Table 1: Data highlights for Q1 2016 demand (see full details on pages 19–25) Tonnes US$mn Q1’15 Q1 ’16 5-year Year-onaverage year change Q1’15 Q1’16 5-year Year-onaverage year change 1,070.4 1,289.8 1,114.7 21% 41,932.2 49,040.2 51,128.1 17% 26,558.5 -22% Demand Gold demand Jewellery 596.9 481.9 589.0 -19% 23,383.0 18,322.3 Technology 83.3 80.9 92.4 -3% 3,263.0 3,074.1 4,242.5 -6% Investment 277.9 617.6 292.1 122% 10,885.7 23,482.7 13,918.3 116% Total bar and coin 252.2 253.9 326.2 1% 9,881.1 9,654.6 15,114.8 -2% 25.6 363.7 -34.1 >300% 1,004.6 13,828.1 112.3 109.4 141.2 -3% 4,400.5 4,161.2 6,408.8 -5% ETFs and similar products Central banks and other institutions -1,196.5 >300% Consumer demand in selected markets India 191.7 116.5 227.6 -39% 7,509.4 4,427.8 10,377.6 -41% China 275.4 241.3 247.4 -12% 10,788.0 9,174.6 11,210.3 -15% Middle East 86.9 79.3 79.1 -9% 3,403.5 3,016.4 3,601.0 -11% United States 33.9 40.9 45.4 21% 1,326.4 1,555.5 2,062.2 17% Europe ex CIS 70.9 71.1 82.4 0% 2,778.5 2,703.4 3,793.5 -3% Supply 1,081.0 1,134.9 1,108.8 5% 42,345.5 43,149.5 50,561.9 2% Total mine supply 717.7 774.0 762.9 8% 28,115.8 29,427.0 34,425.1 5% Recycled gold 363.2 360.9 345.9 -1% 14,229.7 13,722.5 16,136.8 -4% 1,218.5 1,182.6 - - Total supply Gold price LBMA Gold Price (US$/oz) - -3% - - Source: Metals Focus; GFMS, Thomson Reuters; ICE Benchmark Administration; World Gold Council 1 http://www.bis.org/publ/qtrpdf/r_qt1603e.htm Gold Demand Trends | First quarter 2016 02 Having seen regular – and at times substantial – outflows over the last three years, ETFs had a stand-out quarter as gold’s investment qualities came back into sharp focus (Chart 1). Inflows reached a seven-year high, close to levels last seen during the Great Recession when the sovereign debt crisis was also in full swing. Gold found favour for its role as an effective risk diversifier, enhanced by its added benefits of liquidity and relatively low volatility. Inflows were reportedly from a broad investor base, from institutional to private. Notably, there is anecdotal evidence that many of these inflows are from investors initiating or rebuilding strategic, long-term holdings after the wash-out of positions since early 2013. While a portion of the inflows were driven by price momentum and likely to be more tactical in nature, latent demand among investors who have been looking for an opportunity to re-enter the market was a key factor. Although largely a Western phenomenon, the appeal of gold ETFs was not limited to these regions. Inflows into gold-backed ETFs in China have risen exponentially in recent months. Although they still only account for a very small proportion of the 1,974t 2 held in these products globally, Chinese gold-backed ETFs on aggregate attracted 11.1t of inflows during the first quarter, more than doubling their holdings in the process. Huaan Yifu Gold ETF surpassed all other funds in Asia: total holdings at quarterend were 13.5t, up 10.3t from the end of 2015. Although institutional investors were reportedly the driving force behind this flood of inflows, retail investors were also a considerable contributor, looking to gold for diversification and wealth protection. Chart 1: Investors responded to uncertain economic environment with near-record ETF inflows • Inflows were global, not restricted to dominant Western markets: volumes of gold held in Chinese products more than doubled during the quarter. • The trend continued into April, particularly in Europe where investors were plagued by lingering ‘Brexit’ fears. Tonnes 600 500 400 300 200 100 0 -100 -200 -300 -400 -500 Q1’09 Inflows Q1’10 Q1’11 Q1’12 Q1’13 Q1’14 Q1’15 Q1’16 Outflows Source: Respective ETP providers; Bloomberg; ICE Benchmark Administration; World Gold Council 2Holdings at end-March 2016, correct as per latest available data. Gold Demand Trends | First quarter 2016 03 Investment demand ignites price rally During the first quarter, the US$ gold price appreciated by 17% on the strength of investor conviction. This was matched by local price gains in markets across the globe. The enthusiasm with which investors renewed their appetite for gold ETFs in Q1 was palpable – the gold price surged by 17% in response to such large-scale inflows. This was the best performance in almost three decades and gold ranked as one of the best performing assets globally during the quarter.3 The effect was also felt in the price of gold measured in other currencies, with double digit gains in the euro (+11%), British pound (+20%), Chinese renminbi (+16%), Indian rupee (+17%) and Turkish lira (+13%) (Chart 2). The investment response in the ETF market was echoed in surging physical demand for bars and coins in a handful of markets. US investors in particular were keen to add to their holdings, wanting the security of gold amid economic uncertainty. Demand jumped by 55% to 18.3t, albeit that this was being compared with a particularly weak Q1 2015. Bar and coin demand in the UK grew by a similar magnitude (+61%) although absolute volumes remained low (3.2t). And, powered by a strong German market, European demand remains resolute – at 58.4t it remains one of the largest markets for gold investment. China also increased its demand for bars and coins, encouraged by Chinese New Year festive purchasing and the rising gold price. Demand grew by 5% to 61.9t. For the most part, however, the sharp price rally suppressed demand for bars and coins in the Middle East and Asia. This was to be expected among these particularly price sensitive markets, where demand typically subsides on a strong price rally before picking up again once the price stabilises. Chief among these markets was India, where investment demand slumped in response to the price rally. Bar and coin demand fell by 31% to 28t, the lowest quarterly investment total for India in seven years. But it was Indian jewellery demand that garnered all the headlines. Chart 2: Gold was a top-performing asset in Q1 • Gold closed the quarter at US$1,237/oz, 17% above the end-2015 price of US$1,060/oz. Double-digit gains were seen in a range of currencies, too. • Sharp price rise had mixed effects on the market: jewellery demand fell, investment grew and recycling in some markets jumped. Index level 140 130 120 110 100 90 80 January 2015 US dollar May 2015 Euro Indian rupee September 2015 Chinese renminbi Turkish lira January 2016 Pound sterling Source: ICE Benchmark Administration; Thomson Reuters Datastream; World Gold Council 3World Gold Council, Market update, Gold outshines the market in Q1 2016, April 2016. Gold Demand Trends | First quarter 2016 04 Industrial action snuffs Indian jewellery demand Jewellers respond to government tax rises with country-wide strikes, forcing Indian consumers to postpone Q1 demand. India’s jewellery market virtually ground to a halt in March as a combination of surging prices and industrial action in protest at government policy made for an extremely challenging quarter. In mid-January, the local gold price breached the key Rs26,000/10g level, reaching Rs28,000/10g by 10 February before surging higher still, getting close to Rs30,000/10g by the end of the quarter. This sent a strong signal to Indian consumers to hold off on buying gold jewellery until prices stabilised. As demand dried up, the local market quickly moved into a discount to the international price. The discount widened sharply, reaching levels close to US$40/oz (Chart 3). Chart 3: Price jump and market disruption push India into steep discount • The discount widened out to almost US$40/oz on challenging market dynamics. • This reflected not only a dearth of consumer demand, but also a drying-up of supply as the market effectively shut down in March. US$/oz 20 10 0 -10 -20 -30 -40 -50 March 2015 June 2015 September 2015 December 2015 March 2016 Source: World Gold Council Gold Demand Trends | First quarter 2016 05 Then, in the government’s budget on 29 February, the Finance Ministry announced plans to impose a 1% excise duty on jewellery manufacturing.4 The response from the jewellery sector was swift and decisive: a nationwide strike was called from 2 March with the support of national industry associations.5 While jewellery stores in the south of India re-opened on 19 March, retailers across vast swathes of the country remained shut for the remainder of the quarter and into April. Given the higher penetration of single store retailers in the North, East and West of India, the impact on sales was more prominent for unorganised players, while branded chain stores were relatively resilient. The widespread media coverage of the strike ensured that customers stayed away, even from those shops that chose not to strike. In its quarterly update to investors, jewellery giant Titan noted that it’s premier brand, Tanishq was “not participating in the strike but many of the stores had to be shut down on many occasions across the country due to agitations by striking jewellery associations. The customer walk-ins in the ensuing period have also been poor due to the customer perception that [the] entire industry is on strike due to which the sales performance for the month of March has been affected adversely.” 6 Taken in this context, demand for gold jewellery was unsurprisingly weak. Quarterly demand of 88.4t was down 41% year-on-year and the lowest quarterly total since Q1 2009. Importantly, though, we believe demand from Q1 is postponed rather than lost. Most stores re-opened in the second half of April, ahead of the Akshaya Tritiya festival in early May and the start of the wedding season. This view is also supported by the sharp narrowing of the local discount as manufacturing activity resumed in April.7 The pro-rural budget and expectations for an above-average monsoon should further support rural incomes, which has positive implications for gold demand over the coming quarters. 4An excise duty of 1% on jewellery manufacturing was proposed in the budget. The introduction of this tax is a prelude to the Goods and Services Tax (GST) Bill. Jewellery manufacturers whose turnover exceeded Rs12 crore during the preceding financial year will be liable to pay this additional tax during current financial year. 5 All India Gems and Jewellery Trade Federation (http://gjf.in/domestic_news.html) and Indian Bullion and Jewellers Association (http://ibja.co/ibja-news.aspx) 6 http://www.titan.co.in/TitanEcom/corporate/pdflinks/Investor%20Update/Q4%20FY%2015-16.pdf 7 The local discount immediately narrowed to US$16/oz as soon as the strike ended on 13 April, shrinking further to US$4/oz by the end of the month. Gold Demand Trends | First quarter 2016 06 Market commentary Jewellery Soaring gold prices, market disruption in India and supply-constraints in China combine to impede gold jewellery demand. Year-on -year change Quarter-on -quarter change Tonnes Q1’15 Q1’16 World total 596.9 481.9 -19% -27% India 150.8 88.4 -41% -51% China 216.3 179.4 -17% -4% Global jewellery demand fell 19% year-on-year to 481.9t, 115t below last year’s 596.9t Q1 total. The vast majority (99.3t) of the decline was generated by just two markets: India and China (Chart 4). These two jewellery powerhouses each faced their own particular set of challenging circumstances in the first quarter. The sharp rise in the price of gold during the first quarter of the year was a deterrent to jewellery demand, particularly in the price-sensitive markets of Asia and the Middle East where consumers prefer to buy when prices are less volatile. But the unfolding predicament in India proved by far the greater obstacle. Strikes thwart India’s jewellery market Q1 2016 saw Indian jewellery demand hit a seven-year low of 88.4t, a 41% year-on-year decline. This is 44% below the five-year quarterly average for India of 156.7t and indicates the extent of the troubles faced by that market during the quarter. The sharp rise in the local gold price through a number of key levels was discouraging in itself. The anticipation of a correction in prices and of a reduction in customs duty on gold kept jewellery demand tepid in February. But the final blow came in the budget released on 29 February. In it the government proposed not only an increase in both custom and excise duties on doré (from 8% to 8.75% and from 9% to 9.5% respectively), but also – crucially – a 1% tax to be levied on jewellery manufacturing. Widespread strikes across the jewellery industry ensued. Consumers were unwilling – and largely unable – to buy jewellery at a time of such uncertainty, a fact that is borne out in the demand numbers. This combination of headwinds faced by the industry resulted in swift, and deep, discounts in the local price. For more detail on Q1 Indian demand, see Key themes. Chart 4: Jewellery demand down 19% to four-year low • India – down 62t – accounted for over half of the 115t decline in global jewellery demand. • China was also a major contributor, falling by 37t from Q1 2015. Tonnes 900 800 700 600 500 400 300 200 100 0 Q1’13 India Q3’13 China Q1’14 Q3’14 Q1’15 Q3’15 Q1’16 Rest of world Source: Metals Focus; GFMS, Thomson Reuters; World Gold Council Gold Demand Trends | First quarter 2016 07 But the outlook for India is more positive: consumers are waiting for their opportunity to re-enter the market. The steep local price discount has already been largely eradicated. The industry expects the pent-up demand that accumulated during Q1 to be released in the coming weeks as the market adjusts to the new tax structure and buying for the wedding season gathers momentum. In 2015, demand in H1 slumped in the face of numerous challenges before staging a strong recovery in the second half; 2016 is likely to play out in a similar way. China: supply-side crunch Demand for gold jewellery in China fell 17% in Q1, to 179.4t. Appetite for gold jewellery was curbed by the sharply rising gold price against a background of continued economic slowdown. Despite receiving a lift in January and early February from the Chinese New Year effect, jewellery demand tailed off sharply in the second half of the quarter. The sector suffered marked losses as China’s relatively anaemic economic performance weighed on consumer sentiment. Q1 GDP growth of 6.7%, while exceptional by Western standards and within the government’s target range of 6.5%-7%, was the lowest Q1 rate since 2009. This took its toll on consumers: official data showed a drop of 3.9% in retail sales of gold and silver jewellery.8 Meanwhile, a supply-side crunch further hampered China’s jewellery market. A new national standard for hallmarking of gold jewellery (the National Gold Standard Mark) came into force on May 4, which requires that all gold jewellery of 99% purity be hallmarked as Chuk Kam.9 During March, retailers nationwide were busy adjusting their inventories in order to replace existing stocks with inventory that complies with the new requirements, in time for the early May deadline. This surge in stock replacement activity led to a temporary supply squeeze that intensified the slump in demand. But jewellers also took the opportunity to refresh their stocks with more interesting, higher-margin product offerings (e.g. 18k, gem-set, 3-D hard gold etc). These may entice consumers, and help support profits in the coming quarters, but may be detrimental to gold volumes, given that they have largely replaced plain 24k pieces. The supply of gold jewellery in China came under further pressure as lines of available capital were constrained. During the quarter, domestic banks tightened the conditions under which they will lend to jewellery manufacturers and retailers. Retailers are gradually streamlining their operations in response to the tougher business climate and reducing overall inventories and order volumes, adding to the supply side-side pressure in the market. Price rise takes toll in smaller Asian markets Consumers across Asia were largely price-responsive in their behaviour: jewellery demand fell in most of the region’s smaller markets. Of these, Malaysia (-23%) and Indonesia (-10%) were the weakest performers. In the former, the decline was again influenced by the introduction of the GST in April 2015 (consumers made their purchases in advance of the April tax increase, boosting the Q1 2015 number). Going forward, this effect should now begin to drop out of year-on-year comparisons. In Indonesia, despite seasonal factors being supportive of demand, the price rally quickly dampened it, while a continued focus on lower carat jewellery weighed on fine gold volumes. Vietnam was, however, an exception to the depressed regional market, with jewellery demand 6% higher than Q1 2015. Although this can be partly explained by the relatively positive economic scenario (GDP growth in Q1 accelerated to 6.7% from 6.5% in 2015), the numbers are in fact more representative of investment demand. In Vietnam, a large portion of jewellery demand is accounted for by ‘chi’ rings. Although they are classified as jewellery, these crude products have very limited added value above the value of the gold they contain, being of very simple design and requiring limited labour input; the motive for buying them is therefore often investmentdriven. As the premium on tael bars remains punitive in Vietnam, domestic consumers are forced to look elsewhere to satisfy their need for an asset that preserves wealth and protects against the ravages of inflation.10 All of the above notwithstanding, de facto jewellery demand was also lifted by the seasonal impact of Vietnamese New Year, as well as the Day of the God of Fortune (10th day of the 1st month of the Lunar Calendar). 8 National Bureau of Statistics of China, http://data.stats.gov.cn/english/easyquery.htm?cn=A01 9‘Pure gold’ jewellery, known as Zu Jin in Putonhua and Chuk Kam in Cantonese is 24 carat jewellery, typically of 99.9% gold content (999 fineness). It is the mainstay of Chinese jewellery fabrication and consumption. Under previous hallmarking system, only 24k gold (of 99.9% purity) could be hallmarked as Chuk Kam. 10State-owned Saigon Jewellery Corporation has the monopoly on the manufacture and sale of government-approved gold bars, of which the supply is limited. Gold Demand Trends | First quarter 2016 08 Iran the only bright spot in a Middle Eastern region beset by difficulties Gold jewellery demand in Iran rallied by 10% year-onyear (to 9.9t vs 9t in Q1 2015) as the market continued to feel the benefit of the lifting of Western sanctions. Nevertheless, this growth was tempered by the impact of 9% VAT. The strength of gold jewellery imports in to the US in January and February was a clear indication of US consumers’ continued desire for gold jewellery. Double digit gains were reported in imports (in fine gold volume terms) in both January and February, reflecting continued restocking among some larger retailers that continue to build up their gold allocation. The remaining Middle Eastern markets uniformly saw double-digit losses in Q1 jewellery demand, beset as they were by a mix of ongoing geo-political issues, low oil prices and weak tourism revenues. And that’s before the gold price rally is added into the mix. Egypt was the worst casualty: demand fell to a fresh low of 7.7t (-18% year-onyear), slipping below the previous low of 7.9t from Q2 2011. The market was crippled by government restrictions on bank withdrawals. These were limited to no more than US$50k at a time – a relatively paltry sum for jewellery retailers and wholesalers. The positive consumer demand trend was echoed in upbeat official sales data, which showed stronger than expected growth in jewellery sales in January. The outlook for the remainder of the year is cautiously optimistic. While prospects for global personal luxury goods are positive – as highlighted by a report by Bain & Co which expects a resurgence in demand for these items over the course of 201611 – the Presidential elections in the second half of the year loom over the market and may increasingly temper consumer enthusiasm as they draw closer. It was a similar story for Turkey in Q1. Demand of 8.5t (-18% year-on-year) was the lowest quarterly total since Q4 2012 as the high gold price, piled on top of the struggling domestic economy, added to consumer woes. Terrorist atrocities further weighed on sentiment. Startling import growth heralds strong quarter for US jewellery demand In the US, demand for gold jewellery gained 2% year-onyear. This is the ninth consecutive quarter of year-on-year gains, impressive for a market where economic growth has remained relatively anaemic. The industry continues to benefit from retailers re-entering the gold segment, having previously slashed – if not completely eradicated – their gold product offerings. European jewellery demand has less than sterling start to the year In Europe, jewellery demand continued in a similar fashion to the last 4-5 years: after a seasonal jump in Q4, demand subsided straight back to levels that are in line with the 13.3t Q1-Q3 average since 2012. Demand for the quarter amounted to 12.7t. The UK eked out a 1% increase in demand, to 4t. Data on the number of articles being hallmarked by the Birmingham Assay Office suggest that interest picked up in the latter half of the quarter, having been quiet in January after the usual Q4 seasonal rally. 11 Bain & Company, Luxury Goods Worldwide Market Study, Fall-Winter 2015. Gold Demand Trends | First quarter 2016 09 Investment First quarter gold investment more than doubled: hefty ETF inflows confirmed the positive shift in sentiment noted last quarter. Bar and coin demand steadied. Year-on -year change Quarter-on -quarter change Tonnes Q1’15 Q1’16 World total 252.2 253.9 1% -7% India 40.9 28.0 -31% -53% China 59.1 61.9 5% 23% Global investment demand shot up to a seven-year high of 617.6t in the first quarter of the year. This was a 122% increase from the 277.9t of investment in Q1 2015 and the second-highest quarterly total on record. It eclipsed Q2 2010’s 606t total – a time when heightened fear over the sovereign debt crisis fuelled a sharp spike in gold demand – and almost matched the record of 626t from Q1 2009 during the depths of the Great Recession. As discussed in Key themes, ETFs were the main engine of this growth. Inflows into the sector surged to 363.7t after a three-year period of almost uninterrupted outflows. While demand on such a scale is unlikely to be sustained, the sector does appear likely to benefit further from the improved outlook towards gold among a broad investor base. Negative interest rates, stock market volatility and concerns over global economic growth all contributed to the upsurge in demand. Demand for physical gold products held firm at 253.9t, a nominal 1% above last year’s 252.2t. At the more granular level, gold coins outperformed (+17%) – supported by strong US demand – while demand for bars contracted slightly (-2%). Weakness in demand for medals/imitation coins was unsurprising given India’s dominance of this category (Chart 5). Chart 5: Global bar and coin demand hugely influenced by events in India • Indian investment slowed sharply as investors waited for prices to stabilise and strikes shut off bar and coin sales by jewellery retailers. • ‘Fear factor’ underpinned Western demand; the hunt for security drove investors towards gold. YoY% change 15 10 5 0 -5 -10 -15 -20 -25 -30 -35 India China US and Europe* Rest of world *Europe comprises France, Germany, United Kingdom, Switzerland, Austria and Other Europe. Source: Metals Focus; World Gold Council Gold Demand Trends | First quarter 2016 10 Indian bar and coin demand beats sharp retreat Retail investment in India fell by a third in Q1. Bar and coin demand dropped to 28t from 40.9t in Q1 2015. Investment in January was broadly flat, tapering off in February before coming to a standstill in March. A number of major commercial banks reported increases in sales of gold investment products, although regional differences were noted with robust demand in the East of the country countered by relatively subdued demand in the South. The sharp price increase was the initial reason for the slowdown in demand for bars and coins (Indian consumers are similarly cautious towards purchasing gold investment products during times of price volatility as they are towards jewellery). Subsequently, the disturbances which followed the government’s budget announcement rippled through the investment market. Although the duty hike and strikes were primarily a jewellery issue, the rural population has limited access to the banking system, which means many consumers buy their gold investment products from the broad network of jewellery stores. And nationwide strikes meant that this channel for purchasing was choked. US Mint coin sales leap as investors seek safety in gold The behaviour of bar and coin investors closely echoed that of investors in the ETF market in Q1. Demand shot up by 55% year-on-year from 11.8t to 18.3t. This was 11% above the five-year quarterly average of 16.4t. Sales of American Eagle coins by the US Mint jumped by 68% year-on-year, to 245,500oz (7.6t), while sales of 24k American Buffalo coins increased 7% to 60,000oz (1.9t). Imports of other Sovereign minted bullion coins rose by almost 60%. During the quarter, the Reserve Bank of India announced it would permit banks to sell the Indian Gold Coin (IGC) – India’s first official gold coin. These coins are minted at the Indian government mint, hallmarked by the Bureau of Indian Standards (BIS) and the scheme is managed by MMTC Ltd. Indian Overseas Bank was the first to begin distribution of the coins in March and recent announcements have confirmed that the coins will also be distributed through India’s post office network. The developing infrastructure for the sale of the IGC should, in future, help to relieve any such supply-side pressure on investment demand. Chinese investors buy into price rally Chinese investors increased their demand for gold bars and coins. Demand expanded by 5% year-on-year to 61.9t. The usual seasonal uplift from Chinese New Year drove demand in the first six weeks of the quarter, aided by the rising price. Chinese investors differ from others in Asia in their investment attitude in that they tend to prefer to buy into a rising trend, rather than waiting until the price stabilises. Demand then waned as currency volatility subsided: the Chinese yuan stabilised and the currency settled into a relatively steady trading band against the US dollar after the People’s Bank of China intervened to stabilise the currency. Gold Demand Trends | First quarter 2016 The noxious atmosphere of uncertainty created by global monetary policies and shifting expectations for US interest rate rises were cause for concern. Investors sought the safety of gold. As the price responded, the move was further fuelled by those keen not to miss out on the investment opportunity. This demand momentum then tailed off in March as gold’s price rally ran out of steam at around US$1,275/oz, before holding in a sideways range around US$1,250/oz, where it remained throughout the remainder of the quarter and into April. Europe again a stalwart of gold investment European investment remained strong. Bar and coin demand was steadfast at 58.4t as the negative interest rate environment, migration crisis and rumbling ‘Brexit’ speculation continued to highlight gold’s investment properties, specifically its role as a secure store of wealth. The fear factor underpinning demand reverberated around regional investment markets: there were anecdotal reports of a rise in demand for safety deposit boxes in Germany as some customers looked for alternative options in case of further interest rate cuts. This appears to be backed up by market research. Initial results of a large-scale consumer research programme indicate that German investors are motivated by a desire for low-risk, ‘straightforward,’ tangible investments and feel a strong need to invest in assets that protect their wealth against economic downturn, government policies and currency fluctuations. 11 Germany accounts for the bulk of the region’s demand and the first quarter was no exception: 31.1t of bar and coin demand equated to 53% of Europe’s total. But the UK was the star performer. Although volumes remain small, demand grew by 61% to 3.2t. That was the highest quarter for UK investment since Q2 2013, when demand totalled 3.7t. Turkish investors focus on profit-taking opportunities The 5% year-on-year decline in Turkish investment demand may, on the face of it, suggest that investment demand was more robust than that for jewellery. But this was largely a function of the comparison being made with a very weak Q1 2015. The rise in the local gold price during the quarter meant that Turkish investors proved to be more interested in opportunities to take profits on their holdings than to add to them, demonstrated by considerable recycling activity. Middle Eastern investors reacted to higher gold prices in a similar way. Investment in Egypt fell by 22% year-onyear. A swift and sharp depreciation in the Egyptian pound versus the dollar caused a surge in recycling, which in turn led to a discount of around 4% in the local price. Gold Demand Trends | First quarter 2016 Asian investors remain on the sidelines as price surges The focus was also on recycling throughout east Asia. Consequently, investment demand saw widespread declines. The largest losses were seen in Malaysia, where demand dropped 40% to 1.5t, the lowest quarter since Q3 2012. The 21% year-on-year fall in Vietnamese investment (to 11.5t) was due to the rising price of – and premiums on – official gold tael bars. Demand instead shifted to quasi-investment jewellery items (packaged ‘chi’ rings of 99.99% purity, which effectively function as lowdenomination investment products). A more positive quarter was seen in Japan, which notched up its third successive quarter of positive net investment demand (3.3t vs -3.2t in Q1 2015). However, as the gold price rallied, demand lost momentum as evidenced by the sharp quarter-on-quarter decline from Q4 2015 (-63%). Japanese investors showed a similar inclination to those in Vietnam, with a preference for investment-by-proxy in plain gold jewellery. In Japan’s case, the focus was on kihei chains: low-premium, plain gold chains. Producers of these products reported impressive sales growth. Thailand was the only other east Asian market market to see growth in bar and coin demand: investment here grew by 15% to 22.4t. Festival-related demand from Chinese communities was boosted by stock market turmoil, which drove domestic investors to look for wealth protection. The upsurge in demand was concentrated in the first few weeks of the year before the rallying price prompted profit-taking. 12 Central banks and other institutions As unconventional monetary policies – including the use of negative interest rates – expand, central banks continue to purchase gold as diversification remains a top priority. Year-on -year change Quarter-on -quarter change Tonnes Q1’15 Q1’16 Central banks and other institutions 112.3 109.4 -3% -31% There is little doubt that central banks’ enthusiasm for gold remains resolute. Having been particularly evident in the second half of 2015, when purchases amounted to the largest semi-annual total on record, 2016 has begun in similar fashion. In Q1, central banks purchased – on a net basis – 109.4t, slightly lower (-3%) than the 112.3t in the first quarter of 2015. This is now the 21st consecutive quarter of net purchases, dating back to 2011. • Negative rates significantly reduce the pool of assets in which central banks are likely to invest, as many will be hesitant to commit to a loss-making investment strategy. Indeed, about 30% of advanced country sovereign debt currently trades with a negative yield (Chart 6). • Negative rates were partially designed to counter currency appreciation pressures, but thus far the impacted currencies have actually strengthened, prompting concerns of potential intervention measures. • Growing uncertainty about the effectiveness of negative rates has contributed to increased turbulence in financial markets.12 Chart 6: Around a third of global government debt has a negative yield • Negative interest rate policies support central banks’ continued investment in gold in a number of ways. • Gold’s diversification properties remain a top priority for central banks amid financial market turbulence. As discussed in Key themes, the first three months of 2016 were primarily defined by heightened levels of uncertainty amid growing investor concern about the effectiveness of negative interest rate policies, now prevalent throughout Europe and Japan. Aside from reducing the opportunity cost of holding gold, there are three other factors that arise from NIRP which support central bank investment in gold: Less than 0% Between 0-1% Greater than 1% 30% 36% 35% Note: Totals may not equal 100% due to rounding. Source: Bloomberg; World Gold Council 12World Gold Council, Market Update: Gold in a world of negative interest rates, March 2016. Gold Demand Trends | First quarter 2016 13 According to a recent HSBC survey,13 reserve managers are finding it increasingly difficult to navigate the divergence in monetary policies around the globe. 80% of respondents agreed that negative rates had impacted reserve management, while negative rates we also described as “counterintuitive” to the “first priority of reserve management” – namely, security. The growing use of negative interest rates means reserve managers are having to consider alternative – and potentially less conservative – investments and currencies. The case for diversification of reserves using gold remains as irrefutable as ever. Russia and China – the two largest purchasers last year – continue to accumulate significant quantities of gold. Russia increased its gold reserves by 45.8t in the first quarter, 52% higher than the same period in 2015 (30.1t). And China purchased 35.1t between January-March,14 adding to the 103.9t bought in H2 2015. Kazakhstan’s gold reserves increased in each of the first three months of 2016, extending the country’s impressive buying streak to 42 consecutive months. Conversely, selling activity remains contained. Although Canada sold 1.7t in Q1, notably reducing its gold reserves to a mere 68 ounces,15 this was part of a longer term policy initiated almost four decades ago.16 Malaysia (1.9t), Mozambique (1.9t) and Mongolia (1.3t) were the only other significant net sellers during the quarter. Technology Long-term decline in gold used in technology continues, although trend slows as China’s smartphone segment offered some respite. Tonnes Q1’15 Q1’16 Year-on -year change Quarter-on -quarter change Technology 83.3 80.9 -3% -4% Electronics 66.3 63.9 -3% -4% Other Industrial 12.3 12.4 1% -2% 4.7 4.5 -4% -3% Dentistry The volume of gold used in technological applications dropped to 80.9t (-3% year-on-year) in the first quarter. Improvements in smartphone shipments in China and an uptick in decorative demand countered declines elsewhere in electronics and buffered the secular downward trend in dentistry. Widespread declines in electronics demand; outlook is bleak Demand for gold in electronics weakened by a further 3%, to 63.9t, the lowest quarter since Q4 2013. Despite positive signs in some segments, global demand remained under pressure as uncertainty over global economic growth, and the rising gold price, drove continued thrifting and substitution. These declines were geographically widespread. Double digit falls were witnessed in the main electronics hubs of Taiwan, Japan and South Korea. Taiwan was impacted by lower-than-expected demand for Apple products. In South Korea, the volume of gold used in LEDs was stagnant. 13 HSBC Reserve Management Trends 2016, April 2016. 14 Lack of data availability means no comparison can be made with Q1 2015. 15 Department of Finance, Official Reserves April 2016. 16In 1980, Canada initiated a programme to sell its gold reserves “at a gradual and controlled pace,” with the last gold bullion sold in December 2003. Since the end of 2003, Canada’s gold reserves have been entirely in the form of gold coins. Gold Demand Trends | First quarter 2016 14 And the outlook is bleak. Wireless chip manufacturers have lowered their forecasts for gold demand on a subdued outlook for smartphone shipments. And in the LED sector, slowing demand for notebooks is likely to further crimp demand. In a notable development, volumes of gold used in bonding wire production recovered due to strong demand for fingerprint sensors (FPS) in mobile phones and electronic control units (ECUs) in vehicles.17 However, the recovery in this sector is seen as a temporary pause: the medium term outlook is for gold bonding wire to resume its long term downtrend as gold replacement projects remain in place, with new applications tending to use copper wire. Only China bucks the downward trend The only exception in Q1 was China, which recovered some of the lost ground on higher smartphone shipments from domestic vendors. The market also benefited from the trend towards larger mobile phone screen sizes, which require larger Flexible Printed Circuit Boards (FPCBs) – which, in turn, use more gold than rigid PCBs. China is expected to reap further increases as it’s home to much of the new FPCB manufacturing capacity. The amount of gold used in China/HK in industrial fabrication reached 18.2t in the first quarter (+2% year-on-year). Scientists uncover innovative new uses for gold Despite the decline in more ‘traditional’ industrial uses for gold, advances in technology continue to tap into gold’s unique properties, albeit that the volumes involved are negligible. Swiss scientists have introduced a new process – using microscopic 3D printing technology – to create highly responsive touchscreens that balances gold’s conductivity and transparency. An “ink” that contains nanoparticles of gold could be thin enough to make capacitive grids, which are highly conductive and almost invisible, and don’t interfere with the displayed image.18 Gold also continues to prove its suitability for use in medical applications: it has been discovered that gold nanodisks are highly efficient in killing bacteria. After absorbing light, gold nanoparticles could reach temperatures hot enough to destroy bacterial cells.19 This procedure could be easier to implement in hospitals than current methods. Decorative demand recovered; dentistry extended decline Other industrial and decorative demand gained 1% year-onyear to 12.4t. In Europe, production of high-end costume jewellery performed well, outweighing the erosion of lowerend, mass market costume jewellery which has lost out to product manufactured in Asian markets. The higher-quality, better-designed jewellery tends to have thicker platings and therefore absorb greater quantities of gold. The gold-plated accessories space is also seen as an area of growth. Gold used in dentistry retreated further to 4.5t (-4%), the lowest quarter on record. Despite its greater durability and superior qualities compared with alternatives, gold continues to give ground to ceramics for cosmetic reasons. 17FPS: fingerprint sensors used in smartphones to access systems. This technology has effectively become the standard for every medium/high-end smartphone. ECUs: As vehicles incorporate ever more electrical systems, these call for more electronic control units to manage functionality. For example, ECUs can control the air/fuel ratio, idle speed and valve timing for different power outputs. 18 http://www.sciencealert.com/this-new-golden-nano-grid-could-lead-to-clearer-more-sensitive-touchscreens 19 http://www.osa.org/en-us/about_osa/newsroom/news_releases/2016/new_technique_for_rapidly_killing_bacteria_using_t/ Gold Demand Trends | First quarter 2016 15 Supply Increased hedging coupled with a slight uptick in mine production outweighed a marginal decline in recycling. Overall, total gold supply grew 5%. Tonnes Q1’15 Q1’16 Year-on -year change Quarter-on -quarter change 1,081.0 1,134.9 5% 4% Total mine supply 717.7 774.0 8% -10% Recycled gold 363.2 360.9 -1% 53% Total supply Total supply in Q1 increased 5% year-on-year, the result of an 8% increase in total mine supply – the sum of mine production and net hedging – and a 1% decline in gold recycling. Total mine supply benefitted from a marginal increase in mine production – from both existing projects and recent start-ups – and a renewed interest in hedging from some producers. And while recycling dipped yearon-year, the rapid rise in gold prices at the start of 2016 fuelled strong quarter-on-quarter growth. Production growth in the first quarter was driven by major operations in a handful of countries. In the United States, increases at Barrick’s Goldstrike (+3.3t) and Cortez (+6.8t) projects led to a year-on-year increase in overall production levels. In Mexico, Fresnillo’s Herradura (+1t) and Noche Buena (+0.6t) pushed production higher. The year-onyear increase in mine production in Indonesia was due to continued strong output from Newmont’s Batu Hijau (+2.6t). Polyus Gold reported a 9% increase in output during the first three months of the year, boosting Russian production. The mild Russian winter was a key factor, as it prolonged the operating window for projects that would normally shut down during the most severe winter weather. The rise in production should not be attributed to established operations alone. New mine starts have also played a part. Torex Gold’s El Limon-Guajes mine in Mexico poured gold for the first time in December 2015, while Goldcorp’s Éléonore and Cochenour mines in Canada are ramping up, having entered production in Q3 and Q4 2015 respectively. In Guyana, output was boosted by Guyana Gold Field’s Aurara project and Troy Resource’s Karouni project entering production in Q4 2015. Mine output up slightly but pipeline remains constrained During the first quarter of 2016, mine production totalled 734t, a modest 5t increase on the 729.4t of output in Q1 2015. Yet, over the long term, global production is plateauing: gold producers continue to trim costs and focus on maximising output from existing assets, while the impact of new mines coming on stream dwindles. Gold Demand Trends | First quarter 2016 16 But the continued influence of new mines on mine production should not be overstated; the project pipeline is diminishing. In recent years, additional production from new mines brought on stream has declined (Chart 7). And continued cutbacks on sustaining capex by producers (allin sustaining costs fell 11% year-on-year to US$832/oz in Q4 2015) and the focus on core assets means pressure on the project pipeline will persist. Outright declines in production remain limited as producers are focused on maximising production from their existing portfolio of assets. One notable decline in production was at Yanaccocha in Peru, where output fell 2.1t year-on-year, mainly due to lower ore grades being leached and milled, as well as lower mill recovery. Recycled gold While Q1 recycling fell 1% year-on-year, the rally in the gold price in early 2016 boosted it 53% quarter-on-quarter, as price increases influenced consumers. The strong start for gold in the first three months proved too tempting for some consumers, who took the opportunity to pocket a higher price for their old gold possessions. This behaviour was clearly evident in markets such as Thailand and Indonesia, where prices above US$1,200/oz acted as a strong sell signal. In Turkey, the 13% appreciation in the local gold price during the quarter also encouraged recycling, although not to the same extent as in Q1 2015. The country’s gold market is highly liquid, with an established infrastructure for recycling gold and consumers who are keenly aware of the gold price which means the market (both retailers and consumers) can quickly respond to escalating prices by selling gold back to be refined. India’s recycling market was more subdued. The wellpublicised jewellers strike, in response to changes to taxation in February’s budget, restricted recycling activity. With many consumers using jewellers to sell back old gold jewellery, the temporary suspension of trade meant that this recycling channel was significantly curtailed. Chart 7: Sharp slowdown in new mine start-ups • The number of new mines coming on-stream has slowed since 2013; these have made a small incremental contribution to global production. • Global production is plateauing as producers continue to focus on minimising capital expenditure and maximising production from existing projects. Tonnes 3,400 3,200 3,000 2,800 2,600 2,400 2,200 2,000 2009 2010 Pre-2010 2010 2011 2011 2012 2012 2013 2013 2014 2015 2014 2015 2016 2016 Source: Metals Focus; GFMS, Thomson Reuters; World Gold Council Gold Demand Trends | First quarter 2016 17 Hedging finds favour with some Gold hedging totalled 40t in the first quarter of 2016, more than reversing the 11.6t of dehedging in Q1 2015. This increase brings the global hedge book to 253t (Chart 8). Gold’s impressive rise in the first quarter of 2016 was viewed by a small number of mining companies as an opportunity to hedge for tactical purposes. While some entered into contracts to lock-in the price they will receive, others sought to secure the exchange rate. Acacia Mining hedged 4.2t of production from its Buzwagi mine in Tanzania, while New Gold opted to hedge 8.4t of its 2016 production. But both companies made clear they intend to remain unhedged in the long-term. New Gold stated: “Our unique decision to enter into the option contracts is solely a function of 2016 being our most significant year of investment at our Rainy River project. We do not have any plans to enter into any similar contracts beyond this brief nine-month period.” 21 Polyus Gold – the largest producer in Russia – entered into the largest position, hedging 625,000 ounces (19.4t) over the next four years, while Evolution Mining hedged 4.7t out to mid-2020, bringing the company’s total hedgebook to 26t. Both have been relatively active in the hedging space in recent quarters to make the most of the local price advantage. Newcrest also opted to hedge a portion of the future production from its Telfer mine (16.5t) in response to near-record high local gold prices.20 While this increase in hedging is certainly notable – both given the companies involved and the size of some of the hedges – we don’t expect to see a substantial shift back towards widespread long-term hedging. The focus in the industry remains on shorter-term hedges (over a time frame of months rather than years).22 Many of the positions appear to be driven by the need to secure cash flow for project-related financing, or debt repayments. Further price appreciation may elicit sporadic hedging, although royalty, and in particular streaming, deals remain an alternative. Chart 8: 40t of hedging in Q1 took the global hedgebook to 253t, up one third year-on-year • New hedging activity is largely short-term and project financing-related. • Although notable in recent terms, the uptick in hedging volumes is not significant in a historical context. Tonnes 3,500 3,000 2,500 2,000 1,500 1,000 500 0 1994 1996 1998 2000 2002 2004 2006 2008 2010 2012 Source: Metals Focus; GFMS, Thomson Reuters; World Gold Council 2014 Q1 2016 20Newcrest’s Telfer mine has relied largely on fly-in fly-out workers, which has resulted in it being sensitive to the local gold price. The company’s other Australian assets remain unhedged. 21 http://www.newgold.com/investors/NewGoldNews/PressReleaseDetail/2016/New-Gold-further-increases-cash-flow-certaintywith-gold-option-contracts/default.aspx 22 http://www.bloomberg.com/news/articles/2016-02-29/top-performing-gold-miner-adds-to-hedging-reboot-as-price-soars Gold Demand Trends | First quarter 2016 18 Gold demand statistics Table 2: Gold demand (tonnes) 2014 2015 Q2’14 Q3’14 Q4’14 Q1’15 Q2’15 Q3’15 Q4’15 Q1’16 vs Q1’15 Q1’16 % change 2,482.0 2,397.5 589.5 591.5 686.0 596.9 513.7 623.7 663.2 481.9 -19 Technology 348.5 333.8 86.6 89.5 89.4 83.3 83.5 82.9 84.1 80.9 -3 Electronics 277.6 264.3 68.6 71.6 71.8 66.3 65.8 65.5 66.8 63.9 -3 51.0 50.6 13.1 13.0 12.8 12.3 13.0 12.7 12.7 12.4 Jewellery Other industrial Dentistry Investment 1 19.9 18.9 4.9 4.9 4.8 4.7 4.8 4.7 4.6 4.5 -4 822.0 895.6 200.1 182.4 169.4 277.9 182.3 230.3 205.2 617.6 122 1,005.6 1,023.9 238.1 223.3 261.5 252.2 205.3 293.7 272.7 253.9 Physical bar demand 726.5 739.8 170.8 166.9 186.9 186.6 151.2 199.8 202.2 183.4 -2 Official coin 202.9 212.4 48.8 35.7 54.5 50.2 40.1 72.6 49.5 58.7 17 76.2 71.7 18.6 20.8 20.1 15.4 14.0 21.3 21.0 11.8 -24 -183.6 -128.3 -38.0 -40.9 -92.1 25.6 -23.0 -63.4 -67.6 363.7 >300 Total bar and coin demand Medals/imitation coin ETFs and similar products* 1 583.9 566.3 157.2 174.9 133.9 112.3 127.2 167.9 158.8 109.4 -3 Gold demand 4,236.4 4,193.1 1,033.5 1,038.3 1,078.7 1,070.4 906.7 1,104.7 1,111.3 1,289.8 21 LBMA Gold Price, US$/oz 1,266.4 1,160.1 1,288.4 1,281.9 1,201.4 1,218.5 1,192.4 1,124.3 1,106.5 1,182.6 -3 Central banks and other inst. *For a listing of the Exchange Traded Funds and similar products, please see the Notes and definitions. Source: Metals Focus; GFMS, Thomson Reuters; ICE Benchmark Administration; World Gold Council Table 3: Gold demand (US$mn) 2014 2015 Q2’14 Q3’14 Q4’14 Q1’15 Q2’15 Q3’15 Q4’15 Q1’16 vs Q1’15 Q1’16 % change 101,054.9 89,417.2 24,419.8 24,378.3 26,495.7 23,383.0 19,693.0 22,543.7 23,591.5 18,322.3 -22 Technology 14,188.6 12,450.2 3,588.7 3,688.2 3,453.5 3,263.0 3,201.5 2,996.0 2,992.5 3,074.1 -6 Electronics 11,301.4 9,858.3 2,843.4 2,950.4 2,771.6 2,595.4 2,521.2 2,366.4 2,377.4 2,430.9 -6 2,076.3 1,888.4 542.6 536.6 495.8 482.3 497.7 458.6 450.0 471.2 -2 Jewellery Other industrial 811.0 703.5 202.7 201.2 186.0 185.2 182.6 171.0 165.1 172.0 -7 Investment 33,469.7 33,402.3 8,290.1 7,518.9 6,543.0 10,885.7 6,986.7 8,323.4 7,299.0 23,482.7 116 Total bar and coin demand 40,944.2 38,189.1 9,864.1 9,204.7 10,099.6 9,881.1 7,869.7 10,614.9 9,702.3 9,654.6 -2 Physical bar demand 29,581.5 27,590.9 7,074.9 6,877.4 7,218.3 7,311.4 5,795.5 7,221.1 7,192.2 6,973.9 -5 8,260.2 7,923.6 2,019.8 1,470.3 2,104.8 1,965.8 1,538.5 2,623.9 1,762.5 2,232.9 14 Dentistry Official coin Medals/imitation coin 3,102.6 2,674.5 769.4 857.0 776.5 604.0 535.7 770.0 747.6 447.8 -26 ETFs and similar products* -7,474.5 -4,786.8 -1,574.0 -1,685.8 -3,556.6 1,004.6 -883.0 -2,291.5 -2,403.3 13,828.1 >300 23,774.0 21,121.3 6,511.7 7,206.5 5,173.5 4,400.5 4,877.9 6,069.2 5,649.8 4,161.2 -5 172,487.2 156,390.9 42,810.3 42,792.0 41,665.6 41,932.2 34,759.1 39,932.4 39,532.8 49,040.2 17 Central banks and other inst. Gold demand *For a listing of the Exchange Traded Funds and similar products, please see the Notes and definitions. Source: Metals Focus; GFMS, Thomson Reuters; ICE Benchmark Administration; World Gold Council Gold Demand Trends | First quarter 2016 19 Table 4: Gold supply and demand World Gold Council presentation 2014 2015 Q2’14 Q3’14 Q4’14 Q1’15 Q2’15 Q3’15 Q4’15 Q1’16 vs Q1’15 Q1’16 % change 3,153.1 3,211.4 759.6 831.2 845.1 729.4 787.7 847.8 846.4 734.0 106.5 9.2 50.0 -9.2 51.9 -11.6 -6.9 14.9 13.0 Total mine supply 3,259.6 3,220.6 809.6 822.0 897.0 717.7 780.8 862.7 Recycled gold 1,202.1 1,127.0 279.9 274.4 270.0 363.2 266.8 Total supply 4,461.7 4,347.6 1,089.5 1,096.4 1,167.1 1,081.0 2,502.7 2,438.5 610.2 639.5 648.6 348.5 333.8 86.6 89.5 89.4 Supply Mine production Net producer hedging 1 40.0 - - 859.4 774.0 8 261.5 235.5 360.9 -1 1,047.6 1,124.2 1,094.9 608.0 542.5 662.6 625.3 478.5 -21 83.3 83.5 82.9 84.1 80.9 -3 1,134.9 5 Demand Fabrication – Jewellery1 Fabrication – Technology Sub-total above fabrication 2,851.1 2,772.3 696.8 729.0 738.0 691.3 626.1 745.5 709.5 559.4 -19 Total bar and coin demand 1,005.6 1,023.9 238.1 223.3 261.5 252.2 205.3 293.7 272.7 253.9 ETFs and similar products -183.6 -128.3 -38.0 -40.9 -92.1 25.6 -23.0 -63.4 -67.6 363.7 >300 2 Central banks and other inst.3 Gold demand Surplus/Deficit 4 1 583.9 566.3 157.2 174.9 133.9 112.3 127.2 167.9 158.8 109.4 -3 4,257.1 4,234.2 1,054.2 1,086.3 1,041.3 1,081.5 935.6 1,143.7 1,073.5 1,286.5 19 204.6 113.4 35.3 10.1 125.8 -0.6 112.1 -19.5 21.4 -151.5 - 5 Total demand 4,461.7 4,347.6 1,089.5 1,096.4 1,167.1 1,081.0 1,047.6 1,124.2 1,094.9 1,134.9 LBMA Gold Price, US $ /oz 1,266.4 1,160.1 1,288.4 1,281.9 1,201.4 1,218.5 1,192.4 1,124.3 1,106.5 1,182.6 -3 1 For an explanation of jewellery fabrication, please see the Notes and definitions. 2 For a listing of the Exchange Traded Funds and similar products, please see the Notes and definitions. 3 Excluding any delta hedging of central bank options. 4 For an explanation of Surplus/Deficit, please see the Notes and definitions. Source: Metals Focus; GFMS, Thomson Reuters; ICE Benchmark Administration; World Gold Council Table 5: Quarterly average price 2015 Q1'15 Q2'15 Q3'15 Q4'15 US$/oz 1,160.1 1,218.5 1,192.4 1,124.3 1,106.5 1,182.6 €/oz 1,045.3 1,083.1 1,078.0 1,011.5 1,010.1 1,072.3 £/oz 759.0 804.9 777.7 726.0 728.6 826.9 35,863.3 37,292.5 36,082.7 34,875.9 35,230.2 CHF/kg ¥/g Rs/10g Q1'16 37,774.4 Q1’16 vs Q1’15 % change -3 -1 3 1 4,513.8 4,666.8 4,656.4 4,416.2 4,320.4 4,374.5 23,903.2 24,377.9 24,332.8 23,476.1 23,446.0 25,677.0 -6 5 2 RMB/g 234.2 244.3 237.8 227.8 227.2 248.7 TL/g 101.4 96.5 102.3 103.1 103.4 111.9 16 Source: ICE Benchmark Administration; Thomson Reuters Datastream; World Gold Council Gold Demand Trends | First quarter 2016 20 Table 6: Jewellery demand in selected countries (tonnes) 2015 Q1'15 Q2'15 Q3'15 Q4'15 668.5 150.8 122.1 215.1 180.4 88.4 -41 Pakistan 23.2 5.3 5.4 5.9 6.6 6.0 13 Sri Lanka 6.8 1.7 2.0 1.3 1.7 1.5 -14 Greater China 811.9 231.7 181.0 196.0 203.1 191.6 -17 China 753.4 216.3 169.0 180.6 187.6 179.4 -17 51.4 13.6 10.5 13.7 13.6 10.2 -25 7.0 1.8 1.6 1.7 2.0 1.9 Japan 16.5 3.2 3.8 4.4 5.1 3.5 10 Indonesia 38.9 12.1 8.5 9.3 9.0 10.8 -10 India Hong Kong Taiwan Q1'16 Q1’16 vs Q1’15 % change 6 Malaysia 8.4 2.8 1.7 2.0 1.9 2.2 -23 Singapore 12.2 3.4 2.7 3.0 3.1 3.3 -3 South Korea 14.1 3.7 2.9 3.7 3.9 3.9 Thailand 12.2 3.4 2.8 2.9 3.1 3.2 -4 Vietnam 15.6 4.4 3.7 3.5 3.9 4.7 8 6 230.3 63.0 57.7 56.0 53.6 56.5 -10 Saudi Arabia 71.1 17.4 18.8 16.6 18.4 15.3 -12 UAE 51.4 16.3 14.9 10.0 10.2 14.0 -14 Kuwait 12.7 3.6 3.1 2.3 3.7 3.1 -15 Egypt 38.2 9.3 8.9 11.8 8.1 7.7 -18 Iran 37.2 9.0 7.2 11.4 9.5 9.9 10 Middle East Other Middle East 19.7 7.3 4.8 3.9 3.7 6.5 -11 Turkey 49.0 10.4 11.6 12.1 15.0 8.5 -18 Russia 41.1 9.2 9.1 12.5 10.3 7.7 -17 Americas 170.5 32.5 39.1 38.2 60.8 32.9 1 United States 119.8 22.1 25.6 26.5 45.6 22.6 2 Canada 14.2 2.7 3.5 2.7 5.3 2.6 -3 Mexico 16.6 4.0 4.2 4.4 4.1 4.1 Brazil 19.9 3.8 5.8 4.7 5.7 3.5 -6 Europe ex CIS 75.9 12.8 14.5 12.8 35.8 12.7 -1 France 13.6 2.8 2.6 2.0 6.3 2.7 -2 Germany 10.2 1.7 2.1 1.2 5.2 1.7 -1 Italy 18.0 2.5 3.6 2.8 9.0 2.4 -3 8.3 1.8 2.1 1.9 2.5 1.9 3 25.9 4.0 4.1 4.9 12.9 4.0 1 Switzerland - - - - - - - - Austria - - - - - - - - Spain United Kingdom Other Europe Total above - - - - - 2,195.1 550.5 468.5 578.7 597.3 Other and stock change World total - 4 -- 437.5 -21 202.4 46.4 45.2 44.9 65.9 44.4 -4 2,397.5 596.9 513.7 623.7 663.2 481.9 -19 Source: Metals Focus; World Gold Council Gold Demand Trends | First quarter 2016 21 Table 7: Total bar and coin demand in selected countries (tonnes) India Pakistan Sri Lanka Greater China China Hong Kong Taiwan Q1'16 Q1’16 vs Q1’15 % change 2015 Q1'15 Q2'15 Q3'15 Q4'15 195.8 40.9 37.7 57.0 60.2 28.0 -31 14.5 3.1 3.8 3.7 4.0 3.4 11 - - - - - 211.1 61.2 43.3 54.3 52.3 - -- 63.7 4 5 203.3 59.1 41.6 52.3 50.3 61.9 1.5 0.4 0.3 0.5 0.3 0.4 -3 -17 6.4 1.7 1.4 1.5 1.7 1.4 Japan 16.2 -3.2 -0.2 10.8 8.9 3.3 Indonesia 20.1 5.7 4.5 4.6 5.3 5.2 -8 Malaysia 7.3 2.5 1.5 1.7 1.6 1.5 -40 Singapore 5.9 1.6 1.2 1.5 1.6 1.2 -27 South Korea 7.5 1.7 1.3 2.2 2.4 1.2 -26 Thailand 78.0 19.5 16.4 20.5 21.5 22.4 15 Vietnam 47.8 14.4 10.8 11.5 11.1 11.5 -21 Middle East 62.4 23.9 14.5 13.1 10.9 22.9 -4 Saudi Arabia 15.2 4.8 3.2 3.4 3.9 3.9 -19 UAE 8.7 2.9 2.3 1.8 1.8 2.5 -15 Kuwait 0.8 0.2 0.2 0.2 0.2 0.2 -17 Egypt 4.9 1.1 1.2 1.4 1.2 0.9 30.1 14.2 7.0 5.8 3.1 14.9 Iran Other Middle East -- -22 5 2.6 0.8 0.6 0.6 0.6 0.6 -17 Turkey 23.1 5.2 4.5 9.2 4.2 5.0 -5 Russia 4.8 1.3 1.3 1.2 1.1 1.0 -22 Americas 78.0 13.4 13.6 32.7 18.4 20.2 51 United States 71.5 11.8 12.3 30.8 16.6 18.3 55 Canada 2.9 0.7 0.5 0.9 0.8 1.0 42 Mexico 2.2 0.5 0.4 0.7 0.6 0.6 Brazil 1.4 0.4 0.4 0.4 0.4 0.3 -10 222.1 58.1 45.3 59.9 58.8 58.4 0 1.6 1.0 -0.3 0.4 0.5 0.8 -21 116.0 30.9 23.1 30.2 31.7 31.1 - - - - - Europe ex CIS France Germany Italy Spain - 1 -- - - - - - 9.4 2.0 1.8 2.7 2.9 3.2 61 Switzerland 49.2 13.6 10.7 13.3 11.6 12.7 -7 Austria 12.2 3.0 2.5 3.5 3.2 2.9 -1 United Kingdom Other Europe Total above Other and stock change World total Source: Metals Focus; World Gold Council Gold Demand Trends | First quarter 2016 - 4 -- 33.7 7.7 7.5 9.7 8.9 7.7 0 994.6 249.2 199.4 283.9 262.1 248.8 0 29.3 3.0 5.9 9.8 10.6 5.1 71 1,023.9 252.2 205.3 293.7 272.7 253.9 1 22 Table 8: Consumer demand in selected countries (tonnes) India Pakistan Sri Lanka Greater China China Q1’16 vs Q1’15 % change 2015 Q1'15 Q2'15 Q3'15 Q4'15 Q1'16 864.3 191.7 159.8 272.1 240.6 116.5 -39 37.6 8.4 9.2 9.6 10.5 9.4 13 6.8 1.7 2.0 1.3 1.7 1.5 -14 1,023.0 292.9 224.3 250.3 255.4 255.3 -13 956.7 275.4 210.6 232.9 237.8 241.3 -12 Hong Kong 52.8 14.0 10.8 14.2 13.9 10.6 -24 Taiwan 13.4 3.6 2.9 3.2 3.7 3.4 -5 Japan 32.8 0.0 3.6 15.2 14.0 6.8 >300 Indonesia 59.0 17.8 13.0 14.0 14.3 16.1 -10 Malaysia 15.7 5.3 3.2 3.7 3.5 3.7 -31 Singapore 18.1 5.0 3.9 4.5 4.7 4.5 -11 South Korea 21.6 5.3 4.2 5.9 6.2 5.2 -3 Thailand 90.2 22.9 19.2 23.5 24.6 25.7 12 Vietnam 63.4 18.9 14.5 15.0 15.0 16.2 -14 Middle East 292.7 86.9 72.2 69.1 64.5 79.3 -9 Saudi Arabia 86.3 22.1 22.0 19.9 22.3 19.1 -14 UAE 60.1 19.2 17.2 11.8 12.0 16.5 -14 Kuwait 13.6 3.9 3.3 2.5 3.9 3.3 -15 Egypt 43.1 10.4 10.1 13.3 9.4 8.5 Iran 67.3 23.2 14.3 17.2 12.6 24.7 Other Middle East 22.3 8.1 5.4 4.4 4.3 7.2 -12 Turkey 72.1 15.6 16.1 21.2 19.2 13.5 -14 Russia 45.9 10.5 10.3 13.7 11.4 8.7 -18 Americas 248.5 45.9 52.6 70.9 79.1 53.0 16 United States 191.3 33.9 38.0 57.3 62.2 40.9 21 Canada 17.1 3.4 4.0 3.6 6.1 3.6 6 Mexico 18.8 4.5 4.5 5.0 4.7 4.7 4 Brazil 21.3 4.1 6.1 5.0 6.0 3.8 -7 298.1 70.9 59.8 72.7 94.7 71.1 15.2 3.8 2.3 2.3 6.8 3.5 126.1 32.7 25.2 31.4 36.9 32.8 18.0 2.5 3.6 2.8 9.0 2.4 -3 Europe ex CIS France Germany Italy -18 7 0 -7 1 8.3 1.8 2.1 1.9 2.5 1.9 United Kingdom 35.3 6.0 6.0 7.6 15.8 7.2 21 Switzerland 49.2 13.6 10.7 13.3 11.6 12.7 -7 Austria 12.2 3.0 2.5 3.5 3.2 2.9 -1 Spain Other Europe Total above Other and stock change World total 33.7 7.7 7.5 9.7 8.9 7.7 3,189.7 799.8 667.9 862.6 859.4 686.3 231.7 49.4 51.1 54.7 76.5 49.6 3,421.4 849.1 719.0 917.3 935.9 735.8 3 0 -14 0 -13 Source: Metals Focus; World Gold Council Gold Demand Trends | First quarter 2016 23 Table 9: Indian supply estimates (tonnes) 2015 Q1'15 Q2'15 Q3'15 Q4'15 Q1'16 Q1’16 vs Q1’15 % change Supply 1,065.0 249.2 235.9 304.8 275.1 151.4 of which doré1 Gross bullion imports 229.0 38.6 56.7 67.3 66.5 34.8 -10 Net bullion imports 913.6 220.2 202.9 262.9 227.6 134.4 -39 80.2 18.0 24.0 18.2 20.0 14.0 -22 9.2 2.4 2.5 2.2 2.1 3.3 38 1,003.0 240.6 229.4 283.3 249.7 151.7 -37 Scrap Domestic supply from other sources2 Total supply 3 -39 1 Volume of fine gold material contained in the doré. 2 Domestic supply from local mine production, recovery from imported copper concentrates and disinvestment. 3 T his supply can be consumed across the three sectors – jewellery, investment and technology. Consequently, the total supply figure in the table will not add to jewellery plus investment demand for India. Source: Metals Focus; World Gold Council Table 10: Top 10 physically-backed gold ETFs by AuM in tonnes Holdings as of end March Q1’16 vs Q1’15 % change Fund Country 1 SPDR Gold Shares United States 819.3 11 2 iShares Gold Trust United States 186.3 13 3 ZKB Gold ETF Switzerland 137.7 -1 4 ETFS Physical Gold United Kingdom 113.9 2 5 Gold Bullion Securities United Kingdom 92.3 8 6 Source Physical Gold United Kingdom 73.7 51 7 Xetra-Gold Germany 70.7 28 8 Sprott Physical Gold Trust United States 54.8 39 9 Central Fund of Canada Ltd Canada 52.7 0 10 Julius Baer Physical Gold Fund Switzerland 44.2 -10 1,974.3 12 Global total Source: Respective ETP providers; Bloomberg; ICE Benchmark Administration; World Gold Council Table 11: Physically-backed gold ETF AuM by region in tonnes North America Q1'16 Q1’16 vs Q1’15 tonnage change Q1’16 vs Q1’15 % change Q1'15 Q2'15 Q3'15 Q4'15 1,068.6 1,044.8 1,012.3 955.9 1,186.9 118.3 11 612.0 618.6 583.9 570.2 690.5 78.5 13 Asia 43.3 41.0 42.9 46.0 54.1 10.8 25 Other 40.6 37.0 39.1 38.4 42.8 2.2 5 1,764.5 1,741.5 1,678.1 1,610.6 1,974.3 209.7 12 Europe Global total Source: Respective ETP providers; Bloomberg; ICE Benchmark Administration; World Gold Council Gold Demand Trends | First quarter 2016 24 Table 12: Top 40 reported official gold holdings (as at March 2016) Tonnes % of reserves Tonnes % of reserves 1 United States 8,133.5 75% 21 Venezuela 272.9 66% 2 Germany 3,381.0 69% 22 Kazakhstan 228.3 32% 3 IMF 2,814.0 - 23 Belgium 227.4 36% 4 Italy 2,451.8 68% 24 Philippines 195.9 10% 5 France 2,435.7 63% 25 Algeria 173.6 5% 6 China 1,797.5 2% 26 Thailand 152.4 3% 7 Russia 1,460.4 15% 27 Singapore 127.4 2% 8 Switzerland 1,040.0 7% 28 Sweden 125.7 8% 9 Japan 765.2 2% 29 South Africa 125.2 11% 10 Netherlands 612.5 61% 30 Mexico 121.1 3% 11 India 557.7 6% 31 Libya 116.6 6% 12 ECB 504.8 27% 32 Greece 112.7 59% 13 Turkey 479.3 17% 33 BIS 108.0 - 14 Taiwan 422.7 4% 34 Korea 104.4 1% 15 Portugal 382.5 71% 35 Romania 103.7 10% 16 Saudi Arabia 322.9 2% 36 Poland 102.9 4% 17 United Kingdom 310.3 9% 37 Iraq 89.8 7% 18 Lebanon 286.8 23% 38 Australia 79.9 6% 19 Spain 281.6 21% 39 Kuwait 79.0 9% 20 Austria 280.0 45% 40 Indonesia 78.1 3% For information on the methodology behind this data, as well as footnotes for specific countries, please see our table of Latest World Official Gold Reserves, at http://www.gold.org/government-affairs/gold-reserves Source: IMF IFS; World Gold Council Table 13: Historical data for gold demand Tonnes Jewellery Total bar and coin investment ETFs and similar* Technology Central banks Total 2,301.4 429.8 258.7 471.7 -365.4 3,096.2 2007 2,424.9 437.5 259.6 477.7 -483.8 3,116.0 2008 2,306.2 917.9 325.0 464.7 -235.4 3,778.3 2009 1,816.3 832.3 644.6 414.4 -33.6 3,674.0 2010 2,051.6 1,201.2 420.8 460.5 79.2 4,213.2 4,729.8 2006 2011 2,091.6 1,491.9 236.9 428.5 480.8 2012 2,130.4 1,297.5 306.6 381.4 569.3 4,685.1 2013 2,678.8 1,705.1 -914.1 356.0 623.8 4,449.6 2014 2,482.0 1,005.6 -183.6 348.5 583.9 4,236.4 2015 2,397.5 1,023.9 -128.3 333.8 566.3 4,193.1 589.5 238.1 -38.0 86.6 157.2 1,033.5 Q3'14 591.5 223.3 -40.9 89.5 174.9 1,038.3 Q4'14 686.0 261.5 -92.1 89.4 133.9 1,078.7 1,070.4 Q2'14 Q1'15 596.9 252.2 25.6 83.3 112.3 Q2'15 513.7 205.3 -23.0 83.5 127.2 906.7 Q3'15 623.7 293.7 -63.4 82.9 167.9 1,104.7 Q4'15 663.2 272.7 -67.6 84.1 158.8 1,111.3 Q1'16 481.9 253.9 363.7 80.9 109.4 1,289.8 *For a listing of the Exchange Traded Funds and similar products, please see the Notes and definitions. Source: Metals Focus; GFMS, Thomson Reuters; World Gold Council Gold Demand Trends | First quarter 2016 25 Notes and definitions All statistics (except where specified) are in weights of fine gold. Notes Revisions to data All data is subject to revision in the light of new information. Historical data series Demand and supply data from Q1 2014 are provided by Metals Focus. Data between Q1 2010 and Q4 2013 is a synthesis of Metals Focus and GFMS, Thomson Reuters data, which was created using relatively simple statistical techniques. For more information on this process, please see Creating a consistent data series by Dr James Abdey (http://www.gold.org/supply-and-demand/golddemand-trends/back-issues/gold-demand-trends-q12015#package) Definitions Central banks and other institutions Net purchases (i.e. gross purchases less gross sales) by central banks and other official sector institutions, including supra national entities such as the IMF. Swaps and the effects of delta hedging are excluded. Consumer demand The sum of jewellery consumption and total bar and coin investment occurring within a country i.e. the amount (in fine weight) of gold purchased directly by individuals. Electronics This measures fabrication of gold into components used in the production of electronics, including – but not limited to – semiconductors and bonding wire. Dentistry The first transformation of raw gold into intermediate or final products destined for dental applications such as dental alloys. ETFs and similar products Exchange Traded Funds and similar products including, but not limited to: SPDR Gold Shares, iShares Gold Trust, ZKB Gold ETF, ETFS Physical Gold/Jersey, Gold Bullion Securities Ltd, Central Fund of Canada Ltd, Xetra-Gold, Julius Baer Precious Metals Fund – JB Physical Gold Fund, Source Physical Gold P-ETC, Sprott Physical Gold Trust. Over time, new products may be included when appropriate. Gold holdings are as reported by the ETF/ETC issuers and where data is unavailable holdings have been calculated using reported AUM numbers. Gold Demand Trends | First quarter 2016 Fabrication Fabrication is the first transformation of gold bullion into a semi-finished or finished product. Gold demand The total of jewellery fabrication, technology, total bar and coin demand and demand for ETFs and similar products. Jewellery End-user demand for all newly-made carat jewellery and gold watches, whether plain gold or combined with other materials. Excluded are: second-hand jewellery; other metals plated with gold; coins and bars used as jewellery; and purchases funded by the trading-in of existing carat gold jewellery. Jewellery fabrication Figures for jewellery fabrication – the first transformation of gold bullion into semi-finished or finished jewellery – are included in Table 4. Differs from jewellery consumption as it excludes the impact of imports/exports and stocking/destocking by manufacturers and distributors. LBMA Gold price PM Unless otherwise specified, gold price values from 20 March 2015 are based on the LBMA Gold price PM administered by ICE Benchmark Administration (IBA), with prior values being based on the London PM Fix. London PM Fix Unless otherwise specified, gold price values prior to 20 March 2015 are based on the London PM Fix, with subsequent values being based on the LBMA Gold price PM administered by ICE Benchmark Administration (IBA). Medals/imitation coin Fabrication of gold coins without a face value, produced by both private and national mints. India dominates this category with, on average, around 90% of the total. ‘Medallion’ is the name given to unofficial coins in India. Medals of at least 99% purity, wires and lumps sold in small quantities are also included. Mine production The volume (in fine weight) of gold mined globally. This includes an estimate for gold produced as a result of artisanal and small scale mining (ASM), which is largely informal. 26 Net producer hedging This measures the impact in the physical market of mining companies’ gold forward sales, loans and options positions. Hedging accelerates the sale of gold, a transaction which releases gold (from existing stocks) to the market. Over time, hedging activity does not generate a net increase in the supply of gold. De-hedging – the process of closing out hedged positions – has the opposite impact and will reduce the amount of gold available to the market in any given quarter. Official coin demand Investment by individuals in gold bullion coins. It equates to the fabrication by national mints of coins which are, or have been, legal tender in the country of issue. It is measured at the country of consumption rather than at the country of origin (for example, the Perth Mint in Australia, sells the majority of the coins it produces through its global distribution network) and is measured on a net basis. In practice it includes the initial sale of many coins destined ultimately to be considered as numismatic rather than bullion. Recycled gold Gold sourced from fabricated products that have been sold or made ready for sale, which is refined back into bullion. This specifically refers to gold sold for cash. It does not include gold traded-in for other gold products (for example, by consumers at jewellery stores) or process scrap (working gold that never becomes part of a fabricated product but instead returns as scrap to a refiner). The vast majority – around 90% – of recycled gold is high-value gold (largely jewellery) and the remainder is gold recovered from industrial waste, including laptops, mobile phones, circuit boards etc. For more detail on recycling, refer to The Ups and Downs of Gold Recycling, Boston Consulting Group and World Gold Council, March 2015 (www.gold.org/supply-and-demand). Surplus/deficit This is the difference between total supply and gold demand. Partly a statistical residual, this number also captures demand in the OTC market and changes to inventories on commodity exchanges, with an additional contribution from changes to fabrication inventories. Other industrial Gold used in the production of compounds, such as Gold Potassium Cyanide, for electro-plating in industrial applications as well as in the production of gold-plated jewellery and other decorative items such as gold thread. India accounts for the bulk of demand in this category. Technology This captures all gold used in the fabrication of electronics, dental, medical, decorative and other technological applications, with electronics representing the largest component of this category. It includes gold destined for plating jewellery. Over-the-counter Over-the-counter (OTC) transactions (also referred to as ‘off exchange’ trading) take place directly between two parties, unlike exchange trading which is conducted via an exchange. Tonne (Metric) 1,000 kg or 32,151 troy oz of fine gold. Physical bar demand Investment by individuals in small (1kg and below) gold bars in a form widely accepted in the countries represented within Gold Demand Trends. This also includes, where identifiable, gold bought and stored via online vendors. It is measured as net purchases. Gold Demand Trends | First quarter 2016 Total bar and coin investment The total of physical bar demand, official coin demand and demand for medals/imitation coin. Total supply The total of mine production, net producer hedging and recycling. 27 Copyright and other rights © 2016 World Gold Council. All rights reserved. World Gold Council and the Circle device are trademarks of the World Gold Council or its affiliates. All references to LBMA Gold Price have been provided for informational purposes only. ICE Benchmark Administration Limited accepts no liability or responsibility for the accuracy of the prices or the underlying product to which the prices may be referenced. Other third party data and content is the intellectual property of the respective third party and all rights are reserved to them. Any copying, republication or redistribution of content, to reproduce, distribute or otherwise use the statistics and information in this report including by framing or similar means, is expressly prohibited without the prior written consent of the World Gold Council or the appropriate copyright owners except as provided below. The use of the statistics in this report is permitted for the purposes of review and commentary (including media commentary) in line with fair industry practice, subject to the following two pre-conditions: (i) only limited extracts of data or analysis be used; and (ii) any and all use of these statistics is accompanied by a clear acknowledgement of the World Gold Council and, where appropriate, of Thomson Reuters, as their source. Brief extracts from the analysis, commentary and other World Gold Council material are permitted provided World Gold Council is cited as the source. It is not permitted to reproduce, distribute or otherwise use the whole or a substantial part of this report or the statistics contained within it. While every effort has been made to ensure the accuracy of the information in this document, the World Gold Council does not warrant or guarantee the accuracy, completeness or reliability of this information. The World Gold Council does not accept responsibility for any losses or damages arising directly or indirectly, from the use of this document. The material contained in this document is provided solely for general information and educational purposes and is not, and should not be construed as, an offer to buy or sell, or as a solicitation of an offer to buy or sell, gold, any gold related products or any other products, securities or investments. Nothing in this document should be taken as making any recommendations or providing any investment or other advice with respect to the purchase, sale or other disposition of gold, any gold related products or any other products, Gold Demand Trends | First quarter 2016 securities or investments, including without limitation, any advice to the effect that any gold related transaction is appropriate for any investment objective or financial situation of a prospective investor. A decision to invest in gold, any gold related products or any other products, securities or investments should not be made in reliance on any of the statements in this document. Before making any investment decision, prospective investors should seek advice from their financial advisers, take into account their individual financial needs and circumstances and carefully consider the risks associated with such investment decision. Without limiting any of the foregoing, in no event will the World Gold Council or any of its affiliates be liable for any decision made or action taken in reliance on the information in this document and, in any event, the World Gold Council and its affiliates shall not be liable for any consequential, special, punitive, incidental, indirect or similar damages arising from, related to or connected with this document, even if notified of the possibility of such damages. This document contains forward-looking statements. The use of the words “believes,” “expects,” “may,” or “suggests,” or similar terminology, identifies a statement as “forward-looking.” The forward-looking statements included in this document are based on current expectations that involve a number of risks and uncertainties. These forward-looking statements are based on the analysis of World Gold Council of the statistics available to it. Assumptions relating to the forward-looking statement involve judgments with respect to, among other things, future economic, competitive and market conditions all of which are difficult or impossible to predict accurately. In addition, the demand for gold and the international gold markets are subject to substantial risks which increase the uncertainty inherent in the forward-looking statements. In light of the significant uncertainties inherent in the forward-looking information included herein, the inclusion of such information should not be regarded as a representation by the World Gold Council that the forwardlooking statements will be achieved. The World Gold Council cautions you not to place undue reliance on its forward-looking statements. Except in the normal course of our publication cycle, we do not intend to update or revise any forward-looking statements, whether as a result of new information, future events or otherwise, and we assume no responsibility for updating any forward-looking statements. I104201605 World Gold Council 10 Old Bailey, London EC4M 7NG United Kingdom [email protected] T +44 20 7826 4700 F +44 20 7826 4799 W www.gold.org Published: May 2016
My blog : http://pandacoinscollector.com/
© Copyright 2026 Paperzz