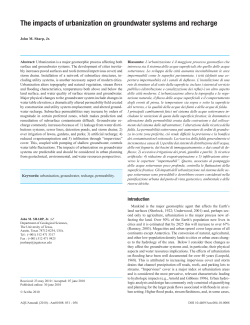
DOI 10.7343/AS-018-13-0042 Technical report Modelling groundwater recharge in an alluvial aquifer of Somaliland with the groundwater flow model YAGmod Modellizzazione della ricarica in un acquifero alluvionale del Somaliland con il modello di flusso idrico sotterraneo YAGMod Laura Cattaneo, Chiara Vassena, Mauro Giudici, Bruno Petrucci Riassunto: Dagli anni ‘70 del XX secolo, il bacino di Ged Deeble (GD) è stato sfruttato per fornire acqua alla città di Hargeisa (Somalia nordoccidentale, Africa orientale, 350000 abitanti). Scopo di questo lavoro è migliorare la comprensione dei meccanismi di ricarica di questo bacino, attraverso la simulazione della circolazione idrica sotterranea, per valutare la sostenibilità degli schemi di sfruttamento attuali e future, che mirano a soddisfare la richiesta di acqua della città di Hargeisha. Per questo obiettivo, i risultati delle attività di esplorazione geologica e idrogeologica svolte in passato sono state utilizzate per ricostruiParole chiave: risorse idriche, acque sotterranee, regioni aride, ricarica degli acquiferi, modellistica matematica. Keywords: water resources, groundwater, arid regions, aquifer recharge, mathematical modelling. LAURA CATTANEO Università degli Studi di Milano Dipartimento di Scienze della Terra “A. Desio” via Cicognara 7, I-20129 Milano, Italy CNR-IDPA (Consiglio Nazionale delle Ricerche, Istituto per la Dinamica dei Processi Ambientali) via Mario Bianco 9, I-20131 Milano, Italy e-mail: [email protected] CHIARA VASSENA Università degli Studi di Milano, Dipartimento di Scienze della Terra “A. Desio”, via Cicognara 7, I-20129 Milano, Italy MAURO GIUDICI Università degli Studi di Milano, Dipartimento di Scienze della Terra “A. Desio” via Cicognara 7, I-20129 Milano, Italy CNR-IDPA (Consiglio Nazionale delle Ricerche, Istituto per la Dinamica dei Processi Ambientali) via Mario Bianco 9, I-20131 Milano, Italy CINFAI (Consorzio Interuniversitario Nazionale per la Fisica delle Atmosfere e delle Idrosfere) c/o Università degli Studi di Milano via Cicognara 7, I-20129 Milano, Italy BRUNO PETRUCCI NGO Africa ’70, Italy Ricevuto: 1 dicembre 2012 / Accettato: 26 febbraio 2013 Pubblicato online: 31 marzo 2013 © Associazione Acque Sotterranee 2013 Acque Sotterranee - Italian Journal of Groundwater (2013) - AS04018: 047 - 057 re l’inquadramento geologico, la forma del bacino, i meccanismi di ricarica e per definire il modello concettuale. Il modello matematico YAGMod, che simula la circolazione idrica sotterranea in condizioni stazionarie e per termini di sorgente e condizioni al contorno che dipendano dall’altezza idraulica, è stato applicato per quantificare i termini del bilancio idrogeologico. Diversi scenari di sfruttamento, accompagnati da una analisi di sensibilità, sono stati esaminati per verificare se la futura richiesta idrica della città possa essere soddisfatta e per fornire indicazioni sull’uso del suolo e la gestione delle risorse idriche. Abstract: Since the 1970’s the Ged Deeble (GD) basin is exploited to supply water to the town of Hargeisa (Somaliland, East Africa, 350,000 inhabitants). The goal of this work is to improve the comprehension of the recharge mechanisms, by the simulation of groundwater flow, in order to assess the sustainability of present-day and future exploitation schemes that aim to satisfy the water demand of the city. For this goal, the exploration activities performed in the past were used to reconstruct the geological framework, the basin shape and the mechanisms of recharge and to define the conceptual model. The mathematical model YAGMod, that simulates groundwater steady flow in presence of head-dependent sources and boundary conditions, was applied to quantify the terms of the groundwater balance. Different management scenarios, accompanied by a sensitivity analysis, have been examined to verify if the future water demand of the city could be satisfied and to provide some indications about the land use planning and the management of water resources. Introduction The city of Hargeisa is located in Somaliland (East Africa, Figure 1) and its population in 2005 was estimated to be about 350,000 people. According to some population projections carried out by UN Agencies, the number of inhabitants of Hargeisa in 2015 might reach 700,000 persons, with a water need of about 40,000 m3/day. Nowadays, the water demand of the city is satisfied by a well field, drilled during the 1970s and 1980s, by a Chinese cooperation, located approximately 30 km North of Hargeisa and by a water transmission pipeline with average discharge of 12,000 m3/ day, from the well field to the town. More recently, from July 2003 to February 2007, the European Commission supported the project “Rehabilitation and Improvement of the Hargeisa Urban Water Supply System” (Project Number: 9 ACP SO 3/41). 47 DOI 10.7343/AS-018-13-0042 The provision of safe, clean and affordable water in the urban centre of Hargeisa is currently undertaken through a semiautonomous, self-accounting, public enterprise, the Hargeisa Water Agency (HWA). The well field is located in the Ged-Deeble (GD) basin, which extends over a surface of about 25 km2. The conceptual model of this basin can be reconstructed thanks to the data that were collected during several geological, geophysical and hydrogeological campaigns and field surveys and are published in reports available on request from international organizations. These data sets show that the GD basin consists of sediments which were deposited in a lacustrine and fluvial environment and filled a structure created by the tectonic evolution of Precambrian crystalline rocks. The data permit to reconstruct a simple conceptual model of the hydrogeological system, which is described in the next section. In order to assess the present-day groundwater balance and to predict whether the future water demand of the city could be satisfied, a mathematical model of the GD hydrogeological basin was developed, using the original code YAGMod (Cattaneo et al. 2012a, 2012b). The model evidenced the importance of terms related to sources that should be activated by the drawdown of the water head due to the intense pumping and allowed to simulate these head-dependent source terms and boundary conditions. The goals of this paper are to discuss the characteristics of the model, to perform a sensitivity analysis, in order to assess the uncertainty on the model outcomes, related to the uncertainty of the input parameters, and finally to provide some forecasts for different exploitation scenarios. These are the steps that are necessary before applying the results of this study to support the future planning of land use and management of water resources within the paradigm of sustainable development. brian crystalline bedrock. From a structural point of view, the basin is the result of the intense tectonic activity that originated the Gulf of Aden rift: it probably formed by two major tectonic trenches, East-West oriented, connected by a long fracture with North-South alignment. The GD basin is crossed by two seasonal wadies: Tog Ged-Deeble and Tog Kalqoray (see Figure 1). A wide outlet was found at the North-East edge which connects the GD basin to the LaasDhuurre-Damal (LDD) basin, whose extension is about 155 km2 (see Figure 2). The Conceptual Model The field data used for this study were mainly collected by some hydrogeologists (B. Petrucci, M. Todeschini and D. Buggiani), during several field campaigns coordinated by the Africa ’70 NGO (non-governmental organization). Within an EU project, some exploration activities were performed from 2003 to 2007, including: a geological study, based on field survey and stratigraphic logs of 12 wells, a geoelectrical campaign with vertical electrical soundings (VES), pumping tests for 8 of the 12 active wells, a continuous monitoring activity prolonged for two years (monthly water production for 12 active wells; monthly rainfall; monthly water levels and electrical conductivity for the 12 wells for withdrawal of water for drinkable purposes, 5 shallow wells and 3 private wells; Buggiani & Petrucci, 2007). The reports containing these data and the GIS projects are available to the public only by request from the Somaliland Ministry of Water and Natural Resources and the EC delegation in Nairobi. The GD basin has an extension of about 25 km2. The aquifer consists of unconsolidated sediments deposited in lacustrine or fluvial environments and is bounded by a Precam- Fig. 1 - Geographical localization of the city of Hargeisa (background map) and localization of the well field and of the two wadis, Tog Kalqoray and Tog Ged Deeble (foreground map). 48 Fig. 1 - Ubicazione geografica della città di Hargeisa (mappa sullo sfondo) e localizzazione del campo pozzi e dei due wadis, Tog Kalqoray e Tog Ged Deeble (mappa in primo piano). Fig. 2 - Localization of the hydrogeological sections of Fig. 3 and 4. Fig. 2 - Localizzazione delle sezioni idrogeologiche delle Fig. 3 e 4 . Acque Sotterranee - Italian Journal of Groundwater (2013) - AS04018: 047 - 057 DOI 10.7343/AS-018-13-0042 Two South-North and West-East hydrogeological sections, see Figures 3 and 4, show that the aquifer system consists of a sequence of sedimentary bodies with different hydraulic conductivities. They lie above the crystalline basement and are covered by a low conductivity layer which is continuous throughout the whole basin, with the exception of some areas close to the wadies, where it was eroded and coarse grained materials were successively deposited. The crystalline basement can be assumed to be impermeable, as a first hypothesis, because direct evidence of the presence of water flow in the fractured basement in the subsurface is lacking. However, the intense tectonic activity that controlled the geological evolution of this basin might have altered the bedrock and produced fractures. The elevation of the bedrock top above the mean sea level has been obtained by interpolating, with the kriging method, not only the data from well stratigraphic logs but also the ground level where the crystalline basement outcrops. The result is shown in Figure 5. The crystalline bedrock extensively outcrops along the eastern border of the study area and delimits the southern and northern borders of the alluvial filling. A large body of crystalline rocks outcrops also along the eastern border of the GD basin and separate the GD from the LDD basin; such a body extends toward South-West, with small and isolated local outcrops. The presence of a widespread ground cover of fine-grained low-conductivity sediments and the fact that the water head in the wells is always higher than the level of the bottom of Fig. 5 - Contour plot of the elevation of the crystalline basement above mean sea level (contour interval: 25 m). Red symbols correspond to points where the basement outcrops, whereas green symbols correspond to borehole or VES data. Blue lines delimit the areas where the crystalline bedrocks extensively outcrops. Fig. 5 - Curve di livello dell’altezza del basamento cristallino sul livello medio del mare (spaziatura: 25 m). I simboli rossi corrispondono ai punti in cui il basamento affiora, mentre quelli verdi corrispondono ai dati da perforazioni o SEV. Le linee blu delimitano le aree di affioramento del basamento. Fig. 3 - Hydrogeological West-East cross section (Section AA). Fig. 3 - Sezione idrogeologica Ovest-Est (Sez. AA). these sediments (Figures 3 and 4), permits to consider the aquifer system as confined. The thickness of the permeable sediments of the aquifer is known only in correspondence of the wells for which the lithological logs are available. From these data, the thickness of the permeable sediments has been computed for each well and has been plotted versus the depth of the bedrock below the ground surface at the corresponding well. The data show a very good linear fit of Sp vs. Db, as evidenced in Figure 6, with the exception of well W08, which was not included in the linear regression. Then the following equation can be applied: Fig. 4 - Hydrogeological South-North cross section (Section BB). Fig. 4 - Sezione idrogeologica Sud-Nord (Sez. BB). Acque Sotterranee - Italian Journal of Groundwater (2013) - AS04018: 047 - 057 49 DOI 10.7343/AS-018-13-0042 Sp=aDb-Sc, where Sp is the thickness of permeable sediments, Db is the depth of the bedrock below the ground surface, Sc is the thickness of the low-conductivity fine-grained-sediment cover, and a is a dimensionless fitting parameter. The linear trend of Sp vs. Db, shown by the litho-stratigraphic log data, is interpreted as a proof that the sediments filled the space opened by the tectonic activity with a succession of fine- and medium-to-coarse- grained materials, which is laterally heterogeneous but with the same rate of alternation between fine- and medium-to-coarse-grained sediments throughout the whole basin. Moreover, on the top of this complex sequence the widespread cover of fine-grained sediments is estimated to have a thickness, Sc, of about 13 m, according to the linear regression shown in Figure 6. This value is in agreement with the hydrogeological scheme shown by the cross sections of Figures 3 and 4. The main mechanisms of aquifer recharge are (1) the infiltration of rain water through the soil and the unsaturated zone and (2) the water percolation in correspondence of the wadies. The coverage of fine-grained material strongly limits the infiltration of rainfall through the soil, whereas the infiltration of water along the wadies courses could be more important, because they could have eroded the shallow impermeable materials and deposited permeable coarse-grained sediments during their recurrent floods. The groundwater head field before water production was reconstructed from the data that have been collected in 1982 by the Chinese cooperation and that correspond to the undisturbed situation under natural condition. The data are not evenly distributed in the area, but are mostly aligned along two lines. Nevertheless, the contour map obtained by kriging (Figure 7) honours not only the measured values, but also, with sufficient accuracy, the no-flow condition along the outcropping basement. The period chosen for model calibration is the year 2005, because the quality of collected data was the best and a com- plete data set is available. Therefore the reference piezometric head for 2005 is obtained by averaging the head data measured during 2005 for each well and other 13 water points, that correspond to relatively shallow private wells, and by the successive spatial interpolation with kriging (Figure 8). The position of the additional water points is shown by the orange diamonds in Figure 9: most of them are located outside the GD basin and therefore they are not represented in Figure 8. The comparison between Figures 7 and 8 shows that under natural conditions, the GD basin was probably feeding the eastern LDD basin, whereas, after the intense aquifer exploitation which started in the 1980s, it has been draining water from it. It should be stressed that the strong hydraulic gradient between wells W07 and W09, especially under natural conditions (Figure 7), is not justified by any geometrical feature of the aquifer, like, e.g., a reduction of its lateral width or of the thickness of permeable sediments, but has to be interpreted as the presence of a low conductivity zone. As the hydraulic gradient did not change significantly after the aquifer exploitation in the southern part, it is necessary to assume that the recharge is not limited to rain and wadies infiltration and, moreover, that it varies with time, in response to the water abstraction. In particular, it is important to notice that wells W03, W04 and W08, located in the southern part of the aquifer, are screened in shallow sediments, near the crystalline bedrock and quite close to the course of Tog Ged-Deeble wadi. Therefore it is expected that the drawdown of the piezometric head produced by these wells causes an increase of the wadi losses and of the leakage through shallow less permeable sediments or probably originated from an underground fracture-fault network. In fact, this is one of the areas where the crystalline bedrock is expected to be mostly altered, as an effect of the intense tectonic activity which produced a family of West-East oriented faults, i.e., perpendicular to the main set of normal faults related to Fig. 6 - Plot of the thickness of the permeable sediments derived from the stratigraphic logs of the wells versus the depth of the bedrock below the ground level. Fig. 6 - Confronto tra lo spessore dei sedimenti permeabili perforati con i pozzi e la profondità del substrato sotto la superficie topografica. 50 Acque Sotterranee - Italian Journal of Groundwater (2013) - AS04018: 047 - 057 DOI 10.7343/AS-018-13-0042 Fig. 7 - Head contours of the reference water head for natural conditions (contour interval : 1 m). Red triangles: location of wells; blue cross: drain. Fig. 7 - Curve di livello dell’altezza idraulica di riferimento in condizioni naturali (spaziatura: 1 m). Triangoli rossi: ubicazione dei pozzi; croce blu: dreno. Fig. 9 - Location of the source and sink terms in the GD basin: Robin boundary conditions (orange dots); drain (green dot); local variable source terms, as fractures or leakage (pink and red - principal sources; brown - secondary sources); wadis (blue and cyan dots); pumping wells (black triangle). Yellow diamonds show the location of the additional water points used to obtain the interpolated reference piezometric head for 2005. Fig. 9 - Ubicazione dei termini di sorgente nel bacino Ged-Deeble: condizioni al contorno di Robin (punti arancio); dreno (punto verde); termini di sorgente locali variabili, come fratture o filtrazione (rosa e rosso – sorgenti principali; marrone – sorgenti secondarie); wadi (punti blu e turchesi); pozzi di prelievo (triangoli neri). I rombi gialli rappresentano l’ubicazione dei punti aggiuntivi utilizzati per l’interpolazione della piezometria di riferimento per l’anno 2005. Acque Sotterranee - Italian Journal of Groundwater (2013) - AS04018: 047 - 057 Fig. 8 - Head contours of the reference piezometric head for year 2005 (contour interval: 1 m). Red triangles: active wells; blue cross: drain; yellow diamonds: additional water points. Fig. 8 - Curve di livello dell’altezza idraulica di riferimento per l’anno 2005 (spaziatura: 1 m). Triangoli rossi: pozzi attivi; croce blu: drain.; rombi gialli: ulteriori punti d’acqua. the regional distensive regime. The presence of minor wadies flowing along the East-West direction is well correlated with these structures. From the hydrogeological point of view, if the water head in the aquifer system is relatively high, as it happens under natural undisturbed conditions, the aquifer and the fractures could be at equilibrium. The realization of pumping wells caused a drawdown of the aquifer water head, so that inflow from the fractured rocks could increase. If such a recharging mechanism were not active, it would be difficult to explain the fact that the hydraulic gradient, and therefore the subsurface water discharge towards the north of the basin, did not significantly change after the realization of the pumping wells. In fact, in absence of an additional source term, the expected lowering of the water head and the corresponding aquifer depletion should be greater than those observed. In order to simulate this process, when the wells are active, local variable recharge sources were introduced for these areas. In the downstream (northern) region, additional water comes from inversion of the exchange flux with the LDD basin, which is flowing out towards the LDD basin, as observed from the water head map under natural conditions (Figure 7), whereas it becomes inflowing to the GD basin when water abstraction in the GD basin is intense (Figure 8). The spatial distribution of the different types of water exchange mechanisms and boundary conditions is shown in Figure 9. With regard to the boundary conditions, the following choices have been taken on the basis of the available data. No flow conditions were prescribed along the border in correspondence of the crystalline bedrock. The Tog Kalqoray out51 DOI 10.7343/AS-018-13-0042 let of the basin, to the North, has been modelled as a drain. The South-East connection between the GD and the LDD basin is considered as a no flow border, because this region is quite narrow and the aquifer thickness is small, less than 15 m. Finally, the most complex portion of the boundary is the North-East edge. This is not a physical boundary, where groundwater head and flow are independent of the groundwater dynamics inside the GD hydrogeological basin, but rather this is the region of groundwater exchange between the GD and the LDD basins. Such a subsurface exchange has been shown to be variable according to the exploitation of the GD aquifer system. Therefore, a Robin boundary condition is assigned, to link the groundwater flow with the head difference between this area and the LDD basin. The Numerical Model The numerical model has been built up using the original code YAGMod (Cattaneo et al. 2012a, 2012b). This code, developed in FORTRAN90, solves the 2D or 3D hydraulic forward problem. The numerical solution of the steady-state balance equation in porous media, which describes the 2D or 3D groundwater flow, is found using the finite difference method with a conservative scheme (Bear 1972, de Marsily 1986, Anderson & Woessner 1992). The level of knowledge of the hydrostratigraphic structure of the site does not permit to identify a 3D hydrostratigraphic scheme and therefore a numerical model of 3D ground water flow could not be developed in a reliable way. For that reason, the aquifer system has been modelled as an equivalent singlelayer aquifer with 2D pseudo-stationary flow, i.e., the physical conditions that represent the average flow over a period longer than an hydrological cycle (Bear 1972, Vassena et al 2011). The domain has been divided into squared cells of 1 ha. The choice of the spacing of the model grid is coherent with the basin extension, its geometry, the data areal density and the goals of the model. In particular, a value of 100 m for the grid spacing has been assumed to be useful, in order to catch some of the features that could be induced by the complex geometry of the border, even if it is much smaller than the distance between measurement points. The hydraulic head of each node (centre of a cell) is considered as a point value. The hydraulic conductivity varies spatially and the values assigned to each node should be considered as effective parameters of the corresponding cell. YAGMod permits to simulate variable sources and sinks, named Local Source Terms, like draining systems, river/aquifer interactions and recharging fractures, with a more general formulation than that used in other software packages. They are modelled with the following equation: (1) where F(loc) (m3/s) is the local contribution of the individual 52 source or sink, which depends on the hydraulic head in the cell h (m); K1 and K2 are the conductances (m2/s), Q1 and Q2 are fixed fluxes into or out of the cell (m3/s), Hact and Hcalc are reference head values (m). In particular, Hact is a threshold which controls the activation of a source/sink or determines which couple of parameters, namely either (Q1,K1) or (Q2,K2), should be used for the computation of the discharge. On the other hand, the source/sink discharge is given by the sum of a fixed flux (Q1 or Q2) and of a term that linearly depends on h and which is computed by using the Hcalc value. Local Source Terms, described by equation (1), were used to model: (a) the Robin boundary conditions at the North-East edge connection with the LDD Basin; (b) the outflow through the drain outlet at North; (c) the inflow from deep fractures located near the crystalline rocky outcrop or due to wadies losses or leakage. For the Robin boundary conditions, two different conductance values are assigned for inflow and outflow. This permits to take into account the differences in the basin geometry, namely the fact that groundwater outflow toward the LDD basin, which is very large, should be “easier” than inflow in the GD basin, which is a closed and relatively small basin. As was explained in the formulation of the conceptual model, the source terms listed under item (c) above, appear to be activated by the high drawdown caused by the four nearest wells (W08, W03, W04, W05). The model considers two types of fractures: (i) the principal fractures (pink and red dots of Figure 9), to which the values of conductances denoted by K_FR1 and K_FR2 are assigned, are located near some of the wells and their presence is mainly interpreted as related to wadies losses or leakage; (ii) the secondary fractures (brown dots of Figure 9), to which the conductance denoted by K_ FR3 is assigned, are located along the crystalline outcrop and they are interpreted as the effect of deep fractures through which an inflow occurs. A small distributed recharge due to rain water infiltration in the plain and a recharge along the two main wadies crossing the study area, the Tog Ged-Deeble and the Tog Kalqoray, have been added as fixed source terms, i.e. independent of water head. The value of rain recharge is computed starting from annual rainfall data, whereas the recharge along the wadies courses has been fixed with the model calibration and is assumed to be independent from the exploitation situation. Model Calibration and Forecasting The model calibration aims at estimating the values of the physical parameters that permit a satisfactory fit between observation and model outcomes. In particular the calibration has been performed by adjusting a few parameters in such a way that the modelled water head was a satisfactory approximation of the reference water head for 2005 and that the model was able to reproduce the basic features of the expected behaviour of the aquifer system under natural undisturbed conditions. Some parameters have been kept fixed, as, first of all, the geometrical characteristics of the aquifer system. Then the waAcque Sotterranee - Italian Journal of Groundwater (2013) - AS04018: 047 - 057 DOI 10.7343/AS-018-13-0042 Tab. 1 - Water pumping rate of the active wells for years 2005 and 2010 and for an hypothetical future scenario of groundwater exploitation. Tab. 1 - Portata dei pozzi attivi per gli anni 2005 e 2010 e per un ipotetico scenario futuro di sfruttamento. Well code 2005 (m3/s) 2010 (m3/s) Forecast (m3/s) W03 0.0070 0.0110 0.0150 W04 0.0100 0.0140 0.0180 W05 0.0110 0.0150 0.0190 W06 0.0040 0.0080 0.0120 W07 0.0110 0.0150 0.0190 W08 0.0140 0.0180 0.0220 W09 0.0090 0.0130 0.0170 W10 0.0120 0.0160 0.0200 W11 0.0070 0.0110 0.0150 PRIVATE WELLS 0.0024 0.0024 0.0024 ter abstraction from the active wells was assigned on the basis of the available measurements (see Table 1). The yearly averaged water abstraction rate for 2005 amounts to 0.0874 m³/s (2.8·106 m³/y). The distributed aquifer recharge due to rain infiltration was assumed to be 5% of the annual rainfall (360 mm), so that a value of 4.57·10-6 m³/s was assigned to each internal cell of the domain. These values are very small and yield a total recharge rate over the whole domain of about 1.2·106 m³/y. The total fixed recharge from wadies amounts to 0.0197 m3/s (6.2·105 m³/y). The drain of the outlet at the northern boundary was considered to have an hydraulic conductance of 4.0·10-4 m²/s and a drainage threshold elevation which is 0.5 m below the observed river level. From the hydrogeological point of view, the domain has been subdivided into five zones characterized by different hydraulic conductivity values (see Figure 10 and Table 2), with a low permeability structure in the central area (K5). Values of hydraulic conductivity have been assigned starting from those obtained from pumping tests (see Table 2). Then, these parameters have been varied with a trial-and-error procedure, because the data distribution and quality prevent from the application of an automatic calibration method. Since the results of a trial-and-error calibration are obviously non unique and subjective, they suffer from some uncertainties, which cannot be estimated with quantitative statistics. This is one of the region for which a quite comprehensive sensitivity analysis has been performed, as discussed in the next section. The modelled water heads for natural conditions and for the year 2005 are represented in Figure 11. The trend of the water head is well reproduced along a South-North profile, using data belonging to wells from W04 to SW04, see Figure 2. In particular the strong hydraulic gradient between wells W07 and W09, which supports the existence of an “hydrogeologic barrier”, that creates a separation between the southern and the northern portions, is clearly apparent, but the modelled gradient is slightly underestimated. Moreover, without the Acque Sotterranee - Italian Journal of Groundwater (2013) - AS04018: 047 - 057 Fig. 10 - Plot of the subzones characterised by different values of hydraulic conductivity (K). See Table 2 for the values of K assigned to each zone. Fig. 10 - Suddivisione in sottozone caratterizzate da diversi valori di conducibilità idraulica (K). Si veda la Tabella 2 per i valori assegnati a K in ciascun sottodominio. Tab. 2 - Values of hydraulic conductivity (in m/s) assigned to the zones drawn with different colours in Figure 10 and results of pumping tests conducted in the corresponding areas. Tab. 2 - Valori di conducibilità idraulica (in m/s) assegnati alle zone disegnate con diversi colori in Figura 10 e dati relativi a prove di portata nelle aree corrispondenti. Zone Model K (m/s) K1 (blue) 5.0 x 10 -4 K2 (cyan) 4.0 x 10 -4 K3 (green) 3.5 x 10 -4 K4 (yellow) 5.0 x 10 -5 K5 (brown) 1.0 x 10 -5 Well code Pumping test K (m/s) W03 2.3 x 10 -4 W06 7.2 x 10 -5 W08 7.7 x 10 -5 W09 1.4 x 10 -4 W10 2.0 x 10 -4 W11 2.2 x 10 -4 W12 6.8 x 10 -5 W04 2.9 x 10 -5 53 DOI 10.7343/AS-018-13-0042 hypothesis of a strong increase of the recharge in the southern part of basin, induced by water abstraction, it is very difficult to fit the field data. From a qualitative point of view this could mean that some of the wells are actually exploiting surface waters, through a complex interaction between the wadies, the fractures and the aquifer. After this calibration, different exploitation scenarios have been examined. From 2005 and 2010, the officially declared extraction rate increased from 6,000 m3/day up to 10,400 m3/ day. On the basis of this remark, two further simulations have been run: the first one corresponds to the declared water abstractions for 2010 and the second one considers a scenario for which the water abstraction increased to 13,500 m3/day (Table 1). The results, represented in Figure 13, show that a dramatic drawdown occurs if water pumping increases: this is graphically shown in the maps of Figure 13 by the increased extension of the turquoise zone, which corresponds to a lowering of the water head, in the right map, which refers to the future hypothetical scenario. In other words, the water resources of the GD basin are not sufficient to sustain the current ground water abstraction and part of the pumped water comes from the eastern LDD basin. This is a warning against the possibility of increasing the long lasting abstraction rate in a sustainable way. Fig. 11 - Contour plots of the modelled water head for natural conditions (left) and for year 2005 (right) (contour interval: 1 m). Fig. 11 - Curve di livello del carico idraulico modellate per le condizioni naturali (sinistra) e per l’anno 2005 (destra) (spaziatura: 1 m). Fig. 12 - Comparison between observed hydraulic head in wells and modeled obtained values for undisturbed condition (up) and for the year 2005 (down). Fig. 12 - Confronto tra i valori di altezza piezometrica osservati nei pozzi e i risultati ottenuti con il modello per la condizione indisturbata (sopra) e il 2005 (sotto).. 54 Acque Sotterranee - Italian Journal of Groundwater (2013) - AS04018: 047 - 057 DOI 10.7343/AS-018-13-0042 Fig. 13 - Contour plots of the modelled water head for year 2010 (left) and for a hypothetic future scenario of aquifer exploitation (right) (contour interval: 1 m). Fig. 13 - : Curve di livello del carico idraulico per l’anno 2010 (sinistra) e per un ipotetico futuro scenario di sfruttamento dell’acquifero (destra) (spaziatura: 1 m). Sensitivity Analysis The calibration of the mathematical model was quite difficult for the uncertainties on the old data, so that the input model parameters could not be estimated with high precision and reliability and with an automatic inversion algorithm. Therefore, a sensitivity analysis (Saltelli et al. 2008, Hill and Tiedeman 2006) has been conducted for both data sets (years 2005 and 2010). The procedure which has been applied for this study was originally proposed by Baratelli et al. (2012) and Giudici et al. (2012) for a complex non-linear model for the thermomechanical evolution of the Antarctic ice-sheet and it is applied also by De Filippis et al. (2012) to the model of a coastal fractured aquifer. Such a procedure aims at reducing the computational effort which is necessary for the Monte-Carlo approach to sensitivity analysis, which requires a large number of runs of the simulation model with different input values. See Ciriello et al. (2012) for an approach based on the model reduction with polynomial chaos expansion. The simplified procedure, which was proposed by Baratelli et al. (2012) and Giudici et al. (2012) and is applied in this paper, approximates the dependence of the model outcome on the input parameters with a second order expansion in a neighborhood of the calibrated reference values of the input parameters. Ten input parameters (X) were considered: the hydraulic conductivities of the five subdomains (K1, K2, K3, K4, K5) shown in Figure 10, the conductances for inflow and outflow at the Robin boundary conditions (Kin, Kout) and the conAcque Sotterranee - Italian Journal of Groundwater (2013) - AS04018: 047 - 057 ductances of the Local Source Terms, due to wadies losses or deep fractures (K_F1, K_F2, K_F3), which correspond to pink, red and brown dots, respectively, in Figure 9. The model outcomes (Y) considered in the sensitivity analysis are: the hydraulic head of single wells (from W03 to W12, SW04, BH7), average absolute and root mean square difference between modelled and observed head data (Aver_Abs_ dif, RMS_dif), modelled fluxes (outflow through the drain at North – Q_drain; inflow through fractures and wadies losses – Q_Fr1, Q_Fr2 and Q_Fr3; exchanges between the GD and LDD basins – Q_RC_in, Q_RC_out). Two different sensitivity indicators have been calculated. The normalized sensitivity index (2) Takes into account the variability of Xi and Y by means of their standard deviations σXi and σY. The first-order sensitivity index is defined as: (3) where EX-i[Y|Xi] is the expected value of the model outcome conditioned on the parameter Xi and varXi is the variance with respect to Xi. This index takes into account the total variability of the input parameters. Expected values and variances of (2) and (3) have been com 55 DOI 10.7343/AS-018-13-0042 puted with a second-order expansion of the Y(X1,X2,…,XN) relationship around the reference value and by assuming a uniform distribution around such a value. The results are shown in Figures 14 and 15: the normalized and the firstorder sensitivity indexes lead to the same conclusions. Hydraulic heads of single wells are principally affected by the variability of the conductivities of the subdomain, which they belong to. By looking to global effects on the modeled area, K3 and K5, the conductivity values of the region between W09 and W12, where the domain becomes narrow, affects all the considered model outcomes, although at a different degree. K_out, the conductance of outflow for the Robin boundary conditions at the border with the LDD basin, yields the highest values for the sensitivity indexes, in particular for the inflow and outflow fluxes across the boundary with the LDD basin (Q_RC_in and Q_RC_out), for the outflow through the drain (Q_drain) and for the recharge related to fractures and wadies losses (Q_FR1, Q_FR2 and Q_FR3). The results are quite similar for 2005 and 2010, even if the variation of the volume of water pumped in a year yielded different groundwater flow fields from 2005 to 2010; as a consequence, it is reasonable to suppose that the values of the sensitivity indexes are quite independent of the groundwater abstraction. Fig. 14 - Normalized sensitivity index computed for the simulations corresponding to the years 2005 (top) and 2010 (bottom). Fig. 14 - Indice di sensibilità normalizzato calcolato per le simulazioni relative agli anni 2005 (alto) e 2010 (basso). 56 Fig. 15 - First-order sensitivity index computed for the simulations corresponding to the years 2005 (top) and 2010 (bottom). The values, ranging from -1 to +1, are drawn with a colour scale from red to blue. Fig. 15 - Indice di sensibilità al primo ordine calcolato per le simulazioni relative agli anni 2005 (alto) e 2010 (basso). I valori, variabili tra -1 e +1, sono rappresentati con una scala di colore dal rosso al blu. Conclusions The study of the GD hydrogeological basin showed that the aquifer recharge comes from several sources, which include rain infiltration through the soils and the poorly permeable shallow sediments and wadies losses. The development of the conceptual model and the calibration of the simulation model required also the hypothesis that other mechanisms are active to recharge the aquifer and that the corresponding fluxes depend on the water head. In particular, these sources are supposed to depend on the fracturing of the crystalline bedrock, which could permit inflow into the GD alluvial basin. Similar mechanisms of recharge were proposed for hydrogeological basins of Oman and Abu Dhabi (United Arab Emirates) by Osterkamp et al. (1995). Testing this hypothesis requires a better knowledge of the structural setup of the basin, in order to improve the estimate of the areas characterized by fractures in the crystalline basement and the potential flow paths. At the moment, the quantification of the fluxes through the fracture network was obtained from model calibration, but still remains quite uncertain. Moreover, the physical characteristics and the hydraulic behaviour of the fracture network is still debatable. Another important mechanism of recharge is the percolation in areas along the wadies. A better estimation of these sources would require to improve the piezometric survey, with a more uniform spatial distribution throughout the whole basin and close to the wadies. The sensitivity analysis shows that the model outcomes are most sensible to the conductivity values of the central region Acque Sotterranee - Italian Journal of Groundwater (2013) - AS04018: 047 - 057 DOI 10.7343/AS-018-13-0042 of the GD basin, where the domain becomes narrow, and to the conductance of outflow for the Robin boundary conditions at the North-East border with the LDD basin. Despite the uncertainties related to the available data sets, the model developed with this work permits to raise some important conclusions from the point of view of the resource management. In fact, it appears that the GD basin alone cannot satisfy the future water demand of the city without a further, more dramatic aquifer depletion. The present-day exploitation scheme has changed the relationship between the GD and the LDD basins: in fact, under natural conditions, the GD basin fed the LDD basin, whereas the strong groundwater abstraction now withdraws water from the LDD basin. Therefore, different exploitation strategies should be planned to support the growth of the city water demand in a sustainable way, i.e., without depleting the GD basin: a possibility could be the shift of the production from the wells in the southern section to those located in the northern one or even to those drilled in the wide LDD basin. References Anderson M.P., Woessner W.W. (1992). Applied groundwater modeling. Academic, San Diego, CA. Baratelli F., Giudici M., Vassena C. (2012). A sensitivity analysis for an evolution model of the Antarctic ice sheet. Reliability Engineering and System Safety doi:10.1016/j.ress.2011.07.003. Bear J. (1972). Dynamics of Fluids in Porous Media (Dover Civil and Mechanical Engineering). American Elsevier Publishing Company, Inc. Buggiani D., Petrucci B. (2007). Rehabilitation and Improvement of the Hargeisa urban water supply system, Hydrological mission report. Cattaneo L., Giudici M., Vassena C. (2012a). Modeling groundwater flow in heterogeneous media with YAGMod, Abstract FLOWPATH 2012 Percorsi di Idrogeologia, I edizione, Bologna. Cattaneo L., Vassena C., Giudici M. (2012b). YAGMod - Yet Another Groundwater flow Model. Under preparation. Ciriello V., Di Federico V., Riva M., Cadini F., De Sanctis J., Zio E., Guadagnini A. (2012). Polynomial chaos expansion for global sensitivity analysis applied to a model of radionuclide migration in a randomly heterogeneous aquifer. Stoch. Environ. Res. Risk Assess. DOI:10.1007/s00477-012-0616-7 De Filippis G., Giudici M., Margiotta S., Mazzone F., Negri S., Vassena C. (2013). Numerical modeling of the groundwater flow in the fractured and karst aquifer of the Salento peninsula (Southern Italy). Acque Sotterranee-Italian Journal of Grondwater Vol.131 pp.17-28; DOI: 10.7343/AS-016-013-0040 de Marsily G. (1986). Quantitative Hydrogeology. Academic, Orlando, FL. Giudici M., Baratelli F., Castellani G., Vassena C. (2012). Modeling the Antarctic ice sheet and ice shelves: assessing the effects of uncertainty on the model parameters by sensitivity analysis. In: Ice Sheets: Dynamics, Formation and Environmental Concerns (Müller J. and Koch L., Eds.), 121-142. Nova Science Publishers, Inc., Hauppauge, N.Y. Harbaugh A.W.(2005) MODFLOW-2005, The U.S. Geological Survey Modular Ground-Water Model—the Ground-Water Flow Process, User Guide, USGS. Hill M, Tiedeman C. (2006). Effective groundwater model calibration: with analysis of data, sensitivities, predictions and uncertainty. John Wiley & Sons. Saltelli A., Ratto M., Andres T., Campolongo F., Cariboni J., Gatelli D. (2008). Global sensitivity analysis – the primer. Chichester, UK: John Wiley & Sons. Osterkamp W. R., Lane L. J., Menges C. M. (1995). Tecniques of ground-water recharge estimates in arid/semi-arid areas, with examples from Abu Dhabi, Journal of Environments, 31: 349-369. Vassena C., Rienzner M., Ponzini G., Giudici M., Gandolfi C., Durante C., Agostani D. (2011). Modeling water resources of a highly irrigated alluvial plain (Italy): calibrating soil and groundwater models. Hydrogeology Journal, DOI:10.1007/s10040-011-0822-2 dal 1953 RAGIONIERI LORIANO di Ragionieri Alessandro cell: 337 689440 Grazie alla passione tramandata dal suo fondatore Loriano garantiamo un servizio competente e professionale, sia nel settore pubblico sia in quello privato. Lavoriamo creando soluzioni di grande pregio tenendo sempre nella massima considerazione sia le esigenze del cliente che il rapporto qualità/costi. L’azienda cresce e si sviluppa nei seguenti settori: • trivellazione pozzi artesiani, di piccolo e grande diametro e su tutte le tipologie di terreno • pozzi a sterro • realizzazione di sondaggi, • palificazioni e micropali • installazione di pompe elettriche sommerse. Ragionieri Loriano via Francesca 2646 51036 Larciano (PT) Tel/Fax 0573 84186 Cod Fisc: RGNLSN69C18D815Z P.IVA 01661740470 Acque Sotterranee - Italian Journal of Groundwater (2013) - AS04018: 047 - 057 [email protected] www.trivellazioniragionieri.com 57
© Copyright 2026 Paperzz