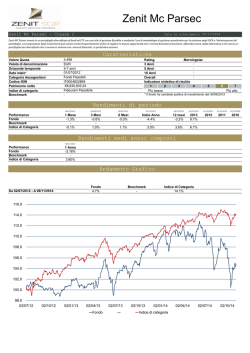
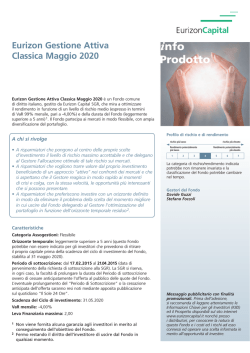
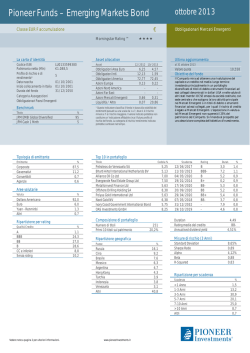
Fabio Agosta Head of Sales - Southern Europe & Middle East Key Asset Management - SEB Wealth Management Modello ALM: come le logiche g di investimento a ritorno assoluto aiutano a massimizzare gli obiettivi di lungo periodo S tt b 2010 Settembre Sommario Modello ALM: evoluzione del processo Logica total return I fondi pensione a livello internazionale 2 Modello ALM: evoluzione del processo p Modello ALM: evoluzione del processo Modello ALM tradizionale: Consiglio Consulente Analisi ALM Allocazione suddivisa tra azioni e obbligazioni g Azioni Obbligazioni Allocazione verso le altre asset class utilizzando tecniche qualitative e quantitative Immobiliare Altri investimenti Allocazione geografica Gestione attiva/passiva Stile di gestione Selezione del gestore Scelta Cli t Cliente 4 Modello ALM: evoluzione del processo Modello ALM evoluzione: Allocazione rischio/rendimento Analisi ALM Portafoglio growth Diversificazione del rischio di mercato Ricerca alfa Azioni, bond, immobili, commodity.... Cambi, fondi hedge, altre strategie a rendimento assoluto Selezione gestore Selezione gestore Risk management/ liability matching Bond e swap Altri strumenti di copertura Selezione gestore 5 Logica g total return Logica total return Diverse definizioni di investimenti total return: Definizione storica, dotata di piu’ impatto commerciale: Strategia in grado di ottenere rendimenti positivi indipendentemente dall’andamento del mercato Definizione più precisa e attuale: Strategia che non ha un benchmark, ma da’ al gestore maggiore liberta’ Fondi a Benchmark Fondi Total Return Rendimento rispetto al benchmark Rendimento assoluto Delega di gestione limitata Delega di gestione ampia, dati un obiettivo di rendimento e volatilita’ Tecniche gestionali replicabili Tecniche gestionali evolute, mutuate da industria hedge, ma in un contesto piu’ regolamentato 7 Logica total return Vantaggi fondi total return: Assenza benchmark Possibilita’ performance in mercati negativi Delega al gestore ampia Importante la selezione del manager piu’ che asset allocation Gestione evoluta Difficilmente replicabile con strumenti passivi Piu’ ottimizzante la ricerca di: Alfa Decorellazione 8 Logica total return Indici di mercato: 140% 120% 100% 80% 60% 40% 20% 0% -20% MSCI World Euro JPM Glb Gov Bonds Euro Jan n-2010 Jan n-2009 Jan n-2008 Jan n-2007 Jan n-2006 Jan n-2005 Jan n-2004 Jan n-2003 Jan n-2002 Jan n-2001 Jan n-2000 Jan n-1999 Jan n-1998 -40% HFRX Equal Weighted Come proxy di un indice total return si e’ utilizzato l’indice HFRX Equal Weighted Fonte: Bloomberg 9 Logica total return Portafogli bilanciati: Inserendo la componente total return il portafoglio migliora il profilo rischio/rendimento 100% 80% 60% 40% 20% Portafoglio (33% Equity, 33% Bond, 33% Total Return) Jan-2010 Jan-2009 Jan-2008 Jan-2007 Jan-2006 Jan-2005 Jan-2004 Jan-2003 Jan-2002 Jan-2001 Jan-2000 Jan-1999 Jan-1998 0% Portafoglio (50% Equity, 50% Bond) MSCI World Euro JPM Glb Gov Bonds Euro HFRX Equal Weighted Portafoglio (33% Equity, 33% Bond, 33% TR) Portafoglio (50% Equity, 50% Bond) Rendimento Annualizzato 1.15% 5.99% 5.18% 4.39% 3.96% Rendimento Cumulato 15.27% 105.91% 87.11% 70.42% 61.88% Deviazione Standard 16.65% 7.18% 5.31% 7.30% 9.34% Drawdown -55.38% -8.14% -23.55% -27.23% -30% Fonte: Bloomberg Both portfolios have been compiled by Key Asset Management (UK) Limited and are based on composite of the MSCI World EUR , JPM Global Government Bond EUR and the HFRX Equal Weighted EUR 10 I fondi pensione a livello internazionale I fondi pensione a livello internazionale P 7* Stati Uniti 70% 70% 60% 60% “Altro”” comprende: “Alt d investimenti total return e immobiliari 50% 40% 50% 40% 30% 30% 20% 20% 10% 10% 0% 0% Equity Bond 1999 Altro 2004 Cash 2009 Bond 1999 Regno Unito 80% Equity 2004 Cash 2009 Giappone 70% 70% Altro 60% 60% 50% 50% 40% 40% 30% 30% 20% 20% 10% 10% 0% 0% Equity Bond 1999 2004 Altro 2009 Cash Equity Bond 1999 Altro 2004 Cash 2009 * I 7 paesi con il sistema pensionistico piu’ sviluppato sono: Australia, Canada, Giappone, Paesi Bassi, Regno Unito, Stati Uniti e Svizzera Fonte: Tower Watson 2010 12 I fondi pensione a livello internazionale Svizzera Paesi Bassi 60% 60% 50% 50% % 40% 40% 30% 30% 20% 20% 10% 10% 0% 0% Equity Bond 1999 Altro 2004 2009 Cash Equity Bond 1999 Altro 2004 Cash 2009 La classificazione “altro” identifica le strategie total return e immobiliare La diversificazione in strumenti alternativi, in particolare nelle strategie total return, continua a crescere dal 1999 Nel campione P7, ll’esposizione esposizione in strumenti alternativi pesa fino al 20% nei portafogli dei fondi pensioni piu’ sviluppati Fonte: Tower Watson 2010 13 Conclusioni Il processo di ALM e’’ diventato di t t piu’ i ’ evoluto l t e ora considera id sempre di piu’ i ’ l’investimento l’i ti t total t t l return t come una strategia indipendente (pagg 4 - 5) In una prima fase la logica total return, o a rendimento assoluto, e’ stata erroneamente proposta come soluzione l i a tutti t tti i problemi bl i (rendimento ( di t positivi iti i indipendentemente i di d t t dalle d ll condizioni di i i di mercato), ha quindi disilluso le aspettative dell’investitore (pag 7) La logica total return ha dei vantaggi rispetto alle strategie a benchmark che la portano verso una maggiore i ricerca i di alfa lf e decorellazione d ll i ( (pag 8) Simulazioni provano che inserendo in un portafoglio bilanciato una componente total return il profilo rischio/rendimento migliora (pagg 9 - 10) Analizzando i 7 paesi con il sistema pensionistico piu’ sviluppato si evidenzia che l’unica asset class in costante e continua crescita e’ quella che comprende gli investimenti total return (pagg 12 - 13) 14 Note legali SEB This material is provided at your request for informational purposes only. It is not an offer or solicitation to buy or sell any securities. THIS MATERIAL DOES NOT CONSTITUTE AN OFFER OR SOLICITATION IN ANY JURISDICTION WHERE OR TO ANY PERSON TO WHOM IT WOULD BE UNAUTHORISED OR UNLAWFUL TO DO SO. Prospective investors should inform themselves as to any applicable legal requirements and taxation and exchange control regulations in the countries of their citizenship, residence or domicile which might be relevant. Past performance is not indicative of future results, which may vary. The value of investments and the income derived from investments can go down as well as up. Future returns are not guaranteed, and a loss of principal may occur. Opinions expressed are current opinions as of the date appearing in this material only. No part of this material may, without SEB’s prior written consent, be (i) copied, photocopied or duplicated in any form, by any means, or (ii) distributed to any person that is not an employee, officer, director, or authorised agent of the recipient. References to indices, benchmarks or other measures of relative market performance over a specified period of time are provided for your information only and do not imply that the portfolio will achieve similar results. The index composition may not reflect the manner in which a portfolio is constructed. While an adviser seeks to design a portfolio which reflects appropriate risk and return features, portfolio characteristics may deviate from those of the benchmark. The portfolio risk management process includes an effort to monitor and manage risk, but does not imply low risk. The strategy may include the use of derivatives. Derivatives often involve a high degree of financial risk because a relatively small movement in the price of the underlying security or benchmark may result in a disproportionately large movement in the price of the derivative and are not suitable for all investors. No representation regarding the suitability of these instruments and strategies for a particular investor is made. This information may not be current and SEB has no obligation to provide any updates or changes. It should not be relied upon in making an investment decision. H ldi Holdings may change h b by th the ti time you receive i this thi report. t The Th securities iti discussed di d do d nott representt allll off th the portfolio's tf li ' h holdings ldi and d may representt only l a smallll percentage t off th the strategy’s portfolio holdings. A complete list of holdings is available upon request. Future portfolio holdings may not be profitable. The information should not be deemed representative of future characteristics for the strategy. 15
© Copyright 2026 Paperzz