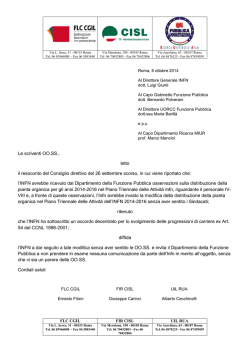
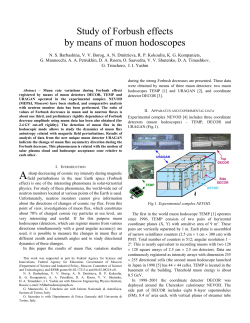
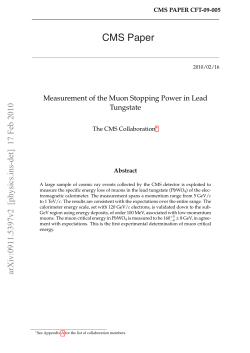
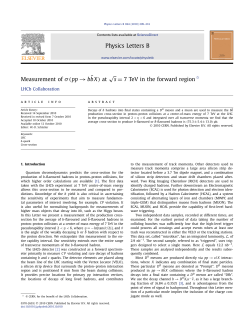
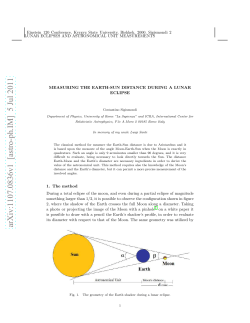
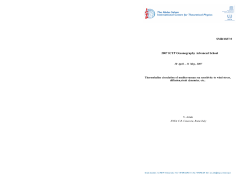
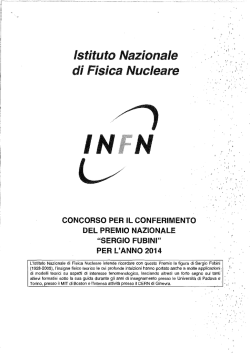
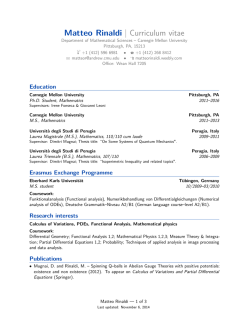
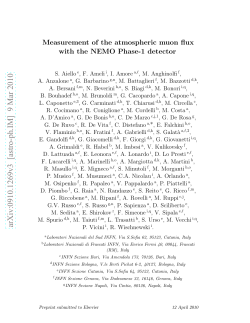
sxg___
IUCLEAR PHYSIC5
PROCEEDINGS
SUPPLEMENTS
ELSEVIER
Nuclear Physics B (Proc. Suppl.) 61B (1998) 180-184
Performance of the MACRO Detector at Gran Sasso:
Moon shadow and seasonal variations
The MACRO collaboration *
presented by N. Giglietto
The MACRO underground detector at Gran Sasso has recorded about 30 million muon events in the period
1989-1995. We have analyzed these data to look for time variations and to study the pointing capabilities of
the apparatus in the search for astrophysical point sources. We have observed a 3% seasonal variation of the
high energy muon rate, due to atmospheric temperature variations, in agreement with theoretical predictions.
We report also the detection of the moon shadowing effect with a statistical significance of 3.7 a. The results
obtained straighten the possibility that a "muon astronomy" using underground experiments is possible.
1. I N T R O D U C T I O N
One of the pecularity of M A C R O as a muon
telescope is its excellent angular resolution.
Moreover, it has a large collecting area and thus
relatively large statistics when compared to other
deep underground detectors.
We present an
update of the results on the study of atmospheric
effects on the underground muon flux recorded by
our detector [3]. It is also i m p o r t a n t to establish
the pointing accuracy of the apparatus. We have
therefore looked for the shadow of the Moon cast
by high energy p r i m a r y cosmic rays, which for
MACRO have E>12 TeV. The analysis confirms
the good pointing capability of the detector and
gives confidence in M A C R O ' s ability as a muon
telescope.
2. S E A S O N A L
VARIATIONS
OF THE
UNDERGROUND
MUON FLUX
Underground muons originate primarily from
the decay of mesons produced in high energy
interactions between p r i m a r y cosmic rays and
atmospheric nuclei. As shown decades ago [1,
2], fluctuations in atmospheric t e m p e r a t u r e lead
to variations in the muon intensity observed
at ground level and underground.
However,
there have been relatively few experimental
underground measurements of these effects and
those that have been made were not always in
*see last p a g e for t h e c o m p l e t e a u t h o r list
0920-5632/98/$19.00 © 1998 Elsevier Science B.V. All rights reserved.
PlI S0920-5632(97)00559-8
agreement with theory [1,2].
Because of its large collecting area and great
depth, MACRO is a powerful tool to investigate
the atmospheric t e m p e r a t u r e effects on the
underground muon rate, although the expected
amplitude is of few percent. D a t a were collected
during a 4 year period starting in J a n u a r y
1991, when all the six lower supermodules with
streamer tubes became operational.
Specific cuts are used to remove systematic
effects on the evaluation of the muon rate. Fig.
1-a shows the monthly variations of the muon
counting rate.
The effect has been analyzed assuming the
relation:
AR,
-~,
ATe::
-
aT
-Tel!
'
(1)
where we have introduced
an "effective
temperature" Tel: that takes into account the
non-uniform variation of the t e m p e r a t u r e along
the entire atmospheric mass column above the
detector. TeII is obtained via a weighted average
of the temperatures measured at different isobaric
levels
To::
(2)
=
i
C~T is a t e m p e r a t u r e coefficient. We have chosen
for w(i) the expression:
exp-h(O/A/h(i)
wi = E i exp-h<i)lX /h(i) '
(3)
A~ Giglietto/Nuclear Physics B (Proc. Suppl.) 61B (1998) 180 184
with A = 160 g/cm~[3].
The temperature data were provided by the
Ispettorato Telecomunicazioni ed Assistenza Volo
dell'Aeronautica Italiana. For the years 19911993, the data were obtained at 7 atmospheric
depths (700 g / c m 2, 500 g / c m ~, 300 g / c m 2, 150
g/cm ~, 70 g/cm 2, 45 g/cm ~, 35 g / c m 2, 25 g/cm ~)
four times daily: Oh, 6 h, 12 ~ and 18 h. In 1994,
there were only two flights per day, for most of
the year, at 11 h and 23 h. The depth sampling
during these flights however was much finer. To
be consistent with the previous years we used only
data at depths < 700 g / c m ~.
181
The total number of single muons analyzed in
the period 1991-1994 is 5.3 × 10⁶ after run cuts.
We computed for each month the mean value of
the effective temperature. In Fig. la-b are shown
the monthly rate values of ATell = T~ll T~ll,
where Tell is the mean effective temperature and
Tell : 217.8K the average effective temperature
computed for the complete data set.
-
Percent Variationsin Muon Rate ~md Temperature
Mno~ Rte
4 ¸
*
4
Tern~tom o
,
82
.
'
Monthly Variations in Muon Rate
,,
'
1
I
i
i
+
,+
;
+T~-~-;.
-e-
~-
-41
-E
.....
1991
. . . . .
. . . . .
1992
.....
1993
................
1994
Figure 1. a) Monthly variations in the muon rate,
A R u = (Ru - Ru). R u is the monthly rate and
Ru = 364.8 muons/hr is the average monthly rate
computed for the December 1992-1994 data set.
The errors are dominated by statistical errors in
the rates.
s
X
-4
i
,
i
,
,
i
,
,
I
1993
.<I
-2
~
i
i
i
i
t
i
i
J
,
i
1994
Figure 2. The superposition of the percentage
monthly variations in the muon rate, ARu/R~,,
(%), and the average monthly variations in the
effective temperature, ATell/Tell (%) for the
December 1992-1994 data set.
In Figure 2 we superpose the percentage
variations in the effective temperature onto the
percentage fluctuations in the muon rate.
Monthly VariationsinTemperature
Percent Vmiations in Muo~ Rate m~dTemperature - 4 Y e ~ Average
......
+ ................
...........
....................
Muoa Pale t
'rer~oen~m o
2
2
t>
Ilii :
+ + +I
....
L,~ o
•
1992
1993
1994
Figure 1. b) Monthly variations in the effective
temperature, ATell : ( T e l l - Tell), where
Tell is the average monthly effective temperature
distribution and Tell : 217.8K is the mean
effective temperature for the complete data set
(1991-1994). The errors on the data points are
taken as the standard deviations in the Tell
distribution for that month.
--
"
---L-.__~_
....................... •)
"t----...' ........................................... L..~
..--~__...-~ ...
;
-2
1991
~__.
......................
*
:
0~
-t x
--4-----r-,
-2
8
,
Figure 3. The superposition of the percentage
monthly variations in the muon rate, ARu/Tlm,~
(%), and of the percentage monthly variations in
the effective temperature, AToll/Tel I (%) for
the total data set, 1991-1994
N Giglietto/Nuclear Physics B (Proc. Suppl.) 61B (1998) 180-184
182
To quantify the significance of the correlation
in Fig. 3, we have computed both the correlation
coefficient and the chance probability that the
variations in the muon rate and the effective
t e m p e r a t u r e are uncorrelated (null hypothesis).
The regression analysis of the available monthly
d a t a yields aT = 0.98 + 0.12 in the total d a t a
set. The value of the t e m p e r a t u r e coefficient
O~T/Tmr! x 100 ~ 0.45-4- 0 . 0 6 % / K is consistent
with theoretical expectations [1,4].
3. M O O N
SHADOWING
EFFECT
To demonstrate the pointing accuracy of
MACRO, we have searched for the shadow of the
Moon in high energy primary cosmic rays. The
analysis of 30 × l06 single muons recorded from
1989 to 1995 has been performed in two ways: the
first one is a classical approach, the second one is
a m a x i m u m likelihood method. The first method
consist in a comparison between the density of
the observed events versus the angular distance
from the center of the calculated Moon position,
and a simulated event distribution[5] . The result
of this analysis is shown in Fig. 4.
,.
..........
[~we
observed deficit at 0.6 o is equal to 98 events on a
background of 700 -4- 26 events (3.7 a) while the
deficit within 1° is 120 events on a background of
1170 4-46 events (2.85 ~r).
The second analysis was done in two dimensions using the m a x i m u m likelihood m e t h o d of
COS-B [6]. This method is based on the a
priori knowledge of the point-spread function and
searches for a source of unknown intensity, in this
case a source of negative intensity.
The intrinsic angular resolution of the detector
is 0.2°[7].
However the multiple Coulomb
scattering in the rock overburden introduces an
energy dependent spread of the muons with
respect to the original direction. The overall
spread has been estimated from the distribution
of the angular separation of double muons; the
overall angular resolution is about 1° .
The analysis was done on 72 different windows
containing each 17 by 17 bins (0.25 degrees wide
in equatorial coordinates): the first window is
centered on the instantaneous position of the
moon (a,~oo,,, 5moo,,); the others are displaced by
5 ° , thus covering the entire range of 3600 .
We have calculated, for each bin, the
likelihood function for the poissonian process [8]:
~:(x,, ys, I,) =
I~mu~,d
IO
2Z
70
Nth-N°b"
+
In\Art hI
,
(4)
i----1
where N~ bs is the number of the observed events
in each bin and N th is given by the expression:
:I
N th = N back + Is • PSF~:.,u. (xi, Yi)
I0
o
. . . .
o
|
~
. . . .
i
I
. . . .
i
1.5
,
.
,
,
i
1
. . . .
13
Figure 4. Muon event density observed vs the
angular distance from the Moon; the simulated
expected events (dashed line) are superimposed
The m a x i m u m deviation occurs at 0.25°; the
(5)
being N back is the calculated number of
background events in each bin, P S F ( x , y ) the
point spread function and Is the intensity of a
possible source at (x,, Y,). For each bin the most
likely intensity of a source in t h a t position is
obtained by minimizing £: and varying Is as a
free parameter.
The probability of a background fluctuation
is theoretically given by the cumulative X 2
distribution with one degree of freedom for A =
~g(5, 6, O) - £ ( 5 , ~, I ~ in) with
A~ Giglietto/Nuclear Physics B (Proc. Suppl.) 61B (1998) 180-184
A contour plot of the A variable for the moon
window is shown in Fig. 5. The maximum value
is ~ = 14.2 (3.7o') on the position (-0.250,0. °)
where is the maximum deficit. The observed
displacement is compatible both in value and
in the direction with the displacement of the
primary protons due to the geomagnetic field.
183
arrival distribution of muons about the nominal
position of the moon (0.250 displaced) with a
significance of 3.7 ~ both in the one-dimensional
and two-dimensional analyses showing also a
good statistical consistency between the two
methods.
REFERENCES
1.5
1
0.5
0
-0.5
-1
©
--1.5
A
-2
-2
- 1.5
- 1
-0.5
0
0.5
~
1.5
2
X dlatrlb~kan
Figure 5. X2 values in the window centered on
the moon, obtained by the maximum likelihood
procedure. Four levels are shown starting from
X2 = 3 with a step of 3. The maximum value of
X2 = 14.2 is in the position (-0.25°,0 °)
Since we find only 1 bin in the other 71
windows, having A > 14.2, the a p r i o r i
probability of finding a fluctuation that mimics
the shadow of the moon in the expected position
is 0.02%, a result consistent with the significance
level given by the first analysis.
4. C O N C L U S I O N S
The determination of the positive temperature
coefficient for atmospheric effects on the muon
intensity recorded by MACRO appears to be
consistent with the expectations.
We have found evidence of a deficit in the
1. Barrett, P.H., et al., Rev. Mod. Phys. 24
(1952) 133.
2. Dorman, L.I., Cosmic Ray Variations,
translation by US Air Force Tech. Doc. Liason
Office (1987)
3. Ahlen, S. et al. (MACRO coll.), Proc. 24th
ICRC (Rome 1995), 1,582.
4. Volkova, L.V., and Zatsepin, G.T., Soviet J.
Nucl. Phys., 12 (1971) 191.
5. D.E. Alexandreas et al., Phys. Rev. D 43,1735
(1991).
6. Pollock, A.M.T., et al., Astron. Astrophys. 94
(1981) 116.
7. Ahlen, S., et al. (MACRO Collaboration)
Nucl. Instr. Meth. A324 (1993) 337.
8. L. Montanet et al., Review of Particle
Properties, Phys. Rev. D 50 1994,1173-1823.
i~ Giglietto/Nuclear Physics B (Proc. Suppl.) 61B (1998) 180 184
184
The MACRO
Collaboration
M. Ambrosio 12, R. Antolini 7, G. Auriemma 14'~,
R. Baker 11 , A. Baldini 13, G. C. Barbarino 12, B.
C. Barish 4, G. Battistoni 6,b, R. Bellotti 1, C.
Bemporad 13, P. Bernardini l°, H. Bilokon 6, V.
Bisi 16, C. Bloise 6, T. Bosio 7, C. Bower s, S.
Bussino 14, F. Cafagna 1, M. Calicchio 1, D.
Campana 12, M. Carboni 6, M. Castellano 1, S.
Cecchini 2,c, F. Cei l~,d, V. Chiarella 6, A.
Corona TM, S. Coutu 11, L. De Benedictis 1, G. De
Cataldo 1, H. Dekhissi 2,e, C. De Marzo 1 , I. De
Mitri 9, M. De Vincenzi 14J , A. Di Credico ~, O.
Erriquez I , R. Fantini 2, C. Favuzzi I , C. Forti 6, P.
Fusco 1, G. Giacomelli 2, G. Giannini 13'g, N.
Giglietto 1, M. Goretti 4,14, M. Grassi 13, P.
Green m , A. Grillo 7, F. Guarino 1~, P.
Guarnaccia 1, C. G u s t a v i n J , A. Habig s, K
Hanson H, A. Hawthorne s, R. Heinz s, J. T.
Hong 3, E. Iarocci 6'a, E. Katsavounidis 4, E.
Kearns 3, S. Kyriazopoulou 4, E. Lamanna 14, C.
Lane s, D. S. Levin 11, P. Lipari 14, G. Liu 4, R.
Liu 4, N. P. Longley 4,n, M. J. Longo 11, G.
Ludlam 3, F. Maaroufi 2,e G. Mancarella l°, G.
Mandrioli 2, A. Margiotta-Neri 2, A. Marini 6, D.
Martello 1°', A. Marzari-Chiesa 16, M. N.
Mazziotta 1, D. G. Michael 4, S. Mikheyev ¢,i, L.
Miller 8, P. Monacelli 9, T. Montaruli 1, M.
Monteno 16, S. Mufson s, J. Musser 8, D.
Nicol613'd, R. Nolty 4, C. Okada 3, C. Orth 3, G.
Osteria 12, O. Palamara 1°, S. Parlati 7, V.
Patera 6,h, L. Patrizii 2, R. Pazzi 13, C. W. Peck 4,
S. Petrera 1°, N. D. Pignatano 4, P. Pistilli 1°, V.
Popa ~,t, A. Rain61, J. Reynoldson 7, F. Ronga 6,
U. Rubizzo 2,c, A. Sanzgiri 15, F. Sartogo 14, C.
Satriano 14'a, L. Satta 6'h, E. Scapparone 7, K.
Scholberg 4, A. Sciubba 6,h, P. Serra-Lugaresi 2,
M. Severi 14, M. Sitta 16, P.F. Spada 2, P.
Spinelli 1, M. Spinetti 6, M. Spurio 2, R.
Steinberg 5, J. L. Stone 3, L.R. Sulak 3, A.
Surdo 1°, G. Tarl~ 11, V. Togo 2, V. Valente 6, E.
Vilela 2'°, C. W. Walter 4 and 1%. Webb 15
1. Dipartimento di Fisica dell'Universit~ di Bari and
INFN, 70126 Bari, Italy
2. Dipartimento di Fisica dell'Universith di Bologna and
INFN, 40126 Bologna, Italy
3. Physics Department, Boston University, Boston, MA
02215, USA
4. California Institute of Technology, Pasadena, CA
91125, USA
5. D e p a r t m e n t of Physics, Drexel University,
Philadelphia, PA 19104, USA
6. Laboratori Nazionali di Frascati delI'INFN, 00044
Frascati (Roma), Italy
7. Laboratori Nazionali del Gran Sasso deIPINFN, 67010
Assergi (L'Aquila), Italy
8. Depts. of Physics and of Astronomy, Indiana
University, Bloomington, IN 47405, USA
9. Dipartimento di Fisica deli'Universitg dell'Aquila and
INFN, 67100 L'Aquila, Italy
10. Dipartimento di Fisica dell'Universith di Lecce and
INFN, 73100 Lecce, Italy
11. D e p a r t m e n t of Physics, University of Michigan, Ann
Arbor, MI 48109, USA
12. Dipartimento di Fisica dell'Universith di Napoli and
INFN, 80125 Napoli, Italy
13. Dipartimento di Fisica dell'Universit£ di Pisa and
INFN, 56010 Pisa, Italy
14. Dipartimento di Fisica dell'Universit& di Roma "La
Sapienza" a n d INFN, 00185 Roma, Italy
15. Physics Department, Texas A&M University, College
Station, TX 77843, USA
16. Dipartimento di Fisica Sperimentale dell'Universitg
di Torino and INFN, 10125 Torino, Italy
a Also Universith della Basilicata, 85100 Potenza, Italy
b Also INFN Milano, 20133 Milano, Italy
c Also Istituto T E S R E / C N R , 40129 Bologna, Italy
d Also Scuola Normale Superiore di Pisa, 56010 Pisa,
Italy
e Also Faculty of Sciences, University Mohamed I, B.P.
424 Oujda, Morocco
f Also Dipartimento di Fisica, Universith di R o m a Tre,
Roma, Italy
g Also Universith di Trieste and INFN, 34100 Trieste,
Italy
h Also Dipartimento di Energetica, Universit£ di Roma,
00185 Roma, Italy
i Also Institute for Nuclear Research, Russian Academy
of Science, 117312 Moscow, Russia
I Also Institute for Gravity and Space Sciences, 76900
Bucharest, Romania
m Sandia National Laboratory, Albuquerque, NM 87185,
USA
n Swarthmore College, Swarthmore, PA 19081, USA
o Also Inst. de Pesquisas Energ~iticas e Nucl., Pinheiros
05422-970 Sgo Paulo, Brasil
© Copyright 2026 Paperzz