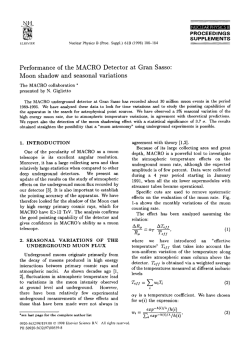
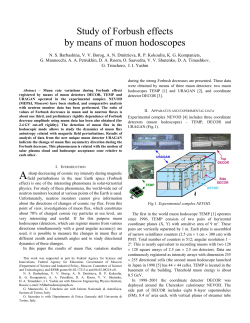
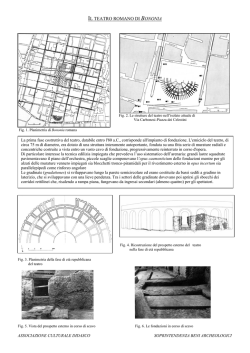
arXiv:0910.1269v3 [astro-ph.IM] 9 Mar 2010
Measurement of the atmospheric muon flux
with the NEMO Phase-1 detector
S. Aiello e, F. Ameli i, I. Amore a,ℓ, M. Anghinolfi f ,
A. Anzalone a, G. Barbarino g,n, M. Battaglieri f , M. Bazzotti d,k,
A. Bersani f,m, N. Beverini h,o, S. Biagi d,k, M. Bonori i,q,
B. Bouhadef h,o, M. Brunoldi m, G. Cacopardo a, A. Capone i,q,
L. Caponetto e,3, G. Carminati d,k, T. Chiarusi d,k, M. Circella c,
R. Cocimano a, R. Coniglione a, M. Cordelli b, M. Costa a,
A. D’Amico a, G. De Bonis h,o, C. De Marzo c,j,1, G. De Rosa g ,
G. De Ruvo c, R. De Vita f , C. Distefano a,∗, E. Falchini h,o,
V. Flaminio h,o, K. Fratini f , A. Gabrielli d,k, S. Galatà a,ℓ,2,
E. Gandolfi d,k, G. Giacomelli d,k, F. Giorgi d,k, G. Giovanetti i,q,
A. Grimaldi e, R. Habel b, M. Imbesi a, V. Kulikovsky f ,
D. Lattuada a,ℓ, E. Leonora e,ℓ, A. Lonardo i, D. Lo Presti e,ℓ,
F. Lucarelli i,q, A. Marinelli h,o, A. Margiotta d,k, A. Martini b,
R. Masullo i,q, E. Migneco a,ℓ, S. Minutoli f , M. Morganti h,o,
P. Musico f , M. Musumeci a, C.A. Nicolau i, A. Orlando a,
M. Osipenko f , R. Papaleo a, V. Pappalardo a, P. Piattelli a,
D. Piombo f , G. Raia a, N. Randazzo e, S. Reito e, G. Ricco f,m ,
G. Riccobene a, M. Ripani f , A. Rovelli a, M. Ruppi c,j,
G.V. Russo e,ℓ , S. Russo g,n, P. Sapienza a, D. Sciliberto e,
M. Sedita a, E. Shirokov r, F. Simeone i,q, V. Sipala e,ℓ,
M. Spurio d,k, M. Taiuti f,m, L. Trasatti b, S. Urso e, M. Vecchi i,q,
P. Vicini i, R. Wischnewski i.
a Laboratori
b Laboratori
Nazionali del Sud INFN, Via S.Sofia 62, 95123, Catania, Italy
Nazionali di Frascati INFN, Via Enrico Fermi 40, 00044, Frascati
(RM), Italy
c INFN
d INFN
Sezione Bari, Via Amendola 173, 70126, Bari, Italy
Sezione Bologna, V.le Berti Pichat 6-2, 40127, Bologna, Italy
e INFN
f INFN
Sezione Catania, Via S.Sofia 64, 95123, Catania, Italy
Sezione Genova, Via Dodecaneso 33, 16146, Genova, Italy
g INFN
Sezione Napoli, Via Cintia, 80126, Napoli, Italy
Preprint submitted to Elsevier
12 April 2010
h INFN
Sezione Pisa, Polo Fibonacci, Largo Bruno Pontecorvo 3, 56127, Pisa,
Italy
i INFN
j Dipartimento
Sezione Roma 1, P.le A. Moro 2, 00185, Roma, Italy
Interateneo di Fisica Università di Bari, Via Amendola 173, 70126,
Bari, Italy
k Dipartimento
di Fisica Università di Bologna, V.le Berti Pichat 6-2, 40127,
Bologna, Italy
ℓ Dipartimento
di Fisica e Astronomia Università di Catania, Via S.Sofia 64,
95123, Catania, Italy
m Dipartimento
n Dipartimento
di Fisica Università di Genova, Via Dodecaneso 33, 16146,
Genova, Italy
di Scienze Fisiche Università di Napoli, Via Cintia, 80126, Napoli,
Italy
o Dipartimento
di Fisica Università di Pisa, Polo Fibonacci, Largo Bruno
Pontecorvo 3, 56127, Pisa, Italy
p Centro
Interdisciplinare di Bioacustica e Ricerche Ambientali, Dipartimento di
Biologia Animale Università di Pavia, Via Taramelli 24, 27100, Pavia, Italy
q Dipartimento
r Faculty
di Fisica Università “Sapienza”, P.le A. Moro 2, 00185, Roma,
Italy
of Physics, Moscow State University, 119992, Moscow, Russia
Abstract
The NEMO Collaboration installed and operated an underwater detector including
prototypes of the critical elements of a possible underwater km3 neutrino telescope:
a four-floor tower (called Mini-Tower) and a Junction Box. The detector was developed to test some of the main systems of the km3 detector, including the data
transmission, the power distribution, the timing calibration and the acoustic positioning systems as well as to verify the capabilities of a single tridimensional
detection structure to reconstruct muon tracks. We present results of the analysis
of the data collected with the NEMO Mini-Tower. The position of photomultiplier
tubes (PMTs) is determined through the acoustic position system. Signals detected
with PMTs are used to reconstruct the tracks of atmospheric muons. The angular
distribution of atmospheric muons was measured and results compared to Monte
Carlo simulations.
Key words: Atmospheric muons, Neutrino telescopes, NEMO
PACS: 95.55.Vj, 95.85.Ry, 96.40.Tv
2
1
Introduction
High energy neutrinos are considered optimal probes to identify the sources of
high energy cosmic rays. Many indications suggest that cosmic objects, where
acceleration of charged particles takes place, should also produce high energy
gamma ray and neutrino fluxes. Indeed, pγ or pp interactions responsible for
> TeV neutrinos and γ rays, are expected to occur in several astrophysical
environments such as supernova remnants, microquasars, gamma-ray bursts
and active galactic nuclei [1]. For many sources the neutrino flux, produced
in the decay chains due to charge pions, is expected to be similar to the flux
of high-energy gamma rays of hadronic origin, which can be measured by
TeV gamma ray telescopes such as MAGIC [2], HESS [3] and VERITAS [4].
Because of the low expected neutrino fluxes from galactic and extragalactic
sources [5], the effective opening of the high energy neutrino astronomy era
can really be made with detectors of km3 scale. After the success of the first
generation of underwater/ice neutrino telescopes, such as BAIKAL [6] and
AMANDA [7], the construction of the first km3 telescope, IceCube, [8] started
at the South Pole. The detector is announced to be completed by 2011. In the
Mediterranean Sea, the ANTARES telescope is taking data since 2006 in a
partial configuration and since 2008 in its full set-up [9]. The ANTARES Collaboration together with the NESTOR [10] and NEMO [11] Collaborations
are conducting an intense R&D activity for the future km3 Mediterranean
telescope. Recently the three collaborations joined their efforts to design the
KM3NeT undersea infrastructure that will host a km3 telescope; its construction is expected to start by 2013 [12].
The activity of the NEMO Collaboration was mainly focused on the search
and characterization of an optimal site for the detector installation and on
the development of key technologies for the km3 underwater telescope to be
installed in the Mediterranean Sea. A deep sea site with optimal features in
terms of depth and water optical properties was identified at a depth of 3500
m about 80 km off-shore from Capo Passero (Southern cape of Sicily). A long
term monitoring of the site has been carried out [13].
An other effort of the NEMO Collaboration was the definition of a feasibility
study of the km3 detector, which included the analysis of the construction and
∗ Fax: +39 095 542 398
Email address: distefano [email protected] (C. Distefano).
1 Deceased
2 Present address, Centre de Physique des Particules de Marseille, CNRS/IN2P3
et Univ. de la Méditerranée, 163 Av. de Luminy, Case 902, 13288 Marseille Cedex
9, France
3 Present address, CNRS/IN2P3/IPNL, Domaine scientifique de la Doua, Bâtiment
Paul Dirac 4, Rue Enrico Fermi, Lyon, France
3
installation issues and the optimization of the detector geometry by means of
numerical simulations.
To ensure an adequate process of validation of the proposed solutions, a technological demonstrator was built and installed off-shore the port of Catania
(Sicily, Italy). This project, called NEMO Phase-1, allowed the test and the
qualification of the key technological elements (mechanics, electronics, data
transmission, power distribution, acoustic positioning and time calibration
system) proposed for the km3 detector [14]. Some of the technical solutions,
further developed within the KM3NeT Consortium, have been proposed for
the km3 detector construction.
In this paper, after a detailed description of the NEMO Phase-1 lay-out and
operation, we focus on the atmospheric muon data analysis procedure and
present the main results. In particular, the atmospheric muon angular distribution was measured and compared with Monte Carlo simulations. The
vertical muon flux was determined from the angular distribution, computing
the related depth intensity relation. Results were compared with theoretical
predictions and with results of other experiments.
2
The NEMO Phase-1 detector
The NEMO Phase-1 apparatus is composed of two main elements: the MiniTower and the Junction Box (JB) interconnected as sketched in Fig. 1 and
described in the following. NEMO Phase-1 was installed between 10 and 19
December 2006 at the underwater Test Site of the Laboratori Nazionali del
Sud, off shore Catania at a depth of 2080 m, latitude: 37◦ 33’ 4” N and
longitude: 15◦ 23’ 2” E (Fig. 2). The operation was conducted with the cable
layer vessel TELIRI [15]. The JB and the tower were deployed from the sea
surface by means of a winch and positioned on the seabed with an accuracy
of a few meters.
The JB was then connected to the main cable termination and the tower to
the JB with electro-optical links equipped with wet mateable hybrid connectors. The connection operations were performed with an underwater Remotely
Operated Vehicle (ROV). The operation was completed with the successful
unfurling of the tower that assumed the correct configuration. All active elements, such as PMTs, electronics, acoustic positioning, data transmission and
acquisition, worked correctly.
After four weeks of successful operation, two problems were encountered,
which prevented a fully efficient exploitation of the apparatus. Firstly, a loss of
buoyancy of the main buoy of the Mini-Tower occurred, which caused a slow
4
Fig. 1. Lay-out of the NEMO Phase-1 installation at the Catania Test Site.
Fig. 2. Location of the Underwater Test Site of the Laboratori Nazionali del Sud.
sinking of the whole tower; this problem was later ascribed to a poor manufacturing process of the buoy. Then, about four months after the connection, the
optical fiber transmission started to show a significant attenuation at the JB
level. The JB was recovered in June 2007. After tests in a hyperbaric chamber, the problem was identified in a faulty optical penetrator. The problem
was solved by bypassing the connector with a redesign of the optical system
lay-out. The JB was re-installed in April 2008 and proved to work correctly.
5
In spite of these problems, the NEMO Phase-1 allowed to validate a number
of technical solutions for the km3 telescope and to demonstrate the capability
of the NEMO tower to detect and track muons. During 5 months of operation
about 500 GB of data were recorded.
2.1 The Junction Box
The JB provided connection between the main electro-optical cable and the
detector structures and was designed to host and protect from the effects of
corrosion and pressure the opto-electronic boards dedicated to the distribution
and the control of the power supply and digitized signals.
The NEMO Phase-1 JB was built following the concept of double containment.
Pressure resistant steel vessels were hosted inside a large fiberglass container,
filled with silicon oil and pressure compensated. This solution has the advantage to decouple the two problems of pressure and corrosion resistance. All
the electronics components that were proven able to withstand high pressure
were installed directly in the oil bath [14]. The JB was equipped with 6 (2
inputs and 4 outputs) hybrid electro-optical wet mateable bulkheads. The two
inputs were connected, by means of two underwater cables, to the two outputs
of the termination frame of the main electro-optical cable, while one of the four
available outputs of the JB was used to connect the Mini-Tower by means of a
300 m electro-optical link. The JB was equipped with a HV transformer and
switches to distribute power to the output connectors, and with a system of
optical couplers to connect the fibers from the input to the output connectors.
2.2 The Mini-Tower
The Mini-Tower was a small-size prototype of the NEMO Tower [16]. It was a
three dimensional flexible structure composed by a sequence of four horizontal
elements (floors) interlinked by a system of tensioning ropes and anchored on
the seabed. The structure was kept vertical by an appropriate buoyancy on
the top.
The storey was a 15 m long structure supporting two Optical Modules (OMs),
one down-looking and one horizontally looking, at each end: four OMs were
installed on each storey. Each floor was connected to the following one by
means of four ropes arranged in such a way to force each floor to a position
perpendicular to its vertical neighbors. The floors were vertically spaced by
40 m. An additional spacing of 100 m was present between the tower base and
the lowermost floor (Fig. 3).
6
Fig. 3. Sketch of the NEMO Mini-Tower, in which 4 floors were equipped with a
total of 16 PMTs (the electronics positioned along the beam is not indicated, see
Fig. 4).
In addition to the 16 OMs the instrumentation installed on the Mini-Tower included several sensors for calibration and environmental monitoring: an Acoustic Doppler Current Profiler (RD Instruments Workhorse ADCP) to measure
water current; a light transmissometer (Wetlabs C*) to measure water transparency; a Conductivity–Temperature–Depth probe (Sea-Bird Electronics 37SM microcat CTD) to monitor sea water properties; a pair of hydrophones
on each floor and on the tower base for acoustic positioning. A scheme of the
instrumentation is shown in Fig. 4.
The NEMO tower was designed to be assembled in a compact configuration,
also kept during the transport and the deployment, which was performed from
a surface vessel by means of a winch. After the positioning on the seabed and
the connection to the undersea cable network, the tower was unfurled thanks
to the pull provided by the buoy. This procedure was actuated remotely from
the surface vessel by means of an acoustic device.
7
Fig. 4. Cabling layout of the NEMO Mini-Tower, including the Tower Base Module
(TBM); for each of the 4 floors are indicated the floor breakouts (br), the Floor
Control Modules (FCM) and the Floor Power Modules (FPM). Connection to the
Junction Box is provided through a wet mateable hybrid connector (HC) on the
tower base.
2.3 The Optical Module
Each optical module used for the NEMO Phase-1 detector was composed by
a PMT enclosed in a 17” pressure resistant sphere of thick glass. The PMT
was a 10” Hamamatsu R7081Sel with 10 stages [17]. In spite of its large photocathode area, this PMT has a good time resolution, about 3 ns FWHM for
single photoelectron pulses, with a charge resolution of 35%. Mechanical and
optical contact between the PMT and the internal glass surface was ensured
by an optical silicon gel. A µ-metal cage shielded the PMT from the Earth
magnetic field. The base card circuit for the high voltage distribution (Iseg
PHQ 7081SEL) required only a low voltage supply (+5 VDC) and generated
all necessary voltages for cathode, grid and dynodes with a power consumption
of less than 150 mW.
A Front-end Electronics Module (FEM), built with discrete components [18],
8
was also placed inside the OM. The FEM performed sampling at 200 MHz
by means of two 100 MHz staggered Flash ADCs, whose outputs were “captured” by a Field Programmable Gate Array (FPGA). The FPGA performed
threshold discrimination, stored it with an event time stamp in an internal
16 kbit FIFO, packed OM data and local slow control information and coded
everything into a bit stream frame ready to be transmitted on a twisted pair
at 20 Mb/s. The main features of this solution are the moderate power consumption, the high resolution and the large input dynamics range obtained
by a quasi-logarithmic analog compression circuit, with a raw time resolution
of 5 ns. The FEM board digitized and sent pulse waveform information up
to a maximum pulse rate of ∼150 kHz. The FEM board was also equipped
with analog and digital electronics to control the OM power supply and to
monitor the operating conditions, such of temperature, humidity and electrical parameters. It could also perform a calibration of the non linear response
of the logarithmic compressor.
In addition, the board provided an estimate of the average count rate by
counting the number of hits with amplitude exceeding a threshold of 0.3 single
photo-electron (s.p.e.) in a 10 ms time window as shown in sec. 3.2. This
estimate did not suffer from the limitation of the data transfer process and
allowed to measure the signal rate up to 6.5 MHz.
2.4 The data acquisition system
The design of the data acquisition system for NEMO Phase-1 was based on
technical choices that allow scalability to a much larger apparatus [19,20].
The optical connection between the counting room facilities on-shore and the
detector under water was driven by pairs of twin electronic boards, called Floor
Control Module (FCM), located at both extremities of each optical link, and
deputed to manage either the OM data stream, from off-shore to on-shore, and
the Slow Control commands, sent in the opposite direction. Each FCM board
was powered by a Floor Power Module (FPM) lodged on the corresponding
floor, and was connected to the Tower Base Module (TBM) through an optical
fiber backbone. The TBM was connected through an inter-link cable to the
JB. A detailed description of the Mini-Tower electronics is given in [20].
The OM data acquisition worked as follows: each off-shore FCM multiplexed
the signal produced by the corresponding four OM-FEM pairs in a floor, converted them from electric to optical and sent it on-shore through the optical
link. Each on-shore FCM, hosted on a dedicated server, de-multiplexed the
incoming data and distributed it to the Trigger and Data Acquisition System,
which was composed of the MasterCPU server, for data filtering, and a post9
trigger data storage facility. Each on-shore server was connected to the others
via a standard 1 Gigabit Ethernet network.
In order to reconstruct muon tracks using the Čerenkov technique, a common
timing must be known in the whole apparatus at the level of each detection device to allow time correlation of events. For this reason a synchronous and fixed
latency protocol, which embedded data and clock timing in the same serial bit
stream, was used for communications between onshore and offshore. The implemented system relied on Dense Wavelength Division Multiplex (DWDM)
techniques, using totally passive components with the only exception of the
line termination devices, i.e. electro-optical transceivers. The precision of the
common timing of the apparatus was measured and monitored using a dedicated time calibration system, as illustrated in the next subsection.
2.5 The time calibration system
The time calibration was performed with an embedded system to track the
possible drifts of the time offsets during the operations of the apparatus underwater [21]. This system measured the offsets with which the local time
counters inside the optical modules were reset on reception of the reset commands broadcasted from shore. The operation was performed with a redundant
system: (1) a two-step procedure for measuring the offsets in the time measurements of the optical sensors and (2) an all-optical procedure for measuring
the differences in the time offsets of the different optical modules.
In the first system the needed measurements were performed in two separate
steps: using an “echo” timing calibration and using an “optical” timing calibration. The former allowed the measurement of the time delay for the signal
propagation from the shore to the FCM of each floor; the latter, based on a
network of optical fibres which distributes calibration signals from fast light
pulsers to the OMs, allowed to determine the time offsets between the FCM
and each optical module connected to it.
The second system was an extension of the optical timing calibration system,
which allowed to simultaneously calibrate the optical modules of different
floors of the tower.
2.6 The acoustic positioning system
Another key requirement for the muon tracking with an underwater Cherenkov
apparatus is the knowledge of each optical sensor position. While the position
and orientation of the tower base was fixed and known from its installation,
10
the rest of the structure could bend under the influence of sea currents. A
precise determination of the position of each tower floor was achieved by means
of triangulations performed by measuring the propagation times of acoustic
signals between a Long-Base-Line (LBL) of acoustic beacons, placed on the
sea floor, and a couple of hydrophones (labeled H0 and H1) installed on each
tower floor close to the positions of the optical modules. The inclination and
orientation of each tower floor was also measured by a tiltmeter-compass board
placed inside the FCM.
The LBL was realized with four stand-alone battery-powered acoustic beacons
and one additional beacon located on the tower base (Fig. 5). To recognize
Fig. 5. Schematic view of the Acoustic Positioning System (APS) and of the
Long-Base-Line (LBL) configuration.
the beacon pulses a technique called Time Spectral Spread Codes (TSSC) was
used. Each beacon transmitted a unique pattern of 6 pseudo-random pulses
(spaced by 1 s). The duration of each pulse was 5 ms and the sequence of
pulses was built to avoid overlap between consecutive pulses. In this way a
typical beacon pulse sequence was recognized without ambiguity and all the
beacons could transmit their characteristic pulse sequence at the same acoustic
frequency. This was an advantage since all beacons could be identical except
for the software configuration that defines the pulse sequence; the receivers
were then sensitive to the 32 kHz acoustic channel. Since the beacon clocks
were autonomous, in order to determine the position of the hydrophones,
the LBL had to be synchronized to the master clock of the apparatus. This
synchronisation took place acoustically using a monitoring station, formed by
two hydrophones, connected to the Mini-Tower data acquisition system, placed
in correspondence to the tower base. Prior to the connection of the MiniTower, the four acoustic beacons providing the LBL were deployed around
the apparatus at an approximate distance of 250 m from the tower base.
In order to obtain the required accuracy of <
∼15 cm - comparable with the
size of the PMT - the time of flight of acoustic signals between the LBL
11
beacons and the monitoring station had to be evaluated with an accuracy
of the order of 10−4 sec. To achieve this goal an accurate calibration of the
LBL was performed, taking into account the clock drift of the stand-alone
beacons. In particular, the absolute positions of the beacons and their relative
distances were determined, acoustically, at the time of detector installation,
using a ROV equipped with a 32 kHz, GPS synchronized pinger and with a
high accuracy pressure sensor.
3
Control and environmental parameters
All the Slow Control data (including data from all environmental sensors and
the acoustic positioning system) were managed from shore by means of a
dedicated Slow Control Management System [22] and analyzed as described
in the following.
3.1 Acoustic positioning data
The LBL calibration procedure allowed the determination of distances between
the beacons and the monitoring station, and to calculate the time of flight
of the acoustic pulses as the difference between the time of arrival of the
acoustic signal on each hydrophone and the time of emission of the beacon.
The sound velocity was calculated using the CTD data. The time of emission of
the beacon pulse, in the common detector clock reference time, was obtained
measuring the time of arrival of this pulse at the monitoring station. This
procedure allowed to compensate for the clock drift of the stand-alone beacons
(about 20 ns/s) during the livetime of the apparatus. In order to merge in postprocessing the acoustic positions data together with optical module detection
information, both were time stamped with a universal time reference tag.
The acoustic positioning system data were extensively analyzed. The tower
positions were reconstructed and the movements were measured as a function
of time, on long and short time scales [23].
In order to estimate the accuracy of the positioning system, the distances
between hydrophones H0 and H1 on the same floor were measured. In Fig.6
the distance H0-H1 measured for floor 2 is shown. This result indicates that
the obtained accuracy in the determination of hydrophone positions is better
than 10 cm.
12
distance H0−H1 (m)
15
14.5
14
13.5
0
10
20
30
40
50
60
70
t (300 sec)
Fig. 6. Distance H0-H1 measured for floor 2. Each point is the averaged distance over
a period of 5 minutes, in the time interval from 1st February h.17 to 1st February
h.23 (6 hours). The mean value of the measured distance is 14.24 ± 0.06 m (dashed
line). This value is compared with the construction distance of 14.25 ± 0.01 m (solid
line), measured on-shore, during the tower integration.
3.2 PMT counting rates
The instantaneous PMT rate values were computed by the FEMs as described
in sec. 2.3. The PMT counting rates gave an instantaneous estimate of the
optical background during the detector livetime.
In Fig. 7 the histogram of the rate distribution is plotted for a PMT located
on the 4th floor, in the time interval between 10 and 20 January 2007. The
histogram shows a peak in the 75-80 kHz interval due to 40 K decay plus
a contribution due to diffuse bioluminescence [24]. The frequency value at
the peak, commonly called the baseline of the optical background [25], was
determined fitting the peak of the distribution with a Gaussian function. The
baseline obtained from the fit is 72.5±3.6 kHz. The distribution, plotted in
Fig. 7, shows also a tail extending to several hundreds kHz due to intense
bioluminescence bursts. This contribution is measured by means of the socalled burst fraction and it was calculated, for comparison with the ANTARES
detector data in two different ways [25]:
• the percentage of time in which the rate exceeds 200 kHz;
• the percentage of time in which the rate exceeds 1.2 times the baseline rate
value.
For the data shown in Fig. 7, the percentage of time with rates exceeding 200
kHz was 0.3% while the percentage of time with rates larger than 1.2 times
13
Counts
the baseline rate was 2.6%.
105
Baseline=
72.5± 3.6 kHz
Burst Frac. (>1.2× Baseline)= 2.6 %
104
Burst Frac. (>200 kHz)= 0.3 %
3
10
102
10
1
0
200
400
600
800
1000
PMT Rate (kHz)
Fig. 7. Histogram of hit rate distribution from one PMT located on the 4th floor,
recorded in the period 10-20 January 2007.
The baseline and burst fraction of the optical background were determined for
the full period of the detector operation. Typical results, for an OM located
in the 4th Mini-Tower floor, are shown in Fig. 8. The data indicate two time
intervals with different characteristics of the optical background. The first
period, from the detector activation to the first week of February 2007, was
characterized by a baseline rate of ∼ 73 kHz and a burst fraction of the
order of a few percents (with peaks up to 20%) while the second one, starting
approximately on February 11, characterized by a slightly lower baseline rate
(average ∼ 67 kHz) and a higher burst fraction (∼ 20%). These results can be
explained as due to two effects: a change of the water properties and a change
in the detector configuration due to the loss of buoyancy of the tower. Starting
from February 2007, in fact, the detector fell down by about 40 meters; thus
the 4th floor was at about 80 meters from the sea bottom. On the other hand
during the same period of time we observed an increase of the underwater
currents [23], and as shown by the ANTARES Collaboration [26], the level
of bioluminescence is usually correlated with the value of the sea current.
The somehow contradictory decrease of the baseline can be explained as a
consequence of the increase of water turbidity, due to particulate, close to the
bottom and under the effect of the increased current.
4
Atmospheric muon analysis
In order to reconstruct atmospheric muon tracks and to measure the muon
flux a dedicated data selection and analysis procedure was applied. The atmospheric muon track analysis was implemented for a limited period of the
14
PMT Rate (kHz)
Burst Fraction (%)
100
95
90
85
80
75
70
65
60
55
50
07/01/14
40
35
30
25
20
15
10
5
0
07/01/28
07/02/11
07/02/25
07/03/11
07/02/11
07/02/25
07/03/11
>1.2× Baseline
>200 kHz
07/01/14
07/01/28
Fig. 8. Time dependence of the baseline rate (upper panel) and of the burst fraction
(lower panel) for a PMT located on the 4th floor in the period from 7 January
(07/01/07) to 31 March 2007 (07/03/31). The shaded areas represent the two periods of data acquisition when the muon trigger was active, see text.
detector livetime, shown by the shaded area in Fig. 8: from January 23 and
24 2007 -when the tower was completely unfolded- and from March 2 to April
12 2007, when the two lowest floors of the tower were laying on the seabed.
4.1 The on-line muon trigger
As described in section 2.4, the data acquired by the OMs were distributed, onshore, to the MasterCPU. On this machine, an on-line data selection algorithm
was implemented to select muon events among the optical background.
Since the main contribution to optical noise was due to uncorrelated PMTs
hits -with an average rate of about 70 kHz- the selection criterion (hereafter
trigger seed) consisted in imposing time coincidence in a narrow time-window
of 20 ns among hits occurred on pairs of adjacent PMTs (i.e. the two PMTs
located at the same extremity of the same floor). This trigger seed is called
Simple Coincidence (SC).
When an SC trigger occurred, the data acquired by all the PMTs within a
Triggered Time Window (TTW), centered around the SC time, were stored on
file and identified as possible muon event for off-line data analysis. If another
trigger seed occurred in the TTW after the first one, the TTW itself was
extended by ∆tT T W after the new seed time.
15
In order to test the on-line selection algorithm, two different lengths of the
TTW were used, i.e. ∆tT T W = ±2 µs and ±5 µs, around the trigger seed time.
It was found that, after the application of the causality filter on PMT hits (see
sec. 4.4), the two data sets taken with different ∆tT T W , were equivalent.
The measured total SC trigger rate ranged between 1.5 and 2 kHz, while the
expected atmospheric muon signal in the Mini-Tower, evaluated with Monte
Carlo simulations, was ∼1 Hz (see sec. 5). Therefore, a further off-line data
selection, with more complex and more selective algorithms, too slow for the
requirements of the on-line trigger, was necessary.
4.2 The off-line PMT data calibration
The first step of the off-line event analysis was PMT data calibration. PMT
hits, recorded on each event file, were decompressed and calibrated [27]. First,
the PMT hit wave-form was re-sampled at 2 GHz (the ADC sampling is 200
MHz). Therefore, the data values measured in ADC channels were decompressed and converted into amplitudes (in mV unit), using a decompression
table generated during the FEM characterization phase. The rising edge of the
waveform was then fitted with a sigmoid function and the hit time was evaluated at the inflection point, and then corrected with the time offset provided
etc.. At the end of this process the PMT hit waveform was reconstructed: the
integral charge was determined with an uncertainty of σ ∼ 0.3 pC; this value
was converted in units of p.e. taking into account that 1 p.e. = 8 pC. The
PMT hit calibration allowed to obtain hit time evaluation with a precision of
σ ∼ 1 ns, i.e. 5 times better than at the raw data level.
4.3 The off-line muon trigger
After the PMT off-line calibration, thanks to the better time accuracy of
PMT hits, the SC trigger were re-applied to reject the false coincidences found
by the less accurate on-line trigger algorithm. Besides the SC trigger seed,
other trigger seeds were searched in each candidate muon event: the Floor
Coincidence (FC) seed, that is a coincidence between 2 hits recorded at the
opposite ends of the same storey (∆TF C ≤ 200 ns) and the Charge Shooting
(CS) seed, that is a hit exceeding a charge threshold of 2.5 p.e..
The PMT hits of the event which satisfied at least one trigger seed were, then,
selected. Among this sub-sample, the number of space-time causality relations
(NCaus ) between “trigger hits” was calculated, using the following criterion:
|dt| < dr/v + 20 ns,
(1)
16
where |dt| is the absolute value of the time delay between two hits, dr is the
distance between the two corresponding PMTs (calculated using the Acoustic
Positioning System data) and v is the group velocity of light in seawater. The
value of NCaus was used to reject events containing only background hits. Only
the events having NCaus ≥ 4 were considered for further analysis, according
to results of Monte Carlo simulations (see sec. 5). For the events passing this
selection procedure, all PMTs hits were re-considered in the following steps of
the analysis.
In Fig. 9 is shown the correlation between the number of FC and CS triggers
for each event passing the selection procedure. In the left-hand side the number
of selected events is plotted as a function of number of CS and FC triggers per
event. In the right-hand side, the number of hits, in the whole data sample,
participating in both an FC and in a CS trigger is shown. A large fraction of
the selected hits, do not satisfy the two trigger conditions simultaneously.
Fig. 9. Left: Contour plot showing the number of events as a function of FC and
CS trigger per event. Right: Number of hits participating both in an FC and in a
CS trigger (see text).
4.4 Muon track reconstruction
Once a muon event was identified, it was necessary to reject the hits due to the
optical background before starting the muon track reconstruction procedure.
First, PMT hits with amplitude smaller than 0.5 p.e. were rejected. Then, a
new background filter algorithm [28], was applied, as described in the following. The N PMT hits of the selected event, were sorted by arrival time, and
17
the event average hit rate was calculated as
f=
N
,
TN − T1
(2)
where T1 and TN are the occurrence time of the “earliest” and the “latest” hits
in the selected event, respectively. PMT hits were, then, grouped in samples
of n = 5 consecutive hits (hit1 :hit5 , hit2 :hit6 , ..., hitN −5 :hitN ). The hit rate
of each sample fsample = n/∆t, where ∆t = Tk+n − Tk , was calculated. The
sample showing the highest hit rate is most likely to contain muon hits, and
it was taken as the reference sample for the following steps of the muon reconstruction procedure. The efficiency of this algorithm was proven via Monte
Carlo simulations (see sec. 5). As an example Fig. 10 shows the distribution
of hit arrival times for a simulated (left-hand side) and for a real (right-hand
side) muon event crossing the Mini-Tower detector. For the simulated event,
the white filled histogram represents the muon-induced Čerenkov photons hits,
while the black filled histogram refers to optical background hits. For the real
event PMT hits are shown as a white-filled histogram. In both cases the upper
plot shows the sample hit rate fsample with respect to the average event hit
rate f .
Fig. 10. Sample hit rate for n = 5 as a function of time for a simulated muon event
(left) and for an event in the data set (right). The dashed line represents the event
average hit rate. The histograms in the left-hand figure represent the distribution of
muon hits (white filled) and background hits (black filled). In the right-hand figure
the histogram represents real PMT hits (white filled).
The following step was to apply the causality relation in Eq. 1 between each
of the n hits of the reference sample, and the other N − 1 PMT hits in the
event. A reference hit, causally correlated with the largest number of the other
event hits, was chosen, and the ensemble formed by all the causally correlated
hits was stored and used to reconstruct the atmospheric muon track. If this
18
procedure preserved 6 hits, at least, the muon track direction reconstruction
codes were run.
The muon direction reconstruction algorithm used in this work was originally
developed by the ANTARES Collaboration and was then adapated to the
NEMO tower configuration [29,30]. It is a track fitting procedure based on
a maximum likelihood method, that takes into account the Čerenkov light
features and the possible presence of non-rejected background hits. The reconstruction strategy was applied in the way described below.
After the previous analysis cuts, hits participating to the trigger seeds could
have been rejected, therefore the actual number of hits participating to the
CS and CS trigger seeds was recalculated. These hits form the new ensemble
on which a linear track pre-fit was applied. At least three hits were required
to compute the pre-fit. The results of the pre-fit were then used as starting condition for the following fit algorithms (based on maximum likelihood
method), that use all the hits in the stored sample, and surviving the optical
background filter. During the likelihood fitting procedure other hits can be
rejected and, since the minimum number of hits required for track fitting is
Nhit ≥ 6, this reduces the total number of reconstructed events 4 . Among all
the tracks reconstructed with the likelihood method algorithm, only the ones
satisfying the likelihood (L) condition:
Λ≡
log10 (L)
> −10
NDOF
(3)
were selected, according to results of Monte Carlo simulations, described in
the next section.
5
Results
In Tab. 1 the results of the muon reconstruction procedure, at different stages
of the analysis and of the reconstruction procedure, are given. The table refers
to the sample of data recorded on 23-24 January 2007, shown in Fig. 8, when
the tower was completely unfurled. The cuts applied on the data, at the level
of the background filter and likelihood fit parameter, where chosen according
to the results of the Monte Carlo simulation described below, optimized for
the data taken in the period 23-24 January 2007.
4
It is worth to mention that the applied likelihood reconstruction procedure is
optimised for the larger size ANTARES detector
19
Table 1
Results of the data analysis and track reconstruction procedure: number
of events and reconstructed tracks for each step of the analysis applied in sequence
(see text).
LiveTime
On-line Trigger
Off-line Trigger
Background Filter
Prefit reconstructed
Likelihood reconstructed
Selected
at least 1 SC
NCaus ≥ 4
Nhit ≥6
Nhit ≥3 (hit ∈ SC or CS)
Λ > −10
11.31 hours
6 · 107 events
465386 events
70913 events
13205 tracks
3049 tracks
1139 tracks
After the analysis cuts a total of 3049 atmospheric muon events was reconstructed with an average muon reconstruction rate of 0.075 Hz. The limited
detector size and the short livetime did not allow the detection of up-going
atmospheric neutrino events, whose rate is about 10−6 times less than for the
muons.
For the data recorded during the period 2 March - 12 April 2007 the acquisition
livetime was 174.1 hours and the total number of reconstructed atmospheric
muons was 27699, thus the average reconstruction rate was 0.044 Hz [31]. The
lower rate of reconstructed tracks was due to the smaller number of PMTs
participating in the muon reconstruction procedure, caused by the improper
tower configuration (see sec. 2). These data were not used for further analysis.
5.1 Detector Monte Carlo simulation
In order to evaluate the detector response to atmospheric muons and compare
it with the results of the data analysis, a Monte Carlo simulation was performed. Atmospheric muon events were simulated using the MUPAGE code
[32], a muon event generator based on parametric formulas [33]. Atmospheric
muons were generated on the surface of a can-shaped volume of water of 194
m height and 238 m radius (containing the detector) in an energy range from
20 GeV to 500 TeV, according to the MUPAGE limits. This energy range
was suitable due to the expected detector threshold and limited size. A total of 4 · 107 atmospheric muons was simulated, corresponding to the real
acquisition detector livetime of 11.3 hours. The generated muon events were
propagated inside the detector, using the simulation tools developed by the
ANTARES Collaboration [34]. These codes simulate the emission and propagation of Čerenkov light induced by muons and their secondary products
(e.g. showers and δ-rays), then record photo-electron signals on PMTs. As
20
mentioned before, the actual run conditions of the detector were taken into
account. The detector geometry was simulated using the PMT positions reconstructed by the acoustic positioning system data. The light absorption
length as a function of photon wavelength was introduced, according to the
one measured at the detector site [13]. Once the muon PMT hits -produced
by Čerenkov photons originated along the muon track- were simulated, the
spurious PMT hits -due to the underwater optical noise- were introduced in
the simulation. It was assumed that the optical background produces uncorrelated s.p.e. signals in the PMTs. In the present work, optical background hits
were simulated, for each PMT, according to the real counting rate spectrum
measured during the selected period of detector operation (e.g. see Fig. 7).
The Mini-Tower DAQ electronics and the on-line trigger were also simulated.
Monte Carlo events surviving the on-line trigger simulation, were processed
using the same analysis chain used for the detector data analysis. In Fig. 11
the rate of reconstructed tracks as a function of number of PMT hits, after
the causality filter, is shown both for Monte Carlo events and detector data.
Only the events preserving at least 6 PMT hits could be processed by the
track reconstruction algorithms.
Fig. 11. Rate of muon tracks, as a function of the number of PMT hits, for events
reconstructed from the data or from simulations, and Monte Carlo events.
5.2 Comparison between data and simulations
The good agreement found between data and Monte Carlo events is shown in
Fig. 12. The likelihood distribution of the reconstructed muon track rate is
21
shown both for data and Monte Carlo events.
Fig. 12. Likelihood spectra of reconstructed muon tracks.
Among the reconstructed tracks, only the ones with a fit quality parameter
Λ > −10 were selected. In Fig. 13 the zenith angular distribution of the
reconstructed muon track rate, after the fit quality cut, is shown. The same
distribution for Monte Carlo events is shown for comparison. The KolmogorovSmirnov test [35] was performed 5 to quantitatively evaluate the agreement
between data and Monte Carlo events, for the distributions plotted in Fig. 13.
The test probability was found to be 0.81, proving a good agreement between
the two distributions.
5.3 Depth Intensity Relation for Atmospheric Muons
The final step of the analysis was the calculation of the so called Depth Intensity Relation for the reconstructed atmospheric muon tracks, that is the
measurement of the vertical muon flux intensity as a function of the muon
slant depth in water. An atmospheric muon, reaching the detector located at
a depth D from a Zenith angle ϑZ , propagates through a water slant h
h=
D
.
cos ϑZ
(4)
The Depth Intensity Relation, thus, gives an estimate of the vertical muon
intensity as a function of the equivalent water depth h [36].
5
For this test the bin width was re-sized to 0.1.
22
Fig. 13. Angular distributions of reconstructed muon track rate after applying the
likelihood quality cut (Λ > −10).
The muon intensity I(ϑµ ) as a function of the muon direction ϑµ , was calculated using the relation
I(ϑµ ) =
Nµ (ϑµ ) · m(ϑµ )
Aef f (ϑµ ) · T · ∆Ω
(5)
where
• Nµ (ϑµ ) is the number of muon events assigned by the analysis to the angular
interval centered around cos ϑµ . For this, we considered the angular distribution Nµ (ϑrec
µ ) obtained from the reconstruction, without applying cuts.
This distribution appears smeared because of the detector angular resolution. We applied an iterative unfolding method based on Bayes’ theorem
[37];
• m(ϑµ ) is the mean muon multiplicity at the angle ϑµ and at the detector
depth. It was determined from the Monte Carlo simulations and it is shown
in Fig. 14 ;
• Aef f (ϑµ ) is the reconstruction effective area at the muon angle ϑµ , determined by Monte Carlo simulations and shown in Fig. 15;
• T is the data livetime. We used only the data acquired in the period on
23-24 January 2007 with T = 11.3 hours;
• ∆Ω is the solid angle covered by the corresponding cos ϑµ interval.
Fig. 16 shows the angular distribution of the atmospheric muon flux obtained
from Eq. 5. Error bars include both statistical and systematic uncertainties
23
Fig. 14. Mean muon multiplicity as a function of the angle ϑµ and at the detector
depth.
Fig. 15. Reconstruction effective area as a function of the muon angle ϑµ , determined
by Monte Carlo simulations.
added in quadrature. Systematic errors were evaluated via Monte Carlo simulation, taking into account the uncertainties on the input parameters: the light
absorption length in water (La ), the light scattering length in water (Lb ), the
PMT quantum efficiency and the angular acceptance of the Optical Module
[17,38]. In Tab. 2 the contributions of the different parameters to the total
systematic error are reported. The systematic error is mainly a scale error
common to all measured points; its contribution to the point to point error is
considerably smaller.
24
Fig. 16. Angular distribution of the atmospheric muon flux, I(ϑµ ), computed with
Eq. 5, for the data acquired in the period 23-24 January 2007. The errors include
statistical and systematic uncertainties added in quadrature. Data are compared
with the simulated atmospheric muon flux (solid line).
Table 2
Systematic error: Contribution to the systematic error due to the uncertainty on
each input parameter of the Monte Carlo simulation.
Input Parameter
Relative Uncertainty of the Parameter
∆I/I
±10%
±10%
±10%
±10◦
+20%
−27%
+3%
−19%
+21%
−15%
+22%
−8%
+36%
−37%
La
Lb
PMT Quantum efficiency
OM Angular Acceptance
Total
The measured flux I(ϑµ ) was, then, transformed into muon vertical flux intensity I(ϑZ = 0, h) using the formula:
I(ϑZ = 0, h) = I(ϑZ ) · cos(ϑZ ) · ccorr ,
(6)
where the zenith angle is ϑZ = 180◦ − ϑµ . The term ccorr is a correction factor
required for angles larger than 60◦ as described in [39].
In Fig. 17 we show the Depth Intensity Relation for atmospheric muons. Results obtained by previous experiments are shown for comparison: MACRO
[40] in standard rock, DUMAND [41], NESTOR [42], ANTARES [43,44] 6 in
6
ANTARES has also recently presented a DIR curve based on a novel data analysis
method [45], whose results are not quoted in Fig. 17.
25
sea water, BAIKAL [46] in lake water, AMANDA [47] in ice. Results are also
compared with the prediction of Bugaev et al. [48]. The NEMO Phase-1 data
are in agreement with previous measurements and with Bugaev’s prediction
in the whole range of investigated depths.
Fig. 17. Vertical muon intensity, I(ϑZ = 0, h), versus depth measured using data
acquired in the period 23-24 January 2007. For comparison, results from other
experiments are quoted. The solid line is the prediction of Bugaev et al. [48].
6
Conclusions
The activities of the NEMO Collaboration have progressed with the achievement of major milestones: the realization and installation of the Phase-1 apparatus.
With this apparatus it was possible to test in deep sea the main technological
solutions developed by the collaboration for the km3 scale underwater neutrino
telescope.
The angular distribution of atmospheric muons was measured and results were
compared to Monte Carlo simulations. The vertical muon intensity was evalu26
ated and compared with previous data and predictions, showing a good agreement.
Acknowledgments
We thank all INFN personnel that has contributed to the development and
carry out mechanics, electronics and computing of the NEMO Phase-1 experiment. We also thank the ANTARES Collaboration for providing the detector
simulation and track reconstruction codes, extensively used in this work. Eventually we thank our anonymous referee for useful comments and suggestions.
References
[1] F. Aharonian, Science 315-5808 (2007) 70.
[2] J. Albert et al., Astropart. Phys. 23 (2005) 493.
[3] F. Aharonian, et al., Nature 432 (2000) 75.
[4] V.A. Acciari et al., Ap. J. 684 (2008) L73.
[5] J.G. Learned, K. Mannheim, Ann. Rev. Nucl. Part. Sci. 50 (2000) 679.
[6] R. Wischnewski, for the Baikal Coll., Nucl. Instr. Meth. A 602 (2009) 14.
[7] R. Abbasi et al., Phys. Rev. D79 (2009) 062001.
[8] R. Abbasi et al., Ap. J. L. 701 (2009) 47.
[9] J.A. Aguilar et al., Astropart. Phys. 26 (2006) 314; Nucl. Instr. Meth. A 555
(2005) 132; Nucl. Instr. and Meth. A 570 (2007) 107; M. Ageron et al., Nucl.
Instr. and Meth. A 578 (2007) 498; Nucl. Instr. and Meth. A 581 (2007) 695.
[10] P.A. Rapidis, Nucl. Instr. Meth. A 602 (2009) 54.
[11] NEMO web site: http://nemoweb.lns.infn.it.
[12] KM3NeT web site: http://www.km3net.org.
[13] G. Riccobene et al., Astropart. Phys. 27 (2007) 1.
[14] E. Migneco et al., Nucl. Instr. Meth. A 588 (2008) 111.
[15] ELETTRA Tlc web site: http://www.elettratlc.it/.
[16] E. Migneco et al., Nucl. Instr. Meth. A 567 (2006) 444.
[17] A. Aiello et at., NIM A (2009), accepted, DOI:10.1016/j.nima.2009.12.040.
27
[18] C.A. Nicolau, for the NEMO Coll., Nucl. Instr. Meth. A 567 (2006) 552.
[19] G. Bunkheila, for the NEMO Coll., Nucl. Instr. Meth. A 567 (2006) 559.
[20] F. Ameli et al., IEEE Trans. Nucl. Sci. 55 (2008) 233.
[21] M. Ruppi, for the NEMO Coll., Nucl. Instr. Meth. A 567 (2006) 566.
[22] A. Rovelli, for the NEMO Coll., Nucl. Instr. Meth., A 567 (2006) 569.
[23] I. Amore, for the NEMO Coll., Nucl. Instr. Meth. A 602 (2009) 68.
[24] I.G. Priede et al., Deep Sea Research I 53 (2006) 1272.
[25] S. Escoffier, for the ANTARES Coll., Proc. of the 30th ICRC, Merida, Mexico,
July 3-11, 2007 arXiv:0710.0527 [astro-ph].
[26] Vallage B., for the ANTARES Coll., Nucl. Phys. B (Proc. Suppl.) 151 (2006)
407.
[27] F. Simeone, for the NEMO Coll., Nucl. Instr. Meth. A 588 (2008) 119.
[28] S. Galatà, 2008, Analisi dati e ricostruzione di tracce di muoni atmosferici con il
rivelatore NEMO FASE-1, laurea dissertation, University of Catania, Catania.
[29] A. Heijboer, 2004, Track reconstruction and point source searches with Antares,
PhD dissertation, Universiteit van Amsterdam, Amsterdam, The Netherlands
(http://antares.in2p3.fr/).
[30] S. Aiello et al., Astropart. Phys. 28 (2007) 1.
[31] C. Distefano, for the NEMO Coll., Nucl. Phys. B (Proc. Suppl.) 190 (2009) 109.
[32] G. Carminati et al., Computer Physics Communications 179 (2008) 915; G.
Carminati et al., Proc. of the 31st ICRC, Lódź, Poland, July 7-15, 2009
arXiv:0907.5563 [astro-ph.IM].
[33] Y. Becherini et al., Astropart. Phys. 25 (2006) 1.
[34] Y. Becherini, for the ANTARES Coll., Nucl. Instr. Meth. A 567 (2006) 477.
[35] G. Zech, Comparing Statistical Date to Monte Carlo Simulation: Parameter
Fitting and Unfolding, DESY-95-113, June 1995.
[36] E. Andres et al., Astropart. Phys. 13 (2000) 1.
[37] G. D’Agostini, Nucl. Instr. Meth. A 362 (1995) 487; see
http://hepunx.rl.ac.uk/∼adye/software/unfold/RooUnfold.html.
[38] P. Amram et al., Nucl. Instr. and Meth. A 484 (2002) 369.
[39] P. Lipari, Astropart. Phys. 1 (1993) 195.
[40] M. Ambrosio et al., Phys. Rev. D 52 (1995) 3793.
[41] J. Babson et al., Phys. Rev. D 42 (1990) 3613.
28
also
[42] E. G. Anassontzis et al., in Proc. of the 23rd ICRC, Calgary, Canada, August,
1993; G. Aggouras et al., Astropart. Phys. 23 (2005) 377.
[43] M. Ageron et al., Astropart. Phys. 31 (2009) 277.
[44] M. Bazzotti, for the ANTARES Coll, Proc. of the 31st ICRC, Lódź, Poland,
July 7-15, 2009.
[45] J. Aguilar et al., Astropart. Phys., (2009), accepted,
10.1016/j.astropartphys.2009.12.002, arXiv:0910.4843 [astro-ph.HE].
DOI:
[46] I.A. Belolaptikov et al., Astropart. Phys. 7 (1997) 263.
[47] P. Desiati, for the AMANDA Coll. and K. Bland, in Proc. of the 28th ICRC,
Tsukuba, Japan, July 31- August 7, 2003.
[48] E. Bugaev et al., Phys. Rev. D58 (1998) 05401.
29
© Copyright 2026 Paperzz