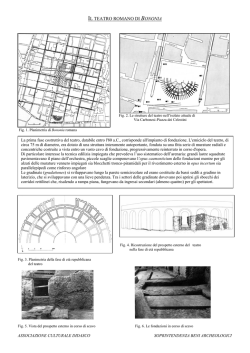
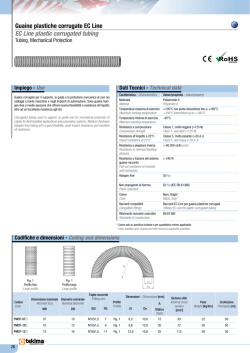
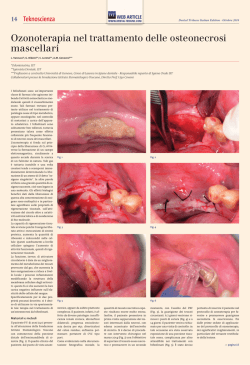
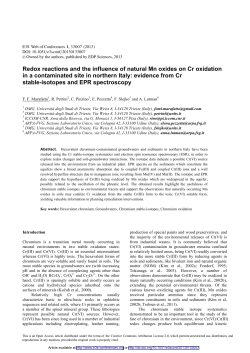
Nitrates in Groundwater (Northern Italy): isotopic prospection in high
vulnerability area
[1]
Cristina ARDUINI, [3]Andrea DADOMO, [2]Giovanni MARTINELLI,
ZELIOLI, [1]Elisa CARRARO, [1]Marta GANGEMI.
[1]
Giovanni PORTO,
[1]
Andrea
[1]
Provincia di Milano, Corso di Porta Vittoria, 27 – 20121 Milano, Italy, e-mail: [email protected]
[email protected] , [email protected], e.carraro@ provincia.mi.it.
[2]
ARPA Emilia Romagna, Via Amendola, 2 - 42100 Reggio Emilia, Italy, e-mail: [email protected]
[3]
ARPA Emilia Romagna, Via via XXI Aprile, 48 - 29100 Piacenza, Italy, e-mail: [email protected] ,
[email protected]
Abstract A hydrogeochemical prospection has been carried out in the Milano province with the purpose to
better identify and characterize Nitrogen pollution sources. A network of 90 wells has been considered for
geochemical prospection and 37 wells were also considered for isotopic survey. A geochemical stratification
both in chemical characters and in isotopic ones has been identified and related to local pollution phenomena.
The organic character of Nitrogen pollution phenomena has been identified and related to vulnerability
characters of surveyed area. The obtained results allow to improve previous vulnerability mapping methods.
Keywords: Hydrochemistry - Stable isotopes - Diffuse pollution - nitrate - Northern Italy
1. Introduction
Diffuse and localized pollution phenomena characterize many aquifers located at foothills of Alps. In
particular in the Milano province high vulnerability values of local sediments are accompanied by
intense anthropic impact due to industrial and agricultural activities. Detailed researches on
environmental impact of anthropic activities started in the second half of past century. In particular
Martinis et al. (1976) described the hydrological characteristics of the Po plain between the Ticino and
Oglio rivers and identified main physical and chemical characteristics of phreatic nappe, of second
semi-confined aquifer and of deep local aquifer. Francani (1978) discussed pollution dispersion
phenomena in different sedimentary conditions of the Milano plain. Francani (1980) furtherly
discussed feeding characteristics of aquifers in the Milano area. Avanzini et al. (1995) preliminarly
described main isotopic features of the Milano province. Colombo et al.(1996) discussed
groundwatwer exploitation features in the highly industrialized area of Milano. Gorla (2001) described
hydrologic conditions of deep aquifers in the Milano area. Carcano and Piccin (2002) described all
aquifers of Lombardy Region and payed attention to hydrostratigraphic features. In particular three
main aquifers are widely present in the Milano province. The first aquifer is phreatic and is constituted
by gravels and sands derived from carbonatic Pre-Alpine hills. Semi confined and confined deepest
aquifers are characterized by more siliceous components attributable to alpine petrofacies (Carcano
and Piccin, 2002). The contemporary existence of high permeability aquifers and highly polluting
human activities caused matter of concern about vulnerability of aquifers in past
decades.
Fig. 1. Province of Milano - Sampling point area
1
Porto et al. (2006) summarized information coming from different sources with the purpose to compile
a new vulnerability map of the Milano province. Nitrate concentration increased during past three
decades inducing research Agencies and local Authorities to promote further researches on pollution
diffusion features of the area. With the purpose to better highlight nitrate increasing in groundwaters a
geochemical and isotopic prospection was recently launched by the Province of Milano (Fig. 1) in the
frame of “Progetto Nitrati”.
2. Sampling and analytical methods
Three test site areas (Fig. 1) were selected within the Milano province territory. In test site areas
groundwaters were sampled from wells characterized by depth in the range 20÷220 m.
In particular a group of wells was chosen in the first phreatic aquifer, while a second group was
chosen in the second, semiconfined aquifer in wells characterized by a depth of 40÷100 m. Some
samples were chosen in the deep aquifer in wells characterized by a depth of 100÷250 m.
All samples were collected in polyethylene 500 cc. bottles and stored in a refrigerator. Electric
conductivity, temperature and HCO3 were analyzed in the field. Cl, SO4, NO3, were measured by
Liquid Chromatography, while Ca, Mg, Na, K were analyzed by Atomic Absorption Spectroscopy.
Analytical error has been estimated <5%.
Oxygen and Hydrogen isotopes were analyzed by means of THERMO DELTAplus mass spectrometer
according to equilibration method. Nitrogen and Oxygen in NO3 were analyzed according to Fukada et
al. (2003).
3. Geochemical features of groundwaters
Main geochemical characters of analyzed samples are summarized in the Table 1 and in the Piper
diagram showed in Fig. 2. Ca-HCO3 ionic couple prevailed in all samples.
80
80
60
60
40
40
20
20
Mg
SO4
80
80
60
60
40
40
20
20
80
Ca
60
40
20
20
Na
HCO3
40
60
80
Cl
Fig. 2. Piper diagram of all sampled groundwaters.
Electric Conductivity values range between 200 and 800 μS/cm (Fig. 3).
2
Fig. 3. Regression line of Electric Conductivity vs HCO3 in Milano province's aquifers (R2=0.85).
600
550
2
R = 0.85
500
HCO3 (mg/l)
450
400
350
300
250
200
100
200
300
400
500
600
700
800
Electric Conductivity (μS/cm)
3
Cl
HCO3
SiO2
Ca
Mg
Na
K
22.3
42.1
0.5
3.9
41.8
0.5
54.2
46.8
37.8
39.9
35.0
49.2
44.6
20.2
45.5
15.6
45.3
11.1
48.0
46.9
27.7
41.2
35.7
35.4
31.1
52.3
42.0
49.7
35.2
56.9
43.0
28.5
61.5
28.3
35.2
35.1
11.1
20.0
55.0
28.7
16.8
29.5
6.0
6.1
22.8
4.9
36.2
31.2
8.4
24.0
4.0
11.6
24.5
1.0
39.9
5.0
36.0
34.0
7.0
6.0
25.0
16.0
32.0
13.0
36.0
37.0
31.0
30.0
27.0
21.0
32.0
10.0
38.0
13.0
42.0
32.0
27.0
41.0
26.0
41.0
43.0
32.0
38.0
52.0
34.0
45.0
44.0
26.0
39.0
28.0
39.0
35.0
27.0
39.0
44.0
25.8
26.8
37.5
21.0
4.6
12.4
12.9
29.4
19.2
9.0
33.7
14.7
14.0
36.5
5.9
38.6
3.0
35.0
13.0
2.0
7.0
11.0
7.0
12.0
13.0
18.0
20.0
18.0
14.0
15.0
14.0
24.0
6.0
31.0
14.0
24.0
26.0
17.0
12.0
19.0
26.0
32.0
25.0
16.0
32.0
29.0
20.0
23.0
10.0
18.0
17.0
18.0
22.0
14.0
15.0
29.0
12.6
19.1
23.7
3.5
4.8
9.2
12.5
20.8
15.9
7.6
23.6
12.5
10.6
24.6
7.4
23.3
7.1
420.5
496.4
415.7
386.1
452.6
504.5
450.8
399.9
436.1
443.5
401.6
426.6
367.8
472.0
418.5
410.5
413.4
393.6
357.7
396.9
435.4
447.4
451.4
352.5
524.9
512.6
368.7
431.8
430.5
419.2
440.9
353.8
420.1
406.4
394.1
444.7
424.2
556.0
543.1
438.8
374.4
345.0
263.8
258.0
361.1
273.1
480.5
423.3
349.9
497.8
389.5
304.8
475.9
268.1
505.2
280.8
18.1
17.8
15.0
14.7
15.4
15.1
15.9
12.0
11.4
14.5
17.2
12.5
22.2
16.7
13.5
13.1
11.9
18.4
16.6
16.1
13.2
12.0
17.1
18.6
15.9
15.8
13.0
17.0
16.4
19.0
15.6
16.4
19.6
15.0
15.7
14.3
13.9
16.1
10.7
15.2
14.7
11.1
14.1
14.0
16.7
16.0
15.0
13.8
14.2
14.1
14.6
14.1
13.3
17.9
15.0
15.3
114.2
114.2
91.0
95.2
114.9
118.6
119.7
101.3
105.6
127.0
108.7
111.0
102.3
108.3
118.6
100.3
118.5
100.1
111.3
80.4
114.4
115.7
114.9
103.6
115.6
121.5
107.9
86.7
97.5
114.5
101.3
93.2
118.2
95.1
92.7
106.3
95.4
126.5
133.9
107.9
93.1
84.5
71.2
70.1
83.2
71.0
110.5
98.4
88.8
104.1
92.6
69.9
114.1
60.4
122.7
67.6
29.6
28.3
19.3
22.7
28.3
27.0
27.3
23.4
22.2
28.7
21.1
31.0
23.1
20.2
27.6
21.2
30.2
20.7
22.6
18.2
25.7
27.2
28.4
23.4
28.9
26.4
20.4
19.9
24.5
26.5
29.4
20.5
27.9
24.1
18.2
24.6
18.2
40.9
41.1
27.9
18.2
18.7
16.4
14.2
19.1
14.8
27.7
22.7
18.2
26.8
20.9
12.9
26.5
16.9
27.0
17.4
13.6
37.3
14.7
9.7
14.8
13.2
21.4
14.9
36.9
9.0
19.7
10.2
9.6
36.2
12.8
11.6
16.8
8.6
12.8
63.9
14.7
18.6
19.5
13.0
54.3
42.8
10.0
75.3
40.5
21.2
37.8
12.6
10.9
28.9
42.3
49.1
33.2
17.5
26.9
14.7
36.8
45.3
6.6
1.8
26.6
14.9
46.5
31.8
14.9
55.7
24.5
30.6
50.6
10.2
52.4
8.6
1.2
3.8
1.4
1.0
1.4
1.4
2.0
1.5
3.7
0.8
2.0
1.1
1.0
3.5
1.2
1.2
1.6
0.7
1.2
6.3
1.3
1.9
2.0
1.4
5.4
4.2
1.0
7.5
4.0
2.1
3.8
1.3
1.0
2.9
4.2
4.9
3.3
1.7
2.7
1.4
3.6
4.4
0.5
0.2
2.7
1.5
4.6
3.0
1.4
5.4
2.4
3.0
5.0
1.0
5.2
0.7
δ18O-NO3
SO4
726.8
605.1
445.0
482.0
628.0
605.7
666.5
529.6
523.7
639.4
543.0
506.3
398.6
513.4
667.7
471.0
720.1
495.2
570.6
526.3
580.0
589.8
636.0
500.3
733.2
728.2
448.7
587.2
584.9
565.2
605.6
432.8
607.2
426.8
521.5
564.0
573.9
784.0
739.0
588.4
391.6
417.3
333.4
246.4
392.4
264.3
658.0
585.0
429.0
659.7
412.0
340.8
612.3
266.7
631.0
284.0
δ15N-NO3
NO3
05/12/06
22/11/06
11/12/06
11/12/06
22/11/06
22/11/06
22/11/06
08/11/06
24/11/06
24/11/06
24/11/06
13/12/06
13/11/06
05/12/06
22/11/06
22/11/06
22/11/06
22/11/06
30/11/06
21/11/06
01/12/06
08/11/06
07/11/06
13/11/06
13/12/06
06/11/06
13/11/06
06/11/06
06/11/06
21/11/06
24/11/06
24/11/06
22/11/06
01/12/06
13/11/06
22/11/06
21/11/06
07/11/06
27/11/06
21/11/06
20/12/04
22/04/04
03/11/04
11/10/04
06/10/04
06/12/01
05/05/04
12/05/04
22/04/04
16/09/03
16/09/03
05/10/04
16/12/04
15/07/04
15/07/03
14/01/03
δD-H2O
EC
40.0
95.0
57.3
144.9
33.5
77.1
89.0
42.0
46.0
79.7
55.0
45.5
80.0
55.0
61.3
51.5
48.0
38.0
60.0
37.0
126.0
103.5
22.0
67.0
40.8
14.0
59.3
22.5
23.0
32.7
78.0
86.0
58.0
90.0
52.0
126.0
45.0
23.0
49.0
39.5
102.0
187.0
206.0
170.0
140.0
198.6
32.0
54.0
92.0
59.0
150.0
210.0
45.0
180.0
76.0
149.0
δ18O-H2O
Sampling date
Agrate Brianza
Bernareggio
Biassono
Biassono
Cambiago
Cambiago
Cavenago di Brianza
Cerro Maggiore
Cinisello Balsamo
Cinisello Balsamo
Cinisello Balsamo
Gessate
Lainate
Lesmo
Lissone
Monza
Monza
Monza
Monza
Monza
Muggiò
Nerviano
Nerviano
Pero
Pessano con Bornago
Pogliano Milanese
Rho
Rho
Rho
Ronco Briantino
Sesto San Giovanni
Sesto San Giovanni
Sulbiate
Triuggio
Vanzago
Vedano al Lambro
Vedano al Lambro
castiglione stiviere
guidizzolo
merate
Abbiategrasso
Abbiategrasso
Arconate
Assago
Barlassina
Barlassina
Bellinzago Lombardo
Bellinzago Lombardo
Bellinzago Lombardo
Caponago
Caponago
Casorezzo
Cernusco sul Navigl
Cerro al Lambro
Cinisello Balsamo
Cinisello Balsamo
Depth
1
2
3
4
5
6
7
8
9
10
11
12
13
14
15
16
17
18
19
20
21
22
23
24
25
26
27
28
29
30
31
32
33
34
35
36
37
38
39
40
41
42
43
44
45
46
47
48
49
50
51
52
53
54
55
56
Municipality
ID
Table 1
Chemical and isotopic composition of sampled groundwater
9.8 9.1
-8.06 -52.0 6.6 6.9
-8.32 -53.8 7.7
-8.40 -56.0
5.3
-8.40 -55.8
8.1 6.4
-8.19 -53.8 8.5 10.3
-8.14 -53.2 6.9
-7.99 -53.6 4.7
7.7
-8.35 -54.6 5.7
-8.25 -54.0 7.4 2.4
-8.02 -51.2 7.6
-7.69 -50.6 7.4 4.6
6.2 4.7
7.8 4.7
-8.21 -54.5 5.7 7.2
-7.38 -48.1 8.6
-7.36 -48.5 8.4
7.8 3.7
7.0 7.6
5.7 2.4
-8.96 -60.7 6.2 6.5
7.8 6.4
8.2 2.8
-8.59 -56.5 7.1 4.9
-8.28 -55.2 8.9 4.5
6.2 3.8
9.2 7.7
7.1 4.7
-8.50 -55.3 4.2
8.1 6.4
-7.85 -50.9 6.7
-8.61 -58.3 6.6
-7.56 -50.1
7.0
7.1
6.5
-7.97 -51.6 6.4
4
Cl
HCO3
SiO2
Ca
Mg
Na
K
2.0
26.3
4.8
23.0
21.0
41.3
14.0
26.5
7.1
2.0
2.0
9.5
4.0
5.1
10.0
13.8
45.0
15.8
14.7
42.0
17.5
1.9
41.6
40.7
15.4
29.7
9.1
5.2
11.2
3.4
2.5
2.0
9.6
4.1
3.0
12.6
10.8
35.5
20.0
32.8
11.0
21.0
4.8
16.0
2.0
10.0
7.0
16.5
7.5
50.0
39.3
23.5
27.1
39.0
19.0
3.0
37.5
23.0
9.4
15.6
16.0
8.3
7.5
10.5
8.0
7.0
25.1
6.4
4.8
11.0
9.4
21.8
15.6
19.7
8.4
17.1
6.4
10.8
3.5
8.3
6.9
11.9
7.7
31.1
24.7
15.9
18.7
24.5
13.1
6.2
22.5
16.8
9.0
12.4
12.0
9.1
9.8
10.5
9.2
7.0
15.3
8.3
246.8
318.4
341.1
426.1
329.2
406.6
321.2
359.5
237.7
348.7
296.1
374.7
316.9
364.8
295.3
403.4
477.3
342.5
372.7
499.0
360.5
258.1
419.3
363.0
278.2
372.2
294.8
348.8
306.8
329.2
326.6
291.6
377.2
366.5
17.3
18.9
15.7
15.0
14.3
15.8
16.1
16.1
18.7
16.0
15.7
12.0
17.6
11.6
14.8
18.0
19.7
14.4
12.9
14.4
14.9
13.1
15.3
17.1
14.4
15.8
17.8
16.5
18.0
13.3
15.8
17.8
15.9
16.0
60.9
71.6
80.2
99.1
78.8
100.2
76.7
90.5
56.3
84.2
75.7
88.4
70.6
74.9
74.1
91.8
123.9
83.4
84.2
116.9
84.1
63.0
107.8
90.6
61.3
85.2
71.9
78.8
71.9
69.8
66.8
59.9
88.9
82.2
12.4
18.8
20.7
24.2
20.8
24.4
16.8
22.3
14.6
19.8
16.3
19.8
19.5
21.0
17.8
24.9
28.0
21.9
21.9
27.6
20.3
15.4
26.7
22.8
17.8
21.9
16.6
20.6
18.2
19.1
16.2
15.3
22.5
19.9
5.2
29.1
15.1
49.8
29.0
42.7
23.4
27.6
9.2
19.9
5.1
19.9
14.3
32.7
5.4
55.9
42.0
23.1
40.1
55.8
31.8
3.9
35.2
32.0
16.8
29.1
18.6
17.2
17.5
24.0
25.6
21.2
24.9
16.4
0.4
2.8
1.4
5.0
2.9
4.2
2.2
2.7
0.9
2.0
0.8
2.0
1.3
3.3
0.5
5.6
4.1
2.4
4.0
5.6
3.2
0.3
3.4
3.2
1.7
3.0
1.8
1.6
1.8
2.4
2.5
2.0
2.6
1.6
δ18O-NO3
SO4
214.0
337.0
403.1
529.0
406.4
538.3
265.3
461.0
183.6
372.0
354.0
372.7
360.0
415.3
300.7
554.0
665.6
448.0
447.3
651.0
390.5
214.0
619.5
481.4
299.7
446.0
256.6
400.7
313.0
348.6
244.2
208.4
469.5
374.0
δ15N-NO3
NO3
14/01/03
15/12/04
09/06/04
09/11/04
09/11/04
20/08/03
16/07/03
12/11/03
17/11/04
16/12/03
17/12/03
03/11/04
03/11/04
14/10/04
14/10/04
19/04/04
15/11/04
13/05/04
31/05/04
10/09/03
10/09/03
20/09/04
10/11/04
29/11/04
29/11/04
29/11/04
20/10/03
26/05/04
14/09/04
11/05/04
14/12/04
14/12/04
09/06/04
09/06/04
δD-H2O
EC
180.0
165.0
115.0
133.5
186.0
109.0
148.0
63.0
176.0
100.0
160.0
150.0
178.0
125.0
153.0
136.0
70.0
90.0
87.0
80.0
151.0
164.0
70.0
100.0
164.0
100.0
200.0
118.5
170.0
200.0
152.0
184.0
90.0
143.0
δ18O-H2O
Sampling date
Cinisello Balsamo
Cogliate
Colturano
Corbetta
Corbetta
Desio
Desio
Desio
Garbagnate Milanese
Grezzago
Grezzago
Inveruno
Inveruno
Legnano
Legnano
Lissone
Lissone
Melzo
Melzo
Muggiò
Muggiò
Nerviano
Nova Milanese
Parabiago
Parabiago
Parabiago
Parabiago
Paullo
Pogliano Milanese
Pogliano Milanese
Rho
Rho
Tribiano
Tribiano
Depth
57
58
59
60
61
62
63
64
65
66
67
68
69
70
71
72
73
74
75
76
77
78
80
81
82
83
84
85
86
87
88
89
90
91
Municipality
ID
Table 1 (continued)
HCO3 highest values are found in the first phreatic aquifer, due to prevalence of pre alpine calcareous
rocks in aquifer. Lowest HCO3 values are found in the second semiconfined aquifer. Siliceous matrix
is characterized by limited release of salts during water interaction processes, thus upper aquifers are
relatively enriched in HCO3 compared to second and deep aquifers (Fig. 4).
HCO3 (mg/l)
200
0
250
300
350
400
450
500
550
600
50
R2 = 0.59
Depth (m)
100
150
200
250
Fig. 4. Regression line of HCO3 vs depth in Milano province's aquifers (R2=0.59).
5
Nitrate are particularly present in the north of the Milano province and are related to the existence of
towns sewages, of cattle-breadings and to the wide utilizations of inorganic fertilizers, thus isotope
techniques were utilized to better understand groundwaters origin and to discriminate the exact origin
of Nitrogen.
4. Isotopic characteristics
Isotopic values are summarized in Table 1. The obtained isotopic water line (Fig. 5) is very similar to
the line obtained by Longinelli and Selmo (2003) utilizing precipitation samples collected in Northern
Italy (δD = 7.7 δ18O +9.4).
δ18O (V-SMOW)
-9
-8.5
-8
-7.5
-7
-44
δD = 7,4 δ18 O + 6,6
R2 = 0,93
-54
δD (V-SMOW)
-49
-59
-64
Fig. 5. Regression line of δ18O vs δD isotopic groundwater composition in Milano province's aquifers.
Values in the interval -7 ÷ -8 were found in the upper aquifer and evidence local recharge processes
(Longinelli and Selmo, 2003). More depleted samples were found in the second and third aquifer.
They evidence that deeper aquifer are feeded by waters precipitated on Pre-Alpine and Alpine
mountains.
Some samples collected in wells characterized by shallow depth were also characterized by relatively
depleted values in Oxygen and Hydrogen isotopes due to the feeding effects of the close Villoresi
Channel (Fig. 6).
δ18O (V-SMOW)
-8.4
South
y = 6.9x + 3.1
2
R = 0.87
-8
-7.6
North
y = 7.3x + 5.8
2
R = 0.99
-7.2
-47
-52
δD (V-SMOW)
-8.8
-57
18
Fig. 6. Regression lines of δ O vs δD composition in selected wells near Villoresi Channel
Nitrogen isotopic values were found in the range +4.5 ÷ +10 (Fig. 7). All samples are in the typical
range of organic derived Nitrogen (Clark and Fritz, 1997; Kendall, 1998).
6
14
12
Frequency
10
8
6
4
2
0
1
2
3
4
5
6
7
8
9
10
Altro
δ15N-NO 3 class
Fig. 7. Frequency distribution of δ15N in nitrate coumpound of sampled groundwaters
Although all samples were found, in principle, originated by organic processes a significant dispersion
of values is noticeable (Fig. 8). Obtained values (Fig. 9) allow to confirm the organic origin of
Nitrogen compounds collected in considered wells. Similar values were collected by Dadomo et al.
(2005), Pilla et al. (2005).
70
60
NO3 (mg/l)
50
40
30
20
10
0
0.0
2.0
4.0
6.0
8.0
10.0
12.0
δ15N-NO3
Fig. 8. δ15N vs NO3 in sampled groundwaters
25
Synthetic
NH4 - NO3
fertilizer
20
δ18Ο − ΝΟ 3
15
Mineralized
NH4 - NO3
10
fertilizer
Manure, septic system effluent
5
0
-10
-5
0
5
10
15
20
25
30
δ15N - NO3
Fig. 9. δ15N vs δ18O in sampled wells
In the centre-north area of the Milano province a nitrate dilution process as been evidenced: high
nitrate content waters characterized by a δ18O typical of rains (Longinelli and Selmo, 2003) are diluted
with isotopically depleted waters typical of deeper aquifers feeded by northern areas (Fig. 10).
7
NO3 (mg/l)
0
10
20
30
40
50
60
-7,2
-7,4
-7,8
-8,0
18
δ O-H2O (V-SMOW)
-7,6
-8,2
-8,4
-8,6
Fig. 10. Different dilution processes evidenced by NO3 and δ18O-H2O in sampled groundwaters
5. Vulnerability implications
Highest organic Nitrogen values were found in some hot spot areas of the Milano province. Not all
identified areas are affected by cattle-breadings areas, thus urban sewages originated by towns can be
considered responsible for observed pollution phenomena. Available vulnerability map (Porto et al.,
2006) allows a general description of potentially vulnerable areas obtained by superimposition of
informative layers related to water depth, aquifer permeability, slope, etc. No informative layers
related to processes originating Nitrogen compounds is considered and obtained data on Nitrogen
isotopes should be considered as an additional parameter useful to better constraint vulnerability
characteristics of the Milano province.
In particular intrinsic vulnerability evaluated by means of SINTACS methodology (Civita, 1994)
considers phreatic aquifer. In the considered area aquifer setting is relatively heterogeneous and
aquifers located in the Northern side of the Milano province are characterized by gravel and sands and
exploited both at shallow and highest depths. In the Southern side aquifers are multilayered and
exploited only at depth > 30 m characterized by low vertical permeability. Usual hydrochemical
monitoring techniques don't allow to effectively detect pollution phenomena, while isotopic
techniques allowed the detection of more detailed pollution phenomena processes.
However an isoconcentration map for nitrates is useful to identify a local criticality. A critical small
zone (pilot area) in north of Milan Province has been analyzed in order to estimate trends about nitrate
concentrations in groundwater (complying the Directive 2006/118/EC).
Fig. 11. Isoconcentration Map for Nitrate in Milano Province – 2004
8
23 wells have been analyzed in such area: 90% of distributed water exceed 37,5 mg/l (75% of the
CMA, Concentration Maximum Admissible. Fig.12).
90
80
% vol. soll.
70
60
50
40
30
20
11
2
10
5
0
87
% vol. soll.
1
0-18
17
19-37,5
N° pozzi
>37,5 mg/l
Fig. 12. Distribution of water withdrawn from some public wells in the critical area. Water amounts
are divided into three concentration classes which reflect quality of resource.
6. Conclusions
Exploitation of groundwater resources has risen because demand and uses had risen in recent years
(drinking water, industrial, geothermal etc.). Generally quality of resource is getting worse and
concentrations of such pollutants (in particular nitrates) increased in last decades.
The Province of Milano, as a control agency, has the task to protect and monitor water resources and
must promote an integrated policy to planning a sustainable management in the long time (complying
the Regional Law of Lombardia 26/2003).
From a hydrogeological point of view water resource of superficial layers of the subsoil (Traditional
Acquifer - A + B) ensure high productivity in this area; nevertheless the gradual deterioration of these
layers led authorities to the treatment of resource as well as a gradual deepening of the filters, in order
to intercept the deeper waters, characterized by limited productivity but by a discrete quality.
Nowadays a great number of wells are digged next to the towns and scattered without sustainable
criteria.
Yet water demand will not be satisfied by contribute of deep acquifers alone and, at the same time,
employment of higher acquifers has considerably increased to generate energy (heat pumps).
Obtained values allow to confirm highly vulnerable characteristics of explored aquifers. Oxygen and
Hydrogen isotopic ratios of sampled waters evidenced that shallow aquifers are feeded by local
precipitations. This feature confirm that most local pollution phenomena are characterized by short
paths and short time duration processes. Longer times allows dilution processes of pollutants able to
affect the deeper aquifers. Nitrogen isotopic values and Oxygen isotopic ratio in Nitrate allowed to
identify the organic origin of Nitrogen.
However, in areas where anthropic impact is lower, short time recharging allows a good regeneration
of groundwater in higher acquifers. This hypothesis would explain worst quality of deep waters in
such areas, which require a longer recharging time.
Previous studies on isotopic features of the Milano area were carried out by the University
(Politecnico di Milano) and by the Drinking Water Consortium (CAP), outlined the average residence
time of local groundwaters by means of Tritium and Carbon 14 data. Deep aquifers are characterized
9
by relatively short residence times and their pollution could be consistent with the impact caused by
industrial waste during the maximum period of industrialization.
The exploitation of deep aquifers could be uncorrect in the medium-long term. Overexploitation for
irrigation or for geothermal purposes could irreparebly deplete strategic water resources useful for
civil and industrial utilizations.
Planning activities should consider both quantitative and qualitative features of groundwaters and
isotopic techniques, monitoring techniques and tridimensional modeling will allow to:
1. upgrade water withdrawal permits criteria
2. localize strategic aquifers whose exploitation should be allowed in monitored and planned
conditions
3. recovery polluted aquifers
4. reduce industrial and agricultural pollution
5. localize areas characterized by polluting sewages systems in order to refurbish them
Infact a significant amount of Nitrogen is generated by local sewages and local Authorities should
avoid further environmental worsening.
Deeper isotopic prospection studies are possible in specific areas in Milan in order to:
• better census of critical area
• definition of critical points
• improvement of monitoring methods
Next steps are necessary to deepen local criticalness:
1. defining new isotopic and hydro-chemical analyses
2. achieving even geo-physical investigation if necessary
3. defining a mathematical model.
This method would improve groundwaters management in order to better exploit water-resource for
human hydro-potable uses in the future.
The Province of Milano would develop an instrument of resource management based on the revision
of the existing monitoring networks with geostatistical criteria, divided into homogeneous aquifers,
which will allow, together with the use of modeling system, to locate the existing
qualitative/quantitative criticities, and to plan both waters resources management activities and the
actions having an evident impact on it:
• planning of new wells for hydro-potable use and renovation of the existing ones,
• location of contamination sources, either spread or punctual,
• renovation of sewer systems
1
Acknowledgements Thanks are due to Paolo Jean, Edmondo Rizzo (ARPA LOMBARDIA), Enrico Casalini
(ASL MI3), Milena Repetti (ARPA EMILIA ROMAGNA) and Maurizio Gorla (CAP Gestione spa) for valuable
support to present research during the organizative stage and during analytical phase.
References
Avanzini M., Beretta G.P., Francani V., Nespoli M. (1995) - "Indagine preliminare sull'uso sostenibile delle
falde profonde nella provincia di Milano". Ed. CAP Milano
Colombo F., Raffaelli L., Raimondi P., Rosti G. (1996) - "Le problematiche idrogeologiche delle aree altamente
industrializzate: l'esempio di Milano"C.N.R. - G.N.D.C.I., Pubblicazione n°1351
Dadomo A, Fava A, Martinelli G, Russo E, Sogni R (2005) Nitrogen sources identification by hydrogeochemical
and isotopic survey in aquifers of the Piacenza plain. “Aquifer Vulnerability and Risk”, 2nd International
Workshop, 4th Congress on the Protection and Management of Groundwater, CD Edition, ID220.
Colorno, 21-22-23 Settembre 2005.
Fukada T, Hiscocka K M, Dennisa P F, Grischek T (2003) A dual isotope approach to identify denitrification in
groundwater at a river-bank infiltration site. Water Research Vol. 37:3070–3078.
Gorla M. (2001) - "Acquiferi confinati profondi della Provincia di Milano: sviluppi delle conoscenze
idrogeologiche e idrochimiche ai fini di un loro uso sostenibile". Acque Sotterranee, 73, 9-27.
Kendall C (1998) Tracing nitrogen sources and cycles in catchments. In: Kendall C and McDonnel JJ (eds.)
Isotope tracers in catchment hydrology. Elsevier, 519-576
Clark I, Fritz P (1997) Environmental isotopes in hydrogeology. Lewis Publishers, Boca Raton, New York,
328 pp.
Carcano C, Piccin B (2002) Geologia degli acquiferi Padani della Regione Lombardia. In: Regione Lombardia,
ENI-AGIP. S.EL.CA, Firenze, 130 pp.
Civita M. (1994) Le carte della vulnerabilità degli acquiferi all’inquinamento. Quaderni di tecniche di protezione
ambientale Vol. 7:229-240
Francani V (1978) I metodi idrogeologici per lo studio della evoluzione degli inquinamenti delle acque
sotterranee nella pianura Milanese. Quaderni dell’Istituto di Ricerca sulle Acque Vol. 34:229-239.
Francani V (1980) Le condizioni di alimentazione delle falde della regione Milanese. Quaderni dell’Istituto di
Ricerca sulle Acque Vol. 51:33-55.
Longinelli A, Selmo E (2003) Isotopic composition of precipitation in Italy: a first overall map. Journal of
Hydrology Vol. 270:75-88.
Martinis B, Pozzi R, Cavallin A, Mancuso M (1976) Indagine sugli acquiferi della Lombardia centro
settentrionale. Quaderni dell’Istituto di Ricerca sulle Acque Vol. 28:97-134
Pilla G, Sacchi E, Zuppi G, Braga G, Ciancetti G (2005) Hydrochemistry and isotope geochemistry as tools for
groundwater hydrodynamic investigation in multilayer aquifers: a case study from Lomellina, Po plain,
South-Western Lombardy, Italy. Hydrogeology Journal Vol. 14:795-808
Porto G, Mauri S, Arduini C (2006) Nuova carta della vulnerabilità ai Nitrati come strumento per la
pianificazione delle risorse idriche e gestione delle emergenze. 10a Conferenza Nazionale ASITA, CD
Edition,, Fiera di Bolzano, Bolzano, Bolzano, 14 - 17 novembre 2006
1
© Copyright 2026 Paperzz