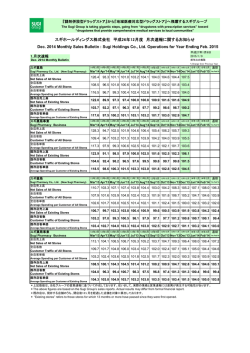
1st Quarter Results for FY Ending Feb.28, 2014
Stock code : 7649 TSE1, NSE1
DATA FILE
2014年2月期 第1四半期決算
(平成25年3月1日~平成25年5月31日)
1st quarter results for FY ending Feb.28 2014
March 1 2013 ~ May 31 2013
会社名
スギホールディングス株式会社
Corporate Name:Sugi Holdings Co.,Ltd.
代表者名 代表取締役社長 桝田 直
Representative Director:Tadashi Masuda
(コード番号 7649 東証1部・名証1部)
(Stock Code:7649 TSE 1,NSE 1)
問合せ先 経営企画室長 笠井 真
TEL : 0566-73-6308
E-Mail : [email protected]
English Contact
Name : Makoto Kasai
General Manager of Business Planning Division
TEL : +81-566-73-6308
E-Mail : [email protected]
本資料で記述されております業績予想ならびに将来予想は、現在入手可能な情報から得られたスギホールディングスの経営者の判断に基
づいております。したがいまして、潜在的なリスクや不確実性が含まれており、これら業績見通しのみに全面的に依拠することは控えるようお
願い致します。実際の業績は様々な要素により、これら業績見通しとは大きく異なる結果となりうることを、ご承知おき下さいませ。
The forward-looking statements regarding business and other forecasts are Sugi Holdings management’s decisions based on
current information available at the time the report was created, and contain risks and uncertainties. We recommend that readers
do not base their decisions solely on these forecasts, and readers are reminded that actual results may differ materially from
these forecasts due to various circumstances beyond management’s control.
Sugi Holdings Co., Ltd.
-1-
1st Quarter Results for FY Ending Feb.28, 2014
Stock code : 7649 TSE1, NSE1
1. ビジョンと経営指標
Vision and Management Indicators
1.-1. 2015年ビジョンと目標とする経営指標
Vision 2015 and Target Management Indicators
当社は、中期的な経営目標として2015年ビジョンを掲げております。
Sugi Holdings Co., Ltd. created new medium term Vision for 2015.
2015年ビジョンとは、2015年度に店舗数1,500店舗、売上高5,000億円を達成することであります。
この数値目標を達成するため、地域医療対応型のドラッグストアを完成させるとともに、成長スピードを加速して参ります。
This Vision 2015 pursues to achieve 1500 stores and sales of 500 billion yen by 2015. To achieve the measurable targets set in this
Vision, Sugi Group shall transform into new drugstore serving to provide all medical services to local communities and accelerate our
growth.
また、事業規模の拡大とともに、高収益を実現し株主価値の向上を図るため、その経営指標として連結ROE(自己資本利益率)
10%以上としております。
To expand the business scale and improve the shareholder value supported by high profitability, the Company
is targeting a consolidated return on equity (ROE) of over 10%.
経営数値
Management
Indicators
2006年2月期 2007年2月期 2008年2月期 2009年2月期 2010年2月期 2011年2月期 2012年2月期 2013年2月期
FY 2/2006
FY 2/2007
FY 2/2008
FY 2/2009
FY 2/2010
FY 2/2011
FY 2/2012
FY 2/2013
単体
連結
連結
連結
連結
連結
連結
連結
Non Consolidated Consolidated Consolidated Consolidated Consolidated Consolidated Consolidated Consolidated
総店舗数
Total No. of Stores
328
510
624
678
725
774
821
871
122,928
217,229
248,134
272,197
293,511
304,730
327,267
343,613
10.1
7.5
11.6
7.9
7.2
11.4
13.0
12.8
(百万円)
総売上高
Million
Gross Sales
Yen
自己資本
利益率
(%)
ROE
単位:億円
Unit: 100million yen
3,660
3,436
3,272
3,047
2,935
2,721
2,481
売上高の推移
4,000
3,500
3,000
2,500
2,172
2,000
1,500
1,229
1,050
874
196
89 130
292
402
524
1,000
661
500
0
2013E
2012
2011
2010
2009
2008
-2-
2007
2006
2005
2004
2003
2002
2001
2000
1999
1998
1997
1996
Sugi Holdings Co., Ltd.
1st Quarter Results for FY Ending Feb.28, 2014
Stock code : 7649 TSE1, NSE1
1.-2 主要な経営指標
Major Financial Indicators
2009年2月期 2010年2月期 2011年2月期 2012年2月期 2013年2月期
FY 2/2009
FY 2/2010
FY 2/2011
FY 2/2012
FY 2/2013
連結
連結
連結
連結
連結
Consolidated Consolidated Consolidated Consolidated Consolidated
売上高
Net Sales
百万円
Million Yen
272,197
293,511
304,730
327,267
343,613
営業利益
Operatig Income
百万円
Million Yen
11,845
10,145
12,777
17,215
18,421
経常利益
Ordinary Income
百万円
Million Yen
13,601
12,277
15,012
19,160
22,696
当期純利益
Net Income
百万円
Million Yen
5,374
5,180
8,999
11,426
12,630
資本金
Capital Stock
百万円
Million Yen
15,434
15,434
15,434
15,434
15,434
純資産額
Net Assets
百万円
Million Yen
70,323
74,570
82,755
93,205
103,948
総資産額
Total Assets
百万円
Million Yen
116,367
124,888
136,243
154,369
164,783
株主資本比率
Equity Ratio
%
60.4
59.7
60.7
60.4
63.1
自己資本利益率
Return on Eqity
%
7.9
7.2
11.4
13.0
12.8
総資産経常利益率
Return on Assets
%
11.9
10.2
11.5
13.2
14.2
営業活動によるキャッシュフロー
Cash Flows from Operating Activities
百万円
Million Yen
8,368
5,505
17,796
19,179
13,282
投資活動によるキャッシュフロー
Cash Flows from Investing Activities
百万円
Million Yen
1,436
-7,195
-14,463
-13,875
-13,177
財務活動によるキャッシュフロー
Cash Flows from Financial Activities
百万円
Million Yen
-3,926
-834
-848
-932
-2,033
現金及び現金同等物の期末残高
百万円
Million Yen
23,757
21,700
24,185
28,556
26,627
Cash and Cash Equivalents at End-End
Sugi Holdings Co., Ltd.
-3-
Financial Results for the 1st Quarter FY Ending Feb.28, 2014
Stock code : 7649 TSE1, NSE1
2.-1 スギホールディングス連結貸借対照表概要
Sugi
Holdings Consolidated Balance Sheet Summary
単位:百万円
Unit:Million Yen
現金及び預金
Cash and Cash Equivalent
商品
Inventories
その他
Others
流動資産
Current Assets
有形固定資産
Tangible non-current assets
無形固定資産
Tangible non-current assets
投資その他の資産
Investments and others
固定資産
Fixed assets
資産合計
Total assets
流動負債
Current liabilities
固定負債
Total liabilities
負債合計
Total liabilities
資本金
Capital stock
資本剰余金
Capital surplus
利益剰余金
Retained earnings
自己株式
Treasury stock
株主資本
Shareholder’s equity
評価換算差額等合計
Total valuation and translation adjustments
純資産合計
Total net assets
負債・純資産合計
Total liabilities and net assets
2012年2月期 2013年2月期
2014年2月期
FY 2012/2
FY 2013/2
FY 2014/2
期末
期末
第1四半期末 前期末との増減
Feb.29 2012 Feb.28 2013 May 31 2013
Change
41,627
37,556
44,018
+2,390
36,798
39,611
41,611
+1,999
28,817
29,165
35,881
+6,716
103,171
110,403
121,510
+11,106
28,968
31,871
32,351
+480
2,343
2,204
2,341
+137
19,886
20,303
20,044
-259
51,198
54,379
54,737
+357
154,369
164,783
176,248
+11,464
54,382
53,601
61,351
+7,750
6,782
7,234
7,422
+188
61,164
60,835
68,774
+7,938
15,434
15,434
15,434
-
24,632
24,632
24,632
-
53,160
63,891
67,411
+3,520
-34
-35
-37
-1
93,193
103,922
107,441
+3,519
11
25
32
+6
93,205
103,948
107,473
+3,525
154,369
164,783
176,248
+11,464
2.-2 スギホールディングス連結損益計算書概要
Sugi Holdings Consolidated Income Statement Summary
2013/2期 通期
2012/3-2013/2
百万円
Million Yen
構成比 前期比
Share
(%)
YoY
(%)
売上高
343,613 100.0 105.0
Net Sales
売上総利益
93,749 27.3 106.8
Gross Profit
販売費及び一般管理費
75,327 21.9 106.8
SG&A Expenses
営業利益
18,421
5.4 107.0
Operating Income
営業外収益
5,538
1.6 167.6
Non-Operating Income
営業外費用
1,263
0.4 93.0
Non-Operating Expenses
経常利益
6.6 118.5
22,696
Ordinary Income
特別利益
0.0
0
Extraordinary Income
特別損失
0.2 27.8
619
Extraordinary Losses
税引き前利益
6.4 113.8
22,077
Net Income Before Income Taxes
法人税等合計
9,447
2.7 118.5
Income Taxes
純利益
3.7 110.5
12,630
Net Income
* 比率は四捨五入しております。 Rate is rounding off it.
Sugi Holdings Co., Ltd.
-4-
2014/2期 第1四半期
2013/3-2013/5
2013/2期 第1四半期
2012/3-2012/5
構成比 前期比
百万円
Million Yen
Share
(%)
YoY
(%)
84,254 100.0 106.2
構成比 前期比
百万円
Million Yen
Share
(%)
YoY
(%)
90,441 100.0 107.3
22,683
26.9 104.9
25,260
27.9 111.4
18,056
21.4 107.7
19,470
21.5 107.8
4,627
5.5
95.1
5,790
6.4 125.1
1,314
1.6 148.1
1,964
2.2 149.5
293
5,648
0.3
53.9
286
6.7 108.5
7,468
0.3
97.6
8.3 132.2
0
0.0
-
0
0.0
-
0
0.0
0.0
16
0.0
-
5,648
6.7
92.2
7,452
8.2 131.9
2,398
2.8 134.7
2,982
3.3 124.4
3,250
3.9
4,470
4.9 137.5
74.8
Financial Results for the 1st Quarter FY Ending Feb.28, 2014
Stock code : 7649 TSE1, NSE1
2.-3 スギホールディングス連結販管費概要
Sugi Holdings Consolidated Selling, General and Administrative Expenses
2013/2期 通期
2013/2期 第1四半期
2014/2期 第1四半期
2012/3-2013/2
2012/3-2012/5
2013/3-2013/5
構成比 前期比
百万円
Million Yen
売上高
Net Sales
人件費
Personnel Expenses
広告宣伝費
Advertising Expenses
景品費
Premium Expenses
販売費
Selling Expenses
賃借料
Rent Expenses
減価償却費
Depreciation & Amortization
水道光熱費
Utility Expenses
消耗品費
Supplies Expenses
租税公課
Tax & Public Imposts
支払手数料
Commission Fees
その他
Others
一般管理費
General and Admin. Expenses
Share
(%)
YoY
(%)
343,613 100.0 105.0
35,466
10.3 106.2
構成比 前期比
百万円
Million Yen
Share
(%)
YoY
(%)
84,254 100.0 106.2
構成比 前期比
百万円
Million Yen
Share
(%)
YoY
(%)
90,441 100.0 107.3
8,701
10.3 104.8
9,683
10.7 111.3
4,252
1.2
97.7
1,107
1.3 122.0
1,002
2,779
0.8 122.6
668
0.8 123.0
738
7,032
2.0 106.2
1,775
2.1 122.4
1,740
1.9
14,699
4.3 105.3
3,608
4.3 104.1
3,826
4.2 106.0
4,655
1.4 121.9
1,061
1.3 127.3
1,090
1.2 102.7
3,609
1.1 111.6
775
0.9 116.2
850
0.9 109.7
2,048
0.6
93.9
449
0.5 101.9
472
0.5 105.1
1,217
0.4 114.4
300
0.4 117.9
342
0.4 114.0
2,316
0.7 107.6
499
0.6 107.3
530
0.6 106.2
4,281
1.2 114.6
885
1.1 101.2
916
1.0 103.5
32,829
9.6 107.5
7,579
9.0 108.2
8,045
8.9 106.1
21.9 106.8
18,056
21.4 107.7
19,470
21.5 107.8
販管費及び一般管理費
75,327
Total SGA
* 比率は四捨五入しております。 Rate is rounding off it.
1.1
90.5
0.8 110.5
98.0
2.-4 スギホールディングス連結業績見通し
Sugi Holdings Consolidated Earnings Forecasts
2014年2月期通期 連結当初見通し
単位:百万円、% Consolidated, Original Forecasts for FY Feb.2014
前期比
上期
下期
通期
Unit:Million Yen,%
1st Half
2nd Half
Full Term
YoY
売上高
183,400
182,600
366,000 106.5
Net Sales
売上総利益
49,480
49,170
98,650 105.2
Gross Profit
営業利益
19,000 103.1
10,370
8,630
Operating Income
経常利益
11,420
9,680
21,100
93.0
Ordinary Income
純利益
6,055
5,245
11,300
89.5
Net Income
*2013年2月期、 EPS : 199円 47銭
*FY Feb.2013 EPS : JPY199.47
*2014年2月期、予想EPS : 178円 47銭
*FY Feb.2014 EPS : JPY178.47
Sugi Holdings Co., Ltd.
-5-
<2014年2月期 業績見通しの前提条件>
Assumptions for FY Feb.2014 Original Forecasts
◆新規出店数: 83店舗
New Stores : 83Stores.
退店数: 14店舗
Closing:14Stores
◆既存店売上伸率の前提
Sales Growth Ratio of Existing Stores
上期
+1.1%
1H
下期
+1.7%
2H
通期
+1.4%
FY
◆設備投資 :13,000百万円
Capital Expenditures : JPY13,000m
◆減価償却 :5,000百万円
Depreciation :JPY5,000m
+1.1%
+1.7%
+1.4%
Financial Results for the 1st Quarter FY Ending Feb.28, 2014
Stock code : 7649 TSE1, NSE1
3. スギグループ出店状況と設備投資等
Sugi Group Store Openings and Investment
3.-1 スギグループ都道府県別拠点数
Sugi Group Number of Stores by Region
平成25年2月末現在
As at the End of Feb. 2013
スギ薬局
茨城県
Ibaraki
栃木県
Tochigi
群馬県
Gunma
埼玉県
Saitama
千葉県
Chiba
東京都
Tokyo
神奈川県
Kanagawa
関東小計
Kanto Sub Total
岐阜県
Gifu
静岡県
Sizuoka
愛知県
Aichi
三重県
Mie
中部小計
Chubu Sub Total
滋賀県
Shiga
京都府
Kyoto
大阪府
Osaka
兵庫県
Hyogo
奈良県
Nara
関西小計
Kansai Sub Total
スギ訪問看護
ステーション
ジャパン
Sugi
Pharmacy
Business
在宅医療
実施店舗
In-Home
Medical
Care
平成25年5月末現在
As at the End of May 2013
Japan
Business
合計
Sugi Visit
Nursing
Total
Care Station
スギ薬局
スギ訪問看護
ステーション
ジャパン
Sugi
Pharmacy
Business
在宅医療
実施店舗
In-Home
Medical
Care
Japan
Business
出店
退店
合計
Sugi Visit
Nursing
Total
Care Station
2 (1)
0
0
2
2 (1)
0
0
2
2 (0)
1
0
3
2 (0)
1
0
3
33 (1)
3
0
36
31 (1)
4
0
35
64 (9)
28
1
93
62 (9)
28
1
91
5 (1)
0
1
6
6 (2)
0
1
7
48 (8)
5
2
55
51 (11)
5
2
58
15 (5)
0
1
16
15 (5)
0
1
16
169 (25)
37
5 211
169 (29)
38
39 (4)
0
0
39
39 (5)
0
0
39
14 (1)
0
0
14
13 (2)
0
0
13
262 (57)
0
2 264
265 (65)
0
2 267
49 (7)
0
0
49
49 (6)
0
0
364 (69)
0
2 366
366 (78)
0
2 368
27 (5)
3
0
30
28 (8)
3
0
31
21 (4)
14
0
35
21 (4)
14
0
35
86 (19)
57
4 147
88 (18)
57
4 149
35 (8)
36
0
71
36 (10)
36
0
72
5 (3)
6
0
11
5 (3)
6
0
11
174 (39)
116
4 294
178 (43)
116
Opening
and
closing
5 212
878
【Note】The number for 'In-Home Medical Care' is the number of stores of Sugi Pharmacy that provide in-home medical care
services. Total number of stores (one store reduces the closured store of Sugi Pharmacy business in Aichi prefecture) were
corrected, because of there is a mistake in the number of stores monthly report of June 10.
Sugi Holdings Co., Ltd.
-6-
-2
+1
+4
-1
+5
-4
+1
-1
-1
+4
-1
49
4 298
総拠点数
707 (133)
11 871
154
11
153
713 (150)
Total
*在宅医療実施店舗の数はスギ薬局の店舗数の内数で、スギ薬局の店舗で在宅医療サービスを提供している店舗です。
6月10日の5月次報告の店舗数に間違いがあり(スギ薬局愛知県の閉店を1店舗減少)合計店舗数を変更しております。
-1
+5
-3
+1
+3
-1
+1
+5
-1
+ 15
-8
Financial Results for the 1st Quarter FY Ending Feb.28, 2014
Stock code : 7649 TSE1, NSE1
3.-2 スギグループ出店計画
Sugi Group Store Expansion Plan
2010年2月期 2011年2月期 2012年2月期 2013年2月期
2014年2月期 2014年2月期
第1四半期
見通し
FY.2/2010
FY.2/2011
FY.2/2012
FY.2/2013
FY.2/2014
1st Quarter
FY.2/2014
Forecast
725
774
821
871
878
940
+71
+65
+67
+64
+15
+83
-
-
-
-
-
-
-24
-16
-20
-14
-8
-14
期末店舗数
No. of total Stores (End of the Term)
新規出店
New Stores
M&A案件
M&A
退店
Store Closings
3.-3 スギグループ設備投資とのれん償却
Sugi Group Capital Expenditures and Amortization of Goodwill(Million Yen)
単位:百万円 2010年2月期 2011年2月期 2012年2月期 2013年2月期
FY.2/2010
FY.2/2012
FY.2/2013
FY.2/2014
1st Quarter
FY.2/2014
Forecast
3,423
5,812
8,215
1,414
13,000
3,596
3,934
4,787
1,159
5,000
424
0
0
0
0
278
163
0
0
0
FY.2/2011
設備投資
5,330
Capital Expenditures
スギグループ 減価償却
3,306
Depreciation
Sugi Group
のれん償却
610
Total
Amortization of goodwill
負ののれん償却
278
Amortization of negative goodwill
(注)設備投資には、システム投資及び改修費用が含まれています。
<Note> CAPEX in group total includes CAPEX for IT as well as refurbishing costs for Japan and Iizuka
Sugi Holdings Co., Ltd.
-7-
2014年2月期 2014年2月期
第1四半期
見通し
Financial Results for the 1st Quarter FY Ending Feb.28, 2014
Stock code : 7649 TSE1, NSE1
4. スギグループ売上動向
Sugi Group Sales Trend
4.-1.売上伸率
Sales Growth Rate
4.-1.-1. 年間:全店売上伸率
Annual Sales Growth Rate of All Stores
Full Year Results for the FY Ended Feb.29 2012
単位:%
Unit:%
2009年2月期 2010年2月期 2011年2月期 2012年2月期 2013年2月期
2014年2月期 見通し
FY 2014/2 Original Forecasts
上期見通し
下期見通し
通期見通し
1st Half
Forecast
2nd Half
Forecast
Full Term
Forecast
FY.2/2009
FY.2/2010
FY.2/2011
FY.2/2012
FY.2/2013
+ 9.7
+ 7.8
+ 3.8
+ 7.4
+ 5.0
+ 5.7
+ 7.3
+ 6.5
+ 8.1
+ 9.4
+ 5.1
+ 10.2
+ 6.1
+ 6.3
+ 7.2
+ 6.8
グループ合計
Group Total
スギ薬局事業
Sugi Pharmacy
4.-1.-2. 年間:既存店売上伸率
Annual Sales Growth Rate of Existing Stores
単位:%
Unit:%
2009年2月期 2010年2月期 2011年2月期 2012年2月期 2013年2月期
2014年2月期 見通し
FY 2014/2 Original Forecasts
上期見通し
下期見通し
通期見通し
1st Half
Forecast
2nd Half
Forecast
Full Term
Forecast
FY.2/2009
FY.2/2010
FY.2/2011
FY.2/2012
FY.2/2013
+ 2.6
+ 0.4
+ 0.1
+ 3.8
+ 1.0
+ 1.1
+ 1.7
+ 1.4
+ 2.9
+ 1.5
+ 0.4
+ 4.4
+ 1.4
+ 1.3
+ 2.0
+ 1.7
グループ合計
Group Total
スギ薬局事業
Sugi Pharmacy
4.-2.-1. 全店四半期売上伸率
Quarterly Sales Growth Rate of All Stores
単位:%
Unit:%
グループ合計
Group Total
スギ薬局事業
Sugi Pharmacy
1Q累計
2013/3-2013/5
2Q累計
2013/3-2013/8
3Q累計
2013/3-2013/11
通期
2013/3-2014/2
+ 7.3
+ 8.9
4.-2.-2. 既存店四半期売上伸率
Quarterly Sales Growth Rate of Existing Stores
単位:%
Unit:%
グループ合計
Group Total
スギ薬局事業
Sugi Pharmacy
1Q累計
2013/3-2013/5
2Q累計
2013/3-2013/8
3Q累計
2013/3-2013/11
+ 3.2
+ 4.3
注)比率は四捨五入しております。
【Note】Rate is rounding off it.
注)上記スギ薬局の数値はスギ薬局事業のみの数値です。
Note: Figures for Sugi Pharmacy show only figures of Sugi Pharmacy business.
Sugi Holdings Co., Ltd.
-8-
通期
2013/3-2014/2
Financial Results for the 1st Quarter FY Ending Feb.28, 2014
Stock code : 7649 TSE1, NSE1
4.-3. 月次 処方箋調剤と在宅医療実績
Prescription Services and In-Home Medical Care Services
4.-3.-1. 処方箋調剤実績
Prescription Sales Results
処方箋枚数(千枚)
FY
FY
処方箋単価(円)
FY
Price per Prescription(Yen) FY
調剤売上高(百万円)
FY
Sales of Prescription(Million Yen)
FY
No. of Prescriptions(1000 sheets)
Feb.2013
Feb.2014
Feb.2013
Feb.2014
Feb.2013
Feb.2014
3月
Mar.
343
409
9,776
9,917
3,350
4,052
4月
5月
6月
7月
8月
9月 10月 11月 12月 1月
2月
Apr. May Jun. Jul. Aug. Sep. Oct. Nov. Dec. Jan. Feb.
320
335
330
336
332
317
360
348
369
350
352
384
390
9,681 9,304 9,317 9,480 9,972 9,835 9,760 9,958 10,238 10,017 9,917
累計
Total
4,093
9,771
10,364 10,228
3,094 3,121 3,075 3,188 3,312 3,118 3,516 3,469 3,777 3,507 3,492 40,019
3,979 3,984
4.-3.-2.在宅関連実績
In-home Medical Care Services Results
3月
4月
5月
6月
7月
8月
9月 10月 11月 12月 1月
2月 累計
Mar. Apr. May Jun. Jul. Aug. Sep. Oct. Nov. Dec. Jan. Feb. Total
在宅対応拠点数
FY Feb.2013
110
115
115
119
119
121
124
125
130
132
132
133
NO. of Service Station
FY Feb.2014
137
142
150
TPN患者数(人)
FY Feb.2013
256
245
242
254
269
259
266
272
279
297
296
289
No. of TPN Patients(Persons)
FY Feb.2014
289
288
304
在宅総患者数(人)
FY Feb.2013 4,665 4,752 4,916 5,109 5,289 5,369 5,426 5,491 5,590 5,720 5,683 5,836
No. of Total Patients(Persons) FY Feb.2014
5,947 6,089 6,267
*TPNは輸液を使った中心静脈栄養法の略です。
*TPN stands for total parenteral nutrition.
Sugi Holdings Co., Ltd.
-9-
Financial Results for the 1st Quarter FY Ending Feb.28, 2014
Stock code : 7649 TSE1, NSE1
5.-1. 部門別状況:スギ薬局事業
Overview by Product Line, etc.(Sugi Pharmacy business)
5.-1.-1. 2013年2月期:部門別売上(スギ薬局事業)
Quarterly Results of Sales by Product Line FY Ended Feb. 2013(Sugi Pharmacy business)
調剤
Prescription
ヘルスケア
Healthcare
ビューティケア
Beauty Care
H&BC 小計
H&BC Sub total
ホームケア
Household wares
その他
Others
合計
Total
2013/2期 第1四半期
2013/2期 第2四半期
2013/2期 第3四半期
2013/2期 第4四半期
2012/3-2012/5
2012/6-2012/8
2012/9-2012/11
2012/12-2013/2
構成比 粗利率
構成比 粗利率
構成比 粗利率
構成比 粗利率
百万円
百万円
百万円
百万円
Share G. Margin
Share G. Margin
Share G. Margin
Share G. Margin
Million Yen
Million Yen
Million Yen
Million Yen
%
%
%
%
%
%
%
%
9,564
14.5
31.8
9,574
13.8
31.8
10,104
15.2
33.4
10,776
15.9
34.1
16,030
24.4
38.9
15,980
23.1
38.7
15,872
23.9
39.1
16,652
24.5
40.3
16,996
25.8
28.6
18,675
27.0
28.5
17,164
25.9
29.6
17,562
25.9
28.5
42,590
64.7
33.2
44,229
64.0
32.9
43,140
65.0
34
44,990
66.3
34.2
14,320
21.8
22
15,942
23.1
24.1
14,561
22.0
22.5
14,436
21.3
21.7
8,917
13.5
17.8
8,983
13.0
17.7
8,631
13.0
16.7
8,449
12.4
16.7
65,828 100.0
28.7
69,156 100.0
28.9
66,331 100.0
29.2
67,876 100.0
29.4
5.-1.-2. 2014年2月期:部門別売上(スギ薬局事業)
Quarterly Results of Sales by Product Line FY Ending Feb. 2014(Sugi Pharmacy business)
調剤
Prescription
ヘルスケア
Healthcare
ビューティケア
Beauty Care
H&BC 小計
H&BC Sub total
ホームケア
Household wares
その他
Others
合計
Total
2014/2期 第1四半期
2014/2期 第2四半期
2014/2期 第3四半期
2014/2期 第4四半期
2013/3-2013/5
2013/6-2013/8
2013/9-2013/11
2013/12-2014/2
構成比 粗利率
構成比 粗利率
構成比 粗利率
構成比 粗利率
百万円
百万円
百万円
百万円
Share G. Margin
Share G. Margin
Share G. Margin
Share G. Margin
Million Yen
Million Yen
Million Yen
Million Yen
%
%
%
%
%
%
%
%
12,014
16.8
34.8
17,064
23.8
40.3
17,906
25.0
29.1
46,984
65.6
34.6
15,084
21.0
21.9
9,612
13.4
19.9
71,681 100.0
29.9
5.-1.-3 従業員数・店舗数・売場面積(スギ薬局事業)
Number of Stores, Sales Space,Number of Employees(Sugi Pharmacy business)
2008年2期
2009年2期
2010年2期
2011年2期
2012年2期
2013年2期
2014年2期
FY Feb. 2008 FY Feb. 2009 FY Feb. 2010 FY Feb. 2011 FY Feb. 2012 FY Feb. 2013 FY Feb. 2014
期末
期末
期末
期末
期末
期末
第1四半期
End of Feb. End of Feb. End of Feb. End of Feb. End of Feb. End of Feb. 1st Quarter
536
575
622
661
483
707
713
店舗数
Number of Stores
期末売場面積(㎡)
272,637
304,242
329,451
352,661
375,213
406,856
Sales Space at Term-End
正社員
2,302
2,633
2,723
2,633
2,768
3,042
Regular Employees
パート(8時間換算)
3,065
3,198
2,801
3,227
3,677
3,990
Pat Timer(8Hour Equivalent)
パート比率(%)
57.1
54.8
50.7
55.1
57.1
56.7
Part-Time Employees Ratio
注)上記スギ薬局の数値はスギ薬局単体のものではなく、スギ薬局事業部門の数値です。
Note: Above mentioned figures are not indicate non-consolidated Sugi Pharmacy Co. ltd, show the number of current Sugi
pharmacy business division.
Sugi Holdings Co., Ltd.
- 10 -
407,784
3,484
4,192
54.6
Financial Results for the 1st Quarter FY Ending Feb.28, 2014
Stock code : 7649 TSE1, NSE1
5.-2. 部門別状況(ジャパン事業)
Overview by Product Line, etc.(Japan business)
5.-2.-1. 2013年2月期:部門別売上(ジャパン事業)
Quarterly Results of Sales by Product Line FY Ended Feb. 2013(Japan business)
ヘルスケア
Healthcare
ビューティケア
Beauty Care
H&BC 小計
H&BC Sub total
ホームケア
Household wares
その他
Others
合計
Total
2013/2期 第1四半期
2013/2期 第2四半期
2013/2期 第3四半期
2013/2期 第4四半期
2012/3-2012/5
2012/6-2012/8
2012/9-2012/11
2012/12-2013/2
構成比 粗利率
構成比 粗利率
構成比 粗利率
構成比 粗利率
百万円
百万円
百万円
百万円
Share G. Margin
Share G. Margin
Share G. Margin
Share G. Margin
Million Yen
Million Yen
Million Yen
Million Yen
%
%
%
%
%
%
%
%
1,357
7.4
32.1
1,499
7.5
29.2
1,444
8.1
30.3
1,458
8.2
30.9
1,477
8.1
24.3
1,678
8.4
23.8
1,488
8.3
23.8
1,403
7.9
23.1
2,834
15.5
28.0
3,177
15.9
26.4
2,932
16.4
27.0
2,861
16.1
27.1
4,407
24.1
22.0
4,948
24.8
23.6
4,321
24.2
22.4
4,403
24.7
22.6
11,076
60.5
18.2
11,829
59.3
18.7
10,634
59.4
18.4
10,537
59.2
18.8
18,317 100.0
20.6
19,954 100.0
21.1
17,887 100.0
20.8
17,801 100.0
21.1
5.-2.-2. 2014年2月期:部門別売上(ジャパン事業)
Quarterly Results of Sales by Product Line FY Ending Feb. 2014(Japan business)
ヘルスケア
Healthcare
ビューティケア
Beauty Care
H&BC 小計
H&BC Sub total
ホームケア
Household wares
その他
Others
合計
Total
2014/2期 第1四半期
2014/2期 第2四半期
2014/2期 第3四半期
2014/2期 第4四半期
2013/3-2013/5
2013/6-2013/8
2013/9-2013/11
2013/12-2014/2
構成比 粗利率
構成比 粗利率
構成比 粗利率
構成比 粗利率
百万円
百万円
百万円
百万円
Share G. Margin
Share G. Margin
Share G. Margin
Share G. Margin
Million Yen
Million Yen
Million Yen
Million Yen
%
%
%
%
%
%
%
%
1,490
8.0
32.5
1,499
8.0
24.5
2,989
16.0
28.5
4,389
23.6
21.4
11,248
60.4
17.7
18,626 100.0
20.3
5.-2.-3 従業員数・店舗数・売場面積(ジャパン事業)
Number of Stores, Sales Space,Number of Employees(Japan Co., Ltd., business)
店舗数
Number of Stores
期末売場面積(㎡)
Sales Space at Term-End
正社員
Regular Employees
パート(8時間換算)
Pat Timer(8Hour Equivalent)
パート比率(%)
Part-Time Employee Ratio
Sugi Holdings Co., Ltd.
2008年2期
2009年2期
2010年2期
2011年2期
2012年2期
2013年2期
2014年2期
FY Feb. 2008 FY Feb. 2009 FY Feb. 2010 FY Feb. 2011 FY Feb. 2012 FY Feb. 2013 FY Feb. 2014
期末
期末
期末
期末
期末
期末
第1四半期
End of Feb. End of Feb. End of Feb. End of Feb. End of Feb. End of Feb. 1st Quarter
141
141
145
144
150
153
154
85,689
86,266
88,807
88,313
93,316
96,205
101,592
658
640
643
659
615
548
665
1,124
1,164
1,155
1,051
1,187
1,153
1,165
63.1
64.5
64.2
61.5
65.9
67.8
63.7
- 11 -
Financial Results for the 1st Quarter FY Ending Feb.28, 2014
Stock code : 7649 TSE1, NSE1
6.-1. 沿革
History
■ 沿革
■ History
Founded Sugi Pharmacy in Shimo-machi Nishio City, Aichi Prefecture
with the objective of dispensing prescriptions and selling household
goods and OTC drugs, health foods and cosmetics
愛知県西尾市下町に、医薬品・健康食品・化粧品・日用品の販売および
処方せん調剤などのサービスの提供を目的としてスギ薬局を創業
12月
1976
Dec.
株式会社スギ薬局 設立
3月
1982
Mar.
プロトタイプとなる売場面積150坪の6号店(吉良店)を開設
5月
1992
May
「多店舗集中管理システム」(現テレビ会議システム)導入
12月
1996
Dec.
Introduceded a “centralized multi-store management system” (the
current TV conference system)
本部事務所を愛知県安城市二本木町二ツ池33番地5に移転
1月
1997
Jan.
Moved headquarters from Nishio to 33-5 Futatsuike, Nihongi-cho, Anjo
City, Aichi Prefecture to enhance the headquarters' functionality
愛知県日進市に日進物流センター稼動
7月
1998
Jul.
Opend the Nisshin Distribution Center in Nisshin City, Aichi Prefecture.
ナスダック・ジャパン市場へ上場
(2002年12月に上場廃止)
6月
Jun.
Listed on the NASDAQ JAPAN market (delisted in Dec. 2002)
スギポイントカード(顧客管理システム)を全店に導入
9月
Sep.
Introduced the Sugi Point Cards (customer management system) in all
stores.
株主優待制度を新設
12月
Dec.
Newly started the Stockholder Preferential Treatment System
東証一部・名証一部へ上場
8月
Aug.
Listed in first section of Tokyo Stock Exchange (TSE) and the Nagoya
Stock Exchange (NSE)
薬事研修センター(現 薬事研修センター名古屋校)・薬事情報センターを
開設
10月
Oct.
Founded the Pharmaceutical Training Center(currently the
Pharmaceutical Training Center, Nagoya) and the Pharmaceutical Affairs
Information Center
介護保険における居宅療養管理指導などの在宅医療活動を開始
1月
2002
Jan.
Began in-home health care services such as home recuperation
guidance through the government home care insurance program
クリーンルームを設置し、TPN(Total Parenteral Nutrition:中心静脈栄養
法)や末梢静脈点滴・経腸栄養療養法等に対応。終末期医療への取り組
みを開始。
11月
2003
Nov.
Set up a clean rooms to facilitate TPN (Total Parenteral Nutrition:
central venous administration of nutrition)and peripheral intravenous
injection therapy.This allowed expantion into hospice care as well as
enteral nutrition support.
薬事研修センター京都校を開設
2月
Feb.
Opened the Pharmaceutical Training Center, Kyoto
2000
2001
Established Sugi Pharmacy Co., Ltd.
Built Store #6(Kira Store)with 1615 ft2 of floor space, later to become
the prototype structure
2004
(株)ジャパンの普通株9.92%を取得し、包括的業務提携を締結
10月
Oct.
Entered into comprehensive business alliance with Japan Co., Ltd.
愛知県春日井市にスギロジスティクスセンター(略称:SLC中部)が本稼動
7月
Jul.
Opened Sugi Logistics Center (SLC Chubu) in Kasugai City, Aichi
Prefecture.
有料老人ホームとの取組み開始。患者様のベットサイドにて服薬介助な
ど、在宅医療活動に注力
9月
Sep.
Initiated fee-based nursing home services, with an emphasis in home
medical care such as bedside medication assistance for patients.
本社機能の充実のため、本社を愛知県安城市三河安城町一丁目8番4に
移転
10月
Oct.
Moved headquarters to 1-8-4 Mikawa Anjo-cho, Anjo City, Aichi
Prefecture for better functionality .
2005
Introduced the Sugi Card. Added payment by credit to the Sugi Point
Card.
スギポイントカードにクレジット機能を付加。スギカード誕生
12月
Dec.
自社開発により、面分業や電子レセプト業務の拡大等に対応した調剤総
合システムSIPS(シップス:SUGI Infinity Possibility System)が完成、
全店で稼動開始
4月
Apr.
Introduced the SIPS (Sugi Infinity Possibilities System) into all stores,
which was developed in-house to facilitate the expansion of electronic
prescriptions and separation of dispensaries and clinics.
薬事研修センター東京校(東京都品川区)を開設
6月
Jun.
Opened the Pharmacy Training Center, Tokyo School (in Shinagawa-ku,
Tokyo).
㈱日本アポックの調剤併設型ドラッグストア11店舗を譲受ける
9月
Sep.
Acquired from Nihon Apoch 11 drugstores providing prescription filling
services
(株)ジャパンを株式交換により、完全子会社化
3月
飯塚薬品(株)を子会社化
9月
(株)ジャパンの株式を50.1%取得し、連結子会社化
Acquired 50.1% of the outstanding shares of Japan Co., Ltd. and the
company is converted to a consolidated subsidiary.
2006
Sugi Holdings Co., Ltd.
2007
Mar.
Sep.
- 12 -
Japan Co., Ltd., becomes a wholly owned subsidiary through share
exchange
Iizuka Yakuhin Co., Ltd. becomes a subsidiary
Financial Results for the 1st Quarter FY Ending Feb.28, 2014
Stock code : 7649 TSE1, NSE1
6.-2. 沿革
History
■ 沿革
■ History
CSR室を新設、ピンクリボン運動などの社会貢献活動を本格化
4月
Apr.
Established the CSR Section, for serious engagement in the social
action programs (such as the Pink Ribbon movement encouraging early
detection of the breast cancer)
株式会社スギ薬局を「スギホールディングス株式会社」に商号変更、新設
分割により持株会社体制に移行し『株式会社スギ薬局』『スギメディカル
株式会社』を新設
9月
Sep.
Changed name from Sugi Pharmacy to Sugi Holdings Company along
with restructuring and launching the Sugi Pharmacy Co., Ltd. and the
Sugi Medical Co., Ltd.
スギメディカルがスギ訪問看護ステーション林寺(大阪市阿倍野区)を開
設。
2008
Opened the Sugi Visit Nursing Care Station Hayashiji(Abeno-ku, Osaka).
11月
Nov.
「スギ生物科学研究所株式会社」「スギメディカルリサーチ株式会社」「ス
ギメディカルサポート株式会社」を新設
12月
Dec.
Created Sugi Institute of Biological Science Co., Ltd. Sugi Medical
Research Co., Ltd. and Sugi Medical Support Co., Ltd.
スギグループ日本橋ビル(東京都中央区)を開設し、スギグループ東京商
品本部およびスギメディカル東京本社、薬事研修センター東京校を集約
4月
Apr.
Completed Sugi Group Nihonbashi Office building (in Tokyo). Functions
of Tokyo headquarters of group merchandise division and Sugi Medical
Tokyo headquarters and Group Pharmaceutical Training Center Tokyo
School were moved to the new building.
薬事研修センター大阪校(大阪市阿倍野区)を開設(京都校を移転)
2009
Opened the Pharmacy Training Center, Osaka(Abeno-ku,
Osaka)(relocated from Kyoto).
障害者を雇用し、スギグループの各種業務を受託するスギスマイル(株)
を設立
6月
Jun.
Established Sugi Smile Ltd. to employ persons with disabilities. Various
operations of Sugi Group are entrusted to this company.
スギグループ・トレーニングセンター東日本橋(東京都中央区)、スギ薬局
グループ・トレーニングセンター関西(大阪府大阪市)を新設。
1月
Jan.
Opened new Sugi Group Tokyo training center ( in Tokyo) , Sugi Group
Kansai training center ( in Osaka)
2010
CSR Report 2010, reporting Sugi Group's CSR activities, was first
published.
スギグループにおけるCSR活動をまとめた「CSRレポート2010」を初めて
発行。
5月
May
関東エリアの事業拡大の加速化を目的にスギ薬局と飯塚薬品を合併。
2月
Feb.
Combined Sugi Pharmacy Co,. Ltd. and Iizuka Yakuhin Co., Ltd. into one
in order to accelerate it business expansion in the Kanto region.
スギメディカル㈱が保有するスギ生物科学研究所㈱・スギメディカルリ
サーチ㈱・スギメディカルサポート㈱の株式をシミック㈱へ譲渡
5月
May
Shares of Sugi Institute of Biological Science Co., Ltd., Sugi Medical
Research Co., Ltd. and Sugi Medical Support Co., Ltd. held by Sugi
Medical Co., Ltd. were assigned to CMIC.
㈱スギ薬局と㈱ジャパンが統合
3月
Mar.
Mergered Sugi Pharmacy Co,. Ltd and Japan Co,. Ltd
Sugi Holdings Co., Ltd.
2011
2013
- 13 -
© Copyright 2026 Paperzz