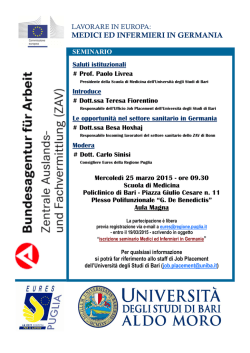
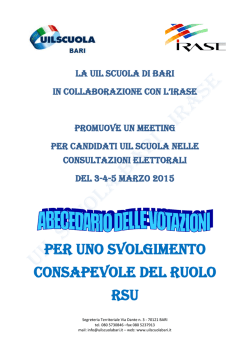
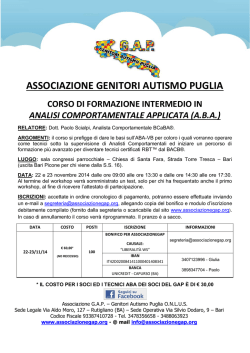
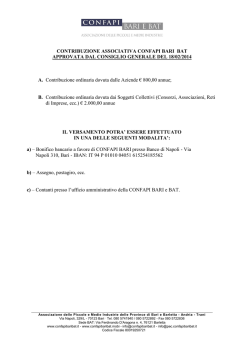
XXIX CONFERENZA ITALIANA DI SCIENZE REGIONALI TRANSFRONTIER COMMERCIAL COOPERATION IN ‘METROPOLI TERRA DI BARI’: FOREIGN DIRECT INVESTMENT AND ENVIRONMENTAL SUSTAINABILITY Elena PALMA1, Caterina DE LUCIA2 e Pasquale PAZIENZA3 1 Office for Strategic Metropolitan Planning - Bari 2 University of York, University of Foggia and Technical University of Bari 3 University of Foggia and University of Durham ABSTRACT The present work constitutes a starting point in the process of strategic planning of ‘Metropolitan Area of Bari’ with particular reference to the openness of the area to transfrontier commercial cooperation. The last Italian Economic Census showed a clear improvement in the economic performance (in terms of workers and sectoral added value) of the Adriatic Regions with respect to the rest of Italy over the last ten years. The improved economic performance of the Adriatic Regions compared to the Tyrrhenian ones seems to be mostly related to the growing ‘openness to trade of Eastern Europe’ towards the Adriatic Regions of Italy. The analysis of import-export, of the place of origin and destination of goods and of the sectors involved, is preliminary for the investigation of the impact of foreign direct investments (FDI) in the province of Bari and Apulia. To analyse the linkages between FDI, economic growth and sustainability issues, the dataset is extended to include environmental variables. The methodology used in this study is a panel data analysis which is able to show not only the relationships between FDI, economic and environmental variables but also if these relationships are of the same nature across different provinces and across time (fixed effect model) or if they vary (random effects model). To study this difference is crucial for policy makers. In the case of a fixed effect model, the provinces involved in the strategic planning process should try to harmonize their economic, environmental and trade policies; in the case of a random effect model the adoption of diversification of policies would be more effective. 1 METROPOLI TERRA DI BARI: AN ECONOMIC OVERVIEW The added value generated in the Metropolitan Area of Bari1 in 2004 is about 16 Billion Euro derived mostly from the services (77,5%), and industry (19,7%). Agriculture contribute to the creation of added value only in a small percentage (2,8)2. As shown in Figure 1, most of the municipalities whose the service sector performs at its highest form most of the part of their value added (60-80%). The 135.000 enterprises registered to the local Chamber of Commerce (CCIA) in the Metropolitan Area of Bari employ almost 90.000 workers. This very small average size of the economic actors in the territory could be interpreted as a threat with respect to firms’ capacity of innovating and internationalizing. The number of enterprises is related to the population and the relevant sectors are commerce and agriculture (52%) followed by manufacturing, building and ICT. Looking at the workers, the most relevant sectors to highlight are industry and commerce (48%) followed by building, agriculture and ICT. Tradition and Innovation or Tradition within Innovation would be the expression of the local economy. Figure 1 Sectoral Added Value Source: elaboration on CCIA data, 2007. 1 The Metropolitan Area of Bari represents an area formed by the 31 Municipalities of the Province of Bari (Acquaviva delle Fonti, Adelfia, Bari, Binetto, Bitetto, Bitonto, Bitritto, Capurso, Casamassima, Cassano delle Murge, Cellamare, Conversano, Corato, Goia del Colle, Giovinazzo, Grumo Appula, Modugno, Mola di Bari, Molfetta, Noicattaro, Palo del Colle, Polignano a Mare, Rutigliano, Ruvo di Puglia, Sammichele di Bari, Sannicandro di Bari, Terlizzi, Toritto, Triggiano, Turi, Valenzano) which in October 2006 gathered together to sign a formal Pact of Intentions while formally committing themselves to the idea of strategically planning the future of the Bari’s regional socio-economic and socio-environmental system. 2 This is higher than the national average. Figure 2 and 3 show the composition of firms and labour force across the municipalities of the Metropolitan area of Bari Figure 2 Sectoral Number of Firms across the Municipalities in the Metropolitan Area of Bari Source: elaboration on CCIA data, 2007. Figure 3 Sectoral Workers across the Municipalities in the Metropolitan Area of Bari Source: elaboration on CCIA data, 2007. As shown in Figures 2 and 3 the territory is characterised by: o The rural activity of the surrounding area. The municipalities of Rutigliano (47%), Turi (32,3%) and Toritto (23,8%) show the highest rates of workers in agriculture; o The highest number of workers and local units in the Municipalities of Bari, Modugno and Bitonto where is located one of the most important industrial parks of the Adriatic Region (the ASI Consortium); o The presence of medium-sized enterprises in the Municipalities of Bari, Molfetta and Valenzano specialised in the ICT sector; o The small presence of hotels, restaurants and cafes in the territory, except for Bari, Polignano a Mare and Giovinazzo in which these are present due to tourism activities; o The importance of the service sector (e.g., commerce, marketing and distribution) mostly related to wholesale businesses. In the Metropoli Terra di Bari could be recognised some traditional and emerging local economic systems (ICE, 2007): 1. Mechanics. This is located in the urban ring of the capital city, showing good export performance and capacity of innovation; 2. Agro-industry. The food and the flower industries are the most prominent sub-sectors with good export performance and medium capacity of innovation; 3. Building. This is one of the strongest sector in terms of workers and number of firms, although its performances are strongly related to the market trends; 4. Tourism. A growing sector with great opportunities to attract capitals; 5. Information and Communication Technologies. It has been particularly vital over the last decade, with particular reference to creative industries; 6. Energy. This is an interesting growing sector. Its expansion is mainly due to regional investments, especially in the eco-building sector. These view do not lack however of some weaknesses. The first is related to the loss of the entire value chain within the territory. The second is the lack of local and/or international collaboration, innovation and internationalization, mainly due to the presence of few large firms and a multitude of small-sized firms. To overcome these problems the Apulia Region has promoted - by means of the Regional Law 23/2007 - the creation of regional industrial districts whose process is still in progress. The rest of the paper is structured as follows: in section 2 the analysis will focus on the ‘openness’ of the local economic system to the trans-border commercial cooperation in order to investigate the impact of foreign direct investments (FDI) in the province of Bari and an overview of main environmental quality issues; section 3 illustrates the empirical analysis across provinces and sectors to test the existence of relationships between environmental quality, FDI and economic growth; finally, section 4 shows some policy discussion and concludes. 2 TRANSBORDER COMMERCIAL COOPERATION IN THE METROPOLITAN AREA OF BARI The last Italian Economic Census showed a clear improvement of the economic performance (in terms of workers and added value) of the Adriatic Regions with respect to the other one in the last ten years. With respect to the analysis of import-export data the Metropolitan Area of Bari showed in the last three years a positive balance of payment mainly due to exports of Food, Mechanic and ‘Other Industries’. For this reason the province of Bari is ranked 29th across Italian provinces for the value of its exports (3 Billion Euros in 2007). Furthermore, its performance is better than that of the entire Mezzogiorno’s aras. The balance is positive with respect to EU 15 and Unites States (North America). Albania, Greece and Montenegro represent the most important commercial partners of the Province in the Adriatic Area even though the main area of export in the Eastern Europe is Albania. Central Eastern Europe, Asia and Latina America are potential markets (Report ICE 20062007). Import-Export with Central Eastern Europe and Russia is growing and the linkages between the Metropolitan Area and the trans-frontier Regions are also supported by the number of decentralized firms mainly in the leather sector (Osservatorio Banche-Imprese, 2002). This improvement seems to be linked to the better performance of the Adriatic side of Italy with respect to the Tyrrhenian one and also to the growing ‘commercial openness to the East Europe’ from the Adriatic regions of Italy (Botta and Capriati, 2003). The Province of Bari is leader in the Apulia Region for the attraction of net FDI. The quantitative analysis of FDI in the Apulia Region with an eye to the Metropolitan Area of Bari in the next sections, involves the study of the relationships between FDI and GDP. The ‘empowerment’ of the Metropolitan Area towards sustainability issues, which are compulsory for the strategic planning process, would suggest environmental quality also to be affected by these FDI-GDP relationships. 2.1 Overview of FDI, economic growth and environment linkages The debate over FDI, economic growth and environment issues is relatively new. Many studies focus their attention on the cause-effect nexus of stringent environmental policies on firm’s competitiveness as migration from / attraction to a given location. “Theoretically, a process of arbitrage (factor price equalisation) drives up emissions in countries with more abundant environmental resources and lower pollution regulation, to the point where industries migrate, and drive down emissions in those countries that lose their industries. Comparative advantages may therefore be seen as pollution haven and industry flight hypothesis. In the first case, some less developed regions “may attract more high technology industries by performing a low wages scheme, for example. By offering lax environmental regulations, less developed countries may provide for industries' cost saving incentives. On the other hand, the industrial flight hypothesis is mainly concerned with two main aspects: pollution control costs, new plant expansion and hazard production. As with every other factor of production, environmental endowments enter in to the firms' production function as a cost. Firms need to find the optimal allocation of environmental assimilative services for their capital spending and production costs; therefore, the problem is to what extent production costs increase when environmental endowment enters in to the production function to meet with the environmental regulatory system. As a consequence, due to incremental costs driven by environmental requirements, industries that are able to move their capital abroad will migrate across national boundaries to countries with low environmental costs. Empirically, the impact of industry migration due to environmental regulation has been relatively small: firstly, because environmental costs form a small part of total costs of production; and secondly, some studies (Low and Yates, 1992; Lucas et al., 1992) show that industry migration (over the last three decades) has been due to changes in other source of comparative advantages, whereas the environmental component plays a secondary role.” (De Lucia, 2007). The Porter hypothesis on the other hand asserts that over a long-time view of the economic system environmental protection would eventually encourage firms’ efficiency, innovation and technological process to become more environmentally friendly. (Porter and van del Linde, 1995; Xepapadeas and de Zeeuw, 1999; Eskeland and Harrison, 2003). Two main reasons can be adducted to support this hypothesis. First, heavy pollution can be seen as a signal to investors that FDI enterprises’ production is inefficient and therefore reduce the expectations on the multinational liabilities. Second, a replacement of these FDI firms’ production to less efficient domestic technologies, can only lead to a substantial emission reduction in total pollution in the host area. A further aspect to be considered is the link between FDI and pollution. Most of the literature concerned with this topic was born in connection with Environmental Kuznets Curve (EKC) “because of its similarity to the inverted U-shaped relationship between inequality and income levels advanced by Simon Kuznets (Kuznets, 1955). The EKC hypothesis purposes an inverted U-shaped between various indicators of environmental degradation and per capita income. This implies that one country’s economic growth will redress the environmental impacts of the early stages of economic development and that growth and technological progress will lead to improve environmental performances in the developed countries” (De Lucia, 2002). EKC studies have captured the international community’s attention given the increasing interest in the economic growth, trade and environmental quality. The debate is still on-going. “The essence of the EKC is to consider the determinants of environmental quality in three components: the scale of economic activity, the composition of economic activity and the income effect on the demand and supply to abate pollution. All else equal, the scale effect is represented by GDP. So, the higher is the output produced, the higher is the level of pollution and the higher is the level of resource use and waste generation. The composition effect of economic activity is related to environmental variable because of different pollution levels by different sectors of economy. The agriculture sector tends to be more resource-intensive than the industry, where, on the other hand, this last tends to be more pollution-intensive. The income effect is explained by the existence of positive pollution emissions elasticities […] at low level of incomes, which gradually invert to negative emission elasticities as income rise” (De Lucia, 2002). FDIs are seen here as depending on in the income effect (one country’s preferences for the environment) and the scale effect of the host region. However, once foreign capitals enters the host region, they can certainly have effects on all the EKC’s characteristics. They can accelerate economic growth (Li et al., 2001; Chen and Demurger, 2002; Liu and Wang, 2003) or provide technology improvements and therefore to accelerate income effects (Thompson, 2002; Lemoine and Ünal-Kesenci, 2004) that would in turn affect and reinforce decision making process towards sustainability issues. 2.2 FDI: some descriptive statistics issues for Apulia and the Metropolitan Area of Bari Figure 4 illustrates the inflow and outflow of firms in the Apulia region over the years 19882000. Although a positive trend can be drawn from both inflow and outflow of firms, a massive increase of firms outflow rates is observed. While at the end of 1980s until mid 1990s a net inflow of firms prevails, from 1996 to 2000 a net outflow of just about 3 firms occurs in Apulia region. It can be argued that this trend follow the economic business cycle during those years. In fact, at the beginning of the 1980s the development of new services in the informatics or banking sector worldwide for example, provided a rapid increase of new industries in which the Apulia region benefitted until mid 1990s. As the international business cycle reached its peak during the 1990s, the negative expectations, and the presence of structural problems favoured the increase of foreign firms outflow from the Apulian territory. Figure 4 Inflow and Outflow of Foreign Firms in Apulia Source: ISTAT Figure 5 Inflow and Outflow of Foreign Turnover in Apulia Source: ISTAT Figure 6 Inflow and Outflow of Workers Employed in Foreign Firms in Apulia Source: ISTAT In figure 5, the turnover of foreign firms is showed. It is noticeable how the turnover inflow remains almost below a Thousand billion Lira until mid 1990s, to jump at a peak of more than 10 Thousand billion Lira (5 billion Euros) in 1998-1999. During those years, in fact, massive investments of just about 90 Thousand billion Lira (45 billion Euros) in the industrial sectors took place (ICE, 1999). The turnover outflow on the other hand was of just about 100 billion Lira (50 million Euros) over the same time span. Finally, in Figure 6 the inflow and outflow of workers employed in foreign firms in Apulia region is showed. It is remarkable how the number of people employed has its peak of just about 18,000 workers during the same years when the turnover inflow is at its highest. From mid 1990s a conspicuous increase of workers outflow is also present. This will remain stable of just below 10,000 units, on average, until the year 2000. The description now turns to briefly analyse the trend in FDI at Apulian and the Metropolitan Area of Bari. Figure 7 illustrates FDI in Apulia region during a time period 1999-2005. Figure 7 FDI in Apulia Source: ICE, Statistics, 1999-2005 It is interesting to notice the increasing trend in foreign inflow and outflow of investments in the Apulia region. Both reach peak values in 2005, where foreign capital inflow is about 120,000 million Euros against just about 10,000 million Euros of capital outflow. Many reasons can be adopted to explain such phenomenon. One of the most apparent is the effect of the European Union Structural Funds system of which Apulia region benefits. This would favour higher business climate expectation in foreign firms. The same argument can be claimed for Apulian firms which are well willing to invest their capital in their native Region rather than in foreign markets. The Apulian capital inflow shows increasing investments growth from 2002 onwards. Capital inflow reaches its highest value in 2005 of just about 180,000 million Euros. Figure 8 illustrates capital inflow and outflow in the Metropolitan area of Bari. Figure 8 FDI in the Metropolitan Area of Bari Source: ICE, Statistics, 1999-2005 In Figure 8, it can be argued that foreign and Metropolitan capital inflow follow the same pattern during the time period considered. The Metropolitan capital inflow however presents higher values in 2001 and 2005, than those in other years. These are around 50,000 and just about 65,000 million Euros. Foreign capital outflow on the other hand remains almost constant, reaching a peak of just about 1,000 million Euros in 2002. Finally, Metropolitan capital outflows are massive at the beginning of the time considered. Its value is around 64,000 million Euros. From 2000 to 2003 Metropolitan capital outflow is maintained below 10,000 million Euros of investments; it then increases up to around 2,000 million Euros in 2004 to stabilize again at the values of the previous years in 2005. 2.3 Environmental quality: issues for Apulia and the Metropolitan Area of Bari In this section a description of air quality issues for Apulia and the Metropolitan region of Bari are presented. Over the last years western lifestyles have negatively affected the environment. The global warming or biodiversity threats are few examples of the irrational and inefficient resource use of anthropogenic activities. Though environmental regulation to protect the environment is active throughout the globe and at different institutional levels, much is still needed to do. Italy, as other European countries, has recently adopted various international regulations to combat global problems such as acid-rain, ozone layer, or global warming problems. These can be named as the Kyoto Protocol, the Montreal Protocol, the Air Quality Directives to regulate on long range transboundary flux emissions, or the latest renewable energy policy adopted by the European Council in March 2007 (the so-called 2020-20 CO2 policy target) to cite a few. This picture allows urban centres to treat environmental pollution as an emergency problem to face under various aspects, i.e, health, sanitary etc. In fact, atmospheric pollution is one of those factors that most affect human health for increasing respiratory diseases over the last years. Increasing and efficient monitoring at both national and regional level has therefore taken place. Figure 6 shows air quality monitoring in Apulia. The Apulian Environmental Protection Agency (ARPA) is monitoring daily emissions of various pollutants, such as SO2, PM10, NO2, CO, O3 and Benzene. In the latest report on air quality (ARPA, 2008) for the Metropolitan area of Bari is argued that PM10 concentrations have exceeded the daily limits, whereas all other pollutants have kept their concentrations below their limit values. Figure 9 Air Quality Monitoring in Apulia As it can be shown from Figure 9, monitoring of main air pollutants mainly occurs nearby urban centres. This is particularly true for all provinces but Foggia, where monitoring stations are instead situated around the area of Manfredonia. Furthermore, a massive monitoring is carried out, compared to other provinces, in the Taranto and Brindisi areas. It is in fact reasonable to believe that in these industrial districts, where pollution levels are at their highest levels, a ponderous monitoring should be carried out. The need for increasing monitoring would also favour the adoption of environmental inventories for which Apulia still lacks. With the project SPIN-ECO, the province of Siena jointly with the University and its municipality (Provincia di Siena, 2001; Pulselli et. al, 2008), provided the first dynamic analysis on sustainability to evaluate emergy balances, the absorption capacity of the natural environment, the regional economics and environmental vulnerability and mitigation strategies through adaptation plans. The first attempt to construct an Italian emission inventory disaggregated at NUTS 33 (provinces) and sectoral levels has been published in 1995 by the APAT (De Laurentis et al, 1995) for 1990 data. Since then, no study whatsoever updated the CORINAIR emission inventory4. Figure 7, 8 and 9 below illustrate SO2, NOX and PM10 emissions across economic activities in the Metropolitan area of Bari in 1990. These pollutants have generally a both local and long range nature. Although their effects on human health, for example, can be mostly the same, they can be generated from various economic sectors. Therefore, the amount of these pollutants differs across sectors. In Figure 10, it can be argued that more than a quarter of SO2 emissions come from road traffic whereas almost less than a quarter has its source in the cement industry. Major contributors for SO2 emissions are also power generators in the agriculture, industry and tertiary sectors. In Figure 11, the major source for NOX emissions is the road traffic, followed by pollution emitted in the cement industry. Power generators in the industry and tertiary sectors are instead considered minor polluting sources for NOX. In Figure 12, the cement industry is the major polluting source for PM10. Relevance also assumes PM10 emissions from road traffic. Finally, it can be argued that in the Metropolitan area of Bari, common sources across these pollutants are road traffic and the cement industry. 3 Nomenclature of Territorial Units for Statistics (EUROSTAT, 1988) The Apulian Agency for Environmental Protection, University of Lecce and National Council of Research have signed the adoption of an Environmental Programme Action for Apulia (2005). The Programme cover six main strategies, namely: the extension of the regional environment monitoring network, the emission inventory, the air quality plan, the air quality modelling, the data mining for industrial emission sources and the personnel training for environmental management 4 Figure 10 Sectoral SO2 Emissions in the Metropolitan Area of Bari in 1990 Figure 11 Sectoral NOX Emissions in the Metropolitan Area of Bari in 1990 Figure 12 Sectoral PM10 Emissions in the Metropolitan Area of Bari 3 EMPIRICAL ANALYSIS: FDI AND ENVIROMENTAL QUALITY INTERACTIONS In this section an empirical analysis is carried out to study the relationships occurring between FDI and environmental quality. In particular, the section’s aim is to focus on the effects of FDI on environment. The methodology carried out is a panel data analysis across the five provinces of the Apulia region, and across sectors types such as: Agriculture, Energy Intensive and Bricks Industry, Other Industry, Services and Transports. The time period considered is a seven year period from 1999 to 2005. SO2 and NOX are the main pollutants considered in the case study. 3.1 Data sources The main dataset employed for this study consists of net fluxes of FDI in the five provinces at sectoral level taken from the Istituto per il Commercio Estero. Sectoral GDP5 for each province has been downloaded from ISTAT available from website6. Given the lack of an emission inventory for the Apulia region disaggregated by sectors, estimates of sectoral emissions have been obtained by projections of the De Laurentis et al (1995) inventory based on 1990 data. Emissions projections have been obtained considering the relationship existing between diffuse pollution and GDP, as follows7: Et et Yt (1) where E t is pollution, et indicates an emission factor for the pollutant under examination and Yt is the GDP level; t is the time subscript. In other words, a direct relationship occurs between GDP and the level of pollution. The higher the GDP, the higher pollution levels, given the state of the technology. Given that emission factors were not available, a computation of GDP growth rates has been carried out. Emission projections for the years 1999-2005 have therefore been achieved by multiplying GDP growth rates to the original sectoral emission dataset of the year 1990. 5 Sectoral Value Added has been considered for this study. www.istat.it. The dataset at province level is available for the years 1999-2003. For the years 2004 and 2005 an average (computed for the period 1999-2003) value added across relevant sectors has been considered. 7 Perman et al (2006) 6 3.2 Panel Data methodology “Panel data analysis endows regression analysis with both a spatial and temporal dimension. The spatial dimension pertains to a set of cross-sectional units of observation” (Yaffe, 2003), whereas the temporal dimension is characterised by various temporal sources such a as years, months or daily observations. The bi-dimensionality therefore is characterised by a cross sections of observations of sectors and provinces and the temporal reference which is the year time period 1999-2005. The presence of this bi-dimensionality causes unobserved effects that can affect the dependent variable. These are of various types: time invariant, which are those that can vary across provinces and sectors and are constant across time; individual variant, those that can vary across time but are constant across provinces and sectors; and individual and time invariant, which are those that can vary across provinces, sectors and time. Panel data models take into account the effects (omitted variables) of these unobserved effects that remain constant over time. The general model to be estimated is the following: k yit i ij xijt it (2) j 1 with i 1...N , t 1...T . Furthermore: i is the individual term that capture the effects of those variables that are specific for each ith individual and are time invariant; the j s are the coefficients to be estimated, the xijt are the regressors and the y ijt is the dependent variable of interest. The error term is assumed to be independently and identically distributed with zero mean and 2 . There are two main approaches in which models like those in equation (2) can be estimated. Fixed effects (FE) and Random effects (RE) models. With the FE model the j s (the effect of the explanatory variables) are the same across provinces, sectors and in each time period. This restriction implies that similarities in environment-FDI relationship exist across provinces and sectors over a period of time. This restriction is instead relaxed in the case of the RE model. 3.3 Panel Data results Table 1 illustrates a descriptive statistics for the dataset considered in this case study. Mean, Standard Deviation, Minimum and Maximum values are showed for the within (FE), between groups and for overall. SO2 presents an overall minimum and maximum value of almost 15 thousand tonnes to almost 59,500 thousand tonnes. Whereas NOX emissions have an overall range of 1-450,000 tonnes. These values’ ranges are reasonable given that emissions are distributed differently across sectors. Mean values are 2,242 and 12,054 tonnes for SO2 and NOX, respectively. FDI values are given in the range of -5,883 and 52098 million Euros across sectors and provinces. Negative values indicate disinvestments. Finally, value added ranges from almost 273 to just about 53,000 million Euros across sectors and provinces. Table 1 Descriptive Statistics Variable SO2 overall between within Mean Std. Dev Min Max Observations 2442.42 4896.97 14.99 59485.52 N = 175 794.39 1908.65 4212.734 4841.10 -1751.92 57715.21 NOX overall between within 12054 38371.81 5944.61 37972.77 1.40 8677.70 -13361.31 447543.2 25417.03 434180.2 N = 175 FDI overall between within 1423.58 5732.66 1569.47 5544.35 -5883.8 25.98 -6580.08 52098.98 4276.23 49246.33 N=175 VA overall between within 3219.45 5080.38 719.05 5036.33 272.85 2647.27 -1279.13 52789 4797.48 51210.97 N=175 The relationships to be estimated can be expressed with the following equations: SO2 it i 1 FDI1it 2VA2it it (3) NOX it i 1 FDI1it 2VA2it it (4) Where SO2 and NOX are the pollutants (dependent variables of interest), FDI is the net flux of foreign direct investment and VA represents the sectoral value added. The predictions for the models expressed in equations (3) and (4) can be summarised as follows: SO2it NOXit SO2it NOXit 0; 0; 0; 0; In other words, the presence of FDI on the FDI it FDI it VAit VAit Apulian region across sectors and provinces would favour investments in greener technology. This would provide to decrease emissions levels; on the other hand, increasing emission effects is instead captured by the value added, as described in equation (1). Furthermore, to consider the nature of local pollutants, all variables to be estimated have been transformed in per-capita terms. Tables 2 and 3 show estimates results for SO2 and NOX. Table 2 Panel Data Estimates for SO2 Variables name FDI VA Constant R2 Wald chi2(2) Number of obs. Hausman Coefficient Std.Err. Z P>¦z¦ -.057 .045 -1.24 .46 .056 8.22 4.11 1.41 2.92 0.29 0.00 175 Prob>chi2 0.7807 [95% CI] 0.213 -.146 .033 0.000 .353 .574 0.004 1.35 6.88 Table 3 Panel Data Estimates for NOX Variables name FDI VA Constant R2 Wald chi2(2) Number of obs. Hausman Coefficient Std.Err. Z P>¦z¦ -.069 .399 -1.73 3.50 .494 7.08 6.75 12.34 0.55 0.24 0.00 175 Prob>chi2 0.8451 [95% CI] 0.083 -.147 .03 0.000 2.53 4.46 0.585 -17.45 30.95 Estimates results for both SO2 and NOX panel data regressions indicate that a negative relationship exists between FDI and emissions level. In particular, a million Euro increase of net FDI flux in the five sectors across Apulian provinces lead to a decrease of 0.05 thousand tonnes of SO2 and 0.7 thousand tonnes of NOX. While this result is statistically consistent for the latter at 95% Confidence Interval, this is not the case for the former. Predictions for the value added in both cases are assumed to be true given the positive signs of the value added coefficients. In the case of SO2 panel data analysis a million Euro increase in the value added would increase SO2 emissions by 0.4 thousand tonnes; whereas NOX emissions would be instead subject to an increase of 3.5 thousand tonnes. Both value added coefficients are statistically significant at the 95% Confidence Interval. R2 in both cases is relatively low. In other words, the independent variables considered in the equations are able to explain 28% and 23% of the SO2 and NOX panels estimates, respectively. It can be argued that given the uncertainties linked to the study of environmental quality itself this can be explained by a number of factors. This is surely beyond the scope of this paper. A Hausman diagnostic test has been also carried out to test the validity of a RE model against the FE model. For both panels, the Housman test’s null hypothesis – that the RE model is consistent – cannot be rejected at 95% Confidence Intervals. Therefore, the sectoral and provincial individual effects do not appear to be correlated with the regressors (Baum, 2006). 4 A POLICY DISCUSSION ON FDI AND ENVIROMENTAL QUALITY INTERACTIONS AND CONCLUDING REMARKS The results obtained in the previous section can be used to formulate optimal policies in term of planning strategies. The relationship between FDI and environment is plain: the presence of FDI on the Apulian region across sectors and provinces would favour investments in greener technology. This would provide to decrease emissions levels; on the other hand, increasing emission effects is instead captured by the value added. To provide increasing of net FDI inflow on the Apulian region, policy makers should organize a better system for monitoring. This would especially be realistic for urban areas and industrial settlements. As described in paragraph 2.3, in fact, the increasing monitoring would also favour the adoption of environmental emission inventories for which Apulia still lacks. Furthermore, given that the main source of pollution vary across provinces (for example in the Metropolitan Area of Bari the main polluting source is road traffic, whereas in Taranto or Manfredonia this is industrial activities), it is advisable that these adopt different planning methods and strategies which would better adapt to their territorial context. Differences also exist across economic sectors within the same area. It would be more efficient for the policy maker to address policies that would take into account FDI effects and sustainability issues across economic sectors. For the Metropolitan Area of Bari the strategic planning process play a great role in context of trade, FDI and environment relationships. Policy decisions should be addressed to consider their impact on the environment of the strategy planning as a whole (i.e. different actions to be taken within the economic, transport, and environmental systems). The actual strategic planning process is already directed towards this direction. The promotion of the railway and the public transport systems, as well as the support to ‘green’ firms (i.e. firms which adopted ‘green’ systems of productions and new firms in the ‘green’ sectors) are examples of policies converging to the reduction of pollution and attraction and /or creation of new investments8. 8 See www.ba2015.org 5 Bibliography Botta F., Capriati M. (a cura di) (2003) Transizione nei Balcani e reti transadriatiche. Il valore della prossimità, Cacucci, Bari. Baum C. F., (2006) An introduction to modern econometrics using STATA, STATA Press. Chen, Y., Demurger, S. (2002) Croissance de la productivité dans l'industrie manufacturière chinoise: Le rôle de l'investissement direct étranger. Economie Internationale 92, 131–164 De Laurentis R., Gaudioso, D., Liburdi., R. (1995) CORINAIR PROJECT, Air Pollutant Emission Inventory in Italy for the Year 1990, Final Report, doc. ENEA. De Lucia C., Leonida L. (2002) The Evidence of the Environmental-Economic Transition Hypothesis: a Semi-Parametric Approach, Planum European Journal of Planning – Urbanistica, n.117. De Lucia, C., (2007) Integrating trade and transboundary pollution in an enlarged Europe: A computable general equilibrium model, PhD Thesis, University of York, UK EUROSTAT, (1988), Nomenclature of Territorial Units for Statistics Eskeland, G.S., Harrison, A.E. (2003) Moving to greener pasture? Multinationals and the pollution haven hypothesis. Journal of Development Economics 70 (1), 1–23. Istituto per il Commercio Estero, L’Italia nell’economia internazionale, Rapporto 20062007. Istituto per il Commercio Estero (1999) Statistiche. ISTAT, Statistiche, 1988-2000. Lemoine, F., Ünal-Kesenci, D. (2004) Assembly trade and technology transfer: the case of China. World Development 32 (5), 829–850. Li, X., Liu, X., Parker, D., (2001) Foreign direct investment and productivity spillover in the Chinese manufacturing sector. Economic Systems 25, 305–321. Liu, X., Wang, C. (2003) Does foreign direct investment facilitate technological progress? Evidence from Chinese industries. Research Policy 32, 945–953. Low, P. and Yates, A. (1992) Do dirty industry migrate? in Low, P., editor, International Trade and the Environment. World Bank, Washington, D.C. Lucas, R., Wheeler, D., and Hettige, H. (1992) Economic development, environmental regulation and the international migration of toxic industrial pollution: 1960-1988, in Low, P., editor, International Trade and the Environment. World Bank, Washington, D.C. Osservatorio Banche Imprese (2002) Il sistema produttivo in Puglia. Il prodotto Lordo, l’Occupazione e Settori. Rapporto Annuale 2002. Provincia di Siena, (2001) Progetto SPIN-ECO. Perman R., Ma Y., McGilvray J., Common M. (2003) Natural resources and environmental economics, Longman, Pearson Education. Porter, M.E., van der Linde, C. (1995) Toward a new conception of the environment– competitiveness relationship. Journal of Economic Perspective 9, 97–118. Pulselli F.M., Ciampalini F., Leipert C., Tiezzi, E. (2008) Integrating Methods for the Environmental Sustainability: The SPIn-Eco Project in the Province of Siena (Italy), Journal of Environmental Management, 86(2), 332-341. Thompson, E.R. (2002) Clustering the foreign direct investment and enhanced technology transfer: evidence from Hong Kong garment firms in China. World Development 30 (5), 873–889. Viesti G., (2001) I distretti nell’economia meridionale, Rassegna Economica, N. 1, gennaiogiugno. Xepapadeas, A., de Zeeuw, A. (1999) Environmental policy and competitiveness: the porter hypothesis and the composition of capital”. Journal of Environmental Economics and Management 37, 165–182. Yaffe R. (2003) A primer for panel data analysis, New York University.
© Copyright 2026 Paperzz