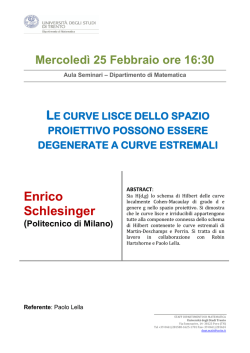
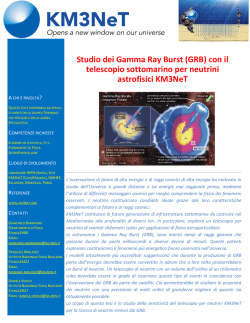
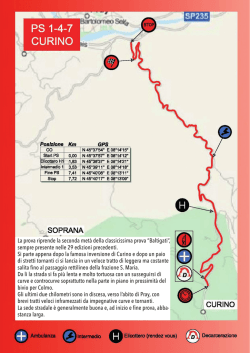
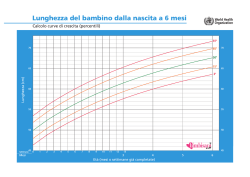
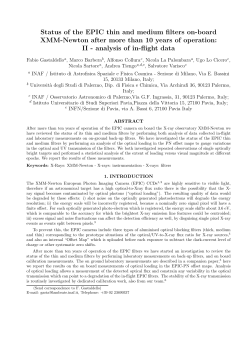
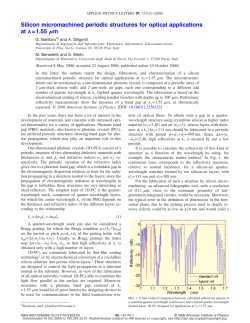
GRB 021004: COMPLETING THE LIGHT CURVE
A. de Ugarte Postigo1, A. J. Castro-Tirado1, J. Gorosabel1, S. Guziy1,2, M. Jelínek1, D. Pérez-Ramírez3, J. Aceituno4, A. Campo Bagatin5, S. Covino6, N. Cardiel4, T. Fathkullin7, A. A. Henden8, S. Huferath9, S. Klose10, Y. Kurata11, D. Malesani6, F.
Mannucci12, E. Ramírez-Ruiz13, P. Ruiz-Lapuente14, V. Sokolov7, U. Thiele4, L. Wisotzki9, M. Andersen9, L.A. Antonelli15, A. Boattini16, J. M. Castro Cerón17, M. Del Principe18, A. Di Paola15, A. Fruchter19, J. Fynbo17, D. Fugazza20, G. Ghisellini6, J.
Greiner21, J. Hjorth17, L. Hunt12, T. Konstantinova22, D. Lazzati23, N. Masetti24, E. Palazzi24, H. Pedersen17, E. Pian25, E. Rol26, M. Stefanon6, N. Tanvir27, V. Testa15, P. Vreeswisjk28, E. P. J. van den Heuvel29, R. A. M. Wijers29, P. Yock30.
1 Instituto de Astrofísica de Andalucía (IAA-CSIC), PO Box 03004, 18080 Granada, Spain.
2 Astronomical Observatory, Nikolaev State University, Nikolaev, Ukraine.
3 Departamento de Física (EPS), Universidad de Jaén, Jaén, E-23071, Spain.
4 Calar Alto Observatory, Almería, Spain.
5 Departamento de Física Aplicada, Universidad de Alicante, Spain.
6 Osservatorio Astronomico di Brera, Via E. Bianchi 46, 23807 Merate (LC), Italy.
7 Special Astrophysical Observatory of the Russian Academy of Sci. (SAO-RAS) , Russia.
8 U.S. Naval Observatory, Flagstaff, AZ, USA.
9 Astrophysikalisches Institut, 14482 Potsdam, Germany.
10 Thuringer Landssternwarte, Tautenburg, Germany.
11 Solar Terrestrial Environment Laboratory, Nagoya Univ., Japan .
12 IRA - CNR, Largo E. Fermi 5, Firenze, Italy.
13 Institute for Advance studies, Princeton University, USA.
14 Departamento de Astronomía y Meteorología, Universidad de Barcelona, Spain.
15 Osservatorio Astronomico di Roma, Via Frascati 33, 00040 Monteporzio Catone, Italy.
16 IAS-CNR, Via Fosso del Cavaliere 100, 00133 Roma, Italy.
17 Niels Bohr Institute, Astronomical Observatory, Univ. of Copenhagen, Julianne Maries Vej 30, Dk-2100 Copenhagen, Denmark.
18 Osservatorio Astronomico di Teramo, Via M. Maggini 47, 64100 Teramo, Italy.
19 STScI, 3700 San Martin Dr., Baltimore, MD 21218-2463, USA.
20 Centro Galileo Galilei, Apartado 565, E-38700 Santa Cruz de La Palma.
21 MPI fur Extraterrestrische Physik, 85741 Garching, Germany.
22 Astronomical Institute of St. Petersburg University, Petrodvorets, Universitetsky pr. 28, 198504 St. Petersburg, Russia.
23 Institute of Astronomy, University of Cambridge, Madingley Road, CB3 0HA Cambridge, UK.
24 Istituto di Astrofisica Spaziale e Fisica Cosmica, Sezione di Bologna (CNR), Via Gobetti 101, 40 129 Bologna, Italy.
25 Osservatorio Astronomico di Trieste, Via Tiepolo 11, 34 131 Trieste, Italy.
26 Department of Physics & Astronomy, University of Leicester, Leicester LE1 7RH, UK.
27 Center for Astrophysics Research, Univ. of Hertfordshire, College Lane, Hartfield, Herts AL10 9AB, UK.
28 ESO, Alonso de Cordova 3107, Casilla 19001, Santiago 19, Chile.
29 Anton Pannekoek Institute, Kruislaan 403, 1098 SJ Amsterdam, The Netherlands.
30 Department of Physics and Astronomy, Univ. of Auckland, New Zealand.
Abstract
1. Calar Alto (Spain)
On the 4th of October of 2002 a Gamma-Ray Burst (GRB) was observed by the HETE-2 satellite. The detection was
immediately sent as an alert to many ground based observatories that began observations in different wavelengths
several minutes later.
2. Cerro Paranal (Chile)
3. Loiano (Italy)
4. U.S. Naval Observatory
Here we present a compilation of unpublished multicolour photometric data, with which a further analysis of
GRB021004 is being made. Our study covers the full GRB history, from the early stages, two hours after the burst,
down to the underlying host galaxy more than a year after, paying special attention to the nature of the different bumps
that where detected in the light curve.
(USA)
5. La Palma (Spain)
6. Mt. John (New Zealand)
1. Introduction
7. Nigniy Arhiz (Russia)
8. Tirgo (Switzerland)
The gamma-ray burst GRB 021004 was detected at 12:06:14 UT on 4 Oct 2002, with the FREGATE, WXM and SXC
instruments aboard the High-Energy Transient Experiment (HETE-2) [1,2] as an extremely intense, 100 s long GRB
with fluences 7.5 x 10⁻⁷erg cm-2 (2-25 keV) and 1.8 x10⁻⁶ erg cm-2 (50-300 keV).
Optical observations taken on 4 Oct 2002 at 12:15:41 UT revealed the presence of a new, point-like source which faded
in brightness and became a strong candidate for the optical afterglow from GRB 021004 [3] which was confirmed in the
next hours by means of multiwavelength observations. Coincident (within errors) with the location of optical afterglow,
radio and millimetre counterparts were detected few hours after [4,5].
9. Campo Imperatore (Italy)
Fig. 1 World map where we have marked the observatories from which photometric data was obtained for this study.
Extensive optical and near-infrared observations were performed at several observatories (Calar Alto, Cerro Paranal,
Loiano, U.S. Naval Observatory, La Palma. Mount John, Nigniy Arhiz, Tirgo, Campo Imperatore), with telescopes
apertures in the range 0.6-8.1 m. They covered the time interval 11 h - 460 days with respect to the trigger time. To our
knowledge, this is the most complete light curve sampling for this particular GRB.
Fig.2 Images of the afterglow of GRB 021004 at the moment of our first detection (left; simulated from our
photometric data) and of the blue host galaxy in which the event was produced 10.4 Gyr ago (right).
2. Light Curve
We have drawn the light curve in the different optical and near infrared photometric bands (see Fig. 3) using our observations
and those published in the literature [6-11]. This is the best sampled curve of this object to date. We can see a great amount of
detail, specially in the R band.
The light curve of GRB 021004 is very peculiar due to the great amount of structure that it contains, which makes it much more
complicated than what it is expected from standard models [12]. Several explanations have been suggested for this bumpy
behaviour:
• Variable density environment near the central engine, such as a ring nebula.
• A patchy shell, where the energy increases or decreases as different parts of the shell are illuminated.
• Several energy injections time after the gamma-ray event.
Fig. 3 Light curve of GRB 021004 afterglow. Our data is represented as thick circles while the thin ones
have been obtained from the literature. The different bands have been displaced as noted on the legend.
Note that we are using a logarithmic time-scale on the x axis due to the nature of the event that we are
studying.
3. Host Galaxy
Looking at the information that is supplied by this new data sample, we can detect a hint of chromatic behaviour during the 0.1
day bump which could be attributed to the synchrotron break passage through the optical wavelengths as the peak flux moves
from the bluer frequencies towards redder ones [12].
On the other side of the light curve we conclude that there is no clear evidence of a supernova bump at the date of the expected
maximum: 15·(1+z) ~ 50 days, as has been observed in other bursts. This is probably due to the high redshift at which this event
took place, implying a dim supernova that could be obscured by the host galaxy.
We have constructed the NIR/optical SED (Spectral Energy Distribution) of the GRB 021004 host galaxy (see Fig. 4). The SED is composed by
three optical (B,V and I) and one NIR (J) band. To fit the SED we assumed a Solar metallicity, a Miller Scalo IMF [13], a redshift of z=2.3304 [14],
and the library of templates given by Bruzual and Charlot (2003) [15]. The best fit (χ²/dof~0.8) is obtained with a Starburst template with a
dominant stellar population age of ~10 Myr and an internal host Galaxy extinction of Av~0.6 magnitudes.
The mass corresponding to a progenitor of a stellar age of ~10 Myr is M > 100 Mo assuming Solar metallicity [16]. This progenitor mass is fully
consistent with the collapsar model [17] and with a Wolf-Rayet star, as suggested by several authors [8,14].
4. Future Work
What we have presented here is the result of the compilation and reduction of a great amount of data
from many places around the Earth. This is just the first approach to the analysis of the data. In future
works we will study with more detail the different models that can be applied to this multiband light
curve and search for the one that better explains the observed structure. For this models we will also
take into account the numerous articles of photometry, spectroscopy and polarimetry that have
already been published.
Acknowledgements
Table 1:
Estimated
Magnitudes for the
Host Galaxy
Band
Magnitude
B
24.62 ± 0.04
We would like to thank J. de León Cruz, F. Prada, A. Zurita y C. Zurita for their support in the
development of this work. We also acknowledge funding from the spanish grants AYA 2002-0802
and AYA 2004-01515 (including FEDER funds).
References
[1] Shirasaki, Y. et al. 2002 , GCN Circ. 1565
V
24.45 ± 0.04
[2] Lamb, D. et al. 2002 , GCN Circ. 1600
R
24.13 ± 0.04
[3] Fox D. W. et al. 2002, GCN Circ. 1564
I
23.97 ± 0.04
J
23.37 ± 0.04
H
22.71 ± 0.04
[5] Bremer, M. and Castro-Tirado, A. J., GCN Circ. 1590
K
22.26 ± 0.04
[6] Bersier et al. 2003, ApJ 584L, 43
Fig. 4 Spectral Energy
Distribution of GRB 021004
host galaxy. We have
represented the observed
photometric data as thick,
black circles together with
the
synthetic
galaxy
spectra for which we
obtained the best fit. The
thin blue circles are the
expected magnitudes for
the fitted galaxy that are
displayed in Table 1.
[4] Frail, D. A. and Berger, E. 2002, GCN Circ. 1574
[7] Holland et al. 2003, AJ 125, 2291
[8] Mirabal et al. 2003, ApJ 595, 935
[9] Pandey et al. 2003, BASI 31, 19
[10] Uemura et al. 2003, PASJ 55, 31
[11] Fox et al. 2003, Nature 422, 284
[12] Sari et al. 1998, ApJ 524, 43
[13] Miller Scalo et al. 1979, ApJS 41, 513
[14] Castro-Tirado et al. 2004, Science, submitted
[15] Bruzual and Charlot MNRAS 2003, 344, 1000
[16] Portinari, Chiosi, C. & Bressan, A. 1998, A&A 33, 505
[17] Woosley 1993, ApJ 405, 273
© Copyright 2026 Paperzz