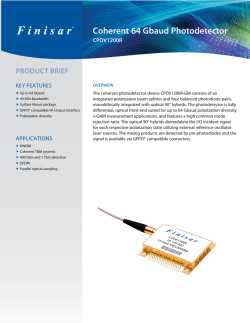
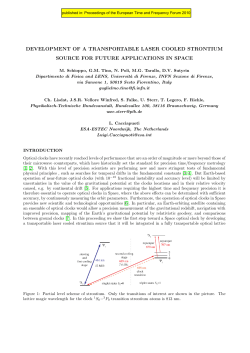
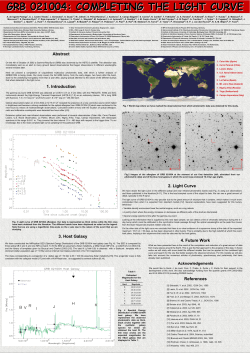
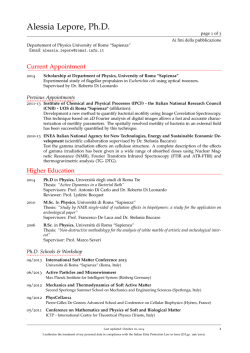
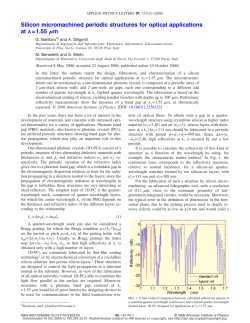
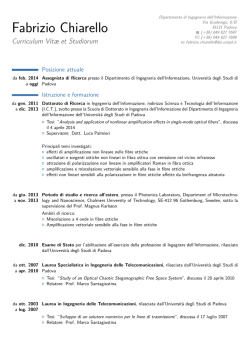
Status of the EPIC thin and medium filters on-board
XMM-Newton after more than 10 years of operation:
II - analysis of in-flight data
Fabio Gastaldelloa , Marco Barberab , Alfonso Collurac , Nicola La Palombaraa , Ugo Lo Ciceroc ,
Nicola Sartorea , Andrea Tiengoa,d,e , Salvatore Variscoc
a
INAF / Istituto di Astrofisica Spaziale e Fisica Cosmica - Sezione di Milano, Via E. Bassini
15, 20133 Milano, Italy;
b Università degli Studi di Palermo, Dip. di Fisica e Chimica, Via Archirafi 36, 90123 Palermo,
Italy;
c INAF / Osservatorio Astronomico di Palermo,Via G.F. Ingrassia, 31, 90123 Palermo, Italy;
d Istituto Universitario di Studi Superiori Pavia,Piazza della Vittoria 15, 27100 Pavia, Italy;
e INFN/Sezione di Pavia, via A. Bassi 6, 27100 Pavia Italy
ABSTRACT
After more than ten years of operation of the EPIC camera on board the X-ray observatory XMM-Newton we
have reviewed the status of its thin and medium filters by performing both analysis of data collected in-flight
and laboratory measurements on on-ground back-up filters. We have investigated the status of the EPIC thin
and medium filters by performing an analysis of the optical loading in the PN offset maps to gauge variations
in the optical and UV transmission of the filters. We both investigated repeated observations of single optically
bright targets and performed a statistical analysis of the extent of loading versus visual magnitude at different
epochs. We report the results of these measurements.
Keywords: X-Rays: XMM-Newton - X-rays: instrumentation - X-rays: filters
1. INTRODUCTION
The XMM-Newton European Photon Imaging Camera (EPIC) CCDs1, 2 are highly sensitive to visible light,
therefore if an astronomical target has a high optical-to-Xray flux ratio there is the possibility that the Xray signal becomes contaminated by optical photons (“optical loading”). The resulting quality of data would
be degraded by these effects: i) shot noise on the optically generated photoelectrons will degrade the energy
resolution; ii) the energy scale will be incorrectly registered, because a nominally zero signal pixel will have a
finite offset. For each optically generated photo-electron which is registered, the energy scale shifts about 3.6 eV,
which is comparable to the accuracy for which the brightest X-ray emission line features could be centroided;
iii) excess signal and noise fluctuations can affect the detection efficiency as well, by disguising single pixel X-ray
events as events split between pixels.3
To prevent this, the EPIC cameras include three types of aluminised optical blocking filters (thick, medium
and thin) corresponding to the prototype situations of the optical/UV-to-X-ray flux ratio for X-ray sources,4
and also an internal “Offset Map” which is uploaded before each exposure to subtract the dark-current level of
charge or other systematic zero shifts.
After more than ten years of operation of the EPIC filters we have started an investigation to review the
status of the thin and medium filters by performing laboratory measurements on back-up filters, and on board
calibration measurements. The on ground laboratory measurements are described in a companion paper,5 here
we report the results on the on board measurements of optical loading in the EPIC-PN offset maps. Analysis
of optical loading allows a measurement of the detected optical flux and constrain any variability in the optical
transmission which can point to a degradation of the in-flight EPIC filters. The stability of the X-ray transmission
is routinely investigated by dedicated calibration work, also from our team.6
(Send correspondence to F. Gastaldello)
E-mail: [email protected], Telephone: +39 02 23699337
2. DATA ANALYSIS
The PN offset maps are uploaded on board at the start of each exposure. The offset per pixel is determined
from a sample of n = 100 frames from which the mhigh = 3 highest and mlow = 3 lowest PHA values per
pixel have been excluded.∗ This frame exclusion aims to avoid X-ray contamination of the offset map: this
phenomenon occurs whenever a too large number of X-ray events per pixel is detected during the offset map
calculation (“X-ray loading”), starting at a count rate of ∼ 4 cts/s: this is a rare event for serendipitous stellar
sources in the field and it affects ∼ 3-4% of science targets at the bore sight.7 The offset analysis have been
performed following the approach of the instrument calibration team:7, 8 the offset data have been manipulated
in order to remove the dominating common mode noise and varying column-to-column gain, which is done by
subtracting the CCD column and row medians. In the resulting, so called “residual” offset maps, local features
such as optical loading due to a star may readily be detected and quantified in terms of residual offset energies,
i.e. ADUs relative to the local background (typically, residual offset maps have a mean offset value of ∼ 0 ± 1
ADU). Although an offset map is nominally in energy space, it can be considered in counts space for optical
photons. We assume an offset created solely by optical photons (as each optically generated photoelectron shifts
the energy scale by 3.65 eV) and a gain of 5 eV per ADU, so the conversion from residual offset to optical counts
per pixel is: 1 ADU ≈ 5/3.65 optical photoelectrons.7 We will estimate the error on this quantity as due to
Poissonian error on the estimated number of photoelectrons.
For this study we consider the observations taken in Full Frame (FF) mode with the thin filter starting
from revolution ∼ 800, i.e. since when offset maps are distributed with the data (older offset maps used for a
longer time baseline used in the results of Sec.3.1 have been directly retrieved from the XMM Science Operation
Center archive). To find suitable optical targets with known visual magnitudes, spectral types and reported
variability we cross-correlated the XMM archive with the Bright Star Catalogue,9 widely used as a source of
basic astronomical and astrophysical data for stars brighter than magnitude 6.5, and the Hipparcos catalogue.10
These catalogues provide information on magnitude and spectral type; together with the conversion of residual
offset energy to number of detected optical photoelectrons, a comparison of detected optical flux with respect
to magnitude can be made. Following an early analysis of a sample of 350 offset maps accumulated at the
beginning of the mission8 we will report the peak residual offset, i.e. the maximum residual offset found in the
loaded region, and the visual magnitude of the optical loading cases.
The main sources of systematic error in this type of analysis are: the inclusion of various spectral types
(which can have very different amount of optical loading for stars of similar visual magnitude3 ), uncertainty in
the visual magnitude due to optical variability of the source and the radial variation of the optical PSF with
respect to the on-axis one. Infact the core of the optical PSF is slightly larger than the X-ray PSF but with less
scattered optical light in the PSF wings; it also degrades much faster with increasing off-axis angles than the
X-ray PSF.8 Another crucial problem is the poorly known optical vignetting function.
3. RESULTS
We report here the results of the analysis performed on a sample of ∼ 200 offset maps with detected optical
loading found in thin filter exposures. We will show the results obtained from repeated observations of the same
target at different epochs, thus probing directly the possible amount of variation in the optical transmission of
the source in Sec.3.1, and the statistical results based on a possible evolution of the peak residual offset versus
visual magnitude relation in Sec.3.2.
3.1 Results with repeated observations of the same target
We found many XMM fields with the presence of bright optical stars in the field of view, observed at different
times in FF with the thin filter. Some of them have been observed over a long baseline and some of the best
cases are presented below.
obsid
0112291001
0302900101
0500750101
0653380201
0653380301
0653380401
0653380501
revolution
0483
1117
1483
1942
1943
2039
2040
obs date
29/07/2002
13/01/2006
13/01/2008
17/07/2010
19/07/2010
26/01/2011
28/01/2011
off-axis (′ )
3.4
2.8
2.8
3.4
3.3
2.6
2.6
CCD #
1
7
7
1
1
7
7
peak (ADU)
271 ± 19
265 ± 19
301 ± 20
252 ± 19
259 ± 19
307 ± 20
266 ± 19
Table 1. Parameters of the various observations of the NGC 5408 field, in particular the obsid and revolution of the
observations, the off-axis angle of the star in arc-minutes given as output by the SAS task ecoordconv.
-9
-8
-7
-5
-1
7
23
55
119
Figure 1. Left panel: PN image and optical DSS image of the NGC 5408 field. The bright star V828 Cen (HD 122532)
is indicated in the X-ray image by the red circle. Right panel: Residual offset maps of the observations 0653380501,
0653380301 and 0500750101, starting from the left. The area affected by optical loading caused by the star are clearly
visible and indicated by the green circles.
Figure 2. Left panel: Radial distribution of offset ADUs for the star HD 122532 in the various observations. Right panel:
The optical variability of HD 122532 as determined by Lanz & Mathis.11 Superimposed are the derived magnitude using
Lumb’s model3 scaled down by a factor of 7.
246
499
0
1
4
10
21
43
88
176
354
707
1410
-1.0
-0.7
-0.1
1.1
3.5
8.2
17.7
36.6
74.6
149.9
299.7
Figure 3. Left panel: PN image and optical DSS image of the PG 1535+547 field. The bright stars HD 139778 and HD
139493 are highlighted in the X-ray image by the white circles. Right panel: Offset maps of the observation 0300310501,
HD 139493 in CCD # 2 on the left and HD 139778 on the right in CCD # 6.
3.1.1 HD 122532 in the NGC 5408 field
NGC 5408 has been repeatedly observed because of the bright Ultra Luminous X-ray source (ULX) present in
the galaxy. Close to the X-ray source (see Fig.1) there is the star V828 Cen (HD 122532) which is a 6.11 V
magnitude variable star of the chemically peculiar type (spectral type B9p) with known optical variability of 3.68
days.11 In Table 1 we report the main parameters of the various observations. As it can be seen, the deviations
from the mean of the peak residual offset is consistent with zero over a time span of 8.5, and the most deviant
point is just 1.5σ away from the mean.
We further investigate some possible sources of systematic errors as described in Sec.2: the optical PSF and
the poorly known optical vignetting might play a role, so it is preferred to have the source as close as possible to
the same off-axis angle and at the same position angle, in order to be placed at the same detector coordinates.
We accumulated the radial profile of the offset distribution (which by the consideration above can be considered
as a “surface brightness” distribution) shown in the left panel of Fig.2. We found that the PSF and vignetting
are not a major factor in the analysis of this case of optical loading. Finally we double-checked that the optical
variability is not playing a factor in the measurement: we assumed the pre-launch model for optical loading,3
which consists of a look-up table of the expected optical loading for different spectral types and filters, and for a
visual magnitude of 0. for PN, it assumes a fraction of 15% of light in the PSF central pixel. Using that model
scaled down by a factor of 7 as empirically found from early in-flight data† , we derived the constraints to the V
magnitude of the star shown in the right panel of Fig.2.
3.1.2 HD 139778 and HD 139493 in the PG 1535+547 field
In the field of the AGN PG 1535+547 there are two bright stars: HD 139778 which is a 5.87 V magnitude
K1III star and HD 139493, a 5.74 V magnitude A2V variable star (see Fig.3). In Table 2 we report the main
parameters of the various observations. Aso in this case no significant deviations are observed.
3.2 Results from the investigation of the peak residual offset versus visual magnitude
relation
We have collected the results on the peak residual offset for the ∼ 200 cases of optical loading investigated
so far and divided them in an early sample, going from revolution 860 to revolution 1421 (from 20/08/2004
to 12/09/2007), and a late sample, from revolution 1422 to revolution 2299 (from 14/09/2007 to 28/06/2012),
shown in the left and right panel respectively of Fig.4. The best-fit exponential functions are also shown: they
are of the form A ∗ 10(−0.4M) where M is the visual magnitude, which is the expected theoretical relationship.3
∗
In all operating modes except for Full Frame (FF) mode, for which n = 50 from rev 843 (July 2004) onward.
the over-prediction mainly due to a conservative, large assumed fraction of detected light at the central PSF pixel
and secondly to an initial overestimation of the filter transmission7, 12
†
obsid
revolution
obs date
0150610301
0300310301
0300310401
0300310501
531
1118
1121
1122
03/11/2002
16/01/2006
22/01/2006
24/01/2006
0150610301
0300310301
0300310401
0300310501
531
1118
1121
1122
03/11/2002
16/01/2006
22/01/2006
24/01/2006
off-axis (′ )
HD 139778
7.8
7.2
7.3
7.3
HD 139493
8.2
8.3
8.3
8.3
CCD #
peak (ADU)
4
6
6
6
201 ± 16
221 ± 17
179 ± 16
221 ± 17
10
2
2
2
242 ± 18
211 ± 17
221 ± 17
221 ± 17
Table 2. Parameters of the various observations of the PGC 1535+547 field.
Figure 4. Left panel: Peak residual offset versus visual magnitude for the early sample of cases of optical loading,
from revolution 860 to revolution 1421 (from August 2004 to September 2007). The drawn line represents the best fit
exponential function. Right panel: Same as the left panel, for a late sample of cases of optical loading, from revolution
1422 to revolution 2299 (from September 2007 to June 2012).
The normalization of the best-fit relation between the two samples differs by only 3% and this difference is well
below the intrinsic scatter due to the inclusion of various spectral types (which can also lead to a factor of two
difference in optical loading from a M0 star and a B9 star) and observations at different off-axis angles.
4. CONCLUSIONS
We have investigated the status of the EPIC thin filter performing an analysis of 200 cases of optical loading in
the PN offset maps of FF observations. We did not found any indication of variability in the optical transmission,
both by analyzing repeated observations of the same targets and from a statistical analysis of the relation between
optical loading and visual magnitude of the star responsible for it. The analysis will be improved by a more
accurate control of systematic intrinsic scatter in these measurement due to spectral type of the stars and off-axis
angle of the detection by completing the analysis of the sample of 700 cases of potential optical loading obtained
by a cross-correlation of the XMM archive and the Hipparcos catalogue.
ACKNOWLEDGMENTS
We acknowledge financial contributions by the Italian Space Agency through ASI/INAF agreements I/023/05/0
and I/088/06/0 for the data analysis and I/032/10/0 for the XMM-Newton operations. We thank M.J.S. Smith
and M. Freyberg for help with the analysis of PN offset maps.
REFERENCES
[1] Turner, M. J. L., Abbey, A., Arnaud, M., Balasini, M., Barbera, M., Belsole, E., Bennie, P. J., Bernard,
J. P., Bignami, G. F., Boer, M., Briel, U., Butler, I., Cara, C., Chabaud, C., Cole, R., Collura, A., Conte,
M., Cros, A., Denby, M., Dhez, P., Di Coco, G., Dowson, J., Ferrando, P., Ghizzardi, S., Gianotti, F.,
Goodall, C. V., Gretton, L., Griffiths, R. G., Hainaut, O., Hochedez, J. F., Holland, A. D., Jourdain,
E., Kendziorra, E., Lagostina, A., Laine, R., La Palombara, N., Lortholary, M., Lumb, D., Marty, P.,
Molendi, S., Pigot, C., Poindron, E., Pounds, K. A., Reeves, J. N., Reppin, C., Rothenflug, R., Salvetat, P.,
Sauvageot, J. L., Schmitt, D., Sembay, S., Short, A. D. T., Spragg, J., Stephen, J., Strüder, L., Tiengo, A.,
Trifoglio, M., Trümper, J., Vercellone, S., Vigroux, L., Villa, G., Ward, M. J., Whitehead, S., and Zonca,
E., “The European Photon Imaging Camera on XMM-Newton: The MOS cameras : The MOS cameras,”
Astronomy and Astrophysics 365, L27–L35 (Jan. 2001).
[2] Strüder, L., Briel, U., Dennerl, K., Hartmann, R., Kendziorra, E., Meidinger, N., Pfeffermann, E., Reppin,
C., Aschenbach, B., Bornemann, W., Bräuninger, H., Burkert, W., Elender, M., Freyberg, M., Haberl, F.,
Hartner, G., Heuschmann, F., Hippmann, H., Kastelic, E., Kemmer, S., Kettenring, G., Kink, W., Krause,
N., Müller, S., Oppitz, A., Pietsch, W., Popp, M., Predehl, P., Read, A., Stephan, K. H., Stötter, D.,
Trümper, J., Holl, P., Kemmer, J., Soltau, H., Stötter, R., Weber, U., Weichert, U., von Zanthier, C.,
Carathanassis, D., Lutz, G., Richter, R. H., Solc, P., Böttcher, H., Kuster, M., Staubert, R., Abbey, A.,
Holland, A., Turner, M., Balasini, M., Bignami, G. F., La Palombara, N., Villa, G., Buttler, W., Gianini,
F., Lainé, R., Lumb, D., and Dhez, P., “The European Photon Imaging Camera on XMM-Newton: The
pn-CCD camera,” Astronomy and Astrophysics 365, L18–L26 (Jan. 2001).
[3] Lumb,
D.,
“PHS Tools - EPIC Optical Loading,”
XMM-SOC-CAL-TN-0001 (2000).
http://xmm2.esac.esa.int/docs/documents/CAL-TN-0001-1-0.ps.gz.
[4] La Palombara, N., Musso, C., Conte, M., and Barbera, M., “The Filters for EPIC: Optimized Design,”
Astrophysics and Space Science 239, 281–296 (Sept. 1996).
[5] Barbera, M., Agnello, S., Buscarino, G., Collura, A., Gastaldello, F., La Palombara, N., Lo Cicero, U.,
Tiengo, A., Sciortino, L., Varisco, S., and Venezia, A., “Status of the EPIC thin and medium filters onboard XMM-Newton after more than 10 years of operation: I - laboratory measurements on back-up filter,”
Proc. SPIE 8859-40 (2013). this conference.
[6] Sartore, N., Tiengo, A., Mereghetti, S., De Luca, A., Turolla, R., and Haberl, F., “Spectral monitoring of
RX J1856.5-3754 with XMM-Newton. Analysis of EPIC-pn data,” Astronomy and Astrophysics 541, A66
(May 2012).
[7] Smith,
M.,
“PN
X-ray
Loading,”
XMM-SOC-CAL-TN-0050
(2013).
http://xmm2.esac.esa.int/docs/documents/CAL-TN-0050-1-1.ps.gz.
[8] Smith,
M.,
“PN
Optical
Loading,”
XMM-SOC-CAL-TN-0051
(2008).
http://xmm2.esac.esa.int/docs/documents/CAL-TN-0051-1-2.ps.gz.
[9] Hoffleit, D. and Warren, Jr., W. H., “Bright Star Catalogue, 5th Revised Ed. (Hoffleit+, 1991),” VizieR
Online Data Catalog 5050, 0 (Nov. 1995).
[10] ESA, “The Hipparcos and Tycho Catalogues (ESA 1997),” VizieR Online Data Catalog 1239, 0 (Feb. 1997).
[11] Lanz, T. and Mathys, G., “Photometric variations of some magnetic AP stars,” Astronomy and Astrophysics
Supplement Series 90, 365–373 (Oct. 1991).
[12] Altieri,
B.,
“MOS
Optical
Loading,”
XMM-SOC-CAL-TN-0043
(2003).
http://xmm2.esac.esa.int/docs/documents/CAL-TN-0043-1-1.ps.gz.
© Copyright 2026 Paperzz