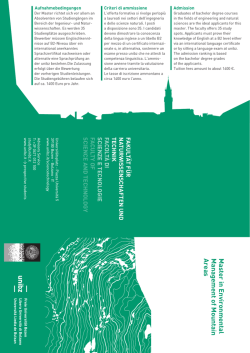
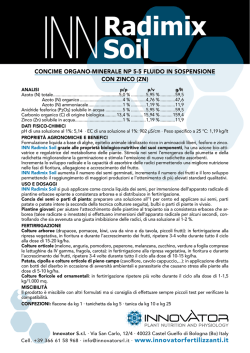
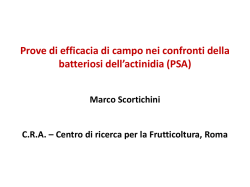
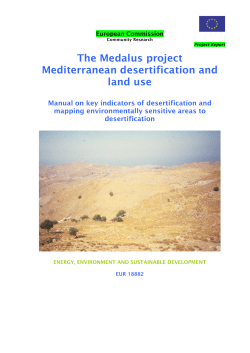
Advances in Geosciences, 2, 243–247, 2005
SRef-ID: 1680-7359/adgeo/2005-2-243
European Geosciences Union
© 2005 Author(s). This work is licensed
under a Creative Commons License.
Advances in
Geosciences
Desertification risk assessment in southern Mediterranean areas
M. Greco, D. Mirauda, G. Squicciarino, and V. Telesca
CIMA, Department of Environmental Engineering and Physics, Basilicata University, Potenza, Italy
Received: 14 November 2004 – Revised: 18 April 2005 – Accepted: 18 April 2005 – Published: 11 July 2005
Abstract. The paper deals some important aspects concerning the study of desertification phenomenon that has significantly interested all European countries of the Mediterranean
basin in the last decades. The territorial sensibility, qualitatively and/or quantitatively, of the risk related to the desertification processes has been valued as grade of susceptibility to the phenomenon in the study area, with respect to the
hydraulic and hydrologic conditioning factors. The methodological approach followed is based on the classification of
desertification indicators by means of a suitable conceptual
model applied to the study area in Basilicata region. The
classical desertification indexes have been evaluate referring
to the study area generating temporal informative map. To
achieve such objective, the historical series of temperatures
and rainfall of several gauge-stations have been analysed, and
the first results show an increasing trend for the temperature
in last years, according to the global scale. An increase of
aridity and erosion index values is, also, outlined by the collected data with slight reductions at higher altitudes.
1 Introduction
The phenomenon of desertification has assumed now the feature of a global problem, although with different characteristics in distinct economic, social and environmental contexts.
The need of contrasting desertification is largely recognized
not only in the areas with large desert zones, but also in the
northern countries of the world, in particular the Mediterranean ones, involved in this phenomenon both directly, for
degradation processes of the territory, and indirectly, for the
repercussions of socio-economic imbalances in the emergent
countries. The lack of water and the irrational management
of natural resources, at productive and settling ends, such
as the increased tendency to leave rural areas, are the main
causes of desertification processes, or better of progressive
Correspondence to: M. Greco
([email protected])
reduction of the soil surface layer and its producing capacity
loss. The concept that the soil degradation occurs both for
climatic and, more and more, for anthropic factors has been
consolidated.
The most recent researches disclose as climatic variation
can make the existing desertification processes worsen or
cause trigger conditions. Let’s think to an increasing of aridity conditions and/or to a larger frequency of droughty phenomena and/or to an increase of intense rain that, above all
on poor as vegetated soil, can cause a high and rapid ground
degradation, for the mechanical removal of its fertile portion. “Human” activities followed this one, together with
the exploitation of upland and wooden areas for pasturage
in a careless and irrational way without an adequate planning
constituting another disequilibrium element. Population concentration in the coastal zones and the intensive agrarian utilization in the same territories determine water requirements
that, often for a long period of the year, exceed the real availabilities. Consequently the excessive extraction from coastal
aquifers often determines intrusion phenomena of sea water, that lead to increase even more the desertification risk,
linked, in that case, to salting effects.
Even though continuous studies for the diffusion control
of areas at desertification risk are going on, around the 70%
of the barren grounds used in agriculture is interested by desertification process. Also in the areas with sufficient water
for the irrigation, the phenomenon is improving in a significant way: the 30% of the irrigation water at worldwide level
shows a marked soil degradation, while in Europe the percentage is around to 16%. In this way, the present contribution is addressed to the pressure state assessment of Lucanian territory through the reconstruction of the vulnerability
thematic maps of different periods. The critical state is calculated by the value assumed by hydraulic and hydrologic
indexes representing the process. In particular, with the data
analysis of the Lucanian Agency of Development and Innovation in Agriculture (ALSIA) and in the period between
1999 and 2003, the indicators have been valued and the models have been developed, both on aggregate index base and on
244
M. Greco et al.: Desertification risk assessment in southern Mediterranean areas
Table 1. Classification of the climatic zones according to the rainfall index.
Values of IP
Risk level
Values of Ia
Definition of the climatic zones
<280 (mm)
280÷650 (mm)
>650 (mm)
arid and semi-arido
dry sub-humid
Humid and hyper-humid
<0.5
0.5÷0.65
>0.65
arid and semi-arid
dry sub-humid
Humid and hyper-humid
disaggregate parameter base, suitable to give a support to the
medium term provisional analysis of the studying process. It
is important to underline that analysis has been effected using historical series reported to a brief period of observation
because of the not complete availability of all data, reported
to every climatic parameter, necessary for the elaboration of
aggregated indexes that will be considerer later in the paper. Also, being evident that the climatic variables are not
correlated to bashful with the recorded courses in the long
period, it is necessary to notice that the principal intent of
this job has been to make a test of a methodology, following described, respect to the deducible information from the
available historical series, apart from the analysis of the evolutionary trends of the selected components, in this phase.
2
Table 2. Classification of the climatic zones according to the aridity
index.
Study methodology
The performed analysis is based on the use of the state, pressure, impact indicators methodology and, in particular, the
hydraulic-hydrologic indexes and the soil ones have been
valued (Greco et al., 2003).
It was reached, therefore, the draft valuation of the vulnerability to the desertification risk of the territory examined,
giving a first cognitive level to use as work basis propaedeutic to the integration of other indices representing the phenomenon, or better suggesting provisional quantities models
that allow the definition of the indicators themselves.
Three different indices have been used, reflecting the territorial system state with regard to the acting climatic stresses.
In particular:
– rainfall index;
– aridity index;
– ratio SAU/ST.
The rainfall index is a typically hydrologic index with the
double function of considering the rain as one of the main
erosive soil agent and, consequently, giving the contribution
to the degradation of it, and, on the other hand, of contributing to the vegetation growth.
Three rainfall groups have been identified for this index,
considering the rain values accumulated in the space of one
year, to which a higher risk is associated when the rainfall
decreases.
Unlike the previous one, the aridity index considers the
soil because it is calculated as the ratio between the annual
average precipitations, P , and the potential annual average
evapo-transpiration, ETP, and so it considers the average water availability in the soil essential for the preservation of the
vegetal species.
Three groups corresponding to definite climatic zones
have been identified for both indices to which a different
value has been assigned (Tables 1 and 2).
The ratio Farm Surface Used (SAU)/Total Territorial Surface (ST), finally, gives an indication of the part of the territory really assigned to productive farm activities compared
with the total territorial surface and so of the real pressure
state both on the territory and on the soil in regard to anthropic activities against the cultivation tendency of the area.
In fact, according to the definition of the ISTAT, the agrarian surface used is considered as the totality of the sow able
land surfaces, permanent mead owed surfaces, pasture-land
surfaces and agrarian wooden cultivation, kitchen-gardens
and fruit chestnut grove. Although the index is mostly socioeconomic, its evolution in time can give indications about the
impact exercised by the farms on the environment, above all
in terms of soil removed to agrarian use, agriculture extensive or abandonment of marginal areas.
A decrease of the ratio in upland areas is generally interpreted in the negative because it is correlated to a progressive
abandonment of “marginal” areas, main cause of soil erosion
phenomena and hydro geological risk.
3
Study area and environmental conditions
The region of Basilicata is considered as one of the most
threatened areas of Italy as far as the phenomenon of desertification is concerned. This is mainly due to climactic
changes and to the widespread degradation of the territory
resulting from hydro geological instability, woodland fires,
and more generally to an ever growing misuse of the land by
man.
In particular the most affected areas of this phenomenon
are the Ionian alluvial plain and the south-eastern territories
characterised by their plio-pleistocene clays.
The former, deriving from the expansion of the region’s
rivers over coastal deposits left by the sea’s regression and
now representing the main agricultural area, is subject to important and periodical salting process which in recent years
have become more frequent. Although it is not possible to
quantify, with great precision, the areas affected by this process or even describe the intensity, the limited fertility of the
M. Greco et al.: Desertification risk assessment in southern Mediterranean areas
245
Fig. 1. The study area.
re 1. The study area.
land for agricultural purposes is particularly evident in some
areas which were studied. This is due to several contributory
factors: the production of erosive materials deriving from
marine terraces above the plains which, due to the pedogenetic substrate (plio-pleistocene bluish-grey clays), are rich
in soluble salts, and particularly in sodium, sea water infiltration and finally the soil pattern which, if very fine, may
result in a deposit of salt along the profile.
Data analysis and first results
per year. However, on the other hand, we can also find flat
or mildly sloping areas where the intensity of notable desegregation processes is inferior. All this, coupled with the
management difficulties arising from the particular morphological features of the area, generate a productive deficiency
of these lands: it is for this very reason that these areas are
greatly influenced by recent EU directives aimed at extending them and transforming them into productive woodlands
(Agenzia Nazionale per la Protezione dell’Ambiente, 2000).
The clayey nature of the territory described, is too preponderant to generate a state of aridity constant in time.
It is evident, therefore, that the risk of desertification in
Basilicata, due to the intrinsic nature, as well as to the anthropic use of the land is considerably high and that the drawing up of a map, highlighting the area’s vulnerable points,
represents an essential tool in order to set forth a strategic
plan for productive assets and for the establishment of infrastructures within the region.
The study area has interested the zone between the Ionian
coast and the hills of Matera area of Basilicata in the territory
of Tursi, Montalbano Ionico, Pisticci, Craco, Aliano, Ferrandina (low and middle hills of Matera area), San Mauro Forte,
Stigliano, Cirigliano, Gorgoglione (high hills of Matera area)
and Guardia Perticara in the province of Potenza as showed
in the Fig. 1 covering almost the whole of Lucanian basins.
processing
on the select indicators has been performed with reference to the data obta
These areas are locally defined as “burned land” and can
be readily found along the entire coastline from Policoro to
he meteorological
ALSIA,
distributed on the whole Lucanian terri
Scanzano and up as gauge-stations
far as Metaponto and also of
spread
inland
for about 1km covering an area of 4000 ha. The irrigation
waters, deriving from the local Consorzio di Bonifica (local water supply) are of a high quality, while the quantity
of such water obtained from local wells is very low, as well
as being dangerous due to its high salt content (Ministero
dell’Ambiente, 1999).
articular, among the thirty nine telemetry control units, the twenty nine of the so
ern part of the region, corresponding to the whole study area, have been selected.
Plio-pleistocene clay areas also tend to be very hard as
about israin,
temperature
relative
humidity measurements available in time format
the case
in about 200 000 ha and
of territory
to the south-east
of the region. However, these problems are in fact of another nature: the widespread formation of gullies represent
a significant index of the high level of land degradation and,
consequently, a continuous and progressive increasing of territorial vulnerability. The hot, dry summers cause the surface crust of the south-facing lands and ridges generate a
land creeping with the depth of the creeps depending on geographical orientation. It therefore follows that with the aggressive summer and autumn rainstorms an increased surface area is subject to land erosion: from 2 mm to 20 mm
work, have been aggregate on a daily basis and, successively, on an annually one.
e distribution and the rainfall index variation, relative to the period of observation 1
3, are showed in the Fig. 2 and underline, excluding the year 2002, low annual rainfall
whole studying territory. In fact, altogether, rainfall index values around 400-450
been observed and, for this reason, they place the study areas in the middle-high rang
246
M. Greco et al.: Desertification risk assessment in southern Mediterranean areas
2000
1999
2001
2002
1000
800
600
400
200
0
2003
Figure 2. Spatial distribution of the rainfall index by 1999 to 2003.
Fig. 2. Spatial distribution of the rainfall index by 1999 to 2003.
Fig. 3 refer to the aridity index for the same years showing values markedly lower than 0,5
and putting the areas in the zone corresponding to the arid and semi-arid zones. The reading
4 Data analysis and first results
ticular, the south-eastern part of the region. The observed
of temporal vulnerability maps of the two indicesrainfall
allows shortage,
to draw useful
information
thestability of the
in fact,
versus an about
evident
The processing on the select indicators has been performed
aridity index
middle-highthevalues,
states, in a more acpressure state to which the Lucanian territory is subjected
and, on
in particular,
south-eastern
with reference to the data obtained by the meteorological
curate way, what emerges from the analyses conduced on a
of the distributed
region. Theonobserved
shortage,
in fact,
versus
an evident
stability increase
of the of desertifigauge-stationspart
of ALSIA,
the wholerainfall
Lucanian
national
scale
underlining
a tendential
territory. In particular,
among
the
thirty
nine
telemetry
conrisks of the
territory
in answerfrom
to thethe
imposed aridity
aridity index on middle-high values, states, in a cation
more accurate
way,
what emerges
trol units, the twenty nine of the south-eastern part of the
conditions to which the area has been subjected.
analysestoconduced
a national
scale
underlining
aFinally,
tendential
of desertification
region, corresponding
the wholeon
study
area, have
been
sethe increase
information
derivable from risks
the spatial distribulected.
tion
of
the
ratio
SAU/ST,
even
if
averaged
on the long term,
of the territory in answer to the imposed aridity conditions to which the area has been
Data about rain, temperature and relative humidity meashows a high degree of utilization of the soil for agrarian use
subjected.
surements available
in time format, for this work, have been
with percentages between the 70%–85%, strengthening the
aggregate on a daily basis and, successively, on an annually
positions derived from hydrologic indices analysis, showing
one. The space distribution and the rainfall index variation,
the presence and the possible increase of a high vulnerabilrelative to the period of observation 1999–2003, are showed
ity state of territory, concause of the climatic and anthrophic
in the Fig. 2 and underline, excluding the year 2002, low
components.
annual rainfalls on the whole studying territory. In fact, altogether, rainfall index values around 400–450 mm have been
observed and, for this reason, they place the study areas in
5 Conclusions
8
the middle-high range of risk.
Figure 3 refers to the aridity index for the same years
The study of some physical-climatic and hydrologic indicashowing values markedly lower than 0,5 and putting the artors, and their following comparison in different times, allow
eas in the zone corresponding to the arid and semi-arid zones.
a valuation of the vulnerability degree of Basilicata Region.
The reading of temporal vulnerability maps of the two inThe analysis of the rainfall index maps that registers the raindices allows to draw useful information about the pressure
fall shortage in the last years, the aridity index value that
state to which the Lucanian territory is subjected and, in parputs the territory in an arid or semi-arid area and the high
M. Greco et al.: Desertification risk assessment in southern Mediterranean areas
247
1999
2000
2002
2001
1
0.9
0.8
0.7
0.6
0.5
0.4
0.3
0.2
0.1
0
2003
Figure 3. Spatial distribution of the aridity index by 1999 to 2003.
Fig. 3. Spatial distribution of the aridity index by 1999 to 2003.
Finally, the information derivable from the spatial distribution of the ratio SAU/ST, even if
Edited
by: L. Ferraris
averaged on the long term, shows a high degree of
utilization
of the soil for agrarian use with
1
Reviewed by: anonymous referees
percentages between the 70%-85%, strengthening the positions derived from hydrologic
0.95
0.9
0.85
indices analysis, showing the presence and the possible
increase of a high vulnerability state
References
of territory, concause of the climatic and anthrophic components.
0.8
0.75
0.7
0.65
0.6
0.55
0.5
0.45
0.4
0.35
0.3
Figure 4. Ratio SAU/ST.
Agenzia Nazionale per la Protezione dell’Ambiente, ANPA:
Sviluppo di indicatori per il suolo e siti contaminati, Roma, 2000.
Greco, M., Telesca, V., and Squicciarino, G. :Applicazione di un
modello concettuale DTPSIR per lo studio della desertificazione
del territorio lucano, Documenti del territorio, 52, 2003.
Ministero dell’Ambiente: Comunicazione nazionale per la lotta alla
siccità ed alla desertificazione, Roma, 1999.
Fig. 4. Ratio SAU/ST.
5 Conclusions
The study of some physical-climatic and hydrologic indicators, and their following
comparison
in different have
times, showed
allow a valuation
of the vulnerability
degree of
Basilicata
ratio SAU/ST
an increase
of the sensitive
areas
Region.
The analysis
of the
rainfall
index maps that phenomena.
registers the rainfallThe
shortage
in the last
toward
aridity
and
desertification
results
years,
the aridity have
index value
that puts
territory
in an arid
or semi-arid
the high
obtained
allowed
tothe
make
a draft
valuation
ofarea
theandvulrationerability
SAU/ST have
increase of the of
sensitive
areas toward
aridity and
stateshowed
to theandesertification
the studying
territory,
reachingphenomena.
a first cognitive
level to
expand
inmake
future
introducdesertification
The results obtained
have
allowed to
a draft
valuation of the
ing other
representative
of the phenomenon.
vulnerability
stateindices
to the desertification
of the studying
territory, reaching a first cognitive
level to expand in future introducing other indices representative of the phenomenon.
References
Agenzia Nazionale per la Protezione dell’Ambiente, ANPA: Sviluppo di indicatori per il
suolo e siti contaminati, Roma, 2000.
Greco, M., Telesca, V., and Squicciarino, G. :Applicazione di un modello concettuale
DTPSIR per lo studio della desertificazione del territorio lucano, Documenti del territorio, 52,
2003.
9
© Copyright 2026 Paperzz