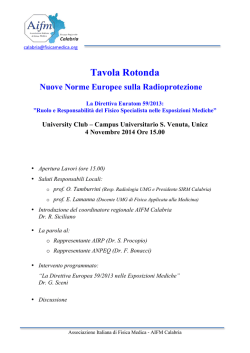
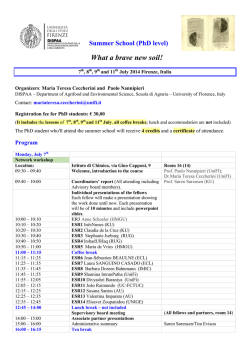
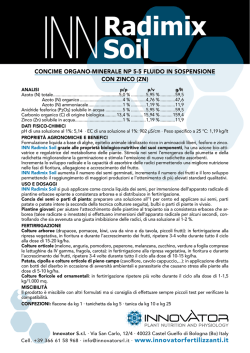
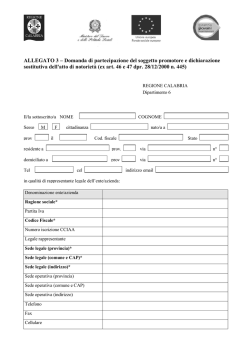
Ecosystems and Sustainable Development V
47
Sustainable indicators in desertification
phenomena: application to Calabria, Italy
G. Frega, P. Piro & R. Mangiardi
Dipartimento di Difesa del Suolo “V. Marone”,
Università degli Studi della Calabria, Italy
Abstract
Italy is one of the Mediterranean countries that are menaced by desertification,
particularly in the Southern regions: Sicily, Sardinia, Apulia, Basilicata and the
Ionian areas of Calabria. In such a scenario it is evident that correct water
resource planning is very important: reduced water resources, once considered
meaningless, have now acquired notable importance. Environmentally Sensitive
Areas (ESAs) [1] to desertification will be described in this paper, with particular
reference to the Calabria region. Key indicators for the estimation of soil
capacity to resist degradation processes will be found through the MEDALUS
methodology (MEditerranean Desertification And Land USe: European
Commission, 1999), which allows the assessment of desertification risks on a
regional scale. Indicators will be grouped into four classes, on the basis of soil
quality, climate quality, vegetation quality and management quality. Each index
will be classified into three levels (high, moderate and low) according to the
MEDALUS classification, and they will be entered into and employed by a
Geographical Information System (GIS), which will define the different layers
depending on the quality index considered. In this way, the contribution of each
quality index will be defined and intervention and mitigation proposals will be
developed through the description of the main sectors (soil protection,
sustainable management of agricultural resources, decreased impact of
production activities and territory re-equilibrium), allowing the definition of
criteria used to limit the effects of the degradation and to allow correct land use.
1
Introduction
In Italy, desertification does not mean that landscape will turn into a desert one,
but that it will be characterized by aridity, erosion, salinization, depletion of
WIT Transactions on Ecology and the Environment, Vol 81, © 2005 WIT Press
www.witpress.com, ISSN 1743-3541 (on-line)
48 Ecosystems and Sustainable Development V
vegetable covering and organic substances, pollution and wrong soil use (effects
of intensive agriculture on soil, effects of pasturing on vegetation, wood
overexploitation in forest, irrigation mismanagement that have wasted land
fertility). For this reason it is necessary to develop an efficient system for
resources monitoring and models compatible with territory sustainable
development. Being mainly a mountainous and hilly country, Italy is particularly
vulnerable. Moreover, soil slope and its exposition are a further vulnerability
factor in the climatic and geo-morphological context of the regions subjected to
water stress conditions. In order to collect data concerning soil degradation and
to describe its causes through measurements and observation, some indicators
and indexes are employed. They are a whole of aggregated or weighed indicators
or data, having great importance in the process that starts from the definition of
the phenomenon and leads to decision making [2]. There is not a general
consensus regarding the indicators to be used at a national scale. At the
Mediterranean Basin scale, there exist many Community research projects. One
of these projects, the MEDALUS, was designed to investigate climatic changes
in the Mediterranean area, soil degradation in semi-arid areas, vegetation growth,
socioeconomic changes and methods useful to integrate these factors through
numerical models [3].
2
Project methodology
The methodology developed for the MEDALUS project, and illustrated in
previous works [4] provided the definition for ESAs, through the evaluation of
the so-called Environmentally Sensitive Areas index. This index is obtained by
employing some key indicators grouped in four categories: Soil, Climate,
Vegetation and Management. Through them, soil capacity to resist degradation
processes or soil suitability to support and sustain specific uses can be evaluated.
Each indicator has to belong to a class and each class is given a score varying
from 1 (“lower weight”) to 2 (“higher weight”) depending on its influence on
desertification process. The geometric mean of the groups of indicators
belonging to each of the four categories, provides for four Quality Index (QI)
[5]:
1) Vegetation Quality Index (VQI);
2) Soil Quality Index (SQI);
3) Climate Quality Index (CQI);
4) Management Quality Index and anthropic pressures (MQI).
The geometric mean of the four quality indexes gives the ESAs index which
is used to classify the areas into four different sensibility categories (critical,
fragile, potential, and unaffected by desertification) [6]:
ESAI = (VQI* SQI*CQI* MQI)1/4.
2.1 Vegetation Quality Index (VQI)
The biotic soil component able to contrast the desertification process is vegetable
covering. Vegetation Quality can be obtained through indicators that “quantify”
WIT Transactions on Ecology and the Environment, Vol 81, © 2005 WIT Press
www.witpress.com, ISSN 1743-3541 (on-line)
Ecosystems and Sustainable Development V
49
the capacity of each vegetable species (natural or agricultural) to resist to
degradation. The key indicators developed for this purpose are:
1) Fire risk and recuperation capacity;
2) Soil protection from erosion;
3) Vegetation drought resistance;
4) Vegetable covering.
By combining these indicators [5] the Vegetation Quality Index (VQI) can be
obtained. More specifically:
VQI = (Fire risk and recuperation capacity * Soil protection from erosion *
Vegetation drought resistance * Vegetable covering)1/4.
2.2 Soil Quality Index (SQI)
Soil, according to the definition of the Soil Conservation Society of America
(1986), is a natural body composed of mineral and organic particles deriving
from physical and chemophysical rock alterations and from the biological and
biochemical transformation of organic residuals. Capable of supporting
vegetation, it is characterized by inner atmosphere, flora and fauna determined
by a particular water “economy”. When soil lacks the characteristics necessary to
support a vegetable covering (inadequate rooting depth and/or inadequate water
capacity and/or lack of nutrients) a degradation process is triggered, leading in
the end to land desertification. In this context, quality soil indicators can be
related to soil water content and soil erosion through the evaluation of the
proprieties or characteristics of the soil [5]. The procedure cannot be strictly
applied to Calabria Region because the regional soil map is still missing. This
map would have provided for a precise description of soil characteristics, thus
giving the tools to estimate, in the totality of the area, the “value” of indicators
such as soil depth, drainage, texture, and rock fragments [7]. At present, the
indicators considered to represent soil quality are:
1) Parent rock;
2) Soil depth;
3) Slope.
Their combination gives a Soil Quality Index (SQI) equal to:
(SQI) = (Parent rock * soil depth * slope )1/3.
2.3 Climate Quality Index (CQI)
The spatial distribution of the indicators in the territory is based on the values
assumed in measurement stations. Rainfall observation period, for most stations,
goes from 1921 to 2000, though in some cases the series are incomplete.
Anyway, stations have always been run for more than 40 years, a period largely
sufficient to give a very good estimation of the average value of annual total
rainfall [8]. Calabria region is particularly rainy (average total annual rainfall is
1176 mm, higher than the Italian average value of 970 mm); the prevailing
climate is humid (44%); hyperhumid climate characterizes Sila and Serre
WIT Transactions on Ecology and the Environment, Vol 81, © 2005 WIT Press
www.witpress.com, ISSN 1743-3541 (on-line)
50 Ecosystems and Sustainable Development V
mountain chains, Aspromonte and Pollino massifs; in the areas of Catanzaro,
Cosenza and Mileto climate is sub-humid; climate becomes arid in the most
Southern areas and in the higher Ionian coastal areas (Villapiana). Irregular
annual and pluriannual rainfall distribution, together with the occurrence of
extreme events as well as rainfalls and vegetative periods out of season are the
main climatic factors contributing to soil degradation in semi-arid and arid
Mediterranean areas. According to recent studies [5], global climatic changes
will affect the vulnerable Mediterranean areas: in the future, the hydrological
deficit might leave the soil naked, thus favoring surface runoff and erosion,
factors that may trigger the desertification process. Many proposals have been
made regarding a rational classification of climate through the transformation of
elementary data into synthetic climatic indexes, which should not consider
pluviometry only, but also its relationship with the water need of soil and
vegetation, that is real evapotranspiration meaning water quantity passing as
vapor directly through soil evapotranspiration or indirectly through plant
transpiration [9]. The indicators considered in this paper to represent climate
quality are:
1) Climatic Thornthwaite index;
2) Average annual rainfall;
3) Slope aspect.
The combination of these indicators gives the Climate Quality Index (CQI).
More specifically:
(CQI) = (Clim. Thornthwaite ind. * Average annual rainfall * Slope aspect)1/3.
2.4 Management Quality and anthropic pressures (MQI)
Paleoclimatic studies confirmed that the destabilization of natural ecosystems in
general, and forest systems in particular, was a consequence of anthropic
pressure on environment. In particular, the choice of some areas and not others
was possibly a discriminating factor. Moreover, present changes in economic
and social structures in some rural areas also have in many cases affected the
hydrological cycle, exacerbating erosion phenomena and increasing surface
runoff [3]. In the definition of desertification ESAs, the following key indicators
regarding management quality and anthropic pressures should be considered:
1) Soil use intensity;
2) Land protection politics.
The highest score to soil use intensity has been given to sowable lands in
irrigation areas and to urban areas because of soil subtraction associated with it.
A low score for soil use intensity characterizes forested areas, the Tyrrhenian
Coastal Chain, the Sila and Serre mountain chains, the Aspromonte massifs. The
combination of these indicators gives the Management Quality Index and
anthropic pressures (MQI). More specifically:
(MQI) = (soil use intensity * management politics)1/2.
WIT Transactions on Ecology and the Environment, Vol 81, © 2005 WIT Press
www.witpress.com, ISSN 1743-3541 (on-line)
Ecosystems and Sustainable Development V
3
51
Procedures and data
Among the most advanced instruments for the study of environmental variations
in general, and desertification in particular, aerospace telemetering and
Geographic Information Systems (GIS) are tools with powerful descriptive
characteristics. Moreover, when data are introduced in a regional GIS, the
immediate analysis and visualization of the phenomenon can be performed.
Being relational databases, capable of implementing, manipulating and process
any kind of georeferenced information, GIS is by its very nature suitable for the
multifactorial analysis of ecological complex processes at a superregional scale.
Moreover, ecological processes interact with economic and social factors
difficult to quantify and analyze in the decision-making process for a sustainable
land development. GIS allows a unitary representation of all these factors by
attributing quantitative values to each of them depending on the “weight” that
each has with respect to the others. This multidimensional matricial analysis
method allows phenomenon interpretation and modeling of future events
occurring in predetermined conditions. It can also optimize decision-making
regarding environmental management on the basis of a maximum number of
factors, thus minimizing the possibility of subjective evaluations [10]. In this
paper, GIS ArcView 8.3 and the optional extensions ArcGIS Spatial Analyst
were employed for data analysis. This software has many typical functions of the
GIS environment, as map creation, data analysis and management. Map
calculator function was employed to generate informative layers regarding
quality indexes through the spatial distribution of point “values” assumed by the
single indicators. The results are made available in a graphic environment, ready
to be printed or to be employed for later processing, and in the alphanumerical
format for their analysis, to be used in reports, and save the simulated scenario
for later confrontation with other scenarios generated by parametric spatial
analysis simulations. The following tools were employed in order to determine
Desertification Sensible Areas:
1) Calabria Geological Map: scale 1:250.000 (Regional catchment
Authority);
2) CORINE Land-Cover: scale 1:100.000 (Italian Geological service) The surface area of the minimum mapped portion was 25 hectares,
corresponding in the reference map (scale 1:100.000), to a square with a
5 mm side or a circle with a 2,8 mm radius;
3) DTM (Digital Terrain Model): square grid with a 250 m side (Italian
Geological service).
4
Results and discussion
MEDALUS project methodology was applied to Calabria region. 41% of the
area has elevations lower than 300 m.s.l.m. and in the remaining 59% elevations
are higher. Mean regional altitude is 556 m.s.l.m. Plains are located near the
coasts. Figure 1 shows the map of vegetation quality, which is the synthesis of
WIT Transactions on Ecology and the Environment, Vol 81, © 2005 WIT Press
www.witpress.com, ISSN 1743-3541 (on-line)
52 Ecosystems and Sustainable Development V
the layers referring to fire risk, soil protection from erosion, drought resistance
and vegetable covering [4]; Calabria territory resulted to be divided into areas
with high (49,9%), moderate (18,4%) and low quality (31,7%). The best
conditions characterize Reggio Calabria province; in this area, forested areas and
perennial cultivations (olive groves) dominate, and they protect soil from
degradation thanks to their resistance to drought, erosion protection and
vegetable covering. The provinces of Catanzaro, Cosenza and Vibo Valentia
include a higher percentage of areas with stronger tendency to degradation,
though the values are less alarming than those reported for Crotone province.
Figure 1:
Figure 2:
Vegetation quality map in Calabria region [4].
Soil quality map in Calabria region [7].
WIT Transactions on Ecology and the Environment, Vol 81, © 2005 WIT Press
www.witpress.com, ISSN 1743-3541 (on-line)
Ecosystems and Sustainable Development V
Figure 3:
Figure 4:
53
Climate quality map in Calabria region.
Management quality map in Calabria region.
Figure 2 shows the soil quality map of Calabria region, which is a synthesis
of the layers relative to the indicators mother rock, soil depth and slope [7]. Soil
results to possess different characteristics estimated on the basis of the indicators
considered for the entire regional territory. Good quality soils, having a good
WIT Transactions on Ecology and the Environment, Vol 81, © 2005 WIT Press
www.witpress.com, ISSN 1743-3541 (on-line)
54 Ecosystems and Sustainable Development V
water content and a good resistance to erosion, are located in coastal plains, in
some portions of Crati valley where slopes are less than 6% and in most areas of
Crotone province. Soils that do not resist well to desertification process (low
quality) are located mainly in the Pollino massif.
Figure 3 shows climate quality map in Calabria region, which is a synthesis of
the layers regarding the indicators Thornthwaite climatic index, average annual
rainfall and slope exposition. A high climate quality characterizes 47 % of the
regional area, while in 2% of the areas, located mainly in the most southern part
of the region and in the higher Ionian area in Cosenza province, climate quality
is low. In these areas, the occurrences of both scarce rainfalls and high
evapotranspiration rates at the same time, significantly contribute to land
desertification.
Figure 5:
Map of sensible areas to desertification in Calabria region.
WIT Transactions on Ecology and the Environment, Vol 81, © 2005 WIT Press
www.witpress.com, ISSN 1743-3541 (on-line)
Ecosystems and Sustainable Development V
55
Figure 4 shows management quality map in Calabria region, which is a
synthesis of the layers regarding the indicators soil use intensity, land politics
and protection. In most regional areas, management quality is moderate. In
particular, almost the entire territory of Vibo Valentia province has a moderate
management quality, together with the territory of Reggio Calabria province.
Areas with a low management quality are concentrated in a few zones. The
theme final synthetic index (ESAI) is obtained by superimposing the theme of
quality indexes previously considered. By grouping the results, the
Desertification Sensible Areas map is obtained (Figure 5). The unaffected areas
in Calabria region is about 26%; in Catanzaro province about 37%, in Vibo
Valentia province about 24%, in Reggio Calabria province about 28%, in
Cosenza province about 20% and in Crotone province about 26%. Most regional
land, however, shows a “fragile” sensibility (41.5%). It should be considered that
in “fragile” sensible areas the balance among natural factors and/or human
activities is already particularly delicate. Finally, areas with “critical” sensibility
are about 10%. These results reflect land geomorphologic characteristics,
intensive and careless exploitation, and the presence of few forests, as well as the
peculiar pluviometric regime, with rainfall below the seasonal average. For each
area determined on the basis of the ESAs index, the quantitative contribution of
each quality index can be obtained. For example, in Albidona municipality, there
is an area classified as C3 (ESAs index of 1.57) whose contribution is given by a
moderate SQI (1.34), a low CQI (1.93), a low VQI (1.68) and a moderate MQI
(1.41). Thus, the most critical factors concern climatic conditions and vegetation
typology. In this way, intervention politics aiming at solving specific problems
peculiar to each area will be developed.
5
Conclusions
In Italy, Southern and insular regions, characterized by environmental stresses
(seasonal aridity, several drought events, short and heavy rainfalls, soil
erodibility, often unsustainable environmental pressures due to human activities)
are menaced by desertification. Water shortage causes unbalances, and
adaptation and mitigation measures should be adopted in order to prevent
degradation and desertification. As for soil quality index, it is not very detailed
because indicators concerning drainage and soil texture are not available due to
the delayed publication of the Calabria soil map. Because soil use intensity is
important, the indicators capable of representing management quality should be
integrated. New thermopluviometric data will increase the network of
measurement stations, they will support the analysis of temperature and rainfall
trends to forecast possible future projections. By introducing a parameter that
will consider fire probability, precious information concerning vegetation quality
would be available. As for management quality, great importance should be
given to environmental pressure and anthropic factors, fundamental elements in
determining Environmentally Sensible Areas (ESAs) to desertification. The
proposed methodology, based both on general and local knowledge of
environmental processes, would thus be very useful in intervention planning,
WIT Transactions on Ecology and the Environment, Vol 81, © 2005 WIT Press
www.witpress.com, ISSN 1743-3541 (on-line)
56 Ecosystems and Sustainable Development V
aiming at a rational management of the areas subjected to desertification and at
the recovery of the menaced ones. After the definition of risk areas, the
employment of Regional Indicators would undoubtedly allow planners to make
informed decisions.
References
[1]
[2]
[3]
[4]
[5]
[6]
[7]
[8]
[9]
[10]
Kosmas C., Kirkby M., Geeson N. Eds, The MEDALUS project Mediterranean Desertification And Land Use. Manual on key indicators
of desertification and mapping Environmentally Sensitive Areas to
desertification, 1999.
Agenzia Nazionale per la Protezione dell’Ambiente (ANPA) - Centro
Tematico Nazionale Suolo e Siti Contaminati, Sviluppo di indicatori per il
Suolo e i Siti Contaminati, Roma 2000.
Ministero dell’Ambiente, Comunicazione Nazionale per la Lotta alla
Siccità e alla Desertificazione, 1999.
Frega G., Piro P., Qualità della vegetazione e resistenza alla siccità:
applicazione relativa alla regione Calabria, Accademia Nazionale dei
Lincei, Giornata Mondiale dell’Acqua “LA SICCITA’ IN ITALIA”,
Roma Marzo 2003.
Kosmas C., Ferrara A., Briassouli H., Imeson I., Methodology for
mapping ESAs to desertification, In The MEDALUS project Mediterranean Desertification And Land USe. Manual on key indicators
of desertification and mapping Environmentally Sensitive Areas to
desertification. Edited by: Kosmas C., Kirkby M., Geeson N.: EUR
18882, pp. 31-47, 1999.
Frega G., Piro P., Sulla procedura di identificazione delle Aree Sensibili
alla Desertificazione (ESAs): il progetto MEDALUS (Mediterranean
desertification and land use della UE (European Union), Memorie e Studi
n° 353, Dipartimento di Difesa del Suolo, Università della Calabria,
Dicembre 2000.
Piro P., Frega F., Mangiardi R., Identificazione delle Aree Sensibili alla
Desertificazione e applicazione alla regione Calabria, 24° corso di
aggiornamento in Tecniche per la difesa dall’inquinamento, Guardia
Piemontese Terme (CS) Giugno 2003.
Moisello U., Idrologia tecnica, La Gogliardica Pavarese s.r.l, 1998.
Thornthwaite C. W., An approach toward a rational classification of
climate, Geograph. Rev., vol.38, 1948.
Burrough P. A., Principles of Geographical Information Systems for land
resources assessment, Clarendon Press, Oxford, 1986.
WIT Transactions on Ecology and the Environment, Vol 81, © 2005 WIT Press
www.witpress.com, ISSN 1743-3541 (on-line)
© Copyright 2026 Paperzz