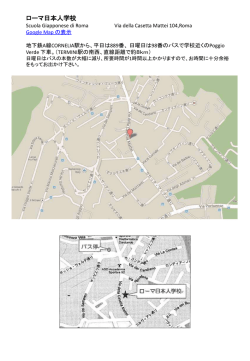
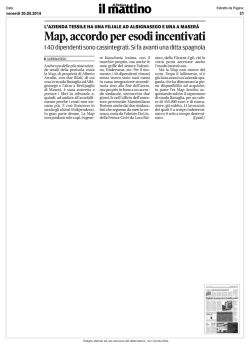
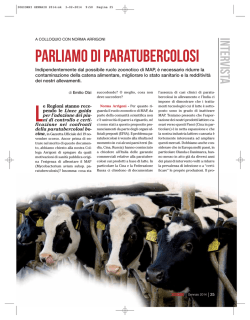
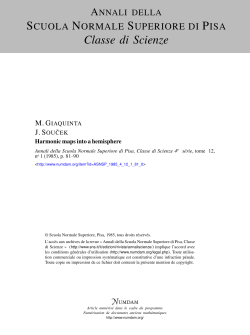
Title
“Perspectives” on the 3-D analysis through the cadastral map series (XVIII – XX sec.) and the first geodetic large
scale map of Milan realized by the ‘Astronomi di Brera’ (Astronomers of Brera): toward an advanced portal
Authors
C. Monti (*), C. Achille (*), R. Brumana (*), S. Musumeci (**), D. Oreni (*), M. Signori (***),
(*) Politecnico di Milano – DIIAR , (**) Agenzia del Territorio, Direzione Regionale Lombardia, (***) Archivio di Stato di
Milano, Italy
Abstact
Archivio di Stato di Milano (the State Archive of Milan) has begun the digital archive process of historical cadastral maps
few year ago, considered as the first step to support their on-line publications. The portal project ‘Atlas of historical
cadastral maps’ was made upon a collaboration between Politecnico di Milano -DIIAR (leader), the two principal owners of
the cadastral heritage, Archivio di Stato and Agenzia del Territorio – Direzione Regionale (the Agency of Territory –
Regional Direction) and Regione Lombardia – Giunta Regionale Presidenza, Patrimonio e Sistema Informativo (Lombardy
Region), for the indication activities and those of decentralization of the territory. The main aim was to put together
cataloguing approach and to guarantee the spread online presentation and diffusion of the geo-iconographic historical
contents in a detailed territorial dimension.
Considering that only for the regional area of Lombardy – interested by the project – there is an extraordinarily huge
patrimony, constituted by thousands of sheet units, belonging to different documentaries series, produced during different
periods by the cadastral offices devoted to the cadastral generation and conservation. The map documentation, nowadays
conserved in the different Archivio di Stato offices decentred within the provinces of the Lombardy region, is statistically
the most essential for consulting purposes, correspondent to a wide and variegate research spectrum.
To have an idea of the regional coverage, the current cadastre and its plant (Impianto al vigente catasto, 1937-1958) - owned
and conserved by Agenzia del Territorio - is made by about 70.000 sheet for each layer. The Atlas aims to provide for
users an agile and intuitive access instruments to the historical cadastres and maps, navigating on currently available maps at
different scales (i.e. the technical regional map 1:10000,or the IGM Military Geographic Institute) the territory of yesterday
refereed to administrative boundaries losing correspondence with the nowadays territorial municipalities. A bond with the
actual map can be well constituted by the first cartographic representation at the topographic scale of the Lombard territory
anchored at a geodetic reference system: La mappa degli Astronomi di Brera (The map of Astronomi of Brera) and the ITM
R LV, adopting an articulated semantics for the anthropic thematic issues of the territorial political-administrative
boundaries. The Atlas in a multidisiplinary access networking approach, will be aligned to the international standard for the
historic cartography (ISAD, EAD), and to the EU standard for geographic map sharing (INSPIRE); at the same time, being
the maps historic geo-iconographic documents, they have to be compared to historic descriptive standard (AACR2_CM;
ICCD for Italy).
1. Archivio di Stato di Milano and the portal project ‘The Atl@s of historical cadastral and topographic maps’:
towards the geo-iconographic historical content of a detailed territorial dimension
The Archivio di Stato di Milano aims at publishing in a dedicated WebGIS their digital images of maps series surveyed by
government land offices during different surveys done along eighteenth and nineteenth century for all territories of
Lombardy region1. The goal of this project is to design a metadata-driven and dynamic access tool that will enable users to
access scanned and partially geo-referenced map images by querying an easy to use digital gazetteer (a geographical
dictionary or directory, an important reference for information about places and their toponomy), to offer qualified access
services to public administrations, professional users and researchers.
The paper will investigate the digital access methods and the cataloguing approach required to integrate digital gazetteers,
standard metadata for archival description and authority file relating the double nature of cadastral maps, which are
geometrical scaled drawings produced by technical corps with geographical content referred to specific locations or
jurisdictions, and, at the same time, authenticated documents belonging to archival set of fonds and series produced in a
bureaucratic context, linked to other documentary series like land-property registers produced by land-offices.
The comparison with coeval topographic maps based on geodetic survey covering the same territories, allows to produce
gazetteers regarding settlements, administrative boundaries, hydrographical elements. One of the goals would be the
reconstruction of boundaries variations along the period for the whole area covered.
For this aim, the series of maps must be “geo-referenced” to create a continuous layer and digital gazetteer for locating
place-names on the map images, in order to relate different chronological maps series. The gazetteer will include both
current and historic names referenced to the same geographic location. An Internet Map Server will index the metadata and
provide interfaces to the imagery, zooming to the queried place. The interface brings the appropriate images from more sets
1
Among the maps used there are those ones with geodetic orientation (carta Astronomi, cessato Catasto, impianto al vigente) and also the ones that lack of
these information(catasto teresiano): in both cases, however, the maps used are in scale (1:2000 – 1:1000) and therefore gereferable using numerous
homologous points of the Gauss-Boaga reference system on the presently used cartography and its plant of 1937, the last historical cadastral threshold
obtained planimetricaly from the previous cadastre.
Atl@nte dei Catasti.
Above left: visualization in
ArcIms of
georeferred
maps.
Above
right:
‘Carta
topografica del Milanese e
del Mantovano basata sulle
misure effettuate dagli
astronomi di Brera fra il
1788
e
il
1791’
(Topographical map of
areas of
Milano and
Mantova based on the
measurements of Brera
astronomers
1788-1791)
Left: web page of Villa
Reale
of
Monza.
Visualization of Carta
d’Italia IGM
Above: The layout of the Milano city walls and internal channels, done by F.B.Ferrari; Carta idrografica di milano (The hydrographic
map of Milan) 1866; The map of Milan, Lafrery 1573.
Bellow: Rectified image of Milan in scale 1:1000; The georeferenced map of Lafrery; San Marco area, a detail of the map of Lafrery.
of different period maps, classified by map dates and place-names. The project will also investigate image compression
formats to build WebGIS application, beginning from the scanned modern format JPG2000.
2. A key role within the ‘Atlas2’: the map of the ‘Astronomi di Brera’ (1807) at the scale 1:1000
In the year 1806, during Napoleonic period, with a dispatch of 1st of April, upon the appeal of the Generale Brossiers, in the
frame of the extension of the ‘Lombardo-Veneto’ to the whole Kingdome of Italy, the astronomers of Brera (De Cesaris
Giovanni Angelo, 1749-1832, Reggio Guido Francesco, 1745-1804, Oriani Barnaba,1752-1832) deliver the original
observations: the elements of the reductions (contraction), the results of the first triangles derived from the measurement of
the ‘Grande Base di Somma Lombardo’ (Great Base of Somma Lombardo) - 1788. They answer to the claim with a
technical relation, useful to understand the following description of the map at the scale 1:1000 produced a year later (1789)
and comparison with the most recent 1:1000 map of the city of Milan (2005).
They answer explaining that the measurement of the base (10km) has been made through forward and backward measures:
to each determined value there have been applied the corrections due to the calibration of the double ‘tese’ applied in the
survey campaign, due to the temperature and due to the reduction to the horizon, referred to the starting point of the base.
The mean of the two length measures obtained, has been reduced to the sea level, in order to gain the geodetic length
between the two extreme points. The difference between forward and backward measures results to be 0.02327 ’tese’3 (less
than 5cm on 10km). The initial development has been built on the construction of the two triangles between Nossate
(extreme south of the Base), Mezzana (extreme North) and the city of Busto, using the tower bells of the cathedrals.
For each vertex, the azimuth observation reading 44 time the same direction inside different circus areas, by using 4 ‘noni’
has been made. For each vertex, the zenith distances has been measured for each collimated direction. The stations of
Somma and of Busto are off-centre: this aspect has been taken into account. The triangle resolution has been created in a
geodetic field considering the spherical excess. The closing error of triangles resulted to be +0",14 and -0",53.
From the new Base Busto-Somma, obtained developing the ones directly measured, the whole series of triangles with spread
vertexes in the Lombardo-Veneto territory has derived, among which the city of Milan (Brera’s Observatory, Dome). From
these vertexes the minor triangles were propagated in order to transfer these new points even over the praetorian tables, in
order to build up the most feasible verification of the consequent detail surveyed operations.
Within this operative frame the production of the map of Milan at the scale 1:1000 of 1807 has to be considered. On the 9th
of January 1807 (Arch.d’Uff., n. 499, f. 56) “… S.A.I. the Prince Vice King (Eugenio Beauharnais, 1781-1824) approved
assisting the survey of the plan of Milan: the duty of being disposal for the survey and progressively informing the
Government, was assigned to the astronomers of Brera. The goal was to create the New Urban Plan of Milan.
Here is how the map of Milan of Astronomi di Brera was born. This map, organized in nine coloured sheets, has a great
accuracy and it is rich in details, showing even the inside plan of the most important churches and the courtyards. With a
great certainty, it has been referred to the vertexes of the ‘minor triangles’, with distributed measurements of angular
directions and direct measurements with long-meters. The topographer Pinchetti was busy being involved in guidance of
‘young geometers’, under the direction of the Astronomers, in the detailed survey operations. He is also the author of the
Carta Topografica di Milano of 1801 (Topographic Plan of Milan), currently conserved at the Biblioteca Trivulziana
(Trivulziana Library) of Milan, and many others following ones. The accuracy of the Map of the Astronomi di Berera at the
scale 1:1000 is significant both under the semantic aspects and under the quantitative ones.
Georeferencing process. First of all the Map of Astronomi di Brera has been georeferenced4 to the map of Milan of 2005,
that during the metric test had an uncertainty in the position of the controlled point largely contained within the graphic error
(0,2mm - corresponding to 20cm at the scale 1:1000). The georeferentiation of two sample sheet (8 and 9) of the
astronomers’ map, for about 100 points used for each sheet georeferencing, has shown, as a mean value, differences on the
vector coming from the pair of homologous points, respectively of 1,08m and 1,59m.
These values can appear significant for a map at this scale, but they are actually more than justified for the following
reasons:
1- the map has undergone certain anisotropic deformations during the 200 years of its life, different events and the
conservation methods and restoration techniques adopted
2- The precision of the vertexes of the ‘minor triangles’ can be estimated, in an analogue way to the post-unitary
cartography, variable between 0,5m and 1 m.
2
The origin of the word ‘Atlas’ derives from the work title “Atlas sive cosmographicae meditationes de fabbrica mundi et fabbrica figura” by Gerard
Mercator, where the choice of the title that uses the word ‘Atlas’, as explained from the author himself, is not refereed to the mythological figure of Atlas
with the world on the shoulder (a figure often used as logo on successively made atlases), but to mythical Atlas in person, who was a great astronomer and
cosmographer during the period of the ancient Greece . It was the first work named Atlas, obtaining an immediate huge commercial success.
3
The ‘tesa’ is a Unit of Measure, whose value is equivalent to 6 feet = 1,949036331m; 1 feet =12 inches =0,32484m; 1 inch = 12lines =0,02707 (1 line of
the Foot of Paris =0,002256m). The scale of the map of ‘Lombardo Veneto’ made by the Astronomer is the same of the ‘Map of France’made by 182
sheets (1:86400), known as ‘of Cassini or Academy’, appeared little before the Revolution, begun by César-Francois Cassini di Thury with Lacaille on
1744 under the Luigi XV (1710-1744), the first map with a geodetic placement network. The origin of this particular scale derives from the fact that one
inch (‘pollice’) on the map correspond to 1200 ‘tese’ on the terrain (6x12x1200=86400).
4
For the georeferencing methodology, see at the ACHILLE C., BRUMANA R., PRANDI F., ORENI D. (2005). From the guide of georeferencing cultural
heritage for the map of risk (Regione Lombardia) to the georeferencing and troubleshooting in historical sites", ISPRS Int. Arch., and CIPA Archives, ISSN
1682 1750, XXXVI-5/C34 and XX-2005 (CIPA), 707- 712.
3- In 1844, by request of the Municipality, there has been done a map at a large scale by Stambucchi, the student of
the Observatory of Brera, and it was tested by the astronomers of Brera (with director Carlini Francesco, 17831862) for angular directions between visible points (such as tower bells) from the Specola of the Observatory and
the cartographic directions results were contained within 20’ (fig.2): the consequently generated errors were of
about few meters in positioning, considering that the points taken into account are contained within the Spanish
walls. The error values are clearly greater in comparison to the ones of the map done 40 years before, done by the
astronomers of Brera.
Finally we can conclude that, within the whole scientific and cartographic work carried on by the Brera’s astronomers at
the turn of the XIX century, the excellence has been the common standard both in the astronomic field and in the
cartographic one: the discovered map 1:1000 of the 1807 is an extraordinary and unique example.
Fig. 1. The sampled sheet n. 8 and 9 of the Map at the scale 1:1000 of the Astronomers of Brera, used for the accuracy test compared to
the actual map at the scale 1:1000. The homologous points selected for georeferencing the two map (actual and historic ones) are
evidenced in black.
Fig. 2. On the left, the test-measurement of the Stambucchi’s Map (1844) signed up by Carlini, head
of the Observatory of Brera. In the first column are quoted obtained the values deduced ‘sulla
Carta’( from the Map); in the second one the values directly obtained, observed by the ‘Specola’,
‘Osservati dalla Specola’. Note that 20’ corresponding to about 6m at a distance of 1km. Using the
table, it is possible to derive that the mean of the error is equivalent to zero (0), due to the casual
distribution of the error, but the absolute values show planimetrical differences even of about 10m.
Fig. 3. Georeferencing process. Above: the Sheet number 8 of the Map of Milan made by the ‘ Astronomi di Brera’. It has been
georeferenced to the actual map of the city of Milan at the scale 1:1000 using the homologous points. There have been identified about
100 points (related one to the other on the Attribute Table within the ArcInfo homographic tool used to georeference the Astronomi’s map
to the actual technical map and to the actual cadastral sheet). At the end of the process, the raster map is resampled along the East axes
generating a world file with the parameter of the de-generated affine transformation (different rotation and shift values at the end of the
georeferencing process, were reduced to zero at the end of the resampling process in order to allow the access to the standard geographic
inserting tool provided by gis an web gis)
3. Navigating the territory through the third dimension of the past
Each historical map of the selected sample has been georefered to the actual technical map of the City of Milan. The
opportunities created by publishing on a portal such historical information related to the geographic actual context are
evident and vast. Historians, professionals, specialists could compare the different cartographic layers one to another, and
make analysis and valuations regarding the transformations of the territorial texture: in this case there have been selected
some topics on which to develop the process of analyzing mutations and permanencies. The sample considered is the
sector ‘Corpi Santi’ with the vertex in the church of S. Marcus once facing the intersection of the two axes of the canals,
closed during the 1930’s5. The most relevant object coming from this analysis has been managed inside GIS system to be
published in future within the portal itself (Figg.3-5).
1.
WATER. The Water Channel network (Navigli) , built up to connect the hydrographic network of the rivers on the
North of Lombardy ( Lambro , Molgora ecc.) with the external channel ‘Martesana’ and the urban one.
2.
BUILDING aggregation (Churches, Monasteries, Convents, Civil Buildings, Military buildings): the history of the
progressive saturation of city blocks.
3.
ROAD SYSTEM: streets, gate connection system across the canals and around the city blocks, the principle doors
across the defence city walls.
In order to improve map reading of the transformation process of the city in its most significant and relevant topics, a 3D
model has been built up from the ground using Digital Terrain Model generated on the actual map, choosing the current
building heights : it is obviously possible to modify them
associating different heights in function of the different studies
Georeferenced map level
and hypothesis by managing the attribute table database.
A. Historical Cadastral level (1:2000)
For this purpose the implementation within the portal of
1. Catasto Teresiano (XVIII sec.), without topographic
(geodetic) placement
functions and tools will be a priority in order to support
2. Catasto Lombardo Veneto (1866-67), the first
interpretation by every subject (user) through the developing
cadastral map with topographic placement
of a remote active user interaction interface6, such as:
3.
Cessato Catasto (1902)
- personalized object digitizing and 2D/3D extraction;
4. Impianto al Vigente (1937-1958)
- volume generation by height association;.
B. Topographic map level
- different rasterized layer comparison;
1.” Città di Milano” Carta degli astronomi di Brera, 1807
- local downloading of manageable format exchange data
(1:1000)
(shp, georefered map - tfw) within professional and common
2. Carta topografica del milanese e del Mantovano basata
software (such as CAD, 3DS, GIS)
sulle misure effettuate dagli Astronomi di Brera fra il 1788 e il
1791 (1:86400)
C. Referrement map system for the georeferentiation of
4. 3D perspectives
historical level
The research is focusing on the 3-D processing of historical
1. Catasto Vigente (Vigent Cadastral map level)
documents characterized by three dimensional contents (such
1:2000
as photos and perspective-axonometric views, which do not
2. Technical Map of the City of Milan (1:1000)
allow direct georeferencing procedures) using the metric
historical map as a gateway to the interpretation and
“La Grà Città di Milano” Lafréry 1573 (Pianta della Città di
decryption of non metric views and applying photogrammetric
Milano), the perspective map of the city of Milan
algorithms within internally developed software by the
research group of DIAR lab7 currently in progress.
The research takes place on the contribution of important studies carried out by important historic specialist8 on the possible
approach to decode non metric hybrid 3-d views map with rigorous metric approach mixed to semantic contents. In fact for
this map is not possible to apply ‘ isotropic global transformation’ (perhaps from perspective to orthogonal projection), as it
is evident due to different aspects and reasons connected to the history of the maps themselves: they are characterized by
emphasis on some principle monuments to be politically represented, multiple points of view“. This celebrative intentions
have generated the ‘bird flight map’, urban profiles, axonometric views.
5
Milan’s Navigli are artificial canals constructed between 1179 (NaviglioGrande) and sixteenth century (Naviglio Martesana), to allow the arrival to the
city from Ticino and Adda. In Milan there were two internal water circles: the first Roman Moat that flowed along the external side of the Walls, fed on the
north by the river Seveso, to flow into Vettabbia between Porta Ludovica and Porta Ticinese; the outer water circle, built in 1387, represented the defence
moat out of Spanish Wall, used for the transportation of marble from Condoglia (Maggiore Lake) to the Duomo. Connected to the Naviglio Martesana
around 1497, the outer circle maintained its function of passing the waters between Ticino and Adda until the 30’s of the twentieth century, when it was
fully covered. Today, the urban part of the waterway of Martesana, covered in the60’s until Cassina dè Pomm, flows in Milan into Seveso.
6
Cfr. BRUMANA R., PRANDI F. (2005). E-historical Site. Documentation and Protecting Sharing 3D geodbase, in ‘The e-volution of Information
Communication Technology in Cultural Heritage’, eds. M. Ioannides, D. Arnold, F. Niccolucci, K. Mania, Budapest ARCHAEOLINGUA, ISBN-10:963
8046 75, pp. 293-300
BRUMANA, R., MONTI, C., ACHILLE, C., FREGONESE,L., SAVI, C., (1999). Agile Services Distribution: Architectures to support Web GIS, WS
“Dynamic and Multi-Dimensional GIS (DMGIS)” in ISPRS Int. Arch., Vol 32-4W12, Beijing, China, pp. 233- 242
7
http://rilev5.topo.polimi.it/elab, Elab3DPOLI, Laboratori of Photogrammetry, Survey, Cartography, GIS POLIMI–DIIAR
8
DE SETA C. (1996), Città d’Europa. Iconografia e vedutismo dal XV al XVIII secolo, Electa, Napoli, 1996, pp.183-189
Teresian Calastre Level 2-D 3-D
Astronomi’s Topographic Map Level 2-D 3-D
Permanencies and mutations
on the sample area of San
Marco (Porta Nuova).
From the upper left: views of
the actual map of the
buildings and of the Navigli
network coming from
digitalization of the
georeferred Teresian
Cadastre (2D and 3D view)
In grey the volumes of the
today present buildings,
from the Technical City Map
1:1000.
In yellow (buildings) and
dark blue (channel)
theelements of Teresian
map.
From the upper right:
On the purple level the
permamences on the
Topographic map of
Astronomi di Brera. On the
cyan level the variation
comparing to the Teresian
channel (dark blue) is
represented. The enlargement
of the channel can be seen.
On the bottom side:
The green level concerns the
current cadastral map and to
the plant to the current
cadastre, with the progressive
saturation of the city blocks.
The ‘Lombardo Veneto’ cadastral Level 2D, 3D
Teresian and Astronomi’s level on
the Actual Map Level 3-D
The State of Art Cadastral Level used ad
gate to the ‘Impianto al Vigente’ and to the
historical cadastral levels
The canals network at the correspondence of the node in S. Marco square. The sequence of three georefered historical cadastral series
and the topographic maps: Catasto Teresiano, Carta degli Astronomi; Catasto Lombardo Veneto, Technical Map of Milan (2004).
Left: an ancient painting of
the area in front of the church
of San Marco (end of 19th
century). The intersection
between Naviglio Martesana
and internal water circle can
be seen.
Center: overlapping between
the georeferenced 3D Carta
degli Astronomi di Brera and
the painting.
Above: planimetric evolution of the city block included between the church of San Marco and the city door of Porta Nuova: the
permanence and the transformations of the built up environment at different historic thresholds considered can be seen.
Below: the anisotrpic deformations of the representation used in 16th century can be easily noticed from the comparison between the
georeferenced historical map and the Lafrery’s three-dimensional map. However, the permanent elements are easily recognizable, in
particular near the streets tracks.
The first result obtained from the photogrammetric processing of the historic photo on the 3D city model: the 3D transformation of the
2D image to the 3D image. The profile of the channel has been integrated on the 3D model in order to reconstruct the perception of the
place with surrounding buildings, gate and at different chronological sequences:
- the building evidenced with the dotted elliptical line is one of the permanencies of the place coming from the Teresian level
registered on the map of Astronomi di Brera;
- the dotted polygon represents the progressive saturation block evidenced in the previous illustrations along the different historical
sequences.
Metric result and anisotropic error within the global bundle adjustment:
- the photogrammetric transformation of the portion evidenced by the ellipse is more precise due to the relevant number of
homologous point on the ground level to fix the global bundle used for all the photo transformation;
- the polygon puts in evidence the transformation error (on the parallel skirt roof): there are not enough homologous point number; it is
required to implement within the software with external orientation tool so as to allow the insertion of measured points.
Fig. 4 The step of the internally developed software in order to support the photogrammetric projection of the historic photo on the 3Dmodel extracted from the correspondent chronological map (in this case the Lombardo Veneto cadastral level). For the future there will be
implemented a tool to relate the homologous point with ground point coming from laser scanner measurements, or topographic point, in
order to remove the noise derived from not well fixed points at the ground level (point not visible on the photo, to be integrated by new
points on the facades at the correspondence of the different floors so as to improve the result).
In the beginning basic projection algorithm of DLT has been developing the bundle adjustment tool and co-linearity constrain for internal
and external orientation and parameter estimation.
The internally developed MIMO9 software developed in C++ with supporting OpenGL and DirectX (for visualizing), will allow to
compare results coming from different photogrammetric algorithms known in literature and today in use known in literature, with
unconventional ones, in order to support management of digital shot acquired in the past with an oblique direction. The volume
reconstruction of the 3D scene need to be improved respect the simplified one built up on the technical map of the city (1:1000), in order
to support the photogrammetric projection as a texturized rigorous model. For this aim it would be useful to test the results obtained by
importing more detailed and refined models coming from different data source (laser scanner, TIN, NURBS approximated to the precision
requested mesh) and 3D format modern standards, developing Level of Detail representation (LOD) applied to the surface (mesh
pyramid).
5. Conclusive considerations
Nowadays it is possible to have a web-portal that enables the consultation of cartographic information georefered to different
historic periods, the elaboration of diachronized and synchronized cognitive processes regarding the use and the
transformations of the built environment over time. The opportunity of this virtual space is an important support to the
analysis of the past transformations and the management of the future interventions in different parts of the historic city. An
instrument conceived in this way could be an auxiliary tool to the traditional techniques for the of the built environment
analysis, aiming at the preservation and conservation of the environment heritage: the basic cartography, the historic one and
evidences collected in situ, using the stratigraphic permanence reading, could be cross-related, interrogated and available to
all technicians that work, at different levels, in the context of the built environment (ex. it is possible to work in local
systems using mapping functions on the georefered maps), in order to guaranty city transformations that would be more
respectful towards the historic tracks and complexes, still recognizable within the urban structure.
This does not mean that the georeferencing process is the final goal as far as the knowledge of the stratifications and
historical transformations is concerned. It offers an important auxiliary tool for the analysis prior to any intervention,
defining possible places of particular attention to be verified during site visits or excavations. It is also indisputable how the
9
Cfr. Elab3DPOLI with the contribution of informatics competences (Ing. Parri) and photogrammetric one (Ing. Fassi and Ing. Prandi).
overlapping of different cartographic layers, in some cases apparently difficult to compare (the Plan of Milan done by
Lafrery), could allow to identify entities that would open new research prospective.
This was the case of the georeferencing procedure of the Lafrery’s three-dimensional map, done in planimetric prospective
but with the third dimension very similar to an axonometric representation (the prospective point of view is at infinity):
although it is an anisotropic map with a representation technique that favours some important urban elements (churches,
Sforzesco Castle), and thus deforms some parts of the city, it is however possible to identify easily recognisable permanent
elements (streets, water flow, lot shape ect). The current research should therefore concern the development of algorithms
that would transform the map (geo-morfing-warping), using not so much the homologous points of the single buildings but
the global dimensions of the urban structure drawn from already georefered tracks.
Fig. 5 Geomorfing of buildings represented within catasto Teresiano (3D symbolic representation) on gerefered Lafrery’s map of Milan
This aspect opens up some parallel research activities, currently in development, on the complex problem on the
transformation of the historic views of the digital three-dimensional cartography, implementing the correlation algorithm three-dimensional prospective georeferencing among the internally developed software MiMO.
References
ACHILLE C., BRUMANA R., ORENI D., PRANDI F. (2006). Georeferencing as availability of space-temporal data: from the historical
cartography to the 3D view e-PERIMETRON, The international quarterly e-journal on sciences and technologies affined to history of
cartography and maps, et ISPRS International Archives ICC Digital Approaches to Cartography Heritage, ISBN960-7999-18-5
Thessaloniki (GR), 4, 184-202
BRUMANA R., FASSI F., PRANDI F. (2006). Definition of the 3D content and geometric level of congruence of numeric cartography,
Innovations in 3D GeoInformation System. Lecture notes in Geoinformation and Cartography, Springer LNG&C Berlin, Germany, 185194b
BRUMANA R., ACHILLE C., PRANDI F., ORENI D. (2006). 3D Data model for representing an historical Centre Site UDMS'06 25T h
Urban Data Management Symposium UDMS Aalborg, Denmark 1-8 9 Part IV
BRUMANA R., PRANDI F. (2005). Structuring 3D numeric cartography in GML3, ISPRS Int. Arch.&CIPA Archives for Documentation
of Cultural Heritage, ISSN 1682 1750, XXXVI-5/C34 and XX-2005 (CIPA), 713-717
BODUM L.,KJEMS E., JAEGLY M. and KOLAR J. 2006. Focus For 3d City Models Should Be On Interoperability; Not Verisimilarity!
UDMS 2006, Aalborg
GRUEN, A., STEIDLER, F, WANG, X. 2002. Generation and visualization of 3D-city and facility models using CyberCity Modeler.
MapAsia 2002, Bangkok, August 2002
© Copyright 2026 Paperzz