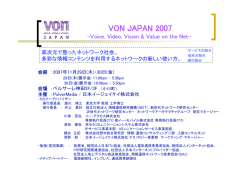
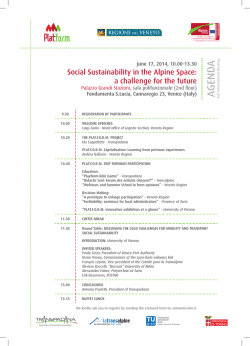
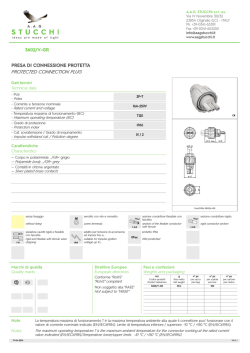
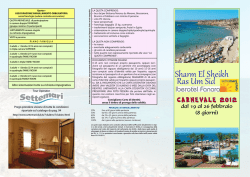
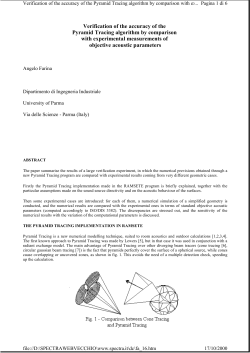
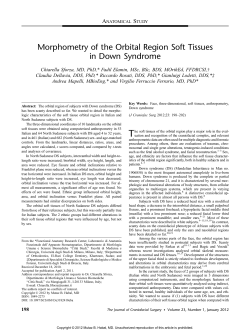
AIA-DAGA 2013 Merano Room Impulse Response Measurements in Ten Churches of Rome: Hörsamkeit, Intelligibility and Possible Suitable Positions for Performances of Church Music Klaus-H. Lorenz-Kierakiewitz 1, Prof. em. Dr. Jobst Fricke2 1 Peutz Consult GmbH, D-40599 Düsseldorf, Germany, E-Mail: [email protected]; 2 Universität zu Köln, Abteilung Systematische Musikwissenschaft, D-50939 Köln, Germany, Email: [email protected] Abstract and Introduction In Autumn 1976 the rare occasion was given to one of the authors by invitation of the German Historical Institute in Rome to record room impulse responses together with the Tonmeister Dr. Wolfgang Voigt at several positions in ten (unseated) churches of Rome, among them Lateran Church, St. Peter’s and Sistine Chapel [1,2]. At that time measurements were still recorded on analogue tape. After first evaluations in 1995 now a careful new digitalisation was performed in order to extract the room acoustical parameter values of Hörsamkeit and intelligibility (reverberation time, EDT, clarity, reflection structure, echodegree, indicators of speech intelligibility) using a state-ofthe-art evaluation program. In the detailed examination it was investigated, how far the room acoustical properties enable an adequate Hörsamkeit and appropriateness for performances of church music. The examined locations, applied procedures, performance, evaluation and results of the measurements are documented here. As result, Hörsamkeit and intelligibility of the measured churches are evaluated and the question is discussed, at which places a positioning of the musicians would be in nowadays terms disadvantageous especially for polyphonic musical structures, and which one advantageous – albeit in historical practice in case of doubt music was made, where liturgy and ceremonial dictated positions [5]. Table 1 gives an overview over the names, measurement dates and basic data of the ten churches (italic letter types in the tables indicate estimated data, with the presumption of ca. two persons per square meter). Figure 1 shows the ground plans of the ten churches (not in the same scales) including measuring paths and positions [2-4, 6-12]. 01 02 03 04 05 06 07 08 09 10 The Ten Churches of Rome Measured Official Name 01 Oratorio dei Filippini 02 Basilica di San Lorenzo in Damaso 03 Chiesa di Sant' Ignazio di Loyola in Campo Marzio 04 Basilica di Santa Maria in Trastevere 05 Basilica di San Pietro in Vaticano 06 Basilica di Santa Maria Maggiore 07 Oratorio S. Marcello (Crocifisso) 08 Chiesa di San Luigi dei Franchesi 09 Cappella Sistina 10 Basilica di San Giovanni in Laterano measured Paths Area [m2] V [m3] V/N [m3/pp] 27.09.76 20 320 4.600 7 28.09.76 10 1100 13.500 6 28.09.76 14 3400 58.500 9 29.09.76 14 950 11.500 6 29.09.76 14 15150 750.000 25 30.09.76 12 2100 30.500 7 30.09.76 06 300 3.000 5 30.09.76 15 1100 14.500 7 01.10.76 16 540 10.500 10 01.10.76 12 5750 119.00 0 10 Figure 1: Ground Plans of the 10 Churches with RIR-positions Table 1: Names and Basic Data of the 10 Churches measured 2079 AIA-DAGA 2013 Merano Motivation In 1976, Prof. Dr. J. P. Fricke and Tonmeister W. Voigt (University of Cologne) a once-in-a-life chance was given: invited by F. Lippmann from the German Historical Institute Rome, they were allowed to measure the acoustics of 10 Churches in Rome, among them S. Pietro in Vaticano, Cappella Sistina, S. Giovanni in Laterano and S. Maria Maggiore, to reveal, were polyphonic music practice was possible in terms of ”Hörsamkeit” - nowadays understanding of room acoustics and musical practice, i.e. measurement paths without severe echoes, and where detrimental echoes would have been able to disturb polyphonic music practice. Room Impulse Response Measurements Thus, state-of-the-art (1976) room impulse response measurements were performed in the ten churches given in table 1 in unseated state using transient impulses firing a signal pistol (9mm/6mm). As receivers served two omnidirectional pressure condenser-microphones (Sennheiser MKH104), which recorded the room responses to the impulses at different positions directly onto analogue 1/4“ tape using a Revox A77 @ 38 cm/s (15“/s) with internal microphone preamplifiers. Three to ten impulses were generated per church, resulting in six to twenty different measurement paths, depending on the geometry examined. Tape-to-Disc-Transfers, Accuracy versions of ten room impulse responses. The results are presented in terms of an average and a maximum value of the standard deviation of the parameter values in table 2. The resulting standard deviations can be judged as good accuracy for this method of tape-to-disc-transfer/ADC of the analogue recorded impulse responses. Parameter ALcons C50/80 D50 STI [%] [dB] [%] Average 1,3 0,01 0,2 01 Std.dev Maximum 3,6 0,03 0,3 02 Std.dev 1991: Revox A77 (the original)digital osc. Tektronix 1993: Revox A77 (the original) DAT (10 RIR); 1995: Revox A77 Atari ST 1995 (print-outs); 2012: 2 coupled Revox A77 HDD (varying speed); 2013a: Telefunken M10 HDD (thanks to A. Esper); 2013b: Telefunken M15A CDR (thanks to Uli Apel). Ek(t) 06 0,01 0,2 0,1 11 0,05 0,6 0,2 EDT T30 [s] [s] Table 2: Evaluation accuracy for the different parameter values Parameter Evaluation RIR From the measured room impulse responses, for every measurement path, Hörsamkeit and intelligibility of the measured churches are evaluated by means of a set of acoustical parameters. With help of a special computer script the acoustical parameters T30 (reverberation time), EDT (Early Decay Time), TCenter, C50 and C80 (Clarity), D50 (Deutlichkeit) were calculated for eight octave bands and the values of the (Mid) octave bands with centre-frequencies from 500 to 2000 Hz were averaged per path. Additionally, the parameter values for STI and ALcons (STI, P88 (1)) were calculated per path, and all measurement path values were spatially averaged resulting in spatial averages per church. In order to be able to evaluate the room impulse responses in the digital domain, in the last 20 years several attempts of the tape-to-disc-transfer were performed: 1. 2. 3. 4. 5. 6. Tc [ms] LSend LNoise 10 0 ,1 LRe v LDir lg T1, 3 kHz 0 , 009 35 ALcons , P 88 3 100 10 [%] (1) Evaluated Acoustical Parameter Values In 1.-3., the key questions were, if A/D-conversion is reproducible enough, and if there are echoic reflections visible. Some RIRs were analysed with delays of strong reflections (print-outs). Result: the RIR-transfer from analogue to digital domain was reproducible to a certain degree with minor differences in digitisation, and: there were echoic reflections visible, but some details had to wait until 4.-6. The key questions now, after 18 years collecting experience with room impulse response analysis, turned out to be: a) How critical is exact tape speed reproduction, and b) how severe are the echoic reflections in terms of Hörsamkeit? To answer question a), three more tape-to-disctransfers were performed (4.-6.), the latter two with professional and well-aligned 38 cm/s tape machines. The last one offered exceptional quality reproduction of the analogue original tapes resulting in a signal-to-noise ratios of 67 dB (left) / 54 dB (right channel). In order to be able to give a uncertainty range for the values of the evaluated room-acoustical parameters from tape-to-disc-transfer 6., four different “realizations” (i.e. tape-to-disc-transfers and digitisations) were evaluated statistically by calculating the standard deviations per parameter out of the four different The evaluation results for the spatial averages per church are shown in table 3 and allow to categorize the churches by values of the indicators of intelligibility (volume, RT, C80) into three groups: (small/intelligible – medium – large/ reverberant). In the group with the largest rooms, most echoes occur, as will be revealed in the following section. Parameter ALcons C50 C80 D50 Tc T30 STI [dB] [dB] [%] [ms] [s] Averages P88[%] Chapel SGIL O. F. Neri O. San Marcello S. Luigi dei Franc. S. Maria Trastevere S.Lorenzo in Damaso S. Maria Maggiore S.G. in Laterano Cappella Sistina Sant’ Ignazio San Pietro i.Vaticano 2080 V [m3] Cat. 11 0,57 -2 +0 40 115 1,8 2100 I 15 0,44 -7 -4 18 185 2,4 4600 I 16 0,45 -7 -4 16 188 2,2 3000 I 22 0,41 -8 -4 16 225 3,4 14500 II 24 0,41 -9 -5 17 242 3,7 11500 II 26 0,42 -8 -5 25 281 4,9 13500 II 26 0,37 -10 -6 12 275 3,8 30500 II 34 0,33 -13 -11 13 369 5,2 119000 III 48 0,28 -13 -9 6 437 7,0 11000 III 45 0,30 -11 -9 11 417 6,9 58500 III 49 0,32 -10 -8 17 435 9,6 750000 III AIA-DAGA 2013 Merano Table 3: Spatial Parameter Average Values Analysis 2013b Reverberation Time [s] Reverberation Time Spatial Averages 12 10 For the detailed echo analysis, the following echo criteria were used: A severe echo exists on a path, if in more than 2 octave bands later than ca. 40 ms after direct sound: Average OFN Average SI Average SMT Average SPIV Average SMM Average OSM Average SLDF Average CS Average SGIL Average Chapel SGIL 8 1. 2. 3. sudden level-increases of IR-envelope > 4 dB occur, steps > 0,25 in the cumulative IR are visible, the Echograd Ek(t) after Dietsch/Kraak is > 0,9. A detrimental echo may exist on a path, if in more than 2 octave bands after ca. 40 ms later than direct sound: 6 4 4. 5. 2 0 100 1000 Octave Band Mid Frequency [Hz] 10000 Figure 2: Spatial Averaged Reverberation Times Detailed RIR-Analysis: Echo Paths The measured and to digital domain transferred room impulse responses were analysed in detail for possible disturbing echoes in the measured paths. The main idea was to try to find an answer to the question, which positions were acceptable in terms of nowadays understanding for intelligibility of polyphonic music (1530 ff.), and which ones had severe or detrimental echoes, which possibly would have disturbed the use of the positions for polyphonic music. sudden level-increases of IR-envelope > 5 dB occur, the Echograd Ek(t) Dietsch/Kraak after is > 1,0. Results: The room, where the oratorio was developed, the Oratorio San Marcello, exhibits suitable parameter values, indicating good and clear “Hörsamkeit” but nowhere echoes. Figure 3 gives an example of a detrimental echo in San Ignazio between the liturgical centre and the front of the nave (S1 E B), exhibiting reflections of > 6 dB above the surrounding envelope of the smoothed ETC 134 ms later than direct sound, indicating this (sender) position as not optimal in terms of nowadays understanding of the term “Hörsamkeit” because of the strong echoic reflections. Table 4 shows the resulting echoic paths in the churches. Strong Echoes O. F. Neri San Lorenzo S. Maria in Trastevere S. Maria Maggiore S. Ignazio S. G. in Laterano C. Sistina S. Pietro Source Receiver (TE-T0) [ms] L[dB] S2 A 81 5 47 6 S2 B 48 6 S1 B 88 5 S1 B 91 5 S2 A 43 6 S1 A 80 6 S1 A 49 6 S1 B 42 6 S1 B 134 4 S3 lu 121 5 S5 B 92 5 S1 B 41 6 S2 D 225 6 S2 E 69 6 S1 A 56 6 S1 B 70 6 S1 A 56 5 S1 B 71 5 S3 C 73 6 S3 B 75 5 S1 B 72 5 S1 B 59 6 S1 A 91 6 S2 B 128 10 S3 B 128 6 S3 A 96 6 S4 C 52 10 S4 B 185 5 Ek() 1,0 1,9 1,8 1,0 1,1 1,0 1,1 1,2 > 1,0 1,3 0,8 1,0 1,2 2,0 1,8 1,2 1,2 1,2 1,2 1,5 1,2 1,2 1,0 > 1,0 > 1,0 1,6 1,5 1,3 > 1,0 Plan with Positions smoothed ETC-octave bands Echograd Ek() Figure 3: Detrimental Echo in S. Ignatio, Path S1 E B Table 4: Measuring Paths with Severe Echoes (bold: detrimental) 2081 AIA-DAGA 2013 Merano Noticeable is the case of Cappella Sistina, where most of the measured RIR-paths are echoic, e.g. path S1 E B, where strong reflections 70 ms later than direct sound occur, see fig. 4. Almost all measured sender – receiver combinations in the room exhibit this behaviour, with the exception of the sender placed on the balcony at the side wall. It is known, that in the past positions of choir singers were located there. Section and Plan with Positions and Paths smoothed ETC-octave bands Conclusion In Autumn 1976 room impulse responses were measured at several positions in ten (unseated) churches of Rome using the State-of-the-Art (1976) room impulse response measurement method with transient impulses. This method can still be (performed and) evaluated with good accuracy, deliver valid and meaningful results, reveal echoic senderreceiver paths and allows statements about suitable and nonfavourable positions for polyphonic music. Thus, archived measurements of those days can be useful, especially in the case, a repetition of the measurements is not possible any more. The evaluation results of the room-acoustical parameter values allow to categorize the churches examined by the indicators of intelligibility into 3 groups (corresponding small, middle, large volume). In the group with the largest rooms, most severe echoes were identified in the room impulse responses. For the ten churches it was shown, at which places a positioning of the musicians would be disadvantageous in nowadays terms especially for polyphonic musical structures due to severe echoes in the room impulse responses, especially in the larger churches, and which one are/were advantageous. Especially in the smaller churches – albeit in historical practice in case of doubt music was made, where liturgy and ceremonial dictated the positions. The room, where the oratorio was developed, exhibits suitable parameter values, indicating good and clear Hörsamkeit, and no echoes. The authors wish to express their thankfulness to S. Leopold and W. Witzenmann for the guidance through the churches, and U. Apel as well as A. Esper for the tape-to-disk transfers. References [1] Fricke, J.: Die Verständlichkeit von Sprache und Musik. Eine pragmatische Annäherung an den Begriff des Verstehens. In: Festschrift H.-P. Reinecke zum 65. Geburtstag, Regensburg, 1991, S.129-144 [2] Fricke, J.: Die Raumakustik einer Kirche mit musikalischer Tradition: S. Luigi de’ Francesi in Rom. In: Festschrift H. Schmidt zum 65. Köln 1998, S. 93-105 Echograd Ek() Figure 4: None and Detrimental Echo in Cappella Sistina left: Path S1 E B; right: Path S4 E B [3] Shankland, R.+H.: Acoustics of St. Peter’s and Patriarchal Basilicas in Rome, JASA Vol. 50 No. 2(1) 1971 The churches of category I and II from table 3 show entirely (cat. I), respectively mostly (cat. II), echo-free room impulse responses indicating these churches not to have severe disturbances of the “Hörsamkeit” by strong echo reflections at the measured room impulse responses paths, whereas the larger and less intelligible churches sorted into category III show strong echoic reflections on many to most measured paths. Therefore it can be stated, that in the small and middle-sized of the examined churches polyphonic music practice was not problematic at the measured positions. Otherwise, in terms of nowadays understanding of “Hörsamkeit” it was quite a challenge to find positions in the larger churches of category III [1], which were not affected by strong echoes limiting the Hörsamkeit of polyphonic music – not even taken into account the rather low values of the predictors of intelligibility in the large churches. [4] Raes, A., Sacerdote, G.: Measurements of the Acoustical Properties of 2 Roman Basilicas, JASA Vol. 25, No. 5 1953 [5] Baumann, D.: Musik und Akustik im Trecento: Räumliche Bedingungen des Musizierens im Italien im 14. Jh. In: Schweizer Jahrbuch für Musikwissenschaft 1988/89 [6] Martellota, F.: Identifying acoustical coupling by measurements and prediction-models for St. Peter’s Basilica in Rome. JASA 126 (3), 2009, p. 1175-1186 [7] Carvalho, A., et al.: Subjective Acoustic Measures and Speech Intelligibility in Churches, Noise-Con 96, 1996 [8] Grimal, P.: Die Kirchen Roms, Stuttgart, 1997 [9] Buchowiecki, W., Kuhn-Forte, B.: Handbuch der Kirchen Roms, Bd. 1-4, Wien, 1967-1997 [10] Andaloro, M: Die Kirchen Roms, Viterbo, 2008 [11] Salmi, M.: Die Kirchen von Rom, München, 1962 [12] Takashi, O.: Die Sixtinische Kapelle, Köln, 1986 2082
© Copyright 2026 Paperzz