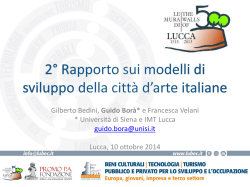
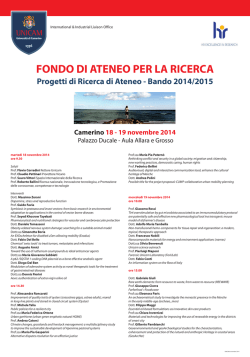
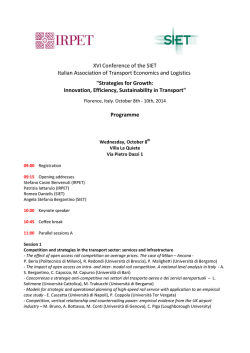
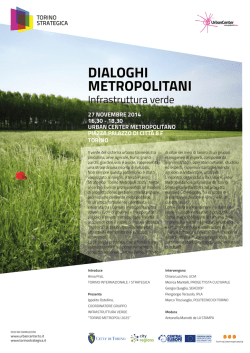
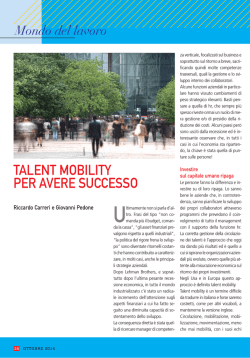
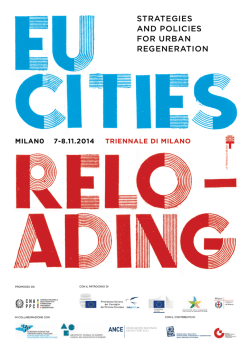
Urban Transport VI, C.A. Brebbia & L.J. Sucharov (Editors)
© 2000 WIT Press, www.witpress.com, ISBN 1-85312-823-6
Policies for sustainable mobility in Italian cities
C. Burlando^, C. Canali ^, E. Musso^\ C. Pelizzoni^
^ DIEM - Dipartimento di Economia e Metodi Quantitativi, Universita
di Genova, Italy.
^Dipartimento di Economia, Universita di Parma, Italy.
Abstract
The paper inspects strategies pursued by policy makers in order to manage urban
mobility, given the trade off among the goals of accessibility, environmental
sustainability, "fiscal sustainability", wealth/income redistribution.
Urban mobility policies are here grouped with reference to the aim of:
reducing overall demand;
- shifting from individual transport to transit;
shifting from high to low impact modes;
reducing externalities of individual and collective vehicles;
enhancing intermodality.
An empirical survey on all major Italian cities is developed, in order to point out
opportunities, consequences and problems in carrying out these policies.
1
Background
The ultimate function of urban transport is to increase the accessibility of urban
space, thus allowing the urban community to benefit from economies of
urbanisation. Such a goal of effectiveness in urban transport supply implies
direct costs (paid by travellers) and external costs (paid by the community).
Their minimisation in turn requires, respectively, goals of efficiency in
producing mobility and environmental protection, both aimed - hand in hand
with other public policies - to the growth of income of economic system (urban,
in the case in point) and to its even distribution.
All these objectives aiming to get an increase in collective welfare
(considered as the sum of individual utilities) have been ever pursued by public
interventions, even though in different ways and by different intensities
according to the historic moment. There are different reasons for public
intervention, ranging from the social utility of accessibility, to the existence of
Urban Transport VI, C.A. Brebbia & L.J. Sucharov (Editors)
© 2000 WIT Press, www.witpress.com, ISBN 1-85312-823-6
278 Urban Transport and the Environment for the 21st Century
natural monopolies, to positive and negative externalities. The social and
economic reasons at first justifying the presence of public intervention have been
substituted at present by environmental and economic reasons.
Urban mobility generates negative externalities causing the market
failure: thus, public intervention (even though partial and less invading than
once) is still required in building infrastructures and for fixing rules for the
development of individual and collective mobility.
Urban mobility policies concern (i) private traffic, (ii) production of
transit services, (Hi) realisation and modification of infrastructures. However,
mobility in urban areas does not only concern the transport sector. In fact,
interactions between the sector and its own territory generate the need to
implement non transport-related policies (such as urban planning) in order to
achieve transport-related goals.
Transport-related policies can be short or long-term: short-term ones
regard private traffic (in order to get a more fluent urban mobility) and
interventions in the production of transit services (either direct or just aimed at
planning and control of private operators); long-term policies are more complex
and concern infrastructures, which are largely funded directly by public
contributions.
2
Strategies for a sustainable urban mobility
By considering both the short and the long term, policy makers can follow
strategies of mobility management (not just transport-related), which can be
classified in five groups:
1) Reducing and reorganising total demand by reducing the number and/or the
length of movements. This implies to co-ordinate urban and transport policies in
order to reduce distances between settlements with different urban functions
(offices, services, residences), to hive off the places of supply of services and to
rationalise the distribution of goods. In order to decrease traffic peaks thus
improving the fluidity of movements, policy makers can differentiate the hours
of some activities, such as those of beginning and end of school lessons. A
reduction in the number of movements^ could be also caused by the diffusion of
telematics and telecommunications (such as telework, electronic commerce,
home banking, telebooking, etc.) which allow to carry on activities without
moving and, thus, without generating demand for mobility.
2) Transferring demand from individual mobility to collective transport. In order
to increase transit market share (external costs per person are estimated triple for
private than for collective transport), there is a need for more competitive transit
service. Its quality can be improved through higher speeds and frequencies,
capillarity of networks, lower distances between stops, more comfortable vehicle
and services. It is also necessary to restrict private traffic by enforcing temporary
or permanent traffic bans, pedestrian zones, park- and road-pricing, speed limits
for private cars, and through incentives for increasing vehicles' occupancy rate
(car pooling, car sharing), and liberalising the market of car rental and taxis,
where they are subject to regulations and restrictions of supply (such as in Italy).
Urban Transport VI, C.A. Brebbia & L.J. Sucharov (Editors)
© 2000 WIT Press, www.witpress.com, ISBN 1-85312-823-6
Urban Transport and the Environment for the 21st Century 279
3) Transferring public transport from road to rail and promoting alternative
energy sources with lower environmental impact. The most effective strategy for
increasing speed, reducing externalities and, at the same time, reducing costs of
public transport (through the cut down off staff) is the development transport
systems in dedicated lanes (normally on rail) powered by electric traction and
automatic guide. The result is an increase in efficiency and a potential increase in
effectiveness. Rail transport not only reduces environmental impact and
congestion, but also accident rates and health and social costs. Above all, rail
transit should be developed in connection of centre with suburbs, where present
modal split is dominated by road transport (in Italy, 80-90%) as a consequence
of the lack of alternatives.
4) Reducing externalities of vehicles, both for individual and collective
transport. It is necessary (/) to impose more rigorous rules about overhaul of
vehicles and about fuel, relating to both collective and private vehicles and (/'/) to
introduce supporting policies capable of stimulating the use of alternative energy
sources for public transport vehicles.
5) Intermodality. The integration can be enhanced between private and public
transport (park-and-ride, fares incentives for parking, concentration of services in
intermodal nodes), as well as by promoting integrated networks and cumulative
or unified tickets between different modes of collective transport (railways,
underground, buses, funiculars, sea and river transport). For these purposes, a
key issue is the improvement of information systems for road users and for
transit vehicles.
3
The goals of the survey
The survey aims at assess the level of implementation of strategies for
sustainable mobility in major Italian cities. These cities polarise a relevant share
of population, work, production and consumption of a highly developed
economy, where a transition occurs towards a model of post-industrial and
tertiary economic system.
Namely, the main aims of the survey are:
- to verify whether is occurring a systematic implementation of those
strategies which are nowadays reported by mainstream economic and
technical literature as being the most effective for government of urban
mobility in highly developed economies and with objectives of
sustainability;
- if this is the case, whether this implementation occurs homogeneously in
cities of different size and in cities belonging to different geo-economical
areas of the country;
- whether this implementation employs all different strategies of policies for
the sustainable urban mobility, or it pursues just a part of those strategies
and objectives.
Urban Transport VI, C.A. Brebbia & L.J. Sucharov (Editors)
© 2000 WIT Press, www.witpress.com, ISBN 1-85312-823-6
280 Urban Transport and the Environment for the 21st Century
4
The survey
4.1 Questionnaire and results
The level of implementation of policies for a sustainable urban mobility has been
analysed through questionnaires proposed to the city councillor responsible for
transport and mobility in all the 13 Italian municipalities with a population over
250.000 inhabitants (from the biggest to the smallest: Rome, Milan, Naples,
Turin, Palermo, Genoa, Bologna, Florence, Catania, Bari, Venice, Messina and
Verone). The thirteen cities have been classified into three groups: "small"
(population between 250,000 and 500,000), "medium" (between 500,000 and
1,000,000) and "large" (over 1.000.000). The Table 1 below classifies the above
mentioned cities according to the three class of population and to the
geographical areas they belong to.
Table 1 - The thirteen Italian cities with more than 250,000 inhabitants
Areas
Population
Northwest
> 7, 000, 000
Milan
J00,0007,000,000
Genoa
Turin
250,000J00,000
Northeast
Centre
South and
Islands
Rome
Naples
Palermo
Bologna
Venice
Verone
Florence
Bari
Catania
Messina
The survey has focused on private traffic, mass transit, mobility
analysis/planning, land use and urban policies/management. Namely, questions
proposed in the questionnaire range into eight topics concerning:
1) reducing demand for mobility;
2) optimising mobility;
3) promoting mass transit;
4) improving alternative modes of transport;
5) reducing externalities of vehicles;
6) improving intermodality;
7) applying traffic plans;
8) improving technological innovation.
It is rather self-evident that topics 1 and 2 refer to the first strategy mentioned in
§2, while topics 3, 4, 5, 6 refer, respectively, to the second, third, fourth and fifth
strategies of §2. Topic 7 has been included in the questionnaire in order to verify
the level of implementation of plans explicitly provided for by the Italian law,
while topic 8 points out the technological issues occurring in different policies,
in order to show the level of innovation intensity in urban mobility government.
Both topics are somehow transverse to all policies and strategies. Obviously,
Urban Transport VI, C.A. Brebbia & L.J. Sucharov (Editors)
© 2000 WIT Press, www.witpress.com, ISBN 1-85312-823-6
Urban Transport and the Environment for the 21st Century 281
each topic can include, and normally does, policies of different nature, ranging
from pricing to restrictions and prohibitions, from infrastructures to regulations,
from public incentives to product and process innovations.
The eight groups of questions are reported below (some of them appear
in more than one group, being related to different policies):
Reducing private mobility
local traffic restrictions
pedestrian zones
number-plate restrictions (odds/evens alternation)
traffic prohibitions on Sunday and public holidays
temporary traffic prohibitions related to pollution
restricted entry hour for lorries/vans
car pooling
car sharing
collective taxis
reducing distances between different land uses
decentralisation goods/services supplies
telework
No
0
0
12
3
3
1
4
3
4
4
4
8
Proj Yes
1
12
1
12
1
0
1
9
8
2
11
1
3
6
2
8
4
5
4
5
7
2
0
5
Optimising private mobility
O/D analysis
city mobility manager
firms' mobility managers co-ordination
reducing distances between different land uses
decentralisation goods/services supplies
echelons in school/office hours
No
3
4
5
4
4
3
Proj Yes
2
8
6
3
3
5
4
5
2
7
5
5
Enhancing (road) transit
bus lanes
improvement of lines and frequency
pre-trip information
car pooling
car sharing
collective taxis
No
0
0
1
4
3
4
Proj Yes
1
12
7
6
7
5
3
6
2
8
5
4
Rail transit and alternative vehicles
incentives for electric cars
cycle track
underground
people mover
tramway
trolleybuses
busway
No
4
1
3
8
3
8
2
Proj Yes
7
2
7
5
4
6
2
3
4
6
2
3
8
3
Urban Transport VI, C.A. Brebbia & L.J. Sucharov (Editors)
© 2000 WIT Press, www.witpress.com, ISBN 1-85312-823-6
282 Urban Transport and the Environment for the 21st Century
Reduction of externalities
road pricingu=>
park pricingy=>
regulations on polluting emissions (private traffic)
regulations on polluting emissions (transit)
incentives :"or electric vehicles
No
10
0
1
4
4
Proj Yes
3
0
1
12
2
10
^
j
6
2
7
Intermodality
park-and-ride
quality of intermodal nodes
fare and/or functional integration
logistic exchange platforms for goods distribution
No
0
4
2
6
Proj Yes
11
2
3
6
8
3
0
7
Planning
Urban Traffic Plan (PUT)
Urban Mobility Plan (PUM)
Urban Transport Master Plan (PGTU)
Detailed Urban Traffic Plan (PPTU)
Executive Urban Traffic Plan (PETU)
No
2
7
2
5
6
Proj Yes
11
0
4
2
1
10
1
7
2
5
Technology
pre-trip and in-trip information (private traffic)
Advanced Transport Telematics (ATT)
incentives for electric vehicles
pre-trip information (transit)
telework
No
0
0
4
1
8
Proj Yes
6
7
5
8
2
7
7
5
0
5
4.2 Result processing
For aggregate and average evaluations of the results of the questionnaire, it has
been fixed that each positive answer (policy in force) scores 1, each answer
stating that a measure is in project scores 0.5, each negative answer scores 0.
Average points for answers concerning each group of policies are
reported in Tables 2 and 3. In Table 2 the averages for the whole set of 13 cities
are compared to the results for cities belonging to each dimensional class. In
Table 3 the comparison is outlined with the results of cities of the four main
geographical areas (North West, North East, Centre, South & Islands).
Figures 1 and 2 show the same results and allow - for each set of
measures - an immediate visual comparison of each group of cities to the other
groups and to the national average. It must be noted that the lay out of the eight
axes is such that transit issues can be read on positive abscissa, private traffic
issues on positive ordinate, environment issues on negative abscissa and
technology issues on negative ordinate. Bisectors refer to measure which are to
some extent "common" to adjacent issues (e.g.: intermodality for private and
public transport).
Urban Transport VI, C.A. Brebbia & L.J. Sucharov (Editors)
© 2000 WIT Press, www.witpress.com, ISBN 1-85312-823-6
Urban Transport and the Environment for the 21st Century 283
Table 2 - Level of implem entation of policies by size of cities
Rail
Optimis.
Reducing
Enhanc. transit
private Intermo d (road)
private
and
Technol. Planning Reducing
external.
mobility
transit altern.
mobility
vehicles
0.881
Large
0.733
0.833
0.881
0.633
0.729
0.700
0.667
0.750
0.536
Medium
0.600
0.766
0.646
0.700
0.738
0.548
0.514
0.515
0.347
Small
0.428
0.514
0.586
0.571
0.398
0.555
0.544
0.600
0.623
0.592
0.560
Italy
0.596
0.625
Figure 1 - Level of implementation of policies by size of cities
Optimising private mobility
Reduction of externalities
. Enhancing (road) transit
Technology
-Large
•Italy
^Rail transit and altei
_ _g_ .Medium
* Small
Table 3 - Level of implementation of policies by geographical area
Rail
Reducing
Enhanc. transit
Optimis.
private
private Intizrmod (road)
and Technol. Planning Reducing
external.
mobility
transit altern.
mobility
vehicles
0.800
0.792
0.833
Northwest 0.607
0 881
0.900
0.690
0.750
0.467
0.429
0 452
0.562
0.767
0.600
0.375
Northeast 0.595
0.714
0.781
0.650
0.750
0.750
Centre
0 750
0.800
0.625
0.360
0.460
0.550
0.471
0.457
0.420
0 357
0.525
5bwf/z/M.
0.592
0.600
0.544
0.623
0.596
0.625
Italy
0.555
0 560
Urban Transport VI, C.A. Brebbia & L.J. Sucharov (Editors)
© 2000 WIT Press, www.witpress.com, ISBN 1-85312-823-6
284 Urban Transport and the Environment for the 21st Century
Figure 2 - Level of implementation of policies by size of cities
Optimising private mobility
Reduction of externaliti
, Enhancing (road) ti
^Rail transit and alternative vehicles
Technology
I _ _*_ . North-west
_-•- South/Islands
— _#_ . North-cast
)l( Italy
...*.. Centre
Finally, a further analysis has been conducted by comparing policies
enhancing mass transit, on one hand, to the balance of policies improving and,
respectively, discouraging private traffic, on the other hand. Results are
summarised Table 4 and in Figure 3, where scores are calculated as previously
explained.
Rome
Milan
Naples
Turin
Palermo
Genoa
Bologna
Florence
Catania
Bari
Venice
Messina
Verone
Table 4 - Private mobility vs. transit
private traffic
privaU? traffic
mass transit
dissuasion
improvement
enhan cement
0.64
0 86
0 83
0.68
1 00
0 87
0.71
79
0
0 97
0.61
0 93
0 73
0.57
0 50
0 63
0.71
0 93
0 77
0.64
0 71
0 63
0.54
1 00
0 80
0.64
0 50
0.57
0.46
0 50
0.50
0.57
0 57
0.43
0.21
0 21
0.27
0.50
0 36
0.33
Urban Transport VI, C.A. Brebbia & L.J. Sucharov (Editors)
© 2000 WIT Press, www.witpress.com, ISBN 1-85312-823-6
Urban Transport and the Environment for the 21st Century 285
Figure 3 - Private mobility vs. transit
Naples
Catania
*
Palermo
*
Rome
Milan
•
Bologna
*
Bari
^Venice
^/lessina
-0,5
5
-0,4
-0,3
-0,2
-0,1 0
0,1
Private mobility
0,2
0,3
0,4
0,5
Conclusions
The results of the survey provide some meaningful information, that can be
summarised as follows:
- most of the policies referred to in the questionnaire are far from being
widely employed in major Italian cities; out of the measures considered, on
average less than 45% are in force (in April 2000) in any Italian city with
more than 250,000 inhabitants, while another 26% is planned to come into
force in the future;
- there are relevant differences related to the size of cities: for "small" cities
(between 250,000 and 500,000 inhabitants) measures in force are on average
35%, fairly less than for "medium" cities with pop. between 500,000 and
1,000,000 (51%), and for large cities of over 1 million inhabitants (67%);
what is quite normal, since urban mobility problems are bigger in big cities,
thus justifying a higher priority in the political agenda;
- similar inequalities result between cities of different geographical areas,
what is far less obvious: cities of Southern regions show a much lower level
of enforcement of measures in mobility government (34%) than cities of the
rest of the country (54%); since Southern regions include cities of the three
size groups, more or less proportionally to national averages, and
considering the level of public expenditure usually (much) higher than in the
rest of the country, this inequality can only be explained through a lower
attention and priority to such issues such as urban mobility and the quality
of urban environment;
cities of different sizes appear to employ quite different ranges of policies
(at least as far as the 8 groups of measures of the questionnaire are
considered); bigger cities show a comparatively higher use of innovative
Urban Transport VI, C.A. Brebbia & L.J. Sucharov (Editors)
© 2000 WIT Press, www.witpress.com, ISBN 1-85312-823-6
286 Urban Transport and the Environment for the 21st Century
-
6
policies (not only technologically) such as innovations in transport modes,
vehicles, energy, the enhancement of intermodality between private and
public transport or between different modes mass transit, the optimisation of
traffic flows through reduction of peaks; while smaller cities mainly focus
on more traditional policies such as restrictions to private mobility and
incentives to mass transit;
bigger cities employ a more homogeneous mix of policies than medium and
small cities (the ratio between the percentage of enforcement for the less
employed group of measures and that of the more employed group of
measures is respectively 0.76, 0.70 and 0.60); probably due to the fact that
bigger cities, and partly medium cities, have a need comparatively higher for
employing as many as possible of the available tools for facing mobility
problems; thus they adopt simultaneously different strategies, what is less or
no necessary for smaller cities, which focus on a few measures, considered
effective for specific problems;
the comparison between policies for mass transit, on one side, and the
"balance" of measures optimising and restricting private mobility, on the
other side (see Figure 3) shows that all large cities, two out of the three
medium cities and the two bigger among "small" cities have adopted a
policy mix aiming both at enhancing public transport and at optimising
private traffic; the strategy, often enunciated, of penalising private mobility
(road pricing, traffic restrictions, etc.) and jointly bettering the quality of
public transport is far from being organically pursued, probably also for
political reasons.
References
[1] EU passenger transport rose from 1970 to 1996 more than GDP, at an
average annual rate of 3.1%. About 30% is concentrated in cities (see TNO,
1999), where 500 billions trips per year are estimated (OGM et a/., 1998). See:
TNO, Definition of European transport systems, European Commission, DG VII,
FANTASIE project, Deliverable D13;
OGM et al, QUATTRO project: synthesis and recommendation, European
Commission, DG VII;
[2] Cascetta E., Teoria e metodi dell'ingegneria del sistemi di trasporto, Torino,
Utet, 1999.
[3] Cardia C., Junyent R., (Eds.), The impact of major transport infrastructures
on the urban quality. European case studies, Bruxelles: COST, 1999.
[4] Camagni R., (Eds.), Economia e pianificazione della citta sostenibile,
Bologna, II Mulino, 1996.
The whole paper has been jointly discussed and developed by the authors.
Nevertheless, §§ 2, 4.2 are by C.Burlando; § 1 is by C.Canali; §§ 3, 4.1 are by
C.Pelizzoni; § 5 is by E.Musso.
© Copyright 2026 Paperzz