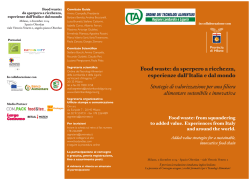
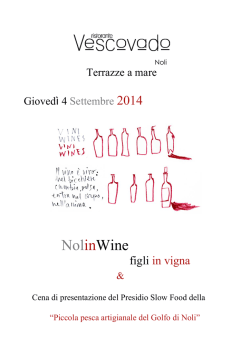
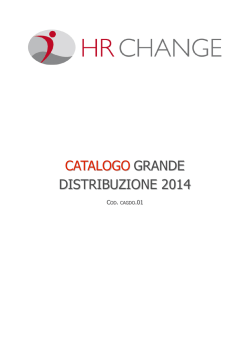
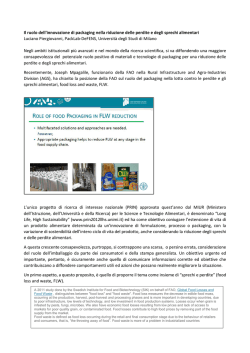
Rivista di Economia Agraria, Anno LXXI, n. 1 (Supplemento), 2016
Food waste in the phase of domestic consumption: the causes and
preventive actions
Antonia Di Florio * – Università degli Studi del Molise
Rosa Maria Fanelli – Università degli Studi del Molise
* Corresponding author: [email protected]
Abstract
This work is part of a research field still little explored both nationally and internationally and
in which different theoretical approaches and methodologies for quantitative analysis of the
dynamics of food waste are used. Most of the research, globally, focuses on the formation of
waste in the stages of production and distribution.
Few studies regarded, however, an analysis of food waste in the phase of domestic
consumption. Therefore, this paper aims to fill this gap by providing the results of a survey,
carried out at a representative sample of the population, to quantify, qualify and identify the
causes of food waste as well as actions that consumers put in place to reduce or, even
better, to prevent it.
Said survey was conducted on a representative sample of 500 individuals.
The questionnaire was launched in April 2014 and remained on-line until June 2014. The
same has been diffused through the social network "Facebook".
Keywords
food waste, household consumption, consumer behavior, root cause analysis
Introduction
This work is part of a research field still little explored both nationally and internationally and
in which different theoretical approaches and methodologies for quantitative analysis of the
dynamics of food waste are used. Most of the research, globally, focuses on the formation of
waste in the stages of production and distribution.
In some studies it has been estimated that, globally, one third of the edible parts of food is
lost or wasted each year. (Gustavsson et al., 2011; Barilla, 2012; Fao, 2013).
Much of the waste that comes from high-income countries has been attributed to poor
marketing practices and consumer behaviour, with consumers being identified as a bigger
contributor than food manufacturing, distribution, grocery retail and the hospitality sectors
(Griffin et al, 2009 and Quested et al., 2011).
DOI: 10.13128/REA-18647
ISSN (print): 0035-6190
ISSN (online): 2281-1559
© Firenze University Press
www.fupress.com/rea
PROCEEDINGS OF THE 52ND SIDEA CONFERENCE
In such links in the food chain, as it is known, food waste seems inevitable because most of
it comes from an erroneous inventory management, from production surpluses, through
damage or deformation.
Few recent studies were concerned with this matter; however, analyses of food waste in the
phase of domestic consumption were carried out (Schneider and Obersteiner, 2007; WRAP,
2008; Parfitt et al., 2010), pilot projects (Schneider and Lebersorger, 2009; Fanelli, Di Florio;
2015) and campaigns such as the “Love Food Hate Waste” campaign launched in Great
Britain in November 2007 (WRAP, 2008) and the campaign “Less food wasted means more
money in your wallet” in the Helsinki Metropolitan area from 2005 to 2007 (YTV, 2008).
In the UK alone it has been estimated that households generate 7.2 million tonnes of food
waste a year, most of which is thought to be avoidable (Waste and Resource Action
Programme [WRAP], 2011), despite research suggesting that consumers have a distaste of
wasted utility (Bolton and Alba, 2012).
In particular, a study on food wasted in the United Kingdom showed that consumers throw
away 31% of the food that they buy. The most common reason provided by consumers for
food being wasted is that it is left unused or that too much has been cooked or prepared
(Waste Resources and Action Programme, 2008). By buying more food than what is going to
be eaten, the developed world uses up precious land and resources that could otherwise be
used to feed the poor. Yet, the vast quantities of food that end up in landfills worldwide
contribute significantly to the environmental impacts of waste, including greenhouse gas
emissions.
The most often quoted estimate is that ‘as much as half of all food grown is lost or wasted
before and after it reaches the consumer’ (Lundqvist et al, 2008).
Packaging also plays an important role in reducing food waste. About 20-25% of the
households’ food waste could be related to packaging.
International literature mainly addresses the quantification of the value of wasted food.
(Buzby and Hyman, 2012; Parfitt et al. 2010; Griffi et al., 2009). In these works, in fact, the
negative implications of this phenomenon have been brought to light (Sonnino and
McWilliam, 2011) without giving any possible strategies for its reduction.
Therefore, this paper aims to fill this gap by providing the results of a survey, carried out at
a representative sample of the population, to quantify, qualify and identify the main causes
of food waste as well as actions that consumers put in place to reduce or, even better, to
prevent it.
The same survey was conducted on a representative sample of 500 individuals, of which
68.4 % reside in Molise. Such individuals have self-selected by filling out the questionnaire
developed using Google Drive.
The questionnaire was launched in April 2014 and remained on-line until June 2014. The
same has been spread through the social network " Facebook".
The 45 pieces of information relating to the characteristics of the individual respondents,
household size and composition, to the habits and attitudes of expenditure and food,
guidelines and behaviors to reduce or prevent food waste in the phase of domestic
consumption, thus collected have been developed with the use of R software the software.
Data analysis was conducted in three phases: an analysis of simple correspondences, a
cluster analysis and causal maps.
279
PROCEEDINGS OF THE 52ND SIDEA CONFERENCE
The first allowed to identify why, how and how much is wasted, while the second group of
respondents were divided into three groups that were each homogeneous and of different
sizes, and, finally, causal maps were used to identify the main root causes of food waste in
the phase of domestic consumption.
The paper is structured as follows: Section 2 focuses on discussing how legislation has been
used to address the problem. Section 3 describes how the data were collected and analyzed.
Section 4 outlines the results of the study that are discussed in detail in Section 5. Finally,
Section 6 presents the conclusions of the work and the opportunities for further research.
Method
Data was collected through 500 questionnaires filled out by students and other consumers in
Italy and especially in Molise.
The sample of people who filled out the online questionnaire is self-selected, since they
participated on a voluntary basis.
The questionnaire was completed in its entirety by 84% of respondents, as to a series of
questions, were not given answers. Most of the respondents live in Molise and many are
students of the University of Molise.
The group of respondents represents the interests of young people very well. 66% of the
same is made up of women and the remaining 34% of men; the age group most
represented by the survey is that between 18 and 30 years (70%), while it is poorly
represented below 18 and above 61 years (less than 2%). Half of those surveyed have a
diploma and 30% a university degree (bachelor or master). 21% of respondents claimed to
earn a monthly income of between € 1201 and 1600, 16% between € 801 and 1200, 14%
between € 2801 and beyond.
The data obtained shows that 87% of respondents shop in the supermarket, while 34% say
that they have a vegetable garden or a garden.
33% go shopping once a week and 31% twice a week.
Among respondents, 34% does not have any favourites times to go shopping, while many
others prefer to do their shopping in the early morning or mid-morning: 18% goes shopping
early in the morning to buy the freshest products and during a less chaotic time of day, while
20% prefers to do their shopping in midmorning more for convenience, not giving
importance to the freshness of the product.
The average expenditure of a household week is between 51 and 100 €; 45% of
respondents said that spending affects their income at 21-50% .
60% of respondents consume first and second courses at lunch and dinner. The portions, for
both lunch and dinner, are all average, almost never exceeding 200g for each course.
Based on the answers given by the respondents, comparing food waste among the three
periods, namely: pre-crisis period (before 2007), the crisis period (2007-2009) and post-crisis
period (from 2009 onwards), the amount of food thrown away has changed slightly,
maintained between 47-49%. In the period before the crisis, 16% said they threw away
more food, a percentage that drops to 3% in the period of crisis and to 2% in the post-crisis
280
PROCEEDINGS OF THE 52ND SIDEA CONFERENCE
period; while in the pre-crisis period, 4% claimed to throw away less food; that percentage
during the crisis rose to 17% and in the post-crisis 20%.
Data from the questionnaires and supplementary documentation were analyzed using cluster
analysis and causal maps. These methodologies helped to identify clusters of consumers, the
main root causes of householder’s food waste and the actions that the consumers take play
to reduce or to prevent the food waste.
The multivariate analysis was performed using the R environment software for the
development of statistical analysis of data. It is considered a set of 8 variables. Data
processing was carried out performing a cluster analysis. Euclidian distances were identified
between point units and then it was decided to aggregate the respondents both with the
hierarchical methods and using the single bond. From the resulting dendrogram we identified
and analyzed individual clusters of respondents showing greater homogeneity (Cerioli and
Zani, 2007; Fanelli and Felice, 2014).
The analysis of root causes, instead, was performed using causal maps (Huff, 1990, Fiol and
Huff, 1992 and Jenkins and Johnson, 1997) also known as cause maps. The causal map is a
particular type of cognitive map that is used to explore the cognitive structures of individuals
(Huff, 1990, Fiol and Huff, 1992 and Scavarda et al., 2006). Directed graphs are used to
represent the causal relationships between elements of a system where nodes represent
ideas, concepts or problems, and unidirectional arcs connect the nodes indicating beliefs
about the causal relationship between them (Scavarda et al., 2006).
Causal maps can be used for different purposes such as improving quality, identifying root
causes, designing information systems and developing strategy (Scavarda et al., 2006).
The construction of a “current reality tree” (CRT) starts with the identification of surface
problems or undesirable effects (Walker and Cox, 2006). The CRT uses three types of
symbols: nodes denote undesirable effects, arcs denote causal relationships and ovals
represent the logical function “AND”, denoting that two or more causes are required to
produce an effect. In the CRT, the undesirable effects are connected following an if–then
logic and the logical relationships are tested following a systematic approach described in
detail by Walker and Cox (2006). The output of this process is a graph, or tree, in which the
ultimate effects or problems are found at the top, and, at the bottom, the root causes can be
identified.
In the analysis, only products with shelf life such as meat and fish were considered, together
with products that tend to be fragile such as vegetables, bread, sweets and biscuits. These
products are the most thrown away. (Kantor et al., 1997).
The research focused on the identification of the causes of food waste in the phase of
domestic consumption.
Results
The results of this research are presented in five stages.
Firstly, the percentages of the interviewees who generate waste were described according to
product type.
281
PROCEEDINGS OF THE 52ND SIDEA CONFERENCE
This is followed by the identification of the main root of domestic food waste of the people
surveyed and of the results regarding the main destination of waste.
In the fourth stage, there is a descriptive account of the main causes of waste. Finally, an
analysis of the main actions that the consumers take place to reduce the domestic food
waste is made.
Graph 1shows seven respondents clusters that waste products. Bread, fresh fruit and
vegetables are the products that have the highest percentage of interviewees (43.3%).
Perhaps these products are more wasted because they are generally fragile and tend to have
a variable or short shelf life. Bread, based on cereal grain, has a variable shelf life (1 day- 6
months). Fruits and vegetables, instead, tend to have a short shelf life (5-14 days). Some
products utilize temperature control during part of the chain.
10.7% of the participants wastes beef and only 3.3% fish. In these cases, the waste is lower
because beef and fish have a very volatile demand that depends on the price and on the
consideration of their high value as compared to other food products.
In the middle range we found respondents (23.7%) who waste pasta, which tends to have a
long shelf-life (+ 6 months) and requires no temperature control.
15.3% of respondents wastes sweets and biscuits that, like bread, have a variable shelf-life
(1 day-6 months).
Finally, only about 2% of respondents declared that they create zero waste.
Graph 1 - Percentage of respondents by products more wasted
Source: Our processing of data collected with questionnaire
The main root causes of domestic food waste of the people surveyed are shown in Graph2.
Amongst the causes of waste proposed in the questionnaire, as shown in Graph 2, 55% of
respondents selected expired food as a major cause of waste, followed by another 52% bad
odor/flavor, 44% due to mold.
282
PROCEEDINGS OF THE 52ND SIDEA CONFERENCE
Other causes that generate waste vary from 26% to 4% and are: generous portions (26%),
incorrect conservation (21%), unappetizing appearance (21%), leftovers from previous days
(21%), things left over in the fridge (19%), things left over in the pantry (18%), food
considered unappetizing (15%), package size (10%), food considered difficult to measure
(5%) and poor culinary skills (4%). Only 2% said they wasted due to incorrect interpretation
of the labels.
Graph 2 - Main root causes of domestic food waste
Source: Our processing of data collected with questionnaire
The root causes of waste seem to vary according to the attitudes and eating habits and
culture and between developing and developed countries. In wealthy developed nations like
Italy, food is wasted mostly at the consumption stage. There are several overlapping reasons
for this. In highly developed countries, advanced technology in agriculture, as well as food
processing and distribution means that food is plentiful and cheap. Italy spends less of its
income on food than most other countries in the world (20% compared to 43% in Egypt).
Therefore, consumers do not appreciate the true value of food and buy more than they
need without much thought. Additionally, they throw away old food that is still safe to eat,
relying on ‘best-by’ labels which “are generally not regulated and do not indicate food safety”
according to the Natural Resources Defense Council (NRDC). Though there are other factors
at work, low food prices are clearly connected to high food wastage. In an industrialized food
system with low food prices, consumers often insist on extremely fresh, aesthetically perfect
and abundant foods. Stores over-stock their shelves accordingly and then end up throwing
out unbought foods.
With regard to the good intentions and actions that respondents said they had undertaken
and / or who want to take in the future, the following emerged.
85% of those surveyed claimed to be aware of the environmental and economic value of
food waste.
84% of respondents separate waste for collection and 65% of them said they had reduced
the amount of compostables thrown away.
283
PROCEEDINGS OF THE 52ND SIDEA CONFERENCE
The actions that could reduce and / or minimize food waste according to respondents are:
- Improving knowledge in the techniques of food preservation;
- Cooking proper portions;
- Spreading and buying single portions for students and/or for those who live alone;
- Checking the expiration dates;
- Organizing one’s weekly balanced diet and shopping, also using shopping lists.
The actions that respondents are implementing, however, have been grouped into the
following categories:
1) Waste separation for collection;
2) Actions to minimize or eliminate waste;
3) Get more information on the impact waste has on the environment.
Another important element in the analysis of domestic food waste is the destination of waste
(Graph 3).
However, in Molise, leftovers cannot be disposed into garbage pail, but 51% of the
respondents eats it in the following days; another 35,4% uses the leftovers to feed the
animals. This is because most of the respondents live in Molise, a rural region where many
have farm animals and pets. Only 9% throws it in the garbage pail. Finally a very low
percentage (0,8%) gives it away.
Graph 3 - The destination of domestic food "waste" based on percentage of respondents
Source: Our processing of data collected with questionnaire
The initial analysis of the causes of domestic food waste showed important issues. Most
causes have interdependencies and are part of a complex relationship between causes and
effects.
Using causal maps (see Fig.1), it is possible to map the logic between causes and effects
creating in a tree, where at the top we have the symptoms and at the bottom the root
causes.
By analyzing the root causes maps, we can classify the root causes of waste into two
groups:
284
PROCEEDINGS OF THE 52ND SIDEA CONFERENCE
- Natural constraints: factors that influence domestic food “waste”. These constraints are
associated with the nature of the products (short or long shelf-life) and with the package
size.
- Consumer roof causes: the characteristics of the consumer (income, age, profession) and
poor culinary skills such as cooking too much, not using the food in time, a lack of
confidence in using to leftovers, incorrect conservation.
The first group can be influenced in some ways by marketing decisions and the commercial
interest of the industry. Packaging can affect waste in two different ways. On the one hand,
it has a positive impact on waste because it protects the products from damage and can help
to extend the shelf life of some products. On the other hand, at some point packaging will go
to waste in the phase of domestic food, so excessive packaging is to be avoided.
The second group, instead, is mainly related to consumer behavior and to insufficient
purchase planning and expiring best-before dates in combination with the careless attitude
of those consumers who can afford to waste food.
By analysing the casual maps, some main root causes have been identified (Figure 1).
To the question "How much food you throw away?": 4% of respondents answered a lot,
70% little and 26% none.
These answers enabled us to identify three groups "homogeneous" of consumers, so called:
Cluster 1: The wasteful
This group includes only women, mostly female students, aged between 18-30 years, who
claimed to have a monthly income between 1201-1600 €, a monthly budget between € 151200, to spend between € 51-100 a week and wasting between € 6-20 weekly.
The cluster is not in the habit of weighing food and throws it away if expired.
Cluster 2: The careful
It is a mixed group consisting in many women and few men. Formed mostly by students,
aged between 18-30, who claimed to have a monthly income between € 1201-1600, a
monthly budget between € 101-150, to spend a week between 51-100 € and wasting weekly
between € 0-5.
The cluster is not in the habit of weighing food; however, if it has expired, before throwing it
away, it considers how long since the food expired.
Cluster 3: The virtuous
The third and last group encompasses more women than men. In addition to students, there
are also the unemployed, aged between 18-30. They claimed to have a monthly income of
between € 801-1200, a monthly budget between € 101-150, spending between € 51-100
weekly and wasting between € 0-5 weekly.
These respondents are not in the habit of weighing food, but even this cluster considers how
long the food has expired before disposing of it. However, compared to the two previous
clusters, a good percentage reported eating the food even it expired.
Successively, there was an analysis of food waste into three periods before, during and after
the economic crisis (see Graph 4, 5, 6).
285
PROCEEDINGS OF THE 52ND SIDEA CONFERENCE
Figure 1- Casual map of the main root causes of domestic food waste
Source: Our processing of data collected with questionnaire
This analysis showed that the percentage of individuals who claimed not to know how much
food they throw away remained more or less the same (33% in the period before the crisis,
32% and 29% during the crisis in the post-crisis period). The percentage of participants who
said they throw away the same amount of food has remained almost unchanged (47% in the
period before the crisis, 48% in the period during the crisis, 49% in the post-crisis period).
286
PROCEEDINGS OF THE 52ND SIDEA CONFERENCE
There was a reduction, even in terms of percentages, which corresponds to the answer “I
threw away more food” (16% in the pre-crisis period, 3% in the period during the crisis, and
2% in the post-crisis period).
Conversely, the percentage of respondents who claimed to throw away less food increased
by 4% in the period before the crisis, 17% in the period during the crisis, up to 20% in the
post-crisis period.
Graph 4 - Pre Crisis (before 2007)
Source: Our processing of data collected with questionnaire
Graph 5 – During the Crisis (2007 – 2009)
Source: Our processing of data collected with questionnaire
287
PROCEEDINGS OF THE 52ND SIDEA CONFERENCE
Graph 6 – Post Crisis (from 2009 and beyond)
Source: Our processing of data collected with questionnaire
Conclusions
The aim of this research was to conduct an initial exploration into the problem of domestic
food waste. The attention was focused on the main root causes of domestic food waste and
on the actions that the consumers took to reduce waste.
The results revealed that neither the economic crisis nor the increased sensitivity to
environmental issues have affected the amount of food wasted, which in fact appears to
have remained unchanged.
In trying to expose a summary of the results and the conclusions that can be drawn from
this paper, it is specified that the issue of waste has been ignored for a long time and only
recently gained interest.
It has been noted how within the food system, waste affects all links in the chain:
production, processing, distribution and final consumption, in both singular and specific
causes at every step.
Fortunately, the food discarded is recovered, when possible, from associations that provide
assistance to people in difficult conditions, thanks to the Last Minute Market, a spin-off of the
University of Bologna, which, for years, has dealt with recovering food.
There is very little data available, especially in Italy.
The causes of waste may vary according to socio-economic status and culture, such as the
bad habit of preparing more food than that which can be eaten, leading to leftovers.
The study carried out clearly showed how each link in the food supply chain is formed by
products in excess that cannot be sold, whose "management" in many cases not only does
not respect the original destination of the product, i.e. human food, but has also a higher or
lower cost (transportation, processing, storage and disposal), depending on the particular
288
PROCEEDINGS OF THE 52ND SIDEA CONFERENCE
product, which the company must in any case support. This is in addition to the negative
externalities (for example pollution) for which all of society must, sooner or later, pay the
price.
The difficulty of quantifying also derives from the very nature of the food, “living” entities
that undergo rapid processes of biological deterioration.
Even if data regarding waste were available, it would not be and could not be in the public
domain.
The survey conducted on a representative sample of 420 individuals, of which 68.4% reside
in Molise, has highlighted the attitudes and behaviour of the same with respect to food
waste in the home. Only 26% of respondents recognized the need to pay more attention to
this problem. Particularly sensitive segments were younger, better educated and residents in
Molise.
Another interesting finding is that in times of economic crisis, which has afflicted Italy for the
last 8 years, attitudes and buying behaviours and household consumption have become
more virtuous.
Overall, through the behavior of the participants, especially from Molise, the survey
confirmed that they are also careless.
However, many respondents would be willing to accept advice on how to keep food and how
to use leftovers in the kitchen. Moreover, the same stated that very often the information on
the labels of the products purchased is difficult to interpret. In this regard, they would like
more clarification.
Perhaps this is the main reason for which the food that is not considered good is thrown
away.
The authors acknowledge that the research has some limitations. Firstly, the qualitative
approach followed provided relatively small samples which allowed the identification of root
causes of domestic food waste. Furthermore, the analysis was restricted to some regions
and a limited group of consumers. Future studies could concentrate on other geographical
regions and expand the sample to increase the generalizability of the results.
References
Barilla Food Center and Nutrition (Bcfn) (2012). Documento tecnico di supporto alla Terza
Edizione della Doppia Piramide, Parma.
Bolton L. E., Alba J.W. (2012). When less is more: Consumer aversion to unused utility.
Journal of Consumer Psycology, 22.
Buzby J.C. e Hyman J. (2012). Total and per capita value of food loss in the United States.
Food Policy, n.3.
Cerioli A., Zani S. (2007). Analisi dei dati e data mining per le decisioni aziendali. Giuffrè
Editore, Milano.
Commissione europea (2010). Preparatory study on food waste across EU 27. Bruxelles,
Belgio. http://ec.europa.eu/environment/eussd/pdf/bio_foodwaste_report.pdf
Direttiva 2000/13/ce del Parlamento europeo e del Consiglio del 20 marzo 2000 relativa al
ravvicinamento delle legislazioni degli Stati membri concernenti l'etichettatura e la
289
PROCEEDINGS OF THE 52ND SIDEA CONFERENCE
presentazione
dei
prodotti
alimentari,
nonché
la
relativa
pubblicità:
http://eurlex.europa.eu/LexUriServ/LexUriServ.do?uri=OJ:L:2000:109:0029:0042:IT:PDF
Direttiva 2008/98/CE del Parlamento Europeo e del Consiglio del 19 novembre 2008 relativa
ai rifiuti e che abroga alcune direttive:
http://eur
lex.europa.eu/LexUriServ/LexUriServ.do?uri=OJ:L:2008:312:0003:0003:IT:PDF
WRAP (2011)
Fanelli R.M., Felice F. (2014). Un’applicazione dell’analisi multivariata e della convergenza
non parametrica all’industria birraria italiana. RIVISTA DI ECONOMIA AGRARIA, n°. 1, pp.
7.30, DOI: 10.13128/REA-16305, ISSN 0035-6190, ISSNe 2281-1559.
Fanelli R. M., Di Florio A. (2015). La riduzione dello spreco alimentare nella fase del consumo
domestico. RIVISTA DI AGRICOLTURA, ISTITUZIONI MERCATI, Fascicolo, n° 3, 2013.
WRAP
reports
significant
progress
on
waste
reduction:
http://www.wrap.org.uk/content/wrap-reports-significant-progress-waste-reduction.
EU Food Policy (2012). Member states to debate legal status when "best before" date is
exceeded. EU Food Policy 97:8.
EUFIC (2011). Forum n° 5 – Consumer response to portion information on food and drink
packaging – A pan-European study. Brussels, Belgium: /article/en/expid/forum5-Consumerresponse-portion-information-food-drink-packaging/.
Fiol Cm., Huff AS. (1992). “Map for managers: where are we? Where do we go from here?,
Manage Stud, 29,267-85
Food and Agriculture Organization (2011). Global food losses and food waste: extent, causes
and
prevention.
Rome,
Italy:
http://www.fao.org/fileadmin/user_upload/ags/publications/GFL_web.pdf.
Food and Agriculture Organization (2013). Food wastage footprint-full costs accounting,
available, at http://www.fao.org/3/a - i3991 e.pdf.
Food Safety Authority of Ireland (2011). 5 out of 10 people ignore use by dates:
http://www.fsai.ie/news_centre/press_releases/5_out_of_10_People_Ignore_Use_By_Dates/
17112011.html.
Griffin M., Sobal J., Lyson T.A. (2009): “An analysis of a community food waste stream Agric
Hum Values, 26, pp. 67–81.
Gustavsson J., Cederberg C., Sonesson U., van Otterdiik R., Meybeck A. (2011): “Global Food
Losess and Food Waste: Extent, causes and Prevention. FAO, Rome, Italy.
Huff AS. (1990): Mapping strategic thought. Chichester, John Wiley.
Kantor LS, Lipton K., Manchester A., Oliveria V. (1997): “Estimating and adressing America’s
food losses, Food Rev., 43 (4), 2-12.
Lundqvist J., de Fraiture C., Molden D. (2008) “Saving water: from field to fork—curbing
losses and wastage in the food chain”. In SIWI Policy Brief. Stockholm, Sweden: SIWI
Parfitt, J., M. Barthel, S. Macnaughton (2010). Food waste within food supply chains:
quantification and potential for change to 2050. Philosophical Transactions of the Royal
Society B 365: 3065-3081.
Parlamento europeo (2011). Risoluzione del Parlamento europeo del 19 gennaio 2011 su
come evitare lo spreco di alimenti: strategie per migliorare l'efficienza della catena
alimentare
nell'UE
Bruxelles,Belgio:
290
PROCEEDINGS OF THE 52ND SIDEA CONFERENCE
http://www.europarl.europa.eu/sides/getDoc.do?pubRef=//EP//TEXT+REPORT+A7-20110430+0+DOC+XML+V0//IT.
Potocnik J, Commissario europeo per l'ambiente (2011). It's time to stop wasting food.
Conference "combating food waste in the EU" Bruxelles, 8 novembre 2011 (Ref:
SPEECH/11/725):
http://europa.eu/rapid/pressReleasesAction.do?reference=SPEECH/11/725&format=HTML&a
ged=0&language=EN.
Quested TE, Parry AD, Easteal S., Swannel R. (2011): “Food and drink waste in the UK,
Nutrition Bull, 36, 470-7.
Regolamenti (CE) No 1221/2008 del 5 dicembre 2008 che modifica il regolamento (CE) n.
1580/2007, recante modalità di applicazione dei regolamenti (CE) n. 2200/96, (CE) n.
2201/96 e (CE) n. 1182/2007 nel settore degli ortofrutticoli, per quanto concerne le norme di
commercializzazione
:
http://eurlex.europa.eu/LexUriServ/LexUriServ.do?uri=OJ:
L:2008:336:0001:0080:IT:PDF.
Regolamento (EU) No 1169/2011 del Parlamento europeo e del Consiglio del 25 ottobre
2011 relativo alla fornitura di informazioni sugli alimenti ai consumatori: http://eurlex.europa.eu/LexUriServ/LexUriServ.do?uri=OJ:L:2011:304:0018:0063:IT:PDF.
Schneider F., Obersteiner G. (2007) Food Waste in Residual Waste of households – regional
and socio-economic differences. In: Cossu R., Diaz L.F., Stegmann R. [Eds.] Proceedings
Sardinia 2007, EleventhInternational Waste Management and Landfill Symposium, S.
Margherita di Pula, Cagliari, Italy;1 - 5 October 2007 (Abstract; full paper on CD), pp.469470.
Shhneider F., Lebersorger S. (2009) Untersuchung der Lebensmittel im Restmüll in einer
oberösterreichischen Region (Analysis of food waste in residual waste in an Upper Austrian
region). Project on behalf of Federal State Government of Upper Austria, Vienna. Sustainable
Restaurant Association: http://www.toogood-towaste.co.uk/.
Scavarda Aj, Bouzdin-Chameeva T., Goldstein SM., Hays JH., Hill AV. (2006). “A
methodology for constructing collective causal maps, Decision Sci, 37(2), 263-83.
Walker ED., Cox JF. (2006): “Addressing ill-structured problems using Glodratt’s thinking
processes: a white collar example. Manage Decision, 44, 137-53.
WRAP
(2007).
Food
storage
and
packaging.
Banbury,
UK:
http://www.wrap.org.uk/content/food-storage-and-packaging.
WRAP (2008) The food we waste. Food waste report. Bunbury, UK.
WRAP (2010). Press release: Industry recommendations unveiled to reduce household food
waste, 19 August 2010.
WRAP (2011). Consumer insight: date labels and storage guidance. Banbury, UK
WRAP (2011). Consumer insight: date labels and storage guidance. Banbury, UK:
http://www.wrap.org.uk/sites/files/wrap/Technical_report_dates.pdf.
WRAP, about food waste: http://www.lovefoodhatewaste.com/about_food_waste.
291
© Copyright 2026 Paperzz