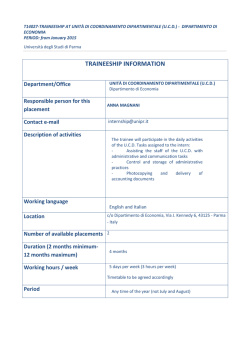
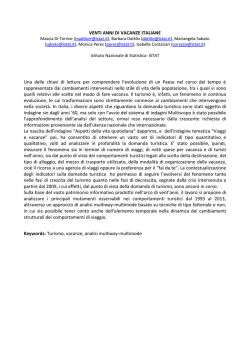
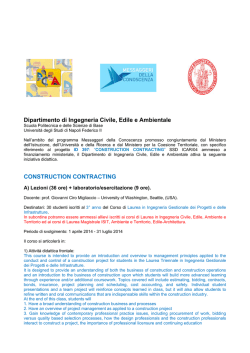
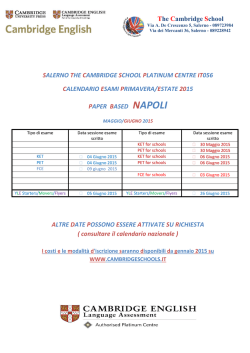
Electronic Journal of Applied Statistical Analysis
EJASA, Electron. J. App. Stat. Anal.
http://siba-ese.unisalento.it/index.php/ejasa/index
e-ISSN: 2070-5948
DOI: 10.1285/i20705948v9n4p716
Italian NSI for the school. A new project to
promote statistical literacy in Italian regions
By Valentini, Carbonara
Published: 15 December 2016
This work is copyrighted by Università del Salento, and is licensed under a Creative Commons Attribuzione - Non commerciale - Non opere derivate
3.0 Italia License.
For more information see:
http://creativecommons.org/licenses/by-nc-nd/3.0/it/
Electronic Journal of Applied Statistical Analysis
Vol. 09, Issue 04, December 2016, 716-735
DOI: 10.1285/i20705948v9n4p716
Italian NSI for the school. A new
project to promote statistical literacy in
Italian regions
Alessandro Valentini∗and Monica Carbonara
Istat
Italian National Statistical Institute
Published: 15 December 2016
A key activity of Istat, Italian NSI, is that of promoting statistical literacy.
In recent years this goal was further strengthened through the constitution
of a network of around 80 experts of the territorial offices and the activation
of proper synergies with the former School of Statistics and Socio-Economic
Analysis (SAES). The most part of the network activities are devoted to
promoting initiatives for the education system (teachers and students). One
of the latest releases of the network is the “community of sharing experiences
between Istat operators and teachers”, a place through which to discuss, share
experiences and identify new approaches to the teaching of statistics across
a process of cooperative intelligence. A particularly promising area of action
is related to the use of virtual reality for the transfer of educational content.
The Territorial Office for Apulia, maintaining and further developing the
main goals of the network, acts synergistic actions of disseminations in many
schools of the region. Tools adopted are mainly those of the educational
packages. Methods of administration are quite innovative. There is a specific
attention to find instruments of linkage between teachers in order to share
educational technology and skills to develop students’ abilities in the area of
calculation, interpretation and graphical representation of data. A further
instrument introduced to guide students towards critical thinking is that of
laboratory. By means of laboratories students of secondary school are able
to follow the entire process of data production, from microdata to methods
of synthesis.
∗
Corresponding author: [email protected]
c
Università
del Salento
ISSN: 2070-5948
http://siba-ese.unisalento.it/index.php/ejasa/index
Electronic Journal of Applied Statistical Analysis
keywords:
717
Statistical literacy, students, teachers, network of experts
1 Introduction
In developed societies the production and dissemination of data grows exponentially
every day. To give a quantitative idea, in 2015 global internet population reached around
3.2 billion of people (https://www.gwava.com/blog/internet-data-created-daily), nearly
20% more than two years ago, a level equivalent to the word’s population in 1960.
Actually, the amount of data created on the internet each day is stinking: 500 million
tweets, more than 4 million hours of content uploaded to YouTube, 4.3 billion Facebook
messaged posted and 6 billion of Google searches. The number of “statistics” produced
grows with similar proportions. The large amount of information available is surely a
sign of progress for democracy, but it is necessary to be aware that the most of data
sources are often uncertain and of very poor quality, so many of the so-called “statistics”
are just numbers with little meaning. It takes much more than in the past the need to
be able to critically think about concepts and arguments, to read, interpret and evaluate
information. According to Linden (2002), this activates the process of finding micro and
macro data at the study, question, and variable levels; the activity of understanding the
‘data life cycle’; browsing websites for finding data; using metadata and codebooks to
evaluate and use data. In a word, it needs to be statistically literate.
Statistical literacy (Wallman, 1993) should not be seen only in the meaning of numeracy, but should be considered, more in general, as the ability to provide a critical analysis
of statistics in terms of both communicating results and (especially) using statistics for
daily life. Statistical literacy is in effect the result of a complex hierarchical construct
(Watson and Callingham, 2003). To win the challenge of promoting statistical literacy
(Gal, 2002; Garfield and Ben-Zvi, 2008) it is necessary to activate systemic actions aimed
at describing the central role of statistics for society. In this scenario of data deluge the
only way to protect and boost the functions of official statistics is to put in place the
most appropriate actions to promote statistical literacy to stakeholders (Beaudoin, 2014)
and to the whole society.
The role of NSI’s is this process is crucial. It is necessary to act a long-term cultural action of great depth. The most important international project (Ferligoj, 2015)
is the International Statistical Literacy Project (ISPL), carried out by the International
Association for Statistical Education (IASE), the education section of the International
Statistical Institute (ISI). The main target groups are citizens, media, educational institutions (secondary school and upper secondary school-age students), universities, research institutions, decision-makers, libraries and national statistical agencies.
In Italy, Istat is member of IASE and has been pursuing the goal of disseminating
statistical literacy for many years. Large-scale promoting initiatives were acted on the
occasion of the two last census rounds: ‘Census at school’ in 2001 (Lombardo and Conti,
2003) and ‘Let’s play at census!’ in 2011 (Da Valle and Valentini, 2013). More in general
at the turn of the new millennium multiple events have been undertaken at central and
at a local level (Istat, 2006; Peci and Sterzi, 2007). More recently (February, 2013)
718
Valentini, Carbonara
actions of Istat along with this direction have been more and more strengthened by
the constitution of the ‘Territorial network of experts in promoting statistical literacy’,
(NPSL) (Cortese and Valentini, 2013; Valentini and Cortese, 2014).
The network is composed by a staff of more than 80 people (working for the project
for around 20% of their times) located in the various Territorial Offices of the institute.
The main role of NPSL components is to design and implement actions, activities and
instruments to support the development of statistical literacy in their different work
districts. NPSL operates in line with the statistical agenda Stat2015 (Baldacci, 2012)
whose main objectives are to standardize and modernize statistical processes. NPSL was
finally able to give a renewed impulse to dissemination actions thanks to its ability to
rationalize and systematize previous experiences, to develop innovations, to encourage
the dissemination of good practices and, last but not least, to spread optimism.
Each component of the network has a dual role: to develop materials and projects
for the entire net; to implement actions for the territory of competence. During 2014,
the network has realized about 350 actions: half of whom (185) directed to the school
system; 16% to universities; 5% to institutions of the Sistan (Italian network of official
statistics); the remaining part to other actors (stakeholders, administrators, whole society). Initiatives were followed by around 20,000 subjects. At the end of each event
participants compiled a feedback questionnaire concerning the initiative. Feedback was
favorable: in the range between 1 and 5 the assessment of teachers, operators of the
Official Statistical System and university students was 4.3; the agreement of students
was 3.5.
Among the activities carried out by the various offices of Istat, the territorial office of
Apulia has developed a specific expertise in two main areas: laboratories for the analysis
of micro data; use of virtual environments. Analysis of microdata were conducted during
the scholastic years 2013/2014 and 2014/2015 for teachers and students of two high
schools1 . Topics were related to: understanding of information content of enquiries;
use of statistical software for reading of datasets and building tables and graphs; data
analysis.
Virtual environments were adopted for their capability to capture the interest of children thanks to the use of scenes created for video games and for entertainment. The
project was carried out jointly with Statland2 , a 3D virtual learning environment dedicated to statistics integrated as a ‘virtual island’ in Techland. Throw Statland it was possible to integrate teaching with innovative information technologies and to show statistics
in a new charming way.
Present paper is structured as follows. The first part (§2) is dedicated to show the
network activities in detail, in terms of both organization and methods of work. A
focus is deserved to specific activities carried out in Apulia. Later (§3) the paper shows
the main results of the promotion activities that took place on the various territories
thanks to the new organizational scheme. Once again, special attention is devoted to
1
Scholastic year 2013/14: 4th class of the Industrial and Technical Institute ‘Ettore Majorana’ located
in Brindisi; Scholastic year 2014/15: 2nd class of the High School ‘Leonardo da Vinci’, located in
Bisceglie
2
Statland was realized by teacher Michelina Occhioni (http://www.virtualscience.it)
Electronic Journal of Applied Statistical Analysis
719
the experiments performed in Apulia. Results emerged are encouraging: the last part of
the work (§4) outlines the network’s activities for the near future as well as some long
term strategies.
2 Method
The goal of enhancing statistical literacy is broadly shared in international scientific
community. Among the projects devoted to reaching this scope, the most popular and
widespread is probably ISPL. Participant countries are about 80 among them Italy:
they communicate one-each other through the website (http://iase-web.org/islp/), a
virtual forum for the exchange of information between those seeking and those offering
tools and projects of promotion. See Sanchez (2008) to analyze some of the successful
statistical literacy programs of government statistical offices. Another worldwide project
is StatLitSite, launched by an independent organization, whose main mission is to present
the statistical literacy as an interdisciplinary activity, related to daily activities. The
portal (www.Stat-lit.org) also offers a vast collection of tools (articles, videos, etc.) of
interest.
Recently, United Nations Commission for Europe produced a guide (Unece, 2012) to
improving statistical literacy of member states. A specific focus is on students, for the
key role they will have in society. Other targets are represented by decision makers,
opinion leaders and the whole society. Strategies are differentiated according the needs
of the different groups.
In Italy, the approach of the territorial network for promoting statistical literacy is
based on the Unece suggestions: segmentation of the target, establishing relationships
with stakeholders, providing statistical training and seminars and so on.
NPSL components operate throughout the country with a complex organization able
to guarantee a multifaceted approach.
2.1 organization of the territorial network
The territorial network for promoting statistical literacy was formally established in
February 2013. The network is integrated in the Development and Coordination of
Territorial Network and National Statistical System Directorate. A full synergy has
been activated with the School of Statistics (SAES) (Peci, 2013; Istat, 2015), devoted
to act promoting activities at a central level. The organizational structure (Figure 1)
of the net is complex because the overall aim of disseminating statistical literacy has to
be reached integrating different types of projects and objectives. Results are guaranteed
thanks to a full synergy between actions of all territorial offices.
Activities are organized in working groups; the continuous coordination between the
components of different territories within each group is achieved through the use of both
web-conference tools (Valentini and Porciani, 2013) and a specific community, active on
the platform of social network of Sistan.
More in detail, long-term strategic objectives of the network are the followings:
720
Valentini, Carbonara
• standardization of approaches and methods: a census of all promotional materials
produced by territorial offices in the last five years was made. More than 300
packages have been acquired and are now easily and freely accessible to all network operators. The most significant materials were standardized in terms of: a)
content, given that instruments are congruent with scholastic programs (national
indications for the study planning); b) language adopted, specific for each kind
of school (from primary to upper secondary); c) format, with thematic folders
organized as dossier. Before the release, materials were tested (in sample schools).
• assessment of actions: each field action is evaluated both internally and externally.
Internal evaluation is subjective; it is based on the judgment of the Istat representative in terms of participation and in terms of ability to activate other actions.
External evaluation is objective and is based on an assessment questionnaire administrated to participants of the various initiatives. Questionnaire is customized
according to the type of participant (student, teacher, public servant and so on).
• dissemination of good practices: many initiatives on the territory are developed as
prototypes by one or more territorial offices. Most interesting projects are exported
to the entire network as new actions. This is for example the case of initiatives in
streaming or the case of courses on specific topics.
• release of learning tools: the network produced and released on the institutional
web-site3 a set of learning materials for students of the three types of schools:
primary schools (ages between 6 and 10); junior high schools (ages between 11 and
13); upper schools (ages between 14 and 18). Materials are periodically updated
and renewed.
In order to maximize the organizational efficiency, a skill gap analysis was realized.
The first step of the analysis was the identification of the proper needs for each working
group. Then an assessment questionnaire was admired to components of NSPL in order
to measure the gap between the skills and abilities needed to play the role expected and
the skills and abilities claimed. Finally, training courses were planned in order to fill the
gap.
Materials and methods introduced are adopted for on field activities by operators of
the network. Actually, targets of dissemination are the followings:
• scholars: target includes children of three types of schools: primary schools; junior
high schools and upper schools;
• teachers: these are the school teachers of various disciplines, and not only of
mathematics. This group is particularly important for the central role among
students;
• university students: this target is included for the key role that a part of those
students will have in society in the next years;
3
http://www.istat.it/it/informazioni/per-studenti-e-docenti/under-21/pacchetti-didattici
Electronic Journal of Applied Statistical Analysis
721
Figure 1: Organization of the network
• administrators: a new core of activity of the network is directed to public administrators, in order to show the central role of statistics for stakeholders and to bring
attention to the key role of Statistical Offices (local hub of Sistan).
Present paper is focused on students and teachers, with potentially more than 3 million
of unit in Italy (around 17% of total population if all components of student’s households
are included). This type of approach presents several elements of innovation, in terms
of both target and method. With reference to the target, newness is represented by
teachers, disregarded in the past. Improvement of the method impacts instead on the
process, on materials and on modes of fruition.
2.2 Projects of Apulia
In order to maintain and develop the coordinative scheme of the network, the Apulia
Regional Office has promoted the use of a variety of educational packs in a large number
of local schools.
It has also set up a new line of activity designed to create, support and nurture a network of teachers who are keen to share educational technology and skills aimed towards
developing student skills in areas such as the calculation, interpretation and graphic
representation of data. The new portal of Sistan, therefore, has set up a community
of teachers ‘The sharing of experiences between Istat and teachers’ in order to foster
dialogue, sharing of experiences and the identification of new approaches to the teaching
of statistics.
The community is organized into three sub-community independent one each other.
The first sub-community contains educational material produced by Istat and collects
722
Valentini, Carbonara
feedbacks on the materials and tools available. The second is a kind of laboratory on
the microdata and allows the exchange of experiences on the acquisition of practical
skills, such as building a database and statistical analysis, using mainly open-source
software. The third sub-community compares the different experiences of transferring
of educational content through the use of virtual environments.
In order to help students in the use of critical analysis in the field of statistics, the
Apulia Regional Office has also experienced an innovative approach in two secondary
schools, starting with micro-data and then following the development of the entire process of producing statistical information. Every day data are produced and collected at
an explosive rhythm and everyone leaves behind a ‘data trail’ simply by using the phone,
participating in a social network or by purchasing online. It therefore becomes crucial
to turn this indistinct mass of data into useful information. Statistics is the instrument
platform privileged to orientate in the world of data, but not intended as specialized technical competence but as critical ability to read data. So, from the data and not from
concepts, the goal was to teach students to use and manipulate the extensive information
available to us every day.
In the school year 2013/2014 the Apulia Regional Office has also developed a project to
promote statistical literacy in schools using virtual environments. Over the past decade,
in fact, virtual worlds, born for video games and for entertainment, are also tested by
schools in order to make it fun and motivating environment for learning science and
mathematics.
Inside the virtual islands of Techland, 3D virtual learning environment dedicated to
mathematics and science, it was realized Statland, a virtual island devoted to statistics.
Using Statland it is possible to follow the paths free or structured explaining the steps
and methods used to perform statistical surveys. It is also possible to interact with
animated learning objects that illustrate the mathematical basis. Platform is accessed
by an avatar in the world that creates and interacts with objects and other avatars. The
mediation of the avatar allows a full immersion in the discipline and interaction with
animated 3D objects makes tangible and viewable even abstract concepts like arithmetic
and geometric.
The objectives are to promote the development of statistical literacy by teachers and
students, to facilitate collaboration between educational institutions and official bodies of
statistics, integrate teaching with innovative information technologies. This tool enables
students to view content through the LIM with the mediation of the teacher, and realizes
‘videolibri’, that are video lessons by the technique of screen capture and, to the student,
to navigate the island interacting remotely with other pupils / avatar.
3 Results
The new organization system and a renewed focus on promoting activities have multiplied dissemination initiatives and the production of materials. There is a strictly
interconnection and a positive synergy between materials and initiatives: in most cases
the cornerstone of an initiative is the use of packages and tools produced by the network;
Electronic Journal of Applied Statistical Analysis
723
in other cases packages are illustrated and disseminated on the occasion of events.
More in detail, to show the main realizations, it is useful to introduce the steps of
the life cycle of a project. Steps are the followings: 1. the project is launched as an
innovation in a certain region; 2. the first event is realized; 3. after a start-up period,
the project is incorporated by the network; 4. events are multiplying on the basis of a
system of viral spread in the region and in other territories. 5. initiatives follow a path of
continuous quality improvement through the assessment system adopted. A specific care
is devoted to all the initiatives, but components of the network pay specific attention
to all the events aimed at the training and involvement of teachers, for their key role in
society.
Activities of the network in Apulia are moving according to general lines of the network
and produce similar results. Below the illustration of the effects of the two main projects:
experiences with microdata and use of virtual realities.
3.1 Materials released and initiatives undertaken by the network
3.1.1 Teaching materials
One of the most important objectives of the network was the release of teaching materials
both for schools and for university student. In this paper the focus is on materials for
schools. Till now, packages released are 27: 10 for primary school; 8 for middle school
and 9 for upper school. Table 1 shows the detailed list of topics covered. As indicated
in Caporrella et al (2014), also taking into account previous experience in the field (Da
Valle and Valentini, 2011), materials are organized in the form of dossiers. Materials are
also translated in German thanks to the cooperation of ASTAT (statistical office of the
autonomous province of Bolzano). Dossiers include: a) an interactive presentation in
Power Point, able to introduce students to the topic; b) a set of exercises (in Excel), and
their answers, structured to be administered through the PC, through the interactive
whiteboard or on paper; c) a note to the teacher with technical insights on the subject.
The packages for upper school are divided into ‘tracks’.
Topics proposed are aligned with new National Indications for school curricula and
with the reference framework adopted for surveys on students’ learning, realized by
INVALSI (Invalsi, 2014). Three new topics (on INVALSI tests, statistical indicators and
statistical processes) have been realized and will be released on the Institutional website
of Istat.
Before the release each package was tested in some schools according to a test-protocol.
Tests includes the feedback of both teachers and students. For instance the three new
topics were tested (in different versions for the various typologies of schools) by 41
teachers, 289 students of middle and upper schools and 528 students of primary school.
Tests are based on a questionnaire with various items concerning the various aspects of
the packages: effectiveness of communication; materials; balancing theory with practice;
integration with the scholastic curricula. Each item is expressed on a Likert scale from
1 (totally disagree) to 10 (totally agree). The average score for teachers was 8.8. The
average score for middle and upper school students was 7.9. The average score of students
724
Valentini, Carbonara
of primary schools was 8.0. Test included the indication of any weaknesses. Criticisms,
if any, are removed before the release.
3.1.2 On field activities
On field activities realized by the network are mainly linked one-each other through a
specific project and are generally replicated in various territories of different regions.
The most important projects activated for students are the followings:
• statistical week: for primary and secondary schools. Students approaches the
themes of statistics in a playful and fun way through a sort of ‘game of the goose’.
The project requires an educational preparatory work done with teachers and
pupils involved. The final game is the result of statistical concepts previously
introduced. The number of participant was of about 300 (in 16 classes);
• statistical open-day: initiative conducted in some high schools as guidance for
students of middle schools. Statistics is presented in the form of game (‘Who
wants to be a statistical?’) and participants have to answer some questions on the
basis of a dossier previously received. Participants were around 500;
• welfare of teenagers: a research project aimed at testing a system able to detect
and ‘measure’ the subjective well-being of teenagers. The first phase of the project
involved the administration of an online questionnaire to students of secondary
schools and a questionnaire to their parents, submitted by students themselves.
Test classes were 10;
• stat.lis-statistics vocabulary of the sign language: implementation of a pilot videolanguage vocabulary in Italian Sign Language (LIS). The project is part of the
information contained in the Convention on the Rights of Persons with Disabilities
UN, to which Italy has joined ratifying with a specific protocol. The pilot project
was developed in collaboration with an institute of higher education and produced,
as first result, two videos in sign language on some basic concepts of statistics
related to indexes of position and variability;
• micro-data experiences: an innovative approach to data for students of upper
schools. Statistical activities starts from the microdata files for public use Istat,
using open-source software. Istat in Apulia is leader of this project. See Par 3.2 for
details. Microdata are drawn from the Istat survey on routes concerning study and
work of graduates (“Indagine Istat sui percorsi di studio e di lavoro dei diplomati”);
• virtual reality for statistics: virtual environments for learning statistics. This experience was completely developed by Istat in Apulia. See below for details;
• promotion performed by students themselves: A group of students is identified
as ‘tutor’ to disseminate statistical literacy toward younger students under the
supervision of the territorial office of Istat. Tutors are university or high school
Electronic Journal of Applied Statistical Analysis
725
students. The potential multiplier effects of these initiatives are very promising
in the light of the establishment of ‘virtual enterprises’ provided by the system of
training introduced by so called ‘Legge sulla buona scuola’.
The principal projects for teachers are instead the followings:
• statistical training for teachers: statistical courses for teachers of all school levels
even often organized with the partnership of universities. Items treated are those of
scholastic programs. The activities are carried out through a mixed methodology:
in presence, streaming, through a specific community. In some cases courses are
associated with experiences of surveys carried out with the help of students;
• Invalsi courses: in Italy, all students of the 2nd and 5th year of primary school, of
the 3rd year of middle schools and of 2nd year of upper School must support the so
called Invalsi tests, aimed at assessing their skills and knowledge in various areas
of Mathematics and Italian. The project of Invalsi courses is deserved to teachers
in order to help them to transfer student appropriate skills to correctly answer the
‘data and forecasts’ area of the Mathematics test. The project was launched with
the cooperation of the Regional Directorate of Ministry of Education and till now
around 300 teachers participated.
On field activities linked to one or more project for disseminating statistical literacy
are continuously monitored through an on line system, whose flow-chart is illustrated in
Figure 2. The first aspect was the monthly planning of the initiative. The second aspect
was the monitoring of achievement throw the filling out of an on line questionnaire.
After the event, materials have to be uploaded in a specific community.
Some of the figures concerning the monitoring system are the followings: more than
95% of events projected were realized, for a total of 484 events in the period between
March 2013 and October 2015. More in detail: 149 (30.8%) in the last 10 months of 2013;
187 (38.6%) during 2014 and 148 (30.6%) in the first 10 months of 2015. The most part
of events (14.5%) were realized in Campania, followed by Abruzzo (8.5%). The quota
of Apulia was of 3.5%. Activities are differentiated one each other by various aspects
but some similarities appear. Table 2 reports in greater detail some indicators. The
most part of projects (more than 50%) are for schools: teachers and students. Within
the various typologies, the most frequent are seminars (32.2%), followed by information
meetings (23.1%) and by formation courses (17.6%). On average, the length of initiatives
depends of the typology. Overall duration of an event was of around 4 hours and 12
minutes: longer (+20 minutes) for laboratory and shorter (- 56 minutes) for conferences
and conventions (- 20 minutes). The number of participants was on average of 75 for
each event, more elevated for conferences (+36) and reduced for Information meeting
(-35) and laboratory (-32).
Half of events were realized by Istat in partnership with other institutions. In most
cases partners are offices of Sistan (36%) and Universities (32%). Interaction with the
word of scholastic directions is instead scarce (10%).
The last component of the monitoring system is that of feedback, both internal (in
terms of agreement of the organizer) and external (customer satisfaction). Internal
726
Valentini, Carbonara
Figure 2: Scheme of the monitoring system
monitoring is based on a questionnaire submitted to the coordinator of the initiative.
The main items are linked to organizational aspects (timing of initiatives; criticisms)
and to the evaluation of the so called ‘multiplier effect’ (δ), that is the number of events
generated starting from a preceding event. In order to calculate δ the questionnaire
includes some items on the linkage between the various events. For a certain period δ
is equal to the ratio between the number of links and the number of primal events. On
average δ=0.65. This means that 100 primal events generate 65 new events. The highest
pick is for laboratory (δ=0.79), the lower for conference/convention (δ=0.11).
A subgroup of events (20.1%) was subjected to a deeper analysis. Participants received
a customer satisfaction questionnaire in order to assess the whole initiative and the
various aspects of it (fulfil expectations; treatment of arguments; interest in deepening
the topics and so on). The total number of questionnaire sent was of 1,736: 35.8%
were sent to students, 30.6% to university students, 30.2% to teachers and 3.3% to
other subjects. The most common typology of event was Information meeting (38.1%),
followed by Conference/Convention (23.2%). Answer rate to questionnaires was 66.2%.
Items are expressed on a Likert scale from 1 (totally disagree) to 10 (totally agree).
On average, the agreement of initiatives was 8.6 for teachers and components of Sistan,
8.4 for university students and 7.0 for students. Criticisms of students are mainly linked
to the ignorance of the argument and to differences between expectation and training
Electronic Journal of Applied Statistical Analysis
727
received. This aspect requires some attention, in fact it is not related to efficiency of
activities, or at least it is not directly linked to this. The scope of initiatives effectively
is to promote statistical literacy and is not teaching statistics: probably this is not very
clear to students.
3.2 Results of Apulia
The two main project of Apulia are those concerning micro-data experiences and virtual
reality for statistics.
The experimental project with microdata was realized with students of two high
schools. The first step was to make students able to understand what are the microdata
and where to find them and the role of metadata, i.e. information of a qualitative and
/ or quantitative terms relating to methods of production of micro-data themselves.
The students of the first school worked on the microdata files for public use Istat survey
on routes of study and work of graduates, freely downloadable from Istat, in full respect of
the rules for the protection of confidentiality (http://www.istat.it/it/prodotti/microdati).
This is a sample survey every three years, made with CATI (Computer Assisted Telephone Interviewing) and conduct of a single lever of students surveyed about four years
after graduation (26.603 interviews). Through the survey are detected various other information: the results of schooling, the opinions on the school experience, further study,
the inclusion in the labor market and job characteristics found. The students learned
about the methodology of the survey selected, the survey questionnaire and to read the
record layout (Figure 3).
Figure 3: Questionnaire (left) and record layout (right) of ‘Indagine Istat sui percorsi di
studio e di lavoro dei diplomati’
From the list of all the available statistical packages with free license on the network,
for reading the file and its import was chosen software PSPP. It is a free software and
open source platform that runs on any computer and with different operating systems
728
Valentini, Carbonara
(GNU / Linux, Mac OS X, FreeBSD, Windows) and is aimed at particular statistics,
sociologists and students who require data analysis. With PSPP it is possible to perform
descriptive statistics, T-tests, linear regression and non-parametric tests. The motor is
designed to perform the analysis as quickly as possible, regardless of the size of the input
data. You can use PSPP with its graphical interface or through traditional commandline syntax. Through software PSPP, students have learned how to import the file, read
the data set and analyze the data (Figure 4 and Table 3). At the end of the project the
students have made a report of the survey results and a video explaining the experiment
carried out.
Figure 4: Adoption of PSPP: Importing files (left) and reading of the data set (right)
The project has been replicated in the school year 2014/2015 with a class of another
school analyzing the data of the PISA (Programme for International Student Assessment) promoted by the Organization for Cooperation and Development (OECD) every
three years to ensure the skills of fifteen-schooled. The reference population is made
up of the fifteen-schooled since the age above, in most OECD countries, the term of
compulsory education. Attention is focused on the extent to which students are able to
use the skills acquired during their school years to address and solve problems and tasks
encountered in everyday life and to continue learning in the future (lifelong learning).
The survey, to collect information about context variables, using three questionnaires, respectively addressed to students, school administrators and parents, in order to interpret
the data of the cognitive tests in relation to the school context, family and socio-cultural
circumstances of students.
The analysis was conducted on data from Apulia collected from the questionnaire
for students (Figure 5 shows the questionnaire and an example of frequency table with
PSPP).
The second project realized is that of exploring virtual environments for learning
statistics. Specifically has been given methodological-statistical support for the implementation of Statland, an ‘island’ of statistics made in OpenSim virtual world. The
island was useful to create a 3D statistical learning.
Statland is divided into four sections that reflect the main stages of the statistical
Electronic Journal of Applied Statistical Analysis
729
Figure 5: Survey Ocse-Pisa 2012: Questionnaire (left) and an example of frequency table
with PSPP (right)
survey: design, collection, processing and representation. The interactive 3D objects
are activated at a click of the mouse, the information is displayed in chat as notes or as
retractable panels.
The avatar acts as a kind of virtual assistant interact with objects without compromising the function of mediator of the teaching faculty. Each student has access to the
virtual world through their avatars, build objects or follow the personalized learning
paths. The ability to communicate with other avatars in chat or voice also promotes
collaboration at a distance. Figure 6 shows the virtual worlds of Statland.
4 Directions for future work
In recent years Istat, Italian NSI, is becoming increasingly aware that promotion of
statistical literacy has to be referred not only to actions of numeracy, but also to a wider
concept. In particular it is crucial to spread the idea that statistic is a useful tool for
everyday life, a worthwhile help to make decisions for personal or professional use. A
boost of effort in promoting activities becomes more and more urgent at the light of the
growing data deluge, mainly caused by technological evolution. The recent constitution
of the ‘Territorial network of experts in promoting statistical literacy’ moves towards
this direction.
Among the elements that constitute the basis of the network, the most important is
probably the full interaction and integration between centralized approaches and local
initiatives. Each regional tie of the net is able to receive requests from the Italian school
system and to answer taking into account both the local expertise and methods and
materials produced by the all network. Effectively the logic underlying is that effects
of dissemination are more widespread taking advantage of the many local experiences
730
Valentini, Carbonara
Figure 6: Virtual worlds of Statland
successfully tested in different geographical contexts. Each new and useful act is incorporated in the network, standardized and released in order to follow a viral diffusion
process.
The strengths of this system are represented by the interaction with schools. The focus
is on both students and teachers. For children and teenagers the key to the success of
promoting initiatives is to replicate experiences of Apulia in terms of treatment of microdata and use of virtual world in education. With specific concern to micro-data, all the
practices directed towards the creation of surveys and analyses of data are the welcome
and should be encouraged and supported. A greater experience in the use of virtual
realities for statistics allows to catch the interest of students in statistical disciplines. In
the meanwhile this permits to share experiences and collaboration at a distance with
other students/avatars.
A full interaction between Istat and teachers guarantees long-term results and multiplicative effects in actions devoted at promoting statistical literacy in classes. The
most important actions are those of education/training not only on teaching of statistical theory, but especially in the use of statistics as an instrument to better read and
interpreter reality. For this goal training courses should also include statistical sources
and the use and treatment of micro-data. A further support to the community of teacher
should be another vehicle to recognize their role, to share experiences with others, and
to experiment new approaches with statistics.
Another keystone for the increasing of disseminating activities is the strengthening of
promoting activities for the university system according to a double way: the release
of teaching materials, whose items are defined on the basis of a recent recognition of
training needs, and the planning of seminars on official statistics.
Electronic Journal of Applied Statistical Analysis
731
At present, the concrete realization of initiatives depends on bilateral agreements
between territorial offices of Istat and individual schools or university departments. The
idea for the next future is the signature of memorandum of understanding between
Istat and the Italian Ministry of Education. From the memorandum should descend
a homogeneous approach to all schools, universities and teachers. The standardization
and the generalization of the approach will allow strong economies of scale.
Finally, another challenge of Italian NSI is the new theme of alternation between school
and work and the eventual chance to make use of “simulated enterprises” in training in
order to allow students to train younger pupils. The revision of legislative and regulatory
limits should actualize these new opportunities.
732
Valentini, Carbonara
Table 1: Teaching materials for schools:topics covered and number of packages
Type of school
Topics covered
Primary school
ABC of statistics:
- One-way frequency tables
- Two-ways frequency tables
- Pictogram
- Bar charts
- Mode
- Mean
- Exercises
First steps to discover statistics:
- Let’s know Istat activities
- The work of statistician
Let’s play statistics
Middle school
Let’s read reality through statistics:
- Base statistics
- Figures
- Tables
- Variability
Travel to discover statistics:
- History of statistics
- Istat activities
- Statistical enquiries
The probability
Upper school
Introductory course to the official statistics:
- Istat activities
- Statistical enquiries
- Data diffusion
Course on statistics and the labor market
Course on the representation of data:
- Tables
- Figures
- Age pyramids
Course on the questionnaire:
- Goals of the questionnaire
- Administering methods
Electronic Journal of Applied Statistical Analysis
733
Table 2: Summary report of the events realized by the network. Years 2013-2015
Recipients
Category
%
Students
Teachers
Teachers and students
Primary school
Middle school
Upper school
University students
Component of Sistan
Mixed
General public
Total
3.3
6.5
5.9
11.4
3.6
27.0
19.9
10.7
4.9
6.8
100.0
Type of event
Category
%
Conference
Convention
Formation
Information meeting
Laboratory
Seminar
Other
Total
3.3
7.8
17.6
23.1
14.0
32.2
2.0
100.0
Year
Category
2013
2014
2015
Total
%
30.8
38.6
30.6
100.0
Table 3: An example of table with PSPP
High school certificate:
Vocational training
Technical specialization
Classical degree
Science degree
Language specialization
Value
Frequency
%
Valid %
Cum %
1
2
3
4
5
1,681
2,326
2,043
1,366
968
20.05
27.74
24.37
16.29
11.55
20.05
27.74
24.37
16.29
11.55
20.05
47.79
72.16
88.45
100.00
734
Valentini, Carbonara
References
Baldacci, E. (2012). Un 2012 ricco di novitá: verso il modello Stat2015. NewsStat, 4
Beaudoin, G. (2014). Meeting the information needs of news media to increase citizens’ understanding of statistical findings. Paper presented at Work Session on the
Communication of Statistics, UNECE
Caporrella, N, et al.(2014). A proposal by Istat to support the teaching of statistics
in primary school. Poster presented at the9ht International Conference on Teaching
Statistics, 13-18 July 2014, Flagstaff, Arizona
Cortese, P.F. and Valentini, A. (2013). Cultura statistica sul territorio, nuove modalita’
e nuovi attori. NewsStat, 9:p.13
Da Valle, S., Valentini, A. (2011). How to increase statistical literacy in primary schools:
the proposal of Istat in Tuscany. ’Statistics in the 150 years from Italian Unification’,
Quaderni di Dipartimento di Scienze Statistiche, Serie Ricerche 2011, n.2 Alma Mater
Studiorum Universit di Bologna, pp 34-35
Da Valle, S., Valentini, A. (2013). Giochiamo al Censimento! Una proposta dell’Istat
per la promozione della cultura statistica nelle scuole primarie e secondarie di primo
grado. Induzioni, 45, 2012, pp. 67-77
Ferligoj, A. (2015). How to Improve Statistical Literacy? Metodoloki zvezki, Vol. 12,
No. 1, 2015, 1-10
Gal, I. (2002). Adults’ statistical literacy: Meanings, components, responsibilities. International Statistical Review, 70, pp. 1-51
Garfield, J., Ben-Zvi, D. (2008). The challenge of developing statistical literacy, reasoning, and thinking. Kluwer academic publisher
Invalsi (2014). Rilevazioni nazionali sugli apprendimenti 2013-2014 Rapporto tecnico
Istat (2006). Il valore dei dati Istituto Nazionale di Statistica, Roma
Istat (2015). Piano per la Promozione e lo Sviluppo della Cultura Statistica 2015 Internal
document, deliberation n. 81/DGEN 2015
Linden, J. (2002). Finding, evaluating and using numeric data Paper presented at
IASSIST 2002 Conference, Storrs, Connecticut
Lombardo, E, Conti, C. (2003). Il Censimento a scuola in Italia nel 2001: un tentativo
di diffondere la cultura statistica Induzioni, 26, 2003, pp. 53-63.
Peci, M. (2013). La scuola superiore di statistica dell’Istat al servizio delle scuole Induzioni, 45 (2012): 117-120
Peci, M., Sterzi, R. (2007). L’attivitá sul territorio dell’Istat per la scuola. Istituto
Nazionale di Statistica
Sanchez, J. (2008). Government statistical offices and statistical literacy. ISPL
Unece (2012). Making data meaningful. Part 4 : A guide to improving statistical literacy,
United Nation Economic Commission for Europe. Unece, Geneva
Valentini, A., Cortese, P. F. (2014). Il nuovo approccio alla promozione della cultura
statistica da parte della rete territoriale Istat. Induzioni, 48, 1: 79-93
Electronic Journal of Applied Statistical Analysis
735
Valentini, A., Porciani, L. (2013). La web conference a supporto delle reti di rilevazione.
Istat Working Papers, n. 8/2013
Wallman, K. K. (1993). Enhancing Statistical literacy: Enriching Our Society. Journal
of the American Statistical Association, Vol 88, no 421
Watson, J.M. and Callingham R.A. (2003). Statistical literacy: A complex hierarchical
construct. Statistics Education Research Journal, 2(2): 3-46.
© Copyright 2026 Paperzz