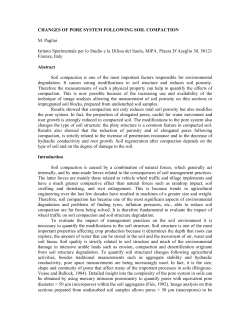
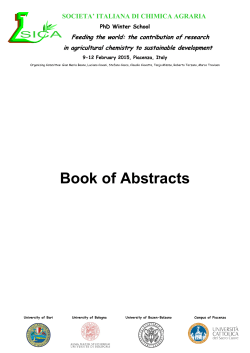
Relationships between soil properties, erodibility and hillslope features in
Central Apennines, Southern Italy
C. ColomboA, G. PalumboA, P. P. C AucelliB, A. De AngelisC and C. M. RosskopfC
A
Dipartimento di Scienze Animali, Vegetali e dell’Ambiente, Università del Molise, Via De Sanctis 86100 Campobasso, Italy,
Email [email protected]
B
Università degli Studi di Napoli “Parthenope” - Dipartimento di Scienze per l'ambiente ,Centro Direzionale Isola C/4 - 80143
Napoli, Italy.
C
Dipartimento di Scienze e Tecnologie per l’Ambiente e il Territorio, Università del Molise, C.da Fonte Lappone - 86090 Pesche
(IS), Italy.
Abstract
Soil erosion is one of the main environmental problems in the Mediterranean area. This problem is becoming
even more important especially in the central Apennines, where several erosive processes, frequently
favoured by intensive land use, occur due to the action of concentrated running water in few hours. To
investigate on the relationships between soil characteristics and local morphologic-topographical features, a
study was carried out in the southern part of Italy which is located in Molise region within the middle little
valley (Trigno River). In the study area, a systematic sampling of topsoil was performed to evaluate by
means of geostatistical techniques the relationships between soil erodibility and superficial soil structure,
texture and organic matter content. The results show clear evidence about the relation between the topsoil
characteristics and morphometric indexes. In particular, the differences in topsoil erodibilty appear to be
directly related to slope morphology and to the specific morphodynamic features. The observed relationships
reflect the possibility to better evaluate both the soil erodibility factor (K) used within the USLE equation
and the spatial variability of physical and chemical soil characteristics on the basis of digital terrain analyses,
and so better predict soil loss rates.
Key Words
Rainfall erosion, USLE Equation, soil erodibility factor.
Introduction
The progressively increasing exploitation of agricultural areas and the ongoing climate changes are largely
favouring soil loss related on particular to the action of running water. As the susceptibility of soils to
erosion depends on the complex interactions between geologic-environmental parameters and soil features,
(which are also affected by modifications just due to the acting erosive processes), it appears particular
important to ascertain their spatial variability in relation to slope features and local relief. Predictive methods
to reliably estimate soil erodibility are generally based on the analysis of spatial variability of a few soil
properties, such as soil structure, soil texture and organic matter content (Wischmeier and Smith 1978).
Statistical methods such as kriging interpolation have been widely used in spatial prediction of physical and
chemical soil parameters (Castrignanò et al. 1998; Diodato and Ceccarelli 2004). The effects of erosive
processes on soil features and their consequent spatial distribution in relation to local morphologic and
morphometric slope features, can be observed along a soil “catena” located along the slope profile
(Birkeland 1999). On the basis of such considerations, to estimate on particular the relationships between soil
features and erodibility, type and distribution of erosive processes and local slope features, a large-scaled
analysis was carried out in a small test area located in southern of Italy (Molise) which is drained by the Rivo
torrent. Within the test area, two soil "catena" have been developed to determine the main soil characters
along an alignment crossing different morphologic slope units which are distinguished with reference to
specific dominant erosive phenomena. Then, spatial statistical procedures were applied for spatial prediction
of soil erodibility factor K (Wischmeier and Smith 1978) using the K topsoil sample values.
Methods
The studied area
The selected test area (about 2.67 km2) has a test plot station for soil erosion measuring several climatic
parameters, as well as soil erosion rates and liquid discharges in relation to different land cover (Aucelli et
al. 2006a, 2006b). The geological substrate is made of clayey and marly-arenaceous rocks characterized by
low permeability, above which mainly Vertisols and Inceptisols showing outstanding vertic characteristics
have developed. Climate is characterized by mean annual rainfall and temperatures ranging respectively
© 2010 19th World Congress of Soil Science, Soil Solutions for a Changing World
1 – 6 August 2010, Brisbane, Australia. Published on DVD.
117
between 650 mm and 800 mm and 5° and 30°. Agriculture and pasture are the main economic activities.
From a geomorphological point of view the study area shows a remarkable variety of hillslope forms and
erosive processes, resumed on a map which classifies the whole territory into seven morphodinamic unit.
Pedological sampling
Ten soil profiles were samples along a 1.7 km long transect which defines two soil catenae extending from
the valley. For each profile a detailed fact sheet was compiled. Moreover, soil samples taken from the main
diagnostic horizons were subjected to physical and chemical laboratory analyses to the aim to classify the
sampled soils according to FAO (2006). Systematic topsoil sampling was carried out on the basis of a net of
sampling points (located at regular distances of about 300 m each one from another) in order to characterize
the upper, about 20 cm thick, soil portion. Furthermore, also the spatial distribution of superficial bulk
density and calcium carbonate content was analysed, as they can be considered good indicators of
accelerated topsoil erosion.
Soil erodibility factor estimation
The values of the soil erodibility factor K of the topsoil samples were calculated using the following formula
of Wischmeier and Smith (1978):
Ks = 2.1*10-4 (12-OM) M1.14*3.25(S-2) +(2.5(P-3)/7.59*100
(1)
where K is expressed in t•ha•h/h•MJ1.14•mm, OM represents the organic matter content (%), M defines the
relations between percentages of silt, very fine sand and clay content (% silt + % very fine sand) (100 - %
clay), S represents the soil structure code and P the permeability class. Spatial variability of the five examined
parameters was evaluated by means of a geo-statistical analysis. The results were then compared to the spatial
distribution of soil types and that of the morphodynamic units and, at last, to several morphometric parameters
which were automatically extracted by a high resolution (5 m) Digital Terrain Model (DTM).
Results
The study area is characterized by ten different soil types. Figure 1 shows the pedological section, some
basic soil characteristics are detailed in Table 1. The dominant soil types are Grumic Vertisols (some
Calcaric) which represent about 60-70% of the test area.
PR OFILE
PSN4
850
PSN9
PSN6
PSN1
800
ELEVA TIO N
PSN11
750
PSN5
PSN7
PSN2
PSN8
PSN3
700
U. A
U. A
U. Al
650
U. B
U. B
U. C
600
U. C
550
0
200
400
600
800
1000
1200
1400
1600
1800
2000
DIST ANCE
Figure 1. Topographic profile along the catena with indications about the location of soil profiles. Distances and
elevations are expressed in meters. PSNx: soil profile code; Ux: morpho-dynamic unit.
All soil types have an organic matter content of less than 5.7% and most of them are poorly drained. Field
and laboratory analyses showed that the soils along the transect can be classified as Grumic Mollic Vertisols
(clayey and up to 1.5–2 metres thick, well structured, deeply fissured and characterised by a moderately deep
calcic horizon), Vertic Calcisols (about 1 metre thick, with a superficial calcic horizon) and Leptosols (very
thin soils with a massive structure and a strong sandy texture). Analyses of soil profiles along the catena have
shown very clearly that the position of the profile on the slope, as well as type and intensity of local
dominant hillslope processes acting there, are crucial for the development of diagnostic physical and
chemical characteristics of soils. Spatial variability of the five examined parameters was evaluated by means
of a geo-statistical analysis. The results show important correlation between their spatial distribution, soil
types and he morphodynamic units. The soil erodibility map derived using a kriging interpolation is shown
in Figures 2a and b.
© 2010 19th World Congress of Soil Science, Soil Solutions for a Changing World
1 – 6 August 2010, Brisbane, Australia. Published on DVD.
118
Table 1.
Profile
code
PSN4
PSN1
PSN2
PSN3
PSN8
PSN7
PSN6
PSN11
PSN10
PSN5
a)
Some basic physical and chemical characteristics of soil profiles.
FAO soil classification
Depth Elevation Slope Lithology
(cm)
(m)
(°)
(2006)
Grumic MollicVertisols
210
739
0.38
AC
Grumic Vertisols
160
723
4.59
AC
Grumic Vertisols
125
713
4.90
AC
Grumic Vertisols
120
688
15.35
AC
Vertic Calcisols
45
703
16.90
CMC
Grumic Mollisols
260
702
6.50
APC
Grumic Vertisols Calcaric
150
715
16.30
AC
Haplic Cambisols Calcaric 160
740
11.50
APC
Haplic Cambisols Calcaric 210
746
11.50
APC
Haplic Leptosols Calcaric
45
763
3.90
APC
Cracks
(cm)
> 10
> 10
> 10
> 10
3-5
6-10
> 10
> 10
3-5
SOM
(30cm)
2.5
1.8
2.1
2.1
5.7
2.3
3.1
1.3
1.4
2.2
Clay
30cm (%)
65
61
60
58
41
21
45
26
21
13
b)
Figure 2. Location of topsoil samples within the test area a) and spatial interpolation of the K factor b),
calculated by the formula of Wischmeier and Smith (1978).
The determined K values range from 0.01 to 0.085 t•ha•h/h•MJ•mm. The soil erodibility map shows
significant differences of K values between the various examined soil profiles which depend on local soil
variability. The spatial distribution of the K factor basically confirms that some of the chemical and physical
properties of topsoils are clearly linked to the spatial distribution of certain morphometric indexes.
Conclusions
The results of the study encourage to develop methods and techniques to quickly and economically derive
from DTMs some important soil characteristics whose estimate generally requires a lot of time and
resources. The preliminary results will be useful for a more precise evaluation of the parameter K (soil
erodibility factor) of the USLE equation and a better prediction of soil loss, and suggest important
relationships between local geologic-environmental conditions, erosive phenomena, soil features and soil
degradation.
References
Aucelli PPC, Caloiero T, De Angelis A, Gaudio R, Rosskopf CM (2006°) Analisi del rapporto afflussideflussi in alcuni piccoli bacini idrografici molisani impostati su litologie a forte componente politica
(Italia meridionale) attraverso la misura diretta e la modellizzazione. In ‘Proceedings of the final
workshop of the PRIN 2002 project’ “water erosion in Mediterranean environment: direct and in direct
assessment in test areas and catchments” pp. 145-157. (Brigati: Geniva).
Aucelli PPC, De Angelis A, Colombo C, Palumbo G, Scarciglia F, Rosskopf CM (2006b) La stazione
sperimentale per la misura dell’erosione del suolo di Morgiapietravalle (Molise, Italia): primi risultati
sperimentali. MIUR PRIN/COFIN 2002. In ‘Proceedings of the final workshop of the PRIN 2002
© 2010 19th World Congress of Soil Science, Soil Solutions for a Changing World
1 – 6 August 2010, Brisbane, Australia. Published on DVD.
119
project’. “water erosion in Mediterranean environment: direct and in direct assessment in test areas and
catchments”. pp. 87-104. (Brigati: Geniva).
Birkeland PW (1999) ‘Soils and Geomorphology’. (Oxford University Press: New York).
Castrignano A, Mazzoncini M, Giugliarini L (1998) Spatial characterisation of soil properties. Advances in
Geoecology 31, 105–111.
De Angelis A (2007) Analisi quantitative dei processi erosivi di versante nei bacini idrografici a forte
componente pelitica. PhD thesis, University of Molise.
Diodato N, Ceccarelli M (2004) Multivariate indicator Kriging approach using a GIS to classify soil
degradation for Mediterranean agricultural lands. Ecological Indicators 4, 177–187.
FAO (2006) ‘A framework for international classification, correlation and communication’. (IUSS Working
Group WRB). World Soil Resources Reports No. 103. (FAO: Rome).
Wischmeier WH, Smith DD (1978) ‘Predicting rainfall erosion loss: a guide to conservation planning,
Handbook No. 537’. (USDA, Agricultural Research Service: Washington DC).
© 2010 19th World Congress of Soil Science, Soil Solutions for a Changing World
1 – 6 August 2010, Brisbane, Australia. Published on DVD.
120
© Copyright 2026 Paperzz