Cumulated sum of squares statistics
for non-linear and non-stationary regressions
Vanessa Berenguer-Rico and Bent Nielseny
03 August 2015
Abstract
We show that the cumulated sum of squares test has a standard Brownian bridge-type
asymptotic distribution in non-linear regression models with non-stationary regressors. This
contrasts with cumulated sum tests which have been studied previously and where the asymptotic distribution involves nuisance quantities. Through simulation we show that the power is
comparable in a wide of range of situations.
Keywords: Cumulated sum of squares, Non-linear Least Squares, Non-stationarity, Speci…cation tests.
JEL classi…cation: C01; C22.
1
Introduction
An increasing range of non-linear models with non-stationary regressors are available in the literature. We show that the speci…cation of such models can be investigated with ease using a cumulated
sum of squares test with a standard Brownian bridge asymptotic distribution.
The Brownian bridge asymptotic result of the cumulated sum of squares test has been derived
in a linear model framework with stationary and non-stationary regressors, see for instance Brown,
Durbin and Evans (1975), McCabe and Harrison (1980), Ploberger and Krämer (1986), Lee, Na
and Na (2003), or Nielsen and Sohkanen (2011). In this paper, we …rst provide a set of general suf…cient assumptions for the Brownian Bridge result to hold. Then, we show that these assumptions
are satis…ed in several di¤erent scenarios dealing with non-linear regression functions involving
stationary or non-stationary regressors. In contrast, cumulated sum tests based directly on the
residuals rather than on their squares have a more complicated asymptotic theory with nuisance
terms when the regressors are nonstationary, see Hao and Inder (1996), Xiao and Phillips (2002),
Kasparis (2008), Choi and Saikkonen (2010) or Berenguer-Rico and Gonzalo (2014).
The paper is organized as follows. In Section 2, the model and test statistics are put forward.
Sections 3 and 4 provide, respectively, high-level and medium-level sets of su¢ cient assumptions for
the Brownian bridge result. Section 5 shows that the assumptions in Sections 3 and 4 are satis…ed
in various non-linear models. In Section 6 the performance of the test in terms of size and power
is investigated through Monte Carlo experiments. The proofs follow in an Appendix.
2
Model and statistics
Consider data (y1 ; x1 ); : : : ; (yn ; xn ) where yt is a scalar and xt is a p-vector. Consider the non-linear
regression model
yt = g(xt ; ) + "t
t = 1; : : : ; n;
(2.1)
y
Department of Economics, University of Oxford, Mans…eld College, and Programme for Economic Modelling.
Department of Economics, University of Oxford, Nu¢ eld College, and Programme for Economic Modelling.
1
2
where the functional form of g is known. The innovation "t is a martingale di¤erence sequence with
respect to a …ltration Ft with zero mean, variance 2 and fourth moment '2 = E"4t (E"2t )2 , the
regressor xt is a p-vector Ft 1 -adapted, and the parameter is a q-vector varying in a parameter
space
Rq . The model is a conditional mean model where any unmodelled autocorrelation or
correlation between "t and xt will be regarded as misspeci…cation.
The non-linear least squares estimator ^n of is the minimizer of the least squares criterion
Qn ( ) =
n
X
t=1
g(xt ; )g2 :
fyt
(2.2)
The least squares residuals based on the full sample estimation are then "^t;n = yt
The cumulated sum of squares statistic, is de…ned as
!
t
n
X
1
1
tX 2
2
CU SQn =
max p
"^s;n
"^s;n ;
'^n 1 t n n
n
s=1
g(xt ; ^n ):
s=1
where the standard deviation estimator can be chosen as, for instance,
!2
n
n
1X 4
1X 2
2
'^n =
"^t;n
"^t;n :
n
n
t=1
t=1
We will argue that under quite general assumptions,
D
CU SQn ! sup Bu0 ;
0 u 1
where Bu0 is a standard Brownian bridge. Billingsley (1999, pp. 101–104) gives an analytic expression for the distribution function. In particular, the 95% quantile is 1.36; see Koziol and Byar
(1975, Tab. 1).
We also consider a recursive cumulated sum of squares statistic, where the model (2.1) is
estimated recursively. Then de…ne the recursive statistic
!
t
n
X
X
t
1
1
"^2s;t
"^2s;n :
RCU SQn =
max p
'^n n0 t n n
n
s=1
s=1
If the sequence of estimators ^n converges strongly, we can show that also
D
RCU SQn ! sup Bu0 :
0 u 1
3
Results under High Level Assumptions
We start by proving the Brownian bridge results under a set of high level assumptions to the
residuals and martingale di¤erence innovations.
Assumption 3.1 Suppose ("t ; Ft ) is a martingale di¤ erence sequence with respect to a …ltration
Ft ; that is "t is Ft -adapted and E("t jFt 1 ) = 0 a:s:; so that
(a) E("2t jFt 1 ) = 2 a:s:;
4 jF
2
(b) E("4t
t 1 ) = ' a:s:;
(c) supt E("t jFt 1 ) < 1 a:s: for some > 4:
The …rst result shows that the tied down cumulated sum of squared innovations converges to
a Brownian bridge. This follows from the standard functional central limit theorem for martingale
di¤erences, see for instance Brown (1971).
3
Theorem 3.1 Suppose Assumption 3.1 is satis…ed. Let Bu0 be a standard Brownian bridge. Then,
as a process on D[0; 1], the space of right continuous functions with left limits endowed with the
Skorokhod metric,
!
n
1X 2 D
"t ! 'Bu0
n
t=1
!2
n
1X 2
D
"t
! '2 :
n
[nu]
1 X 2
p
"t
n t=1
n
1X 4
"t
n
t=1
u 2 [0; 1];
t=1
We would like to formulate similar results for the cumulated sum of squared residuals. This
can be done as long as the squares of residuals and innovations are close. We formulate this as two
assumptions.
Assumption 3.2 max1
Assumption 3.3 n
1
t n
n
Pn
"4t
t=1 (^
1=2
Pt
"2s;n
s=1 (^
"2s ) = oP (1):
"4t ) = oP (1):
We will later show that Assumptions 3.2 and 3.3 are satis…ed in a wide range of situations.
Under these assumptions we then have the following result.
D
Theorem 3.2 If Assumptions 3.1, 3.2, 3.3 are satis…ed then CU SQn ! sup0
u 1
Bu0 :
For the recursive version of the result we need to strengthen Assumption 3.2.
Assumption 3.4 max1
t n
n
1=2
Pt
"2s;t
s=1 (^
"2s ) = oP (1):
D
Theorem 3.3 If Assumptions 3.1, 3.3, 3.4 are satis…ed then RCU SQn ! sup0
u 1
Bu0 :
For a linear model it is possible to analyze Assumptions 3.2, 3.3 and 3.4 directly. In this
way Nielsen and Sohkanen (2011) consider the case of the linear autoregressive distributed lag
model with non-stationary (possibly explosive) regressors. Their Lemma 4.2 and Theorem 4.5
show that Assumptions 3.3 and 3.4 are satis…ed under the martingale di¤erence Assumption 3.1.
For non-linear models it is useful to formulate a set of intermediate level assumptions that imply
Assumptions 3.2, 3.3 and 3.4. We do this in the following.
4
Intermediate Level Results
In the non-linear regression model (2.1) we can replace the high level Assumptions 3.2 and 3.3 by
local consistency of ^n and smoothness of the criterion function.
Assumption 4.1 Let
< 1=4: Suppose Nn;10 ( ^n
0)
is either (a) oP (n ) or (b) o(n ) a:s:
The normalization Nn;10 allows both stationary and non-stationary regressors. In linear models
Nn;10 = n1=2 for stationary regressors and Nn;10 = n for random walk regressors. In more general
cointegrated models Nn;10 may be block diagonal with di¤erent normalizations in di¤erent blocks,
see Kristensen and Rahbek (2010). In non-linear models the normalization may depend on the
parameter under which we evaluate the distributions. We use the notation 0 to emphasize this
choice of parameter.
The following smoothness assumption involves normalized sums of the …rst two derivatives of
the known function g with respect to : These are the q-vector g(x
_ t ; ) = @g(xt ; )=@ and the q q
0
square matrix g•(xt ; ) = @g(xt ; )=@ @ . We will need a matrix norm. In the proof we use the
spectral norm, but at this point any equivalent matrix norm can be used.
4
Assumption 4.2 Suppose xt is Ft 1 -measurable and g(xt ; ) is twice di¤ erentiable with respect to
: Let < 1=4 be the consistency
rate in Assumption 4.1 and let > 0: Suppose
Pn
(a) sup :jjN 1 ( 0 )jj n
g(xt ; 0 )g2 = oP (n1=2 );
t=1 fg(xt ; )
n; 0
Pn
(b) sup :jjN 1 ( 0 )jj n
g(xt ; 0 )g4 = oP (n);
t=1 fg(xt ; )
n; 0
P
0
(c) nt=1 jjNn;
g(x
_ t ; 0 )jj2 = OP (n1 2 ) for some > 0;
0
Pn
0
(d) t=1 jjNn;
g•(xt ; 0 )Nn; 0 jj2 = OP (n1 4 ) for some > 0;
0
Pn
0
(e) sup :jjN 1 ( 0 )jj n
g (xt ; ) g•(xt ; 0 )g Nn; 0 jj2 = OP (n 4 ):
t=1 jjNn; 0 f•
n; 0
Finally, we need some technical conditions to ensure invertibility of certain matrices.
P
Assumption 4.3 Suppose inf[n : nt=1 wt wt0 is invertible] < 1 a:s: for wt = g(x
_ t ; 0 ) and wt =
vecf•
g (xt ; 0 )g with the convention that the empty set has in…nite in…mum. Moreover, suppose
Nn;10 = O(n` ) for some ` > 0:
We can now show that Assumptions 3.2, 3.3, 3.4 are satis…ed. Subsequently, we return to a
discussion of the assumptions.
Theorem 4.1 Assumptions 3.1,4.1(a),4.2,4.3 imply Assumptions 3.2,3.3 so Theorem 3.2 applies.
For the recursive cumulated sum of squares statistic we require strong uniformity properties.
If the estimator is strongly consistent we can get that uniformity from Egorov’s Theorem, see
Davidson (1994, Theorem 18.4).
Theorem 4.2 Assumptions 3.1,4.1(b),4.2,4.3 imply Assumptions 3.3,3.4 so Theorem 3.3 applies.
P
"2s;n "2s ) through a martingale decomposition. Noting that
In the proof we analyze n 1=2 ns=1 (^
"^s;n "s = rg(xs ; ^n ) = g(xs ; ^n ) g(xs ; 0 ) and expanding (" r)2 "2 = 2"r + r2 we get
n
1=2
n
X
(^
"2s;n
s=1
"2s )
=
2n
1=2
n
X
s=1
"s rg(xs ; ^n ) + n
1=2
n
X
frg(xs ; ^n )g2 :
(4.1)
s=1
Due to Assumption 4.1 the estimator ^n varies in a local region around 0 : Thus, it su¢ ces to replace
^n with a deterministic value and show that the sums in (4.1) vanish uniformly over the local
region. These sums are a martingale and its compensator. Now, the compensator vanishes under
Assumption 4.2(a). Jennrich (1969, Theorem 6) uses a similar condition when proving consistency
of non-linear least squares, with the di¤erence that he takes supremum over a non-vanishing set. In
the proof the main bulk of the work is to show that the martingale part vanishes under Assumption
4.2(c) (e): For this we exploit Lemma 1 of Lai and Wei (1982). The conditions (c) (e) are
somewhat weaker than the usual conditions for deriving the asymptotic distribution of non-linear
least squares estimators, see for instance Amemiya (1985, page 111). Finally, Assumption 4.2(b) is
used for showing the consistency of the fourth moment estimator '^2n :
In many applications the non-linear function g and its derivatives satisfy a Lipschitz condition.
In that case one can easily relate condition (a) of Assumption 4.2 to conditions (c) (e). To do
this, one just needs to second order Taylor expand g(xt ; ) g(xt ; 0 ) around 0 , square it, and take
supremum before cumulating. A similar argument applies to condition (b). This gives a somewhat
shorter set of assumptions that imply Assumption 4.2.
Assumption 4.4 Suppose xt is Ft 1 -measurable and g(xt ; ) is twice di¤ erentiable with respect
to : Let < 1=4 be the consistency rate in Assumption 4.1 and let > 0: Suppose, the following
conditions
hold, for k = 2; 4;
Pn
0
(a) t=1 jjNn;
g(x
_ t ; 0 )jjk = oP (nk=4 k );
0
Pn
0
(b) t=1 jjNn; 0 g•(xt ; 0 )Nn; 0 jjk = oP (nk=4 2k );
P
0
(c) nt=1 sup :jjN 1 ( 0 )jj n jjNn;
f•
g (xt ; ) g•(xt ; 0 )g Nn; 0 jjk = oP (n 4 ):
0
n; 0
Theorem 4.3 Assumption 4.4 implies Assumption 4.2.
5
5
Analysis of some particular models
In this section, we consider some particular non-linear models that have been discussed in the
literature. For these models it is relevant to test their validity using a cumulated sum of squares
test. We will assume that the consistency Assumption 4.1 has been dealt elsewhere. Thus, we
know the appropriate normalization of the estimator. The di¢ culty is therefore to establish the
smoothness Assumption 4.4. We will show that this assumption is rather mild.
5.1
The linear model
0 x so that g(x
In the linear model g(xP
_ t ; ) = xt and g•(xt ; ) = 0: Thus, Assumption
t; ) =
t
n
0
k
k=4 k ) for k = 2; 4. Suppose x is univariate
4.4 reduces to showing
t
t=1 jjNn; 0 xt jj = oP (n
1=2
1
and stationary
then Nn; 0 = n
whereas Nn; 0 = n if xt is a random walk. In both cases
Pn
k = O (1) = o (nk=4 k ).
k
jx
j
Nn;
t
P
P
t=1
0
For the recursive statistic we would need to establish that ^n is strongly consistent. For nonstationary models this is not always so easy. To our knowledge this has not been proved for a
…rst order autoregressive model with an intercept and where the autoregressive coe¢ cient is unity.
Nielsen and Sohkanen (2011) therefore work directly with the high level Assumption 3.4.
5.2
The power function model
As a …rst non-linear case we consider the power function g(xt ; ) = jxt j to illustrate where the
di¢ culties lie in the arguments. The model equation is then
yt = jxt j + "t
t = 1; : : : ; n;
(5.1)
with > 0 and where xt is either stationary or a random walk. We will suppose that Assumption
4.1 is satis…ed and show that Assumption 4.2 holds.
The properties of the regressor xt are re‡ected in the choice of the normalization Nn; 0 : Hence,
p
if xt is stationary with …nite jxt j4 0 log8 jxt j moments we let Nn;10 = n and apply techniques
from Wooldridge (1994). If xt is a random walk we let Nn;10 = n(1+ 0 )=2 log n1=2 and apply techniques from Park and Phillips (2001). These techniques go back to Cramér and involve smoothness conditions that are similar but also somewhat stronger than Assumption 4.2. Here, we take
Nn;10 ( ^n
) = OP (1) as given. Hence Assumption 4.1 follows for any > 0:
To prove Assumption 4.4 we di¤erentiate g and get
g(x; ) = jxj ;
g(x;
_
) = jxj log jxj;
g•(x; ) = jxj log2 jxj:
These functions are continuous in x when > 0 and jxj > 0 and they can be extended continuously
to all x 2 R because the power function dominates the logarithm at the origin.
We now look at Assumption 4.4 (a) in some detail. As in the linear case we show
S=
n
X
t=1
jNn; 0 g(x
_ t;
k
0 )j
= OP (1) = oP (nk=4
k
):
In the stationary case we use Theorems 3.5.3, 3.5.7 of Stout (1974) to get
S=
n
1 X
nk=2
t=1
jxt jk 0 logk jxt j = O(n1
k=2
) = O(1)
a:s:
In the random walk case we get
S=
1
n(1+
0 )k=2
logk n1=2
n
X
t=1
jxt jk 0 logk jxt j =
n
1 X
nk=2
t=1
jxt =n1=2 jk
0
log jxt =n1=2 j
+1
log n1=2
!k
= OP (1);
6
where the second equality follows by noting that log jxj = log jx=n1=2 j + log n1=2 . For the last bound
note that xinteger(nu) =n1=2 converges to a Brownian motion as a function on D[0; 1]. The functions
R1
R1
jyj2 0 log jyj and jyj2 0 are continuous and therefore the integrals 0 jyj2 0 log jyjdy and 0 jyj2 0 dy
are continuous mappings from D[0; 1] to R: The Continuous Mapping Theorem, see Billingsley
(1999, Theorem 2.7) then shows that the normalized sum
in distribution.
Pn converges
2
For Assumption 4.4 (b) a similar argument shows t=1 jNn; 0 g•(xt ; 0 )jk = OP (n1 k ):
For Assumption 4.4 (c) we apply a Lipschitz argument. The second derivative of g satis…es
j•
g (xt ; )
for all
jxj 0
n
X
0 )j
(jxj + jxj
)jxj 0 log2 jxj
so j
for some 0 < < 0 : The result is proved by analyzing the function
0j
1 for all four sign combinations of jxj 1 and
0 : Applying this to condition (c) gives
sup
t=1 :j
g•(xt ;
0j
2
f•
g (xt ; )
jNn;
0
g•(xt ;
n
X
t=1
k
0 )gj
)jxt j 0 log2 jxt jgk = OP (n1
2
(jxt j + jxt j
fNn;
0
k
) = oP (1); (5.2)
where the second bound follows by the same argument as above.
5.3
Cointegration with non-linear error correction
In the model of Kristensen and Rahbek (2010) xt is a p-dimensional time series satisfying
xt = g( 0 xt
1;
)+
1
xt
1
+
+
k
xt
k
+ "t :
In speci…cation analysis we consider the coordinates of the residual vector "^t separately. Their
Theorem 1 gives conditions ensuring that 0 xt 1 ; xt 1 ; : : : ; xt k are geometrically ergodic and
that xt satis…es a Granger–Johansen-type representation. With this and some further conditions
their Theorem 5 provides the normalization Nn;10 ( ^n
0 ) = OP (1) that is required in our Assumption 4.1. Their Assumption A.5 requires that the …rst, second and third derivatives of g(z; ) with
respect to z or are of order O(jzj): With these boundedness conditions our Assumption 4.4 can
be proved. The proof is slightly involved as one will have to keep track of the various components
in the Granger-Johansen-type representation and how they interact with the derivatives of g:
5.4
Non-linear models with random walk regressors
Park and Phillips (2001) consider a triangular system with a univariate random walk regressor:
yt = g (xt ; ) + "t
xt = xt
1
+ vt ;
t = 1; : : : ; n;
(5.3)
(5.4)
where "t is an Ft -martingale di¤erence sequence, ("t ; vt )0 satis…es a functional central limit theorem,
xt is Ft 1 -adapted, and g is in one of two main classes of functions: integrable and asymptotically
homogeneous. For recent developments see Chan and Wang (2015).
2
The class of integrable functions includes transformations g (xt ; ) such as 1=(1 + x2 ), e x , or
1(0 x 1) which are integrable over x 2 R and satisfy a Lipschitz condition over : In Theorem
5.1 of Park and Phillips (2001) the asymptotic distribution of the non-linear least squares estimator
for the integrable functions case is derived, showing that n1=4 ( ^n
) converges in distribution.
Thus, we can choose Nn;10 = n1=4 and otherwise proceed as in the power function example.
The class of asymptotically homogenous functions includes transformations g(x; ) which asymptotically behave like homogeneous functions; they include the power function in Section 5.2
7
as well as logistic, threshold-like or logarithmic transformations. Speci…cally, an asymptotically
homogeneous function f (x; ) is a function such that
f ( x; ) = ( ; )H(x; ) + R( ; x; );
where is a normalization, H satis…es some regularity conditions (such as local integrability –
see also Pötscher, 2004) and R is a lower order remainder term. In Theorem 5.3 of Park and
Phillips (2001) each of the functions g; g_ and g• are assumed to be asymptotically homogenous
and satisfy conditions that have the same ‡avour as those in Assumption 4.4. It then follows
p
0
that n1=2 _ ( n; 0 ) ( ^n
) converges in distribution. Thus, we can choose the normalization
p
0
1
1=2
Nn; 0 = n _ ( n; 0 ) : For instance, in the power function model (5.1) with random walk regressor
p
we have _ ( n; 0 ) = n 0 =2 log n1=2 :
6
Finite Sample Performance
In this section, we study the …nite sample performance of the CU SQ test through simulation. We
use the exact asymptotic 95% critical value of 1.36 and 10000 replicas. Two sets of results are
presented for various asymptotically homogeneous models. First, we check size and power for a
set of models that are either linear or non-linear in parameters. Next, we consider a set of models
suggested by Kasparis (2008). For these we compare the power of the CU SQ test with the power
of a cumulated sum (CUSUM) test reported by Kasparis (2008). We …nd that the two tests have
power of similar magnitude, so there is no apparent advantage in using the more complicated
CUSUM test.
Table 1 contains the …rst set of data generating processes (DGPs). Four correctly speci…ed (CS)
DGPs and …ve misspeci…ed (M) DGPs are analyzed. The regressor xt is (fractionally) integrated
so that
xt is iid N(0; 1) with xt = 0 for t
0 and with = 0:7, 1, 2. While the models in
Section 5 focus on stationary and random walk models the theory does extend to other types of
nonstationarity, see Chan and Wang (2015).
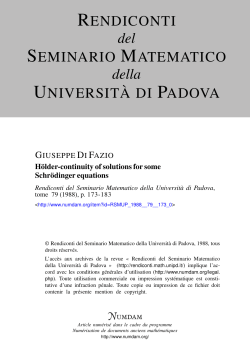
Table 2, DGPs 1-4, reports the size of the CU SQ test. The size control is fairly uniform across
the DGPs. This is in correspondence with the results for linear autoregressions in Nielsen and
Sohkanen (2011). The test is, however, slightly undersized in small samples. The size distortion
can be removed by applying the …nite sample 95% critical value 1:36 0:67n 1=2 0:89n 1 suggested
by Edgerton and Wells (1994). Similarly, for the recursive test Sohkanen (2011) suggests the 95%
critical value 1:36(1 0:68n 1=2 + 3:13n 1 33:9n 3=2 + 93:9n 2 ):
Table 2, DGPs 5-9, reports the power of the CU SQ test for a range of asymptotically homogenous functions. The power increases with sample size in all cases. The power also tends to
increase with the order of integration of the regressors. This is in line with the power analysis for
linear models conducted by McCabe and Harrison (1980), Ploberger and Krämer (1990), Deng and
Perron (2008), or Turner (2010).
The CU SQ also has power to detect misspeci…cation involving integrable functions of persistent
processes. As an example consider the data generating process yt = 1 =(1 + 2 x2t ) + "t , while the
regression model is polynomial. Simulations not reported here show that power arises as long as
the signal from the integrable function component 1 =(1 + 2 x2t ) dominates the noise "t :
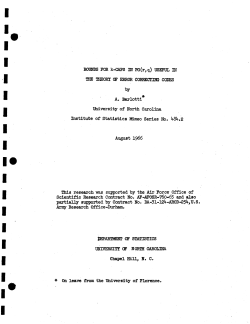
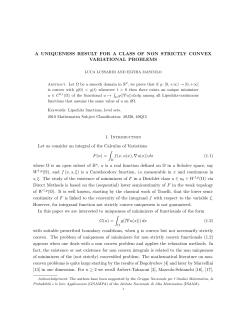
Next, we compare the power of the CU SQ test with the CUSUM test of Kasparis (2008).
Table 3 reports his ten DGPs. In all cases a linear model for yt and xt is …tted, which is therefore
misspeci…ed. The results are reported in Table 4. Kasparis’test uses a long run variance estimator
to standardize the statistic; hence, the power of the test depends on a bandwidth choice. Kasparis
reports power for di¤erent bandwidths and we report the highest of these. Table 4 shows that no
test dominates in all cases but both tests perform in a similar way. We note that the CUSUM test
involves nuisance terms depending on the functional form of the model whereas the CU SQ has a
Brownian bridge theory quite generally.
8
A
Appendix: Proofs
In most places we use the spectral norm for matrices, so that for a matrix m then
p
kmk = max eigen(m0 m):
The spectral norm reduces to the Euclidean norm for vectors. It is compatible with the Euclidean
norm in the sense that jjmvjj = jjmjjjjvjj for a matrix m and a vector v: It satis…es the norm
inequality jjmnjj jjmjjjjnjj for matrices m; n. Occasionally, we will use the Frobenius norm
P
jjmjjF = ( i;j jmij j2 )1=2 :
Note that jjmjj
jjmjjF with equality when m is a vector, while jjmjjF
qjjmjj where q is the
column dimension of m: Further, jjmjjF = jjvec(m)jjF :
We start with a modi…cation of the martingale result by Lai and Wei (1982).
Lemma A.1 Let Nn; 0 be a q q normalizing matrix where Nn;10 = O(n` ) for some ` > 0.
Further, let g(xt ; 0 ) be a function g : Rp Rq ! R, with derivatives with respect to : g,
_ g•. Also
let Assumption 3.1(a) hold. Let wt be Ft 1 -measurable and given as either of
0
(i) wt = Nn;
g(x
_ t ; 0 );
0
0
(ii) wt = Nn; 0 g•(xt ; P
0 )Nn; 0 :
Suppose n0 = inf[n : nt=1 fvec(wt )gfvec(wt )g0 is invertible] < 1 a:s: Then, for all & > 0,
i
h
Pn
P
a:s:
0 1=2+&
fvec(w
)g
fvec(w
)g
+ O(1)
max k st=1 wt "t k = o n&
t
t
t=1
n0 s n
= o n&
Pn
t=1 kwt k
2
1=2+&
+ O(1):
Proof of Lemma A.1: Part (i): Introduce the notation
Sg";u
=
_
so that
P[nu]
_ t ; 0 )"t
t=1 g(x
0
Nn;
S_ =
0 g";u
Notice that, for n0 < [nu],
P[nu]
t=1 wt "t
and
Sg_ g;u
_ =
P[nu]
_ t ; 0 )g(x
_ t; 0)
t=1 g(x
0
Nn;
S _ Nn;
0 g_ g;u
and
1=2
0
0
Nn;
S_
= (Nn;
S _ Nn; 0 )1=2 Sg_ g;u
Sg";u
_
_
0 g";u
0 g_ g;u
0
=
0
Nn;
S _ Nn;
0 g_ g;u
0
;
P[nu]
0
t=1 wt wt :
1=2
0
1=2
Sg_ g;u
Sg";u
:
_
_
(A.1)
Use Lai and Wei (1982, Lemma 1,i,ii) with Assumption 3.1(a) recalling the de…nition of the spectral
norm, to see that
1=2
1
Sg_ g;u
Sg";u
= S"g;u
_
_ Sg_ g;u
_
_
_ Sg";u
1=2 a:s:
&~
= o kSg_ g;u
+ O(1);
_ k
1
for all &~ > 0. Since kSg_ g;u
_ k is non-decreasing in u this is bounded by kSg_ g;1
_ k : Using that Nn; 0 =
O n` for some ` > 0, we can write
1=2
Sg_ g;u
Sg";u
_
_
a:s:
Nn;10
= o
2~
&
0
Nn;
S _ Nn;
0 g_ g;1
&~
0
0
+ O(1) = o n& Nn;
S _ Nn;
0 g_ g;1
&
0
+ O(1);
for all & > 0, uniformly in u. Hence, using (A.1),
0
sup Nn;
S_
0 g";u
u
a:s:
0
= o(n& Nn;
S _ Nn;
0 g_ g;1
1=2+&
0
) + O (1) ;
which is the …rst desired expression and by the triangle inequality we get the second expression.
9
Part (ii): By the properties of the Frobenius norm we get that
P[nu]
P[nu]
t=1 wt "t
t=1 wt "t
F
P[nu]
=
t=1 vec (wt ) "t
Now argue as in (i) with wt replaced by vec (wt ) to get
sup
u
P[nu]
Pn
o n&
t=1 wt "t
t=1 fvec (wt )g fvec (wt )g
:
0 1=2+&
a:s:;
which is the …rst desired expression. To get the second expression notice that
Pn
Pn
0
0
t=1 fvec (wt )g fvec (wt )g
t=1 fvec (wt )g fvec (wt )g
and jjfvec(wt )gfvec(wt )g0 jj = kvec (wt )k2F = kwt k2F
q kwt k2 as desired.
Proof of Theorem 3.2: The statistic of interest is CU SQn = An ='^n , where
An = max n
1 t n
Expand An = Bn + (An
Bn ) ; where
1=2 Pt
s=1
Bn = max n
1 t n
Noting that "^2s;n = (^
"2s;n
An Bn = max n
1 t n
"2s ) + "2s we get
1=2 Pt
s=1
"2s
n
"^2s;n
n
"2s
n
1=2 Pt
s=1
2
1 Pn
r=1 "r
+n
1 Pn
^2r;n
r=1 "
2
1 Pn
r=1 "r
1=2 Pt
s=1
Cn = max n
1 t n
By Assumption 3.2,
An
Bn
Bn
Bn + Cn
1=2 Pt
s=1
max n
Cn
Bn = Cn where
"^2s;n
2 max n
1 t n
"2s
n
1=2 Pt
s=1
1 Pn
r=1
"^2s;n
:
"^2s;n
1 t n
By the triangle inequality An
:
"2s
1=2 Pt
s=1
"^2r;n
"2s
n
"2s
"2r
1 Pn
r=1
n
"^2r;n
"2r
2
1 Pn
r=1 "r
:
:
= oP (1):
(A.2)
Thus, by Theorem 3.1 and the Continuous Mapping Theorem applied to the maximum, we have
D
An = Bn + oP (1) ! ' sup Bu0 :
0 u 1
P
P
Consider now '^2n = n 1 nt=1 "^4t;n (n 1 nt=1 "^2t;n )2 : Further, n
k = 2; 4 by Assumptions 3.2, 3.3. Therefore,
'^2n = n
1 Pn
4
t=1 "t
n
1 Pn
2 2
t=1 "t
1
Pn
"kt;n
t=1 (^
"kt ) = oP (1) for
+ oP (1):
By Theorem 3.1, under Assumption 3.1, we have '^2n = '2 + oP (1):
All together, CU SQn converges in distribution to sup0 u 1 Bu0 as desired.
Proof of Theorem 3.3: Follow the proof of Theorem 3.2 replacing "^2s;n by "^2s;t and using Assumption 3.4 instead of Assumption 3.2 when evaluating (A.2).
10
Proof of Theorem 4.1: Part I: Assumption 3.2.
1. The problem. Let St; = n 1=2 fQt ( ) Qt ( 0 )g so that St; ^n = n
that St; ^n = oP (1) uniformly in 1
Set; = n
t
1=2
);
S t; = n
^2s;n
s=1 "
"2s : We show
2Set; + S t; ; where
n: From (4.1) we have St; =
1=2 Pt
s=1 "s rgs (
Pt
1=2 Pt
s=1 frgs (
)g2 :
2. Expand the martingale Set; . We use a second order mean value result. To simplify the expression
we introduce the notation
• s ( ) = N 0 g•(xs ; )Nn; ;
h
n; 0
0
0
•
g (xs ; ) g•(xs ;
rhs ( ) = Nn; 0 f•
0
g(x
_ s ; );
h_ s ( ) = Nn;
0
# = Nn;10 (
0) ;
0 )g Nn;
0
:
With this notation we get, for instance, that
(
0)
0
g(x
_ s;
0)
Overall, we can expand Set; ^n = n
Set; ^n = n
1=2 Pt
^0 _
s=1 "s #n hs ( 0 )
= fNn;10 (
1=2
1
+ n
2
0 )g
Pt
^
s=1 "s rgs ( n )
0
0
g(x
_ s;
Nn;
0
0)
= #0 h_ s ( 0 ):
as
1=2 Pt
^0 •
^
s=1 "s #n hs ( 0 )#n
1
+ n
2
1=2 Pt
^0 •
s=1 "s #n fhs (
)
• s ( 0 )g#^n ; (A.3)
h
for an intermediate point
depending on the summation limit t and ^n so jj
jj ^n
0 jj
0 jj:
Note that the …rst two terms only depend on ^n through the factor #^n : For simplicity we write
(A.3) as Set; ^n = Set;1 + (Set;2 + Set; ^n ;3 )=2.
3. The martingale term Set;1 . The norm inequality and the bound to #^n in Assumption 4.1 (a) give
jSet;1 j
n
1=2
P
jj#^n jjjj ts=1 "s h_ s ( 0 )jj
oP (n
1=2
P
)jj ts=1 "s h_ s ( 0 )jj:
Apply Lemma A.1 (i) using Assumptions 3.1, 4.3 to get, for any & > 0,
P
max jSet;1 j = oP (n 1=2 )oa:s: [n& f nt=1 jjh_ t ( 0 )jj2 g1=2+& ] + oP (n
1=2
n0 t n
P
By Assumption 4.2 (c), we have that nt=1 jjh_ t ( 0 )jj2 = OP n1
We then get, when choosing 2&
=(2 2
);
max jSet;1 j = oP (n
n0 t n
1=2
)oP fn(1
2
)(1=2+&)+&
2
for some
g + oP (n
1=2
)Oa:s: (1) :
> 0 while
< 1=4.
) = oP (1):
4. The martingale term Set;2 . Argue as in item 3. First, the norm inequality gives
jSet;2 j
n
1=2
P
• s ( 0 )jj
jj#^n jj2 jj ts=1 "s h
oP (n2
1=2
P
• s ( 0 )jj:
)jj ts=1 "s h
Then apply Lemma A.1 (ii) using Assumptions 3.1, 4.3 along with Assumption 4.2 (d) to get
max jSet;2 j = oP (n2
n0 t n
1=2
)oP (n(1
4
)(1=2+&)+&
) + oP (n2
1=2
) = oP (1);
when < 1=4 and & > 0 is chosen su¢ ciently small.
5. The term Set; ^n ;3 . Apply the norm and triangle inequalities to get
jSet; ^n ;3 j
jj#^n jj2 n
1=2 Pt
•
s=1 j"s j jjhs (
)
• s ( 0 )jj:
h
The summands are positive so that a further bound arises by extending the summation limit
P
• s( ) h
• s ( 0 )jj;
jSet; ^n ;3 j jj#^n jj2 n 1=2 ns=1 j"s j jjh
11
where
remains dependent on t and ^n : Apply the Hölder inequality to get
P
P
• s( ) h
• s ( 0 )jj2 )1=2 :
jSet; ^n ;3 j jj#^n jj2 (n 1 ns=1 "2s )1=2 ( ns=1 jjh
P
The martingale Law of Large Numbers (Chow, 1965, Theorem 5) shows n 1 ns=1 "2s = O(1) a:s:
By Assumption 4.1 (a) then #^n = Nn;10 ( ^n
> 0 and large n then
0 ) = oP (n ): For any
1 ^
^
jjNn; 0 ( n
n with large probability. For such n we have that
is also local to 0 and
0 )jj
we can then bound
Pn •
Pn •
• s ( 0 )jj2
• s ( 0 )jj2 ;
h
sup
h
s=1 jjhs ( )
s=1 jjhs ( )
:jjNn;1 (
0
0 )jj
n
which depends neither on t nor ^n . Then Assumption 4.2 (e) implies jSet; ^n ;3 j = oP (n2 2 ) = oP (1)
uniformly in t:
6. The compensator. As before jjNn;10 ( ^n
n on a set with large probability. On that set
0 )jj
S t; ^n sup :jjN 1 ( 0 )jj n S t; which is oP (1) by Assumption 4.2 (a).
n; 0
Part II: Assumption 3.3.
P
1. The problem. Let Vn; =Pn 1 nt=1 [f"t rgs ( )g4 "4t ] where rgs ( ) = g(xs ; ) g(xs ; 0 ) as
"4t "4t ):
before, so that Vn; ^n = n 1 nt=1 (^
2. Some inequalities: By binomial expansion (" r)4 "4 = r4 4r3 " + 6r2 "2 4r"3 : Thus,
by Hölder’s inequality,
P
P
P
jVn; j n 1 nt=1 frgs ( )g4 4[n 1 nt=1 frgs ( )g4 ]3=4 (n 1 nt=1 "4t )1=4
P
P
P
P
+ 6[n 1 nt=1 frgs ( )g4 ]1=2 (n 1 nt=1 "4t )1=2 4[n 1 nt=1 frgs ( )g4 ]1=4 (n 1 nt=1 "4t )3=4 :
P
Now, n 1 nt=1 "4t = OP (1) by the martingale Law of Large Numbers and Assumption 3.1 while
P
n 1 nt=1 frgs ( ^n )g4 = oP (1) by an argument as in part I, item 6 using Assumption 4.2 (b).
Proof of Theorem 4.2. Since ^n = 0 + o(n ) a:s: by Assumption 4.1 (b) then Egorov’s theorem
(Davidson 1994, Theorem 18.4) implies 8 > 0 9t0 so
= fsupt>t0 jNn;10 ( ^t
0 )j < n g satis…es
P( ) > 1
: On
we bound
max jn
1 t n
1=2
t
X
(^
"2s;t
"2s )j
n
s=1
1=2
max j
1 t t0
t
X
s=1
(^
"2s;t
"2s )j +
max
t0 +1 t n
jn
1=2
t
X
(^
"2s;t
"2s )j:
s=1
Since t0 is …nite, the …rst term vanishes. For the second term we can follow the proof of Theorem
4.1 replacing "^2s;n by "^2s;t : When expanding in item 3 the intermediate point
will now depend on
^
^
t through the summation limit and t : However, with t > t0 then t is local to 0 uniformly in t
and the remaining arguments apply.
Proof of Theorem 4.3. Assumption 4.4 (a,b,c) with k = 2 imply Assumption 4.2 (c,d,e).
Now, recall the notation in item 3 in the proof of Theorem 4.1 and expand
g(xt ; )
g(xt ;
0)
1 •
1 0 •
= #0 h_ t ( 0 ) + #0 h
t ( 0 )# + # fht ( t )
2
2
• t ( 0 )g#;
h
where t is an intermediate point depending on xt so j t
j
0j
0 j: Raise this to the power
k = 2 or k = 4 and apply the inequality (x + y + z)m C(xm + y m + z m ) to see that
jg(xt ; )
g(xt ;
k
0 )j
• t ( 0 )jjk + jj#jj2k jjh
• t( t)
Cfjj#jjk jjh_ t ( 0 )jjk + jj#jj2k jjh
• t ( 0 )jjk g:
h
12
In Assumption 4.2 (a,b) we only consider jj#jj
n . Thus t is local to
k
•
•
sup :jjN 1 ( 0 )jj n jjht ( ) ht ( 0 )jj : Then cumulate to get
0
• t( t) h
• t ( 0 )jjk
so that jjh
n; 0
j
n
X
t=1
fg(xt ; )
g(xt ;
0 )g
+
k
j
2k 2 k
n
k
n
k
n
X
t=1
n
X
t=1
jjh_ t ( 0 )jjk
• t ( 0 )jjk +
jjh
2k 2 k
n
n
X
t=1
sup
:jjNn;1 (
0
0 )jj
n
• t( )
jjh
• t ( 0 )jj2k ;
h
which is oP (n1=2 ) for k = 2 and oP (n) for k = 4 due to Assumption 4.4.
B
Tables
*
CS
CS
CS
CS
DGP
1
2
3
4
M
M
M
M
M
5
6
7
8
9
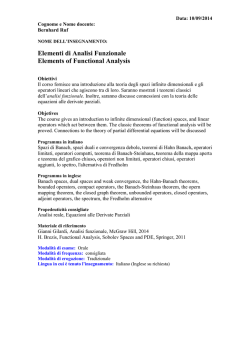
Table 1: DGPs: Data Generating Processes
yt
g (xt ; )
1 + 0:5xt + "t
1 + 2 xt
2
1 + 0:5x2t + "t
1 + 2 xt
1 + 0:9xt 1 (vt 0) + 0:5xt 1 (vt > 0) + "t
0) + 3 xt 1 (vt > 0)
1 + 2 xt 1 (vt
3
1 + 0:3 jxt j1:5 + "t
+
1
2 jxt j
+ 2 jxt j 3
1 + 2 xt
1 + 2 xt
3
1 + 2 jxt j
2
1 + 2 ln jxt j
yt 1 + "t
1 + 0:9xt 1 (vt 0) + 0:5xt 1 (vt > 0) + "t
1 + 0:5x2t + "t
1 + 0:3 jxt j1:5 + ut ut = xt + "t
1 + 0:5x2t + "t
1
CS denotes correct speci…cation and M denotes misspeci…cation. yt and g(xt ; ) are the
dependent variable and the estimated regression function, respetively. xt I( ) with =
0:7; 1; 2. "t ; vt i:i:d:N (0; 1). xt , "t , and vt are independent of each other.
Table 2: Size and Power: Finite Sample Performance
xt I (0:7)
xt I (1)
xt I (2)
n
n
n
CU SQn
*
CS
CS
CS
CS
DGP
1
2
3
4
100
0.031
0.031
0.030
0.031
500
0.041
0.040
0.041
0.040
1000
0.044
0.045
0.043
0.045
100
0.032
0.031
0.033
0.031
500
0.040
0.040
0.042
0.041
1000
0.044
0.044
0.043
0.043
100
0.031
0.031
0.033
0.033
500
0.040
0.039
0.041
0.040
1000
0.044
0.044
0.042
0.044
M
M
M
M
M
5
6
7
8
9
0.527
0.085
0.096
0.302
0.313
0.975
0.485
0.790
0.854
0.709
0.997
0.708
0.962
0.946
0.775
0.814
0.553
0.479
0.460
0.320
0.999
0.984
0.993
0.846
0.599
1.000
0.999
1.000
0.913
0.759
0.957
0.998
0.974
0.935
0.945
1.000
1.000
1.000
1.000
0.999
1.000
1.000
1.000
1.000
0.999
CS denotes correct speci…cation; hence, size is being analyzed in those cases. M denotes misspeci…cation; hence, power is considered in those cases. 10000 replications are conducted.
13
Table 3: Power performance comparison with Kasparis (2008)
DGP
yt
R1
zt
R2
sign (zt ) jzt j0:5
R3
sign (xt ) jxt j0:75 + ut
R4
sign (xt ) jxt j1:25 + ut
R5
ln (1 + jxt j) + ut
R6
xt + jxt j0:5 + ut
R7
0:4xt 1 (xt 0) +1:8xt 1 (xt 0) + ut
p
xt + 1:8 [xt =(1 + exp ( xt = n 2))] + ut
R8
R9
xt + zt + ut
R10
sign (xt ) (jxt j jzt j)0:5 + ut
zt = zt 1 + wt where wt = 0:3wt 1 + !t , xt = xt 1 + t ,
ut = t , ( t ; t+1 ; !t+1 )0 = Drt where rt i:i:d:N (0; 1) and
D = [1 .2 .1, .3 2 0, 0 .1 1.2]
Table 4: Power performance comparison with Kasparis (2008)
CU SQn
Kasparis’best power
n
100
200
500
100
200
500
R1
R2
R3
R4
R5
R6
R7
R8
R9
R10
0.909
0.925
0.093
0.349
0.408
0.514
0.548
0.340
0.882
0.670
0.999
1.000
0.612
0.962
0.922
0.953
0.825
0.849
0.999
0.997
1.000
1.000
0.860
0.996
0.986
0.993
0.872
0.959
1.000
1.000
0.762
0.790
0.180
0.430
0.706
0.626
0.485
0.327
0.753
0.411
0.920
0.930
0.377
0.706
0.901
0.862
0.597
0.557
0.915
0.702
0.984
0.984
0.698
0.902
0.993
0.989
0.704
0.825
0.983
0.904
14
References
Amemiya, T. (1985) Advanced econometrics. Cambridge, MA: Harvard University Press.
Berenguer-Rico, V. and J. Gonzalo (2014) Co-summability: From linear to non-linear co-integration. Mimeo.
Billingsley, P. (1999) Convergence of probability measures. New York, NJ: Wiley.
Brown, B.M. (1971) Martingale central limit theorems. Annals of Mathematical Statistics 42, 59–66.
Brown, R.L., J. Durbin and J.M. Evans (1975) Techniques for testing the constancy of regression relationships
over time. Journal of the Royal Statistical Society B37, 149-192.
Chan, N. and Q. Wang (2015) Nonlinear regressions with nonstationary time series. Journal of Econometrics
185, 182–195.
Choi, I. and P. Saikkonen (2010) Tests for non-linear cointegration. Econometric Theory 26, 682-709.
Chow, Y.S. (1965) Local convergence of martingales and the law of large numbers. Annals of Mathematical
Statistics 36, 552–558.
Davidson, J. (1994) Stochastic limit theory. Oxford: Oxford University Press.
Deng, A. and P. Perron (2008) A non-local perspective on the power properties of the CUSUM and CUSUM
of squares tests for structural change. Journal of Econometrics 142, 212–240.
Edgerton, D. and C. Wells (1994) Critical values for the CUSUMSQ statistic in medium and large sized
samples. Oxford Bulletin of Economics and Statistics 56, 355–365.
Hao, K. and B. Inder (1996) Diagnostic test for structural change in cointegrated regression models. Economic
Letters 50, 179–187.
Jennrich, R.I. (1969) Asymptotic properties of non-linear least squares estimators. The Annals of Mathematical Statistics 40, 633–643.
Kasparis, I. (2008) Detection of functional form misspeci…cation in cointegrating relations. Econometric
Theory 24, 1373-1403.
Koziol, J.A. and D.P. Byar (1975) Percentage points of the asymptotic distributions of one and two sample
K-S statistics for truncated or censored data. Technometrics 17, 507-510.
Kristensen, D. and A. Rahbek (2010) Likelihood-based inference for cointegration with nonlinear errorcorrection. Journal of Econometrics 158, 78-94.
Lai, T.L. and C.Z. Wei (1982) Least squares estimates in stochastic regression models with applications to
identi…cation and control of dynamic systems. Annals of Statistics 10, 154-166.
Lee, S., O. Na and S. Na (2003) On the CUSUM of squares test for variance change in non-stationary and
non-parametric time series models. Annals of the Institute of Statistical Mathematics 55, 467-485.
McCabe, B.P. M. and M.J. Harrison (1980) Testing the constancy of regression relationships over time using
least squares residuals. Applied Statistics 29, 142-148.
Nielsen, B. and J. Sohkanen (2011) Asymptotic behaviour of the CUSUM of squares test under stochastic
and deterministic time trends. Econometric Theory 27, 913-927.
Park, J.Y. and P.C.B. Phillips (2001) Non-linear regressions with integrated time series. Econometrica 69,
117-161.
Ploberger, W. and W. Krämer (1986) On studentizing a test for structural change. Economics Letters 20,
341-344.
Ploberger, W. and W. Krämer (1990) The local power of the CUSUM and CUSUM of squares test. Econometric Theory 6, 335-347.
Pötscher, B.M. (2004) Nonlinear functions and convergence to Brownian motion: Beyond the continuous
mapping theorem. Econometric Theory 20, 1-22.
Sohkanen, J.S. (2011) Properties of tests for mis-speci…cation in non-stationary autoregressions. DPhil
Thesis, University of Oxford.
Stout, W.F. (1974) Almost sure convergence. New York, NJ: Academic Press.
Turner, P. (2010) Power properties of the CUSUM and CUSUMSQ tests for parameter instability. Applied
Economic Letters 17, 1049-1053.
Wooldridge, J.M. (1994) Estimation and inference for dependent processes. In R.F. Engle and D.L. McFadden
(eds.) Handbook of Econometrics 4, 2639-2738.
Xiao, Z. and P.C.B. Phillips (2002) A CUSUM test for cointegration using regression residuals. Journal of
Econometrics 108, 43–61.
© Copyright 2026 Paperzz