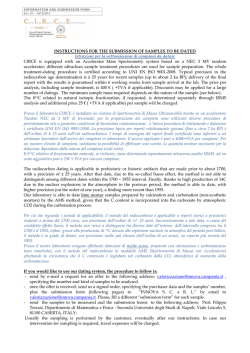
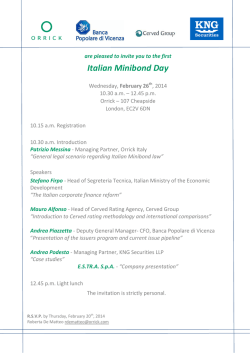
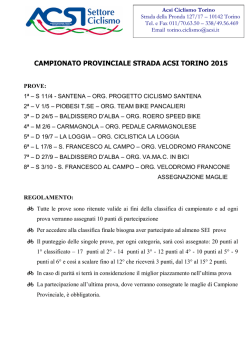
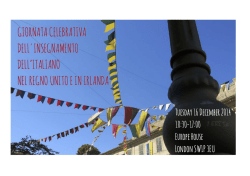
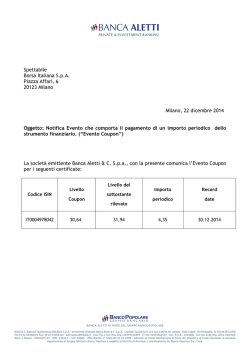
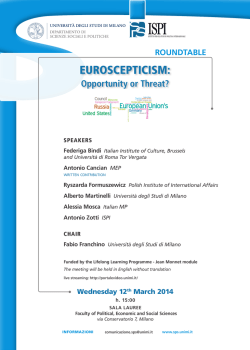
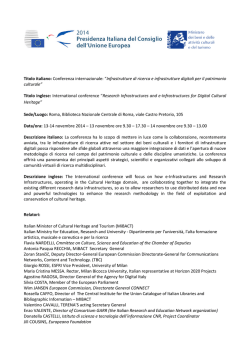
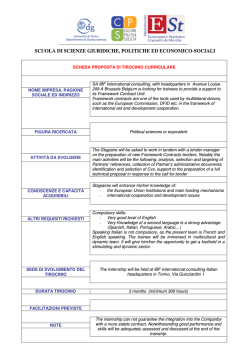
Caucia et al_periodico 18/04/12 12:29 Pagina 93
DOI: 10.2451/2012PM0006
Periodico di Mineralogia (2012), 81, 1, 93-106
PERIODICO di MINERALOGIA
established in 1930
An International Journal of
MINERALOGY, CRYSTALLOGRAPHY, GEOCHEMISTRY,
ORE DEPOSITS, PETROLOGY, VOLCANOLOGY
and applied topics on Environment, Archeometry and Cultural Heritage
Physical and chemical properties of some italian opals
Franca Caucia1,*, Luigi Marinoni1, Valentina Bordoni1, Christian Ghisoli1 and Ilaria Adamo2
1
Dipartimento di Scienze della Terra, Università degli Studi di Pavia, via Ferrata 1, 27100 Pavia, Italy
2
Università degli Studi di Milano, Dipartimento di Scienze della Terra, Sezione di Mineralogia,
Via Botticelli 23, 20133 Milano, Italy
*
Corresponding author: [email protected]
Abstract
The physical and compositional properties of some opals from different parts of Italy have
been investigated through several methodologies like optical analysis, specific gravity,
refractive indices, XRPD, IR spectroscopy, LA-ICP-MS. The opals show different colors:
white, brownish-white, yellowish-white, yellow-/greenish white and grey. Black and metallic
inclusions, consisting of todorokite, are sometimes present. Play-of-color have not been
observed but some opals show small iridescence zones; opals are inert to the long and short
wavelength UV radiation (366 - 254 nm) with the exception of one sample; also
phosphorescence is absent. Refractive index and specific gravity values are respectively 1.43
to 1.44 and 2.07 to 2.33 g/cm3 consistent with data available in the literature. XRPD analyses
highlighted Italian opals are A, CT and C types, but most of them can be classified as opalsCT. IR spectroscopy data confirmed the opal classification. The most abundant impurities are
Mg (between 400 and 900 ppm), Fe (35-400 ppm), Ca (72-96 ppm) and Ni (20-65 ppm).
Similarly to what observed in other opals worldwide, Fe appears to be the principal factor
that determines the brown to red to orange to yellow colors. Chromophore elements like V,
Cr, Cu, Ti, Co are present in very low concentrations and probably do not influence the
physical properties of the Italian opals analyzed. Ni is present in more relevant amounts and
is probably related to clay minerals. Mn is clearly detected only in two samples and is related
to the presence of dendrites. The investigated Italian opals show a rather homogeneous trace
element composition which is in the range of worldwide opal’s composition, except for their
noticeable amount in Ni.
Key words: Italian opals, hyalite, IR spectroscopy, trace elements, XRPD.
Introduction
Although Italian opals feature gemological
qualities lower than those from foreign countries,
some specimens are highly prized by gemologists
and collectors. In Italy, opals can be found at
several sites; the most frequent variety is the
common (without any play-of-color) opal, which
Caucia et al_periodico 18/04/12 12:29 Pagina 94
94
Periodico di Mineralogia (2012), 81, 1, 93-106
is an opaque variety colored by iron oxides and
hydroxides or by jasper, chalcedony, clay and
other minerals (Jerwis, 1873; Hintze, 1915;
Fenoglio and Sanero 1943; Mariani and Scaini,
1978). Even if accurate investigations on their
modes of formation are lacking, Italian opals are
generally considered of hydrothermal origin (see
also Ghiara et al., 1999; Cerri et al., 2001; Altaner
et al., 2003). Other opal varieties present in Italy
are the following (Jerwis, 1873; Hintze, 1915;
Fenoglio and Sanero, 1943; Mariani and Scaini,
1978): hydrophane (opaque and very porous
variety of opal that becomes translucent or
transparent when wet), hyalite (opal with a glassy
and clear appearance and a globular surface, that
sometimes shows internal play of colors and
natural inclusions; it is usually found in volcanic
rocks), geyserite (opaline silica usually occurring
around hot springs and geysers; botryoidal
geyserite is known as fiorite, from Santa FioraAmiata Mt. in Tuscany), xyloid opal (also known
as wood opal, opalized wood) and diatomite
(sedimentary rock almost entirely made up of
silica remains of diatoms). Unlike specimens
from countries such as Australia, Mexico, Brazil,
Peru, Ethiopia, the physical and chemical
characteristics of Italian opals have been poorly
investigated. These properties can be related to
the body color or the luminescence of the opal,
and also to the process of formation and the area
of provenance. As described in Gaillou et al.
(2008), the identification of the chemical and
physical properties of opals from a particular
geographic area is important for several reasons.
For instance, in the gem market, stones coming
from specific localities can be more valuable than
others. In addition, in the archaeometrical
investigation, knowledge of the geographic origin
is crucial to reconstruct the ancient trade routes
of gem (Giuliani et al., 2000; Gaillou et al.,
2008). In this work the physical, mineralogical
and chemical properties of opals from different
areas of Italy have been investigated through
several methodologies, such as optical analysis,
F. Caucia et al.
specific gravity measurement, refractive indices,
X-ray powder diffraction (XRPD), infrared
spectroscopy (IR), and laser ablation inductively
coupled plasma mass spectrometry (LA-ICPMS). The data obtained are discussed and also
compared with those of opals from different
typologies and from other parts of the world.
Provenance of the investigated samples
Twelve samples of opals from different Italian
sites have been analyzed, mostly from the
Piedmont region, but also from Sardinia and
Emilia Romagna. In particular, the opals
investigated in this work come from the
following localities:
1) Baldissero Canavese in the Province of
Turin, region of Piedmont. The samples were
gifted by the “AMI”, (Associazione MicroMineralogica Italiana).
2) Mount Calvo at Caselette, in the Province of
Turin, region of Piedmont. The samples were
gifted by the “Museo Don Bosco” of Turin.
3) Mount Maniglia near Bellino, Province of
Cuneo, region of Piedmont. The samples were
gifted by the “Museo Don Bosco” of Turin.
4) Case Montanini, at Sant’Andrea Bagni
(Medesano), Province of Parma, region of
Emilia-Romagna. The sample belonged to the
personal collection of the first author.
5) Silius in the Province of Cagliari in Sardinia.
The sample was offered by the “Museo Don
Bosco” of Turin. A comlete list of samples with
their properties can be found in Table 1.
Baldissero (Samples 1 to 7). The samples
examined come from the town of Baldissero,
located in the subalpine area of Canavese; in this
area, white, yellowish- and brownish-red opals,
sometimes with dendrites of pyrolusite, are
found (Hintze, 1915). Also other kinds of opals,
with a body color from blue to bluish-grey- and
several arborescent inclusions of todorokite,
were found in Bettolino, Baldissero and other
localities of Canavese (Mariani and Scaini,
Caucia et al_periodico 18/04/12 12:29 Pagina 95
Periodico di Mineralogia (2012), 81, 1, 93-106
Physical and chemical properties of some italian ...
(a)
(b)
Figure 1. Baldissero Samples: a) Sample 4, opal-CT
with a white color. b) Sample 6, ; opal- CT with a
yellowish-white color and dendrites.
1978). In particular, opals with inclusions of
todorokite, such as those investigated in this
work, are highly prized by collectors (Figure 1a,
b).
Caselette (Samples 8 and 9).
The samples examined originate from the town
of Caselette in the Susa Valley; fine specimens of
opals are frequently found here, usually in
magnesite deposits (Jerwis, 1873; Fenoglio and
Sanero, 1943). In particular, opal is still quite
95
abundant, sometimes with samples of appreciable
value, in the mine of Mount Calvo in Casellette.
The transparency of these opals varies from
transparent to semi-opaque and the color from
white to brown. Besides Mount Calvo, in the Susa
Valley opals have been also found in Val della
Torre, in Givoletto and Bussoleno near Cava
Tignai (Jerwis, 1873; Fenoglio and Sanero, 1943).
Bellino in Varaita Valley (Sample 10).
The small town of Bellino, in the province of
Cuneo in Piedmont, is located in Varaita Valley;
opals are present, in particular in the manganese
deposits on the Mount Maniglia, located at high
altitude (ca 3000 m; Jerwis, 1873).
Case Montanini (Sample 11).
This locality is near Sant’Andrea Bagni
(Medesano) in the Province of Parma. Near Case
Montanini and in nearby Faieto, there are some
quarries with interesting samples of opals: they
generally occur as light blue in small veins or
quite big spherules and semi-spheres, having a
white to intense light blue color, displaying a
sericeous (perly) luster and a moderate
iridescence (Adorni et al., 2004).
Silius (Sample 12). The analyzed sample is a
hyalite from a mine of barite and fluorite located
near the village of Silius, in the province of
Cagliari in Sardinia. This mine is one of the few
still active in Italy. Opals from this site are
colorless to milky hyalite with a botryoidal
surface and, in some cases, also a considerable
thickness. It usually occurs as coatings or
incrustations but also nodules, especially in
igneous rocks (Figure 2).
Materials and methods
The specimens were examined by standard
gemological methods to determine their optical
properties, hydrostatic specific gravity (SG),
ultra-violet fluorescence (UV) and microscopic
features.
Specific gravity and refractive index (RI)
measures of opal samples have been carried out
Caucia et al_periodico 18/04/12 12:29 Pagina 96
96
Periodico di Mineralogia (2012), 81, 1, 93-106
F. Caucia et al.
limits for each element can be found in Miller et
al. (2012).
Gemological properties
Figure 2. Sample 12 from Silius; colorless hyalite
opal.
using a Presidium PCS100 Sensible Balance and
a Kruss Rifractometer ER6040 equipment,
respectively. Detection limits were 1.30 < n <
1.80.
X-Ray Powder diffraction data (XRPD) on
samples of opals and the matrix that included
them, have been collected with a Philips PW1800
Powder Diffractometer, with CuKα radiation
(λ = 1.5418 Å) and a scan speed of 1°/min, in the
range between 2-65° 2θ.
Mid-infrared spectra (4000-400 cm-1) have
been recorded in transmission mode using a
Nicolet Nexus FTIR spectrometer, equipped with
a 4x beam condenser collector, accumulating 200
scans at a resolution of 4 cm-1. We operated by
means of KBr compressed pellets, after a pretreatment of 150 °C and fluxing the sample
compartment with gaseous nitrogen.
LA-ICP-MS microanalyses were performed
with a double-focusing sector - field ICP-SFMS
model Element I, ThermoFinnigan Mat at IGGCNR of Pavia. Quantification was performed
using SiO2 (stoichiometric value) as internal
standard and NIST SRM 610 synthetic glass as
external standard. Precision and accuracy were
estimated by the analysis of a BCR-2 standard
(accuracy: 2 sigma), for concentration at ppm
level. Opal fragments were mounted on epoxy
resin and polished before analyses. Detection
The appearance and gemological properties of
the investigated Italian opals are reported in Table
1. The opals span a range from colorless, white,
brownish-white, yellowish-white, yellowish to
greenish white to grayish; four samples are cut in
cabochon, and were chosen based on the different
kind of color shade; no sample shows a uniform
coloration. Luster is described as Vitreous (V) or
Greasy (G) and the degree of transparency is
defined as translucent (TL) or opaque (O).
Investigated opals appear vitreous or greasy, while
most of them are generally translucent and only
two samples (samples 3 and 5 from Baldissero)
are opaque. No samples are perfectly transparent.
Samples 1, 2, 3 and 6 (from Baldissero) show the
presence of black to dark brown branched and
opaque dendrites. Dendrites in opals 2 and 3 are
in lower quantity. All samples are common opals,
that is, none of them display a play-of-color; only
four opals from Baldissero exhibit small
iridescence zones (see Table 1). All the samples
are inert to long and short wavelength UV
radiation (366 - 254 nm respectively), with the
exception of the sample of hyalite from Sardinia
(n. 12) that shows a typical bright yellowish-green
fluorescence that might be attributed to small
amounts of uranium, present as uranyl UO2
(Fritsch et al., 2002; Olmi et al., 2002; Gamboni
et al., 1997; 2004; Gaillou et al., 2012).
Phosphorescence
was
never
observed.
Microscopic observations (observed with a
magnification up to 40x) in transmitted and
reflected light highlighted the presence of milky
zones, gas microbubbles, microfractures,
dendrites and iron oxides.
Specific gravities and refractive indices
The average values of measured specific
gravity and refractive indices of samples 1, 2, 9
Caucia et al_periodico 18/04/12 12:29 Pagina 97
Periodico di Mineralogia (2012), 81, 1, 93-106
Table 1. Gemological properties of the studied samples.
Sample
Origin
Description
Color
Transparence
Luster
1
Baldissero
rough/cabochon
TL
V
iridescence
4
5
6
Baldissero
Baldissero
Baldissero
rough
rough
rough
with dendrites
rough
rough
rough/cabochon
rough
rough/cabochon
Yellowish-white
with dendrites
greyish
Yellowish- to
greenish- white
white
brownish white
yellowish white
TL
O
TL
V
G
V
iridescence
colorless
TL
V
2
3
7
8
9
10
11
12
Baldissero
Baldissero
Baldissero
Caselette
Caselette
Bellino
Case
Montanini
Silius
rough/cabochon
rough
rough
greyish
yellowish white
brownish white
yellowish white
white
TL = translucent, O = opaque, V = Vitreous, G = Greasy.
and 11 are reported in Table 2. The specific
gravity of opals might be influenced by many
factors such as the presence of microcracks,
porosity or water content. For this reason, the
gravity values have been evaluated only on the
most appropriate samples that appeared compact,
homogeneous with no presence of empty or
recrystallised fractures. In general, the values of
specific gravity of the four investigated samples
are rather high but in the range of data in
literature (2.0-2.25; Klein, 2004). Sample 1
shows higher values most likely due to the
presence of dendrites. Similarly, refractive
Table 2. Physical and optical characteristics of the
studied gems.
Sample
Cut
Weight
Specific
gravity
Refractive
index
1
2
cabochon
cabochon
0.076 g
0.752 g
2.33 g/cm3
2.07 g/cm3
1.442
9
11
cabochon
cabochon
0.096 g
0.078 g
2.07 g/cm3
2.07 g/cm3
97
Physical and chemical properties of some italian ...
1.440
1.430
1.430
TL
O
TL
TL
TL
TL
TL
G
G
V
V
G
G
V
Optical
effects
iridescence
-
iridescence
-
Type
CT (close to
tridymite)
CT
CT
CT
CT
CT
pure C
CT
CT
A
CT
A
indexes are comparable with the literature data
(around 1.39-1.48; O’Donaghue, 2006; Caucia et
al., 2009; Simoni et al., 2010).
X-Ray Powder Diffraction (XRPD) on opals
XRPD investigations allow distinguishing the
opals into three general groups (Jones and
Segnit, 1971; Ghisoli et al., 2010): opal-C
(relatively well ordered α-cristobalite), opal-CT
(disordered α-cristobalite with α-tridymite-type
stacking) and opal-A (amorphous). In the XRPD
patterns of the investigated opals, the crystalline
part, made up by only cristobalite or by a
mixture of cristobalite and tridymite, is
generally mixed with the typical amorphous
component of the opal (Figure 3 A, B C). The
cristobalite versus tridymite ratio was calculated
by comparing the position of the characteristic
peak in the interval d = 4.04-4.11 Å, whose
extremes correspond respectively to the values
of pure cristobalite and pure tridymite. In
particular, opal-CT shows a peak corresponding
to a d value ranging from 4.06 to 4.11 Å, while
Caucia et al_periodico 18/04/12 12:29 Pagina 98
98
Periodico di Mineralogia (2012), 81, 1, 93-106
opal C is characterized by a peak between 4.02
and 4.05 Å and by the presence of two other
peaks at 3.13 and 2.84 Å (Fritsch et al., 2004:
Ghisoli et al., 2010). For the evaluation of the
ratio, we used the following equation (Ghisoli
et al., 2010):
d Trid - d measured
4.11 Å - x
C/TXRPD =
=
d Trid - d Crist
4.11 Å - 4.04 Å
XRPD analyses showed that samples 10 and
12 are fully amorphous; sample 1 is a CT type
close to pure tridymite (C < 10 % T > 90 %)
while sample 7 is a “pure” C type as is almost
completely made up by well crystallized αcristobalite. Opals 8, 9 (from Caselette), 2, 3, 4,
5, 6 (from Baldissero) and 11 (Case Montanini)
belong to the CT type with a crystalline portion
variably composed by C = 43% T = 57%
(samples 2 and 9), C = 14% T = 86% (samples 3
and 4), C = 28 % T = 72 % (samples 5 and 8),
and C = 71 % T = 29 % (sample 6). In Figure 1
A, B and C, some typical XRD patterns of opalsCT, -A and -C s investigated in this work are
reported. In general, opals-C and -CT are of
volcanic origin, opals-C being rarer than opalsCT (Jones and Segnit, 1971; Ostrooumov et al.,
1999; Fritsch et al., 2004; Simoni et al., 2010).
Our results are also consistent with the findings
by Elzea and Rice (1996) that opal-C and opalCT are part of a continuum of disordered
intergrowths between end-members cristobalite
and tridymite stacking sequences.
X-ray Powder Diffraction (XRPD) on matrix
We analysed two samples of matrix from
Caselette, one from Baldissero and one from
Case Montanini. Unfortunately, since the
material that was possible to collect was very
few, these analyses cannot provide complete
indication about the mineralogical composition
of the host rocks. Anyway they can be very
useful to determine the provenance of some trace
F. Caucia et al.
elements in the opals.
The matrix of opals from Caselette is mostly
made up by abundant cristobalite, tridymite and
smectite, with few corrensite.
The matrix of one opal from Baldissero is
mostly made up by tridymite, lower cristobalite,
some todorokite and clay minerals like
chlorite/smectite mixed layers. The presence of
clay minerals indicate the source rocks underwent
extensive alteration, probably due to weathering
or hydrothermal processes, that might also be
related to the formation of opals.
The matrix of the samples from Case Montanini
is mostly made up by Mg Calcite with lower
amount of feldspar, chlorite, muscovite, quartz
and dolomite.
IR Spectroscopy
We have analyzed through IR spectroscopy the
samples n. 1, 3, 9 and 12 (Figure 4A, B, C, D)
and the results have been compared with the
XRPD data; the combination of these analyses
can provide useful information about the
composition of the opals. By XRPD, the opals 1,
3, 9 and 12 have been identified as follows :
sample n. 1 trydimitic opal-CT (C < 10 %, T >
90 %); samples n. 3 and 9 opal-CT, sample n. 12
A-opal (Table 1).
The samples investigated in this work are
characterized by an absorption band in the range
3435 - 3467 cm-1 due to the OH stretching
vibration of water molecules as well as the water
bending vibration at ~ 1638 cm-1. We also
observe three other strong bands at ~ 1105 cm-1,
790 cm-1 and 475 cm-1 that are common to all
silicates with tetrahedrally coordinated silicon
and are generally assigned to the stretching
vibration of Si-O.
In particular, the 1100 and 790 cm-1 bands are
generally assigned, respectively, to antisymmetric
and symmetric Si-O-Si stretching, whereas the
470 cm-1 band is related to O-Si-O bending
vibration (Jones and Segnit, 1971; Farmer, 1974;
Caucia et al_periodico 18/04/12 12:29 Pagina 99
Periodico di Mineralogia (2012), 81, 1, 93-106
Physical and chemical properties of some italian ...
99
A
B
C
Figure 3. XRPD
patterns of the
investigated opals.
A) sample n. 7
(from Baldissero),
opal-C;
B) sample n. 9
(from Caselette),
opal-CT;
C) sample n. 12
(from
Silius),
opal-A.
Caucia et al_periodico 18/04/12 12:29 Pagina 100
100
Periodico di Mineralogia (2012), 81, 1, 93-106
F. Caucia et al.
Fritsch et al., 2004; Brajkovic et al., 2007; Caucia
et al., 2008; Adamo et al., 2010).
In general C-opals show the absorption bands
of well-ordered α-cristobalite, consisting of a
peak at about 620 cm-1 and a shoulder at 11981200 cm-1 on the 1100 cm-1 absorption band.
These absorption bands, in particular the 620
cm-1 sharp peak, are always absent in the FTIR
spectra of opal-CT and A, and are therefore
diagnostic markers for opal-C (Jones and Segnit,
1971; Farmer, 1974; Caucia et al., 2009; Adamo
et al., 2010). Since these bands are not present,
our samples can’t be classified as C opals.
In general, the band at 790 cm-1 shows the
highest value in opal-A (796-801 cm-1), the
lowest in opal-CT (788-792 cm-1), whereas opalC has intermediate value (793-794 cm-1; Adamo
et al., 2010). The samples n. 1 (Figure 4A), 3
(Figure 4B) and 9 (Figure 4C) show a band at
about 789-1 and can therefore be considered as CTopals while the sample n. 12 (Figure 4D) shows
the band at 801-1, which is typical of A-opal.
In conclusion, IR spectroscopy highlighted that
the opals 1, 3, 9 (from Piedmont) can be identified
as CT-opals, while the opal n. 12 (from Silius) is
an A-opal. The tridymitic opal CT (sample n. 1)
cannot be distinguished from the other opals CT.
IR spectroscopy analyses therefore confirm the
XRPD results.
analyzed through LA-ICP-MS microanalyses for
the determination of impurities and trace elements
composition, with particular attention to the
chromophore elements (Table 3).
It is known that the chemical composition of
opals is mostly linked to that of host rocks and
influences opal properties like color and
luminescence (McOrist and Smallwood, 1997;
Gaillou et al., 2008; Caucia et al., 2009; Simoni
et al., 2010). The body color is usually related to
inclusions of colored minerals while the
abundances of some elements determine the color
of the opal (McOrist and Smallwood, 1997;
Fritsch et al., 2004; Gaillou et al., 2008, and
references therein). To the best of our knowledge,
analyses on the chemical composition of trace
elements in the Italian opals have never been
conducted before. Therefore, in this work, the
relationships between the color and chemical
composition of some Italian opals have been
investigated for the first time. The main detected
impurities resulted to be Mg (400-900 ppm), Fe
(35-420 ppm) and, subordinately, Ca (72-111
ppm) and Ni (20-65 ppm). Mn was clearly
detected (about 40 ppm) in the samples 1 and 6
while is absent in the others. Sc and Cr have been
detected in all the samples, but in very low
amount (4-6 ppm and 4-11 ppm respectively). Ba
was detected, in low amount, only in the samples
1 and 6 while is absent in the others. Elements
like Ti, V, Co, Pb, Zn, are present only
occasionally and in low amounts. REE, U, Rb, Y,
Zr, Nb, Cs, Hf, Au, Pb, Sn, Th, As, Ag resulted
Laser Ablation ICP-MS Analysis
The opal samples 1, 6, 8, 9 and 12 have been
Table 3. Trace elements abundances (ppm) for the opals analysed in this work. Columns in bold include
chromophore elements.
Samples
1
6
8
9
12
Mg
900
880
760
700
400
Fe
250
268
400
421
35
Ca
111
72
96
75
92
Ni
56
52
65
51
20
Cr
7
6
10
10
4
Sc
6
6
5
6
4
Ba
5
4
-
Ti
2
1
5
5
-
V
1
1
2
2
-
Co
1
1
-
Pb
10
8
8
-
Zn
6
6
2
1
-
Mn
42
43
1
-
Cu
3
3
15
28
-
Li
1
-
B
12
D
A
9
C
Periodico di Mineralogia (2012), 81, 1, 93-106
Figure 4. IR spectra of the analyzed opals. A) sample 1 from Baldissero Canavese (CT opal); B) sample 3 from Baldissero Canavese (CT opal); C)
sample 9 from Caselette (CT opal); D) sample 12 from Silius (A opal).
3
1
Caucia et al_periodico 18/04/12 12:29 Pagina 101
Physical and chemical properties of some italian ...
101
Caucia et al_periodico 18/04/12 12:29 Pagina 102
102
Periodico di Mineralogia (2012), 81, 1, 93-106
F. Caucia et al.
below the detection limits.
Samples 1 and 6 from Baldissero are
distinguished by the highest Mg content (around
900 ppm), the appreciable amount of Mn (around
40 ppm) and some Pb, Ba and Zn. Samples 8 and
9 from Caselette differ from the others for the
highest Fe content (400 and 421 ppm). Sample
12, which is a hyalite opal from Silius (opal A
with botroydal aspect), is characterized by the
lowest Mg content (400 ppm), Ni (20 ppm) and
especially Fe (35 ppm). In general, we observe
that typical chromophore elements like V, Cr, Cu,
Ti, Co (columns in grey) are low in all the
investigated opals and their presence does not
seem related to the color of the gem. Ni is more
abundant and can be responsible for the yellowish
green color, but no UV -visible absorption
spectrum has been acquired to confirm this
hypothesis. Conversely, Fe contents are likely
related with the color of the opals: the brownish
color of sample 9 is due to the highest content of
Fe while the lower quantities in opals 1, 6 and 8
determine the yellow tint. Sample 12, which
features the lowest Fe content, is the only
colorless opal. A clear correlation between Fe
content with the color of the gem was also
observed in the opals from Bemia in Madagascar
(Table 4) (Simoni et al., 2010), from Brazil
(Caucia et al., 2009) (Table 5) and other
occurrences as well (Gaillou et al., 2008). Fe in
opals probably occurs as inclusions of Fe
oxyhydroxides that determine the yellow or
orange color (Fritsch et al., 2002, Gaillou et al.,
2008). Mn has been detected only in samples 1
and 6 and is due to the presence of dendrites of
todorokite; as a matter of fact this mineral has
been also detected by XRD investigation on the
matrix. Ca and Mg are non-chromophore
elements, and are present in relevant amounts; Mg
probably derives from the matrix, which is largely
formed by Mg rich minerals like smectite,
smectite/chlorite mixed layer and corrensite (see
also Jerwis 1873; Fenoglio and Sanero 1943).
Also, we observe that the Italian opals
investigated in this work are characterized by very
low amounts of Ba, that are around 5 % or also
below the detection limits. According with
Gaillou et al. (2008), Ba concentration allow to
differentiate sedimentary opals from volcanic
ones, as the first feature Ba contents > 120 ppm,
while the volcanic opals show lower contents.
This is because Ba in the sedimentary opals
generally derives from the dissolution, through
several weathering cycles, of the detrital feldspars
occurring in sedimentary rocks, that is
subsequently dissolved into the water from which
the opals form. Conversely, feldspars in a
volcanic environment are subjected to only one
cycle of weathering and, therefore, the Ba content
in water is much lower (Fagel et al., 1999;
Davidson et al., 2005; Gaillou et al., 2008). The
very low Ba values of Italian opals support a
Table 4. Trace elements abundances (ppm) for opals from Bemia, Madagascar (from Simoni et al., 2010).
Samples
color
Mg
<>
Fe
<>
Ca
<>
yellowish 1122 137 1238
white
yellow
891 1888 370
orange 17730 12070 1314
<> = Average value
Ni
<>
Cr
<>
Sc
<>
Ti
<>
V
<>
Co
<>
Pb
<>
Zn
<>
Mn Cu Li
<> <> <>
5
3
4
6
5
3
62
12
4
2
1
0.5
1
6
7
87
13
10
1
1
3
54
1
1
1
1
2
1
2
2
1
1
1
Caucia et al_periodico 18/04/12 12:29 Pagina 103
Periodico di Mineralogia (2012), 81, 1, 93-106
Physical and chemical properties of some italian ...
Table 5. Trace elements abundances (ppm) for opals from Piauì, Brazil (from Caucia et al., 2009).
Samples
color
sky blue
gold yellow
brick red
Mg
<>
10
49
60
<> = Average value
Fe
<>
3
132
1164
Ni
<>
0.5
1
1
Cr
<>
0.5
1
1.5
volcanic origin; this is also demonstrated if we
plot our results in the Ca-Ba diagram from
Gaillou et al. (2008), that reports the different
compositional fields of opals in the world.
It can be interesting to compare the trace element
composition of the opals analyzed in this work
with that of blue and fire opals from Piauí in Brazil
(Caucia et al., 2009; Table 5); fire opals from
Bemia in Madagascar (Simoni et al., 2010; Table
4) and other occurrences worldwide (Gaillou et al.,
2008), to evaluate differences and similarities.
The most surprising result in our samples is
represented by the relatively high content of Ni,
as this element is generally present in much
lower amount in the opals worldwide (frequently
less than one ppm; Gaillou et al., 2008). Large
quantities of Ni have been detected only in the
green opals from Tanzania and in those from
Silesia, where Ni is contained in the structure of
pimelite, a Ni rich variety of smectite (Schmetzer
et al., 1976; Koivula and Fryer, 1984; Shingley
et al., 2009). It is likely that also Ni in our
samples is contained in the structure of clay
minerals like smectite or mixed layers, that
easily incorporate or adsorb transition elements;
these mineral have been indeed detected in the
samples of matrix from Caselette and Baldissero.
Even if the number of analysed samples is quite
low, Ni abundance might be therefore used as
marker to characterize the Italian opals
(especially from Piedmont).
According to Gaillou et al. (2008), Ca is the
only element in opals that varies significantly
Sc
<>
4
4
7
Ti
<>
2
16
86
V
<>
1
0.5
0.5
Co
<>
1
0.3
Mn
<>
0.5
0.5
7
Cu
<>
9
13
29
103
Ba
<>
4
15
with the geographic origin of the samples and can
therefore be useful to determine the provenance.
Ca contents in Italian opals are quite low but in
the range of the opals worldwide and show a
homogeneous composition. Ca contents can be
compared with that of opals from Mexico and
Honduras (Gaillou et al., 2008) but are lower, or
much lower, of that of opals from other regions
where this element show concentration of some
thousands ppm (for instance, Madagascar; Table
4; see also Gaillou et al., 2008). Concerning Mg
and Fe, these elements in opals worldwide can
show a large variability, between few units to
some thousands ppm, but cannot be related to
some specific areas (see Gaillou et al., 2008;
Tables 4 and 5). Mg and Fe contents in Italian
opals are in the range of opals worldwide and
show a homogeneous composition. For instance,
we observe that Mg contents in Italian opals are
higher than in the opals from Brazil but lower
than those from Madagascar (see Tables 4 and 5).
Also, Fe in Italian opals is higher than in the sky
blue opals, and much lower than the brick red
opals from Brazil or the yellow and orange from
Madagascar. Lastly, opals from the mentioned
foreign localities exhibit a variability larger than
that observed in the Italian samples, which
appears more limited. Even if the number of
samples analyzed in this work is rather limited, it
appears that the trace element composition of
Italian opals is rather homogeneous, especially in
the case of samples of common opal from
Piedmont. Sample n. 12, which is the hyalite opal
Caucia et al_periodico 18/04/12 12:29 Pagina 104
104
Periodico di Mineralogia (2012), 81, 1, 93-106
from Sardinia, partly differs from the others for
the even lower content in trace elements.
Conclusions
Italian opals do not have the relevant
gemological properties, such as the play-ofcolor, typical of some opals from other countries.
However, some samples of Italian opal are
aesthetically valuable for their qualities such as
iridescence, the presence of metallic inclusions
of todorokite and their color variability. As a
result, and also for their rarity, Italian opals
appear to be well appreciated by collectors.
Italian opals analyzed in this work show different
colors and variable degrees of luster and
transparency; black and metallic inclusions,
consisting of todorokite, are often observed. No
play-of-colors have been observed, but some
opals show the presence of iridescent zones;
play-of-colors, as well as iridescence, are
appreciated optic qualities in the gem market.
Several samples show a typical opalescence and
the fracture is usually conchoidal. The values of
specific gravity and refractive index of four cut
opals are comparable with the range of data in
literature. XRPD and IR spectroscopy analyses
highlighted Italian opals can be classified as A,
CT and C types, but most of them are opals-CT.
This composition supports a volcanic origin. The
analyses on the matrix of opals from Piedmont
also highlighted the occurrence of cristobalite,
tridymite, todorokite, clay minerals like smectite,
corrensite and chlorite/smectite mixed layers.
The presence of clay minerals indicates the
source rocks underwent extensive alteration,
probably due to weathering or hydrothermal
processes; these processes might also be related
to the formation of opals.
Impurities and trace element contents in the
opals can be, at least partially, related to the color
and composition of the matrix of the opal. The
most abundant impurities are Mg, Fe, Ca and Ni.
Ca and Mg (non chromophore elements) are
F. Caucia et al.
probably inherited from the matrix; in particular
Mg can derive from clay minerals. Ba shows
very low content and this would support a
volcanic origin of the opals. Chromophore
elements like V, Cr, Cu, Ti, Co are present in
very low contents and do not seem to influence
the physical properties of the Italian opals
analyzed. Ni is present in noticeable amounts,
might lead to a yellowish-green color of a
sample, but does not seem responsible for the
coloration of the others; it probably derives from
clay minerals. Mn is clearly detected only in two
samples and is related to the presence of
dendrites of todorokite. As also observed in
several opals from other parts of the world, Fe
appears to be the main factor that determines the
red to brown component. Although the number
of analysis performed in this work is limited, it
seems that the Italian opals show a rather
homogeneous trace element composition which
is in the range of composition for opals from
other locality, except for their unusual Ni
content. Ni could therefore be a useful
geochemical tracer to separate Italian opals from
opals from other localities.
Acknowledgements
The authors are grateful to Dr. Alberto Zanetti (IGGCNR - Pavia) for the assistance with LA-ICPMS
analysis. Special thanks also to the “Associazione
Micro-mineralogica
Italiana”,
to
“Gruppo
Mineralogico Basso Canavese” and “Museo Don
Bosco di Torino”, that kindly provided the samples for
the analysis. We are also particularly grateful to Eloise
Gaillou and an anonymous referee for reviews and
improvement of the manuscript.
References
Adamo I., Ghisoli C. and Caucia F. (2010) - A
contribution to the study of FTIR spectra of opals.
Neues Jarbuch für Mineralogie Abhandlungen, 187,
63-68.
Adorni F., Tadeo F. and Adorni B. (2004) - La
melanoflogite di Case Montanini. Rivista
Caucia et al_periodico 18/04/12 12:29 Pagina 105
105
Periodico di Mineralogia (2012), 81, 1, 93-106
Physical and chemical properties of some italian ...
Mineralogica Italiana, 3, 126-136.
Altaner S.P., Ylagan R.F., Savin S.M., Aronson J.L.,
Belkin H. and Pozzuoli A. (2003) - Geothermometry,
geochronology and mass transfer associated with
hydrothermal alteration of a rhyolitic hyaloclastite
from Ponza Island, Italy. Geochimica et
Cosmochimica Acta, 67, 275-288.
Brajkovic A., Rolandi V., Vignola P. and Grizzetti R.
(2007) - Blue and Pink Opals from Acari, Peru Their optical, structural and spectroscopic features.
The Australian Gemmologist, 23, 1, 3-15.
Caucia F., Ghisoli C., Adamo I. and Bocchio R. (2008)
- Opals-C, opals-CT and opals-T from Acari, Peru:
X-ray powder diffraction analysis and IR
spectroscopic investigation of new samples showing
two different typologies of lustre. The Australian
Gemmologist, 23, 266-271.
Caucia F., Ghisoli C. and Adamo I. (2009) - A study on
the characteristics of some C- and CT-opals from
Brazil. Neues Jarbuch fur Mineralogie
Abhandlungen, 185, 289-296.
Cerri G., Cappelletti P., Langella A. and de Gennaro M.
(2001) - Zeolitization of Oligo-Miocene
volcaniclastic rocks from Logudoro (northern
Sardinia, Italy). Contribution of Mineralogy and
Petrology, 140, 404-421.
Davidson P., Kamenetsky V., Cooke D. and Frikken P.
(2005) - Magmatic Precursors of Hydrothermal
Fluids at the Río Blanco Cu-Mo Deposit, Chile:
Links to Silicate Magmas and Metal Transport.
Economic Geology, 100, 963-978.
Elzea J.M. and Rice S.B. (1996) - TEM and X-ray
diffraction evidence for cristobalite and tridymite
stacking sequences in opal. Clays & Clay Minerals,
44, 492-500.
Fagel N., André L. and Dehairs F. (1999) - Excess Ba
advective transport evidenced from trap and sediment
geochemical
signatures.
Geochimica
et
Cosmochimica Acta, 63, 2353-2367.
Farmer V.C. (1974) - The infrared spectra of minerals.
Mineralogical Society, London, UK, 539 p.
Fenoglio M. and Sanero E. (1943) - Sulla presenza e
diffusione della cristobalite negli opali dei giacimenti
di magnesite delle Prealpi Piemontesi. Atti
Accademia delle Scienze, Torino, Cl. Sci. Fis., Mat.
Nat. 78, 265-273.
Fritsch E., Ostrooumov M., Rondeau B., Barreau A.,
Albertini D., Marie A.M., Lasnier B. and Wery J.
(2002) - Mexican gem opal: nano- and micro-
structure, origin of color and comparison with other
common opals of gemmological significance. The
Australian Gemmologist, 21, 230- 233.
Fritsch E., Gaillou E., Ostroumov M., Rondeau B.,
Devouard B. and Barreau A. (2004) - Relationship
between nanostructure and optical absorption in
fibrous pink opals from Mexico and Peru. European
Journal of Mineralogy, 16, 743-752.
Gaillou E., Delaunay A., Rondeau B., Bouhnik Le Coz
M., Fritsch E., Cornen G. and Monnier C. (2008) The geochemistry of gem opals as evidence of their
origin. Ore Geology Reviews, 34, 127-133.
Gaillou E., Fritsch E. and Massuyeau F. (2012) Luminescence of gem opals: a review of intrinsic and
extrinsic emission. Australian Gemmologist, 24, 200201.
Gamboni A., Gamboni T. and Nonnis O. (1997) - I
minerali dell’arcipelago di La Maddalena - P. Sorba
Editore, La Maddalena.
Gamboni A., Gentile P., Mascia S., De Vito A. and
Gamboni T. (2004) - Monte Canu: uranofane-beta e
altri minerali delle pegmatiti granitiche. Rivista
Mineralogica Italiana, 3, 138-145.
Ghiara, M.R., Petti C., Franco E., Lonis R., Luxoro S.
and Gnazzo L. (1999) - Occurrence of clinoptilolite
and mordenite in Tertiary calc-alkaline pyroclastites
from Sardinia (Italy). Clays & Clay Minerals, 47,
319-328.
Ghisoli C., Caucia F. and Marinoni L. (2010) - XRPD
patterns of opals: A brief review and new results from
recent studies. Powder Diffraction, 25, 274-282.
Giuliani G., Chaudisson M., Schubnel H.J., Piat D.,
Rollion Bard C., France Lanord C., Giard C., De
Narvaez D. and Rondeau B. (2000) - Oxygen
isotopes and emerald trade routes since antiquity.
Science, 287, 631-633.
Hintze C. (1915) - Handbuch der Mineralogie. I (2).
Leipzig, Verlag Von Veit.
Jerwis G. (1873/1881) - I tesori sotterranei d’Italia. Ed.
Loescher, Torino.
Jones J.B. and Segnit E.R. (1971) - The nature of opal.
Part 1: Nomenclature and constituent phases. Journal
of the Geological Society Australia, 8, 57-68.
Klein C. (2004) - Mineralogia. Zanichelli Bologna.
Koivula J.I. and Fryer, C.W. (1984) - Green opal from
East Africa. Gems & Gemology, 20, 226-227.
Mariani P. and Scaini G. (1978) - I minerali d’Italia.
Rizzoli.
Mc Orist G.D. and Smallwood A. (1997) - Trace
Caucia et al_periodico 18/04/12 12:29 Pagina 106
106
Periodico di Mineralogia (2012), 81, 1, 93-106
elements in precious and common opals using
neutron activation analysis. Journal of
Radioanalytical and nuclear Chemistry, 223, 9-15.
Miller C., Zanetti A., Thöni M., Konzett J. and Klötzli
U. (2012) - Mafic and silica-rich glasses in mantle
xenoliths from Wau-en-Namus, Libya: Textural and
geochemical evidence for peridotite-melt reactions.
Lithos, 128, 11-26
O’Donaghue M. (2006) - Gems, 6th ed. ButterworthHeinemann, Oxford, UK.
Olmi F., Sabelli C., Senesi F. and Stara P. (2002) - La
mineralizzazione uranifera di Arcu su Linnarbu. Rivista Mineralogica Italiana, 3, 148-169.
Ostrooumov M., Fritsch E., Lasnier B. and Lefrant S.
(1999) - Spectres Raman des opales: Aspect
diagnostique et aide a la classification. European
Journal of Mineralogy, 11, 899-908.
F. Caucia et al.
Schmetzer K., Berdesinski W. and Krupp H. (1976) Grüner Opal aus Tansania. Der Aufschluß, 27, 381384.
Van Der Marel H.W. and Beutelspacher H. (1976) Atlas of infrared spectroscopy of clay minerals and
their admixtures. Elsevier Scientific Publishing
Company, Amsterdam.
Shigley J.E., Laurs, B.M. and Renfro N.D. (2009) Chrysoprase and Prase Opal from Haneti, Central
Tanzania. Gems & Gemology, 45, 271-279.
Simoni M., Caucia F., Adamo I. and Galinetto P. (2010)
- New occurrence of fire opal from Bemia,
Madagascar. Gems & Gemology, 46, 2, 114-121.
Submitted, June 2011 - Accepted, March 2012
© Copyright 2026 Paperzz