ISAE Istituto di Studi e Analisi Economica
ACQUISITION VERSUS GREENFIELD
INVESTMENT: THE LOCATION OF FOREIGN
MANUFACTURERS IN ITALY
by
Roberto Basile
ISAE
Rome
October, 2002
The Series “Documenti di Lavoro” of the Istituto di Studi e Analisi Economica Institute for Studies and Economic Analyses (ISAE) hosts the preliminary results
of the research projects carried out within ISAE. The diffusion of the papers is subject
to the favourable opinion of an anonymous referee, whom we would like to thank. The
opinions expressed are merely the Authors' own and in no way involve the ISAE
responsability.
The Series is meant for experts and policy-makers with the aim of submitting
proposals and raising suggestions and criticism.
La serie “Documenti di Lavoro” dell’Istituto di Studi e Analisi Economica ospita i
risultati preliminari di ricerche predisposte all’interno dell’ISAE. La diffusione delle
ricerche è autorizzata previo il parere favorevole di un anonimo esperto della materia
che qui si ringrazia. Le opinioni espresse nei “Documenti di Lavoro” riflettono
esclusivamente il pensiero degli autori e non impegnano la responsabilità dell’Ente.
La serie è destinata agli esperti ed agli operatori di politica economica, al fine di
formulare proposte e suscitare suggerimenti o critiche.
ABSTRACT
This paper investigates the location of foreign direct investment (FDI) in Italy
over the period 1986-1999. FDI are measured through the frequencies of
acquisitions and greenfield investments per province and sector, so count data
models are applied. The results show that the location determinants strongly
differ according to the foreign entry mode. Unlike the results of many other
studies, foreign ventures do not emulate their domestic counterparts. When
foreign firms decide to make a greenfield investment in Italy, they are strongly
influenced by location decisions of previous foreign investors, but they must
also take into account congestion costs mainly linked to the lack of available
labor force in the big northern cities. Thus, Southern provinces (with high
unemployment rates) have a high potential attractiveness, which might be
implemented with a strong investment in public infrastructures, as demonstrated
by simulations. Foreign acquisitions are affected not only by supply of
acquisition candidates, but also by the other location characteristics, such as the
demand level, public infrastructure, stock of foreign firms and unit labor costs.
JEL Classification: F23, R30, C35
Key words: Foreign Direct Investments; Location; Count Data Models
Acknowledgements
I would like to thank an anonymous referee for helpful suggestions. I wish also to thank
Marco Mutinelli for providing data on FDI, Tahir Andrabi, Jeff Nugent and the other
participants at the 77th WEA International Annual Conference in Seattle (June 22- July 3,
2002).
2
NON-TECHNICAL SUMMARY
This paper investigates the location of foreign direct investment (FDI) in Italy
over the period 1986-1999. As in many other countries, the geographical
distribution of inward FDI is characterised by huge asymmetries: FDI inflows
are strongly concentrated in the North-West; on the other hand, it is commonly
accepted that FDI to the Mezzogiorno of Italy are disappointingly few. This
paper has a two-fold objective. On the one hand, it analyzes the role of different
kinds of externalities (such as agglomeration economies and public
infrastructures) as FDI locational determinants. Since inward FDI are mainly
driven by acquisitions rather than by greenfield investments, the paper explores
which factor mainly influence the location of the two types of investments. On
the other hand, it is aimed at assessing the common assertion that FDI to the
South are disappointingly few.
The results show that the main location determinants strongly differ according to
the type of foreign investment considered. Firstly, foreign acquisitions’
geographical distribution is not only constrained by the supply of acquisition
candidates. The consistent significance of variables other than the stock number
of existing firms (such as public infrastructures and the prior concentration of
foreign manufacturing firms within the province, as well as in adjacent
provinces) confirms that supply alone does not decide the location of foreign
acquisitions flows in Italy. Thus, scholarly disinterest in the distribution of
acquisitions is unjustified.
Differently from the results of many other studies, foreign ventures in Italy do
not emulate their domestic counterparts. In other words, ceteris paribus, foreign
business groups do not invest more intensively in those regions where there is a
higher concentration of other firms. When foreign investors decide to build new
production facilities in Italy, they are strongly influenced by location decisions
of previous ‘foreign’ investors, but they also must take into account congestion
costs (which contrast agglomeration forces) mainly linked to the lack of
available labor force, especially in the big Northern cities. Therefore, high
unemployment provinces in the South have a greater potential capability of
attracting greenfield FDI than Northern-Central ones.
However, the potential attractiveness of Southern provinces can only emerge if
certain conditions are met: firstly, the necessary infrastructures are to be created;
secondly, the gap between the labor cost and the productivity trends must be
narrowed; thirdly, an adequate system of public incentives aimed at favoring
foreign direct investments must be created.
In particular, with regard to the infrastructures, the results of some simulations
suggest that, with endogenous agglomeration effects in force (foreign firms
seem to prefer provinces chosen by other foreign investors), a small
improvement in the public infrastructure stock does not affect the regional
3
distribution of FDI. Only a very strong leap forward in Southern infrastructures
might allow a significant reallocation of foreign capital towards Southern
regions. This finding is very important, since each year the actual expenditure
for public works systematically falls short of the planned figure.
4
ACQUISIZIONI E INVESTIMENTI GREENFIELD: LA LOCALIZZAZIONE DELLE IMPRESE MANIFATTURIERE STRANIERE IN
ITALIA
SINTESI
Questo lavoro analizza la localizzazione degli investimenti diretti esteri (IDE) in
Italia nel periodo 1986-1999. I flussi di IDE sono misurati come numero di
acquisizioni e investimenti greenfield in ciascuna provincia e in ciascun settore;
si applicano quindi i modelli per count data. I risultati mostrano che le
determinanti della localizzazione differiscono ampiamente a seconda della
modalità di entrata. Contrariamente a quanto riscontrato in molti altri lavori, gli
investitori stranieri non sembrano emulare le scelte localizzative degli investitori
nazionali. Quando le imprese straniere decidono di effettuare investimenti
greenfield in Italia, esse sono fortemente condizionate dalle decisioni
localizzative dei precedenti investitori stranieri, ma devono anche tener conto
dei costi di congestione principalmente connessi alla mancanza di forza lavoro
disponibile nelle grandi città del Nord. Pertanto, le province meridionali, con i
loro alti tassi di disoccupazione, sembrano possedere un potenziale di attrazione
molto elevato, il quale, come dimostrano alcune simulazioni, potrebbe essere
sfruttato tramite grossi investimenti in infrastrutture pubbliche. Le acquisizioni
straniere sembrano condizionate non solo dall’offerta di imprese candidate, ma
anche da altre caratteristiche localizzative, come il livello della domanda, le
infrastrutture pubbliche, lo stock di imprese straniere e il costo del lavoro per
unità di prodotto.
Classificazione JEL: F23, R30, C35
Parole chiave: Investimenti diretti esteri; Localizzazione; Modelli per Count
Data
5
CONTENTS
INTRODUCTION
Pag.
7
1. THE LOCATION DETERMINANTS OF FDI IN ITALY:
SOME HYPOTHESES
“
9
2. DATA AND VARIABLES
“
14
3. REGRESSION RESULTS
“
18
“
“
“
18
21
23
“
24
“
27
“
“
“
30
32
34
3.1 A dartboard specification: does the number of investments
in the South fall short of its market potential?
3.2 Foreign acquisitions’ location determinants
3.3 Foreign greenfield investments’ location determinants
3.4 Foreign greenfield investments’ location determinants:
an extension
4. PUBLIC INFRASTRUCTURES AS LOCATION DETERMINANTS: COUNTERFACTUAL POLICY EXPERIMENTS
5. CONCLUDING REMARKS AND POLICY IMPLICATIONS
APPENDIX: ECONOMETRIC SPECIFICATIONS
RFERENCES
6
INTRODUCTION
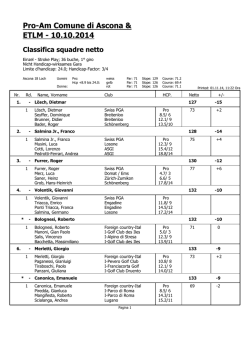
Over the last fifteen years, the Italian economy has shown to be hardly able to
attract foreign direct investments (FDI). According to the data collected by the
Politecnico of Milan on the number of new foreign acquisitions and greenfield
investments in Italy, the major increase of inward FDI occurred from 1987 to
1989 (Figure 1). In the two following years (1990-1991), the number of new
inward FDI steeply decreased. Afterwards, in spite of the Lira devaluation
occurred in 1992, the number of new foreign entrants did not significantly vary.
Admittedly, over the last decade, the Italian Government has not changed its
policy in the attempt to attract new FDI.
Figure 1
Number of manufacturing firms acquired and created by foreign firms in
Italy, 1986-99
35
200
180
30
160
25
140
120
20
100
15
80
60
10
40
5
20
0
0
1986
1987
1988
1989
1990
1991
1992
1993
Greenfield (right hand scale)
1994
1995
1996
1997
1998
1999
Acquisitions
Source: Data Bank Reprint, Politecnico of Milan
A less-debated and scarcely analysed issue concerns the location determinants of
foreign manufacturing firms within the country. In Italy, as well as in many
other countries, the geographical distribution of inward FDI is characterised by
huge asymmetries1: FDI inflows are strongly concentrated in the North-West
(the most industrialised area), Milan and Turin being the main target provinces.
1
Many other studies carried out in the United States, in Canada, in the United Kingdom and
in other European countries, as well as in some developing countries (such as China), have
outlined the strong concentration of FDI in the core regions of each country and have
analysed the location determinants of FDI (Glickman and Woodward, 1988; Bagchi-Sen and
Wheeler, 1989; Coughlin et al., 1991; Hill and Munday, 1991; Woodward, 1992; Friedman et
al., 1992; Hines, 1996; O’hUallachain and Reid, 1997; Chunlai, 1997; Devereux and Griffith,
1999; Head et al., 1999, Wei, 1999; Belderbos and Carree, 2000).
7
On the other hand, it is commonly accepted that FDI to the South (the
Mezzogiorno of Italy, that is the least developed area) are disappointingly few
(Mariotti and Mutinelli, 1999).
However, stating that the Mezzogiorno is hardly attractive, basing on the simple
comparison with the FDI flows towards the North of Italy, may be misleading.
The regional potential attractiveness might depend on a variety of demand- and
supply-side factors. Thus, it would be better to compare the attractiveness of
each geographical area, after controlling for the basic FDI location determinants.
This is what this paper tries to do, as it analyses the relationship between the
number of new foreign entrants in each Italian province, corresponding to the
NUTS 3 level in the official EU classification (e.g. dèpartements in France,
counties in the UK, provincial in Spain), and the various provincial
characteristics, which are expected to affect the FDI location. In particular, this
paper has a two-fold objective. On the one hand, it analyzes the role of different
kinds of externalities (such as agglomeration economies and public
infrastructures) as FDI locational determinants in Italy. Since inward FDI in
Italy are mainly driven by acquisitions rather than by greenfield investments, the
paper explores which factor mainly influence the location of the two types of
investments2. On the other hand, it is aimed at assessing the common assertion
that FDI to the South are disappointingly few.
To fulfil this goal, the effects of different potential location factors are tested by
directly modelling individual firms’ entry decisions. Since data are available at a
semi-aggregate level (number of firms acquired and created by foreign firms in
different manufacturing industries in each Italian province during the period
1986-1999), the final econometric model explains the number of new foreign
entrants in each province/sector3. Starting from the recognition of the discrete
nature of the dependent variable (non-negative integers with presence of zeros)
and of the high dispersion characterising its distribution, count data models are
applied.
The relevance of the paper lies in the evaluation of the benefits deriving from
foreign manufacturing firms within a region. These benefits are well known and
recall those generally cited in the literature on the role of large firms in least
developed regions (see Giunta et al. 2000, for the case of Mezzogiorno): job
creation, development of subcontracting relationships with local small and
2
Greenfield investment refers to the construction of new production facilities by an investor,
while acquisition is the purchase of existing assets (see also O’Huallachain and Reid, 1997).
3
Mariotti and Piscitello (1994) carried out a similar analysis for the period 1986-1991.
8
medium-sized firms, introduction of new technologies, skills and capital4. In the
perspective of a stronger European economic integration, Southern economy
must aggressively compete to attract new manufacturing plants (from other
Italian regions and from abroad) by offering a variety of industrial location
factors (e.g. infrastructure, tax incentives)5. This paper may help understand the
real competitiveness of the South of Italy in supplying such location factors.
The paper is organized as follows. Section 2 discusses the hypotheses
concerning the location determinants of foreign firms. Section 3 presents the
variables introduced in the econometric model. Section 4 shows the empirical
findings. Section 5 reports some simulation results. The last Section provides the
concluding remarks and the policy prescriptions.
1. THE LOCATION DETERMINANTS OF FDI IN ITALY: SOME
HYPOTHESES
During the period 1986-92, more than 50% of the total number of FDI in Italy
were oriented to Northwestern regions; 35% to the North-East-Center (NEC)
regions (the so-called ‘Third Italy’); while, the share of FDI inflows to the South
was only 8.7% (Table 1)6. In the following period (1993-99), the share of new
foreign entrants in the Northwest decreased in favor of NEC (especially in
traditional sectors, machinery and transportation), while the relative position of
the South did not improve at all (with the exception of chemicals).
Now, it is worth stressing that FDI inflows in Italy are mainly driven by mergers
and acquisitions, while the number of foreign greenfield start-ups is very low
(see Figure 1)7. As it is well known, the location process of those two
4
Recently, many theoretical and empirical contributions have shown that inward FDI can
generate positive externalities on the host country and that the extent to which domestic firms
benefit from foreign presence might be geographically bounded. Nevertheless, it has also
been noticed that multinational firms can induce monopolistic pressures which crowd out
domestic firms and impoverish local economic systems (see Blomstrom and Kokko, 1998).
For the case of Italy, Castellani and Zanfei (2001) examined the foreign presence impact on
the productivity of domestic enterprises. The present paper recognises that even foreign
acquisitions play an important role for the regional development, since they represent a
transfer means for international technological and organizational knowledge.
5
In the nineties, the South of Italy remained excluded from the big flows of international
investments, which indeed boosted the economic development of other European peripheral
areas, such as in Ireland and Spain.
6
The number of acquisitions and greenfield investments is reported at the bottom of Table 1.
7
This problem is related to the low international competitiveness of the country as a whole. A
thorough analysis of this problem cannot be made in this paper.
9
Table 1
Regional distribution of manufacturing firms created and acquired by
foreign firms in Italy, 1986-99 (Percentage values)
Total FDI
Acquisitions
Greenfield investments
1986-92
1993-99
1986-92
1993-99
1986-92
1993-99
56.2
52.2
56.9
53.0
51.4
44.9
Traditional sectors
Chemicals
Machinery
Electronics
Transport
Paper & Rubber
Metal products
48.0
59.9
58.4
57.2
55.2
60.1
50.8
35.6
65.8
47.3
53.1
46.8
60.5
52.7
51.1
60.5
57.4
58.1
59.6
59.2
49.1
36.8
66.4
46.2
55.3
46.0
59.8
56.0
20.0
53.3
64.7
52.4
36.4
66.7
62.5
22.2
60.0
58.3
30.0
50.0
71.4
22.2
North-East Center
Traditional sectors
Chemicals
Machinery
Electronics
Transport
Paper & Rubber
Metal products
35.1
42.6
36.0
36.8
32.4
27.6
30.1
36.1
39.3
54.8
25.6
48.8
34.5
41.9
33.6
37.6
35.7
42.9
35.7
38.9
33.1
19.1
32.8
39.6
40.1
54.7
27.1
49.6
35.0
44.0
34.8
38.1
30.5
40.0
40.0
23.5
28.6
63.6
11.1
12.5
31.9
55.6
10.0
41.7
30.0
33.3
14.3
33.3
Mezzogiorno
Traditional sectors
Chemicals
Machinery
Electronics
Transport
Paper & Rubber
Metal products
8.7
9.5
4.1
4.8
10.3
17.2
9.8
13.1
8.4
9.6
8.5
3.9
12.4
11.3
5.9
9.7
7.4
6.0
3.8
3.7
8.9
21.3
8.0
11.3
6.9
8.4
6.5
4.3
9.7
10.0
5.4
6.0
18.1
40.0
6.7
11.8
19.0
0.0
22.2
25.0
23.2
22.2
30.0
0.0
40.0
16.7
14.3
44.4
TOTAL
900
803
794
729
106
74
North-West
Note: Traditional sectors include food, textile, clothing, leather, footwear, wood and furniture.
Chemicals include chemical products, synthetic and artificial fibers and fuel. Machinery are
industrial machinery. Electronics include office machines, electrical machinery, computer and
telecommunications. Transport includes road vehicles and other transport equipment.
Percentage values are calculated putting, for each sector, Italy = 100.
Source: Data Bank Reprint, Politecnico of Milan
10
types of investment flows may be very different (see also O’hUallachain and
Reid, 1997). Using firm level data8 on multinational firms in Italy, a very
different interregional distribution of foreign greenfield start-ups and
acquisitions may be observed: the share of FDI located in the Mezzogiorno is
higher in the case of greenfield investments (18.1% in the period 1986-92 and
23.2% in the following period), than in the case of acquisitions. It is no surprise
to learn that the acquisition activity is lowest in regions having less
manufacturing plants (the Mezzogiorno), as scarcity of procurable assets in a
region limits the supply of acquisition candidates. However, it is important to
investigate which factors - apart from the presence of manufacturing plants in
the province – do affect the location of foreign firms in Italy.
The above-mentioned figures seem to leave no doubt on the exceptional
asymmetry characterizing the geographical distribution of FDI in Italy and, in
particular, on the very low attractiveness of the South. However, to make a
proper assessment of whether the amount of FDI to the South is above or below
its potential level, the use of a carefully specified model of the location
determinants of multinational firms is required.
Generally speaking, empirical studies on foreign firms’ site selection assume
that foreign firms, like all firms, seek branch location with the highest expected
profits. Thus, the profit that each individual firm derives from locating in any of
the potential province I is a sole function of the characteristics of that location:
pi = pi (Zi), where Zi is a vector of the characteristics of the region. In
“traditional” literature, this vector comprises measures of costs and accessibility
to production factors (labor and raw materials), costs of transportation, size and
characteristics of domestic and adjacent markets and primary infrastructures9. If
the investor produces easily-transportable goods, local demand has little
influence on location decisions. By considering the whole country as its outlet
8
Unfortunately, plant level data distinguished by modes of entry are not available at local
level in Italy. Only firm level data allow separate location analysis of foreign acquisitions and
greenfield investments. According to the data provider (Politecnico of Milan), however, the
geographical distribution of firms tends to coincide with that of plants in the case of
greenfield investments, while in the case of acquisitions there might be significant differences
between firms’ and plants’ spatial distributions.
9
Traditionally, inward foreign investments have been studied at a cross-country level.
Dunning (1993) provides a review of this literature within its “Ownership-LocationInternalisation” framework (p. 164-167). Apart from the above-listed variables, these studies
also include the following: barriers to trade (that is the level of effective protection imposed
by host countries), language variable, balance of payment deficit, rate of domestic inflation,
efficiency of Government macro-economic policies and environmental rules and regulations
(e.g. pollution, health and safety standards). Obviously, all those variables have no intra-State
variation, thus they are not relevant in a cross-region study.
11
market, the firm would choose its location on the basis of cost considerations.
On the other hand, when transport costs are important, the local market size
plays a major attraction role. Traditional literature has also emphasized the role
of regional promotion incentives in affecting FDI location decisions. Policy
incentives may assume different forms: a) financial incentives (public
subsidies)10, b) tax incentives11, c) labor-promotion incentives and d) indirect
State aids (for example, infrastructure upgrading investments).
Recently, however, the empirical literature on foreign firms’ site selection has
grown alongside with the advances in our understanding of domestic branch
plant location (Fujita et al., 1999). In particular, many studies have emphasized
the role of different kinds of external economies as foreign firms’ location
determinants. Firstly, following a typical cumulative causation approach, it is
often suggested that industrial firms tend to localize where other firms are
present. The benefits of this form of externality, connected with the number of
manufacturing plants clustered in a specific area (agglomeration economies), are
well known, namely access to a more stable labor market, availability of
intermediate goods, production services and skilled manpower and knowledge
spillover between close firms.
Now, the regional distribution of domestic manufacturing can affect the location
of foreign investments in different way according to the foreign entry mode
(acquisitions and greenfield). In principle, in both cases, agglomeration
economies may temper location flexibility. In the case of acquisitions, however,
the domestic industry also supplies candidates and, generally speaking, it is not
easy to disentangle the effect of procurement opportunities from that of
agglomeration economies.
Admittedly, agglomeration economies tend to reach limit values and
agglomeration diseconomies eventually emerge. Indeed, firms operating on
markets with a relatively large number of firms face stronger competition in
product and labor markets. This acts as a centrifugal force, which tends to make
activities dispersed in space. Once the centrifugal forces surpass the effects of
the agglomeration economies in a region, firms will look for locations in
contiguous regions where production costs are lower, while at the same time
taking advantage of some degree of external economies, given the short
distances involved. In this case, agglomeration economies would operate at a
10
With regard to Italy, it is important to underline that while foreign firms do benefit from
financial incentives, there is no specific policy instrument “dedicated” to the attraction of
foreign investments, as there is in other European countries, such as England and Ireland.
11
Devereux and Griffith (1999) investigate the role played by public policy in the guise of
taxes on profits as foreign location factor.
12
supra-regional level, giving rise to an external regional effect. This hypothesis is
in line with the process of progressive industrialization in the periphery
proposed in Puga and Venables (1996), where the distance between economies
plays a role in location selecting.
The geographical distribution dynamics of the total FDI number in Italy shown
in Table 1 seems to corroborate this hypothesis: the number of FDI decreased in
the most congested area (the North West) in favor of its most proximate one (the
NEC), while leaving the peripheral zone (the South) out of this process. A more
careful analysis, however, suggests that only the distribution of foreign
acquisitions followed this process. Conversely, in the case of greenfield
investments, the hypothesis of progressive industrialization does not hold: the
Southern share of greenfield start-ups increases, while the NEC share remains
stable. The different distribution dynamics of greenfield investments might
partially depend on labor market factors. In the nineties, different regions in the
North of Italy suffered the problem of labor availability, while most regions in
the South showed high unemployment rates. To better understand this problem,
we must consider that in that period local labor markets in Italy were
characterized by lack of labor mobility (from the South to the North-Center), by
lack of wage flexibility (because of the centralized wage bargaining) and by jobmatching problems. Those characteristics are enough to understand that in Italy
congestion costs are not mirrored in wage levels (labor cost) but in labor
availability (labor quantity). Thus, in the case of greenfield start-ups, foreign
investors are assumed to avoid congested areas, while a high number of
unemployed makes a Southern region potentially more attractive. In the case of
foreign acquisitions, instead, the labor force is available. Thus, from the point of
view of an acquiring firm, high unemployment regions are thought to offer lesscompetitive industrial conditions and a worse quality of life.
There are also agglomeration economies connected not to the generic number of
local incumbents, but to the number of foreign firms operating in the same
geographical area. As suggested by Head et al. (1999), “if foreign investors who have less initial knowledge about regional locations than their domestic
counterparts - only receive signals on costs and benefits of location decision, but
face strong difficulties to observe them directly, they might mimic each others’
location decision”. DeCoster and Strange (1993) also argue that clustering might
occur because of an agency problem: local decision-takers might decide to
follow prior investors because they are afraid of the reputational consequences
of an ‘eccentric’ decision which fails.
The infrastructure level (e.g. roads, railways and telecommunications) can also
represent an important FDI location determinant. Generally speaking, the
13
analyses of the relevance of public infrastructures for regional development and
for the process of geographical concentration of industrial activities12 show that
poorly-infrastructured regions have a relatively low level of productivity and
return to private investments, which might indeed be smaller than in regions
with better infrastructures. The relatively low return to private investments
within poorly-infrastructured regions reduces the attractiveness for both
domestic and foreign investments13.
However, it is worth emphasizing that the relationship between infrastructures
and localization might not be linear. The agglomeration mechanism might
indeed affect the role of public infrastructures in industrial re-location. If a
circular causation mechanism is at work and if the concentration of firms in the
core region is self-sustaining, then improving the attractiveness of the periphery
by public investments in infrastructures may have no impact on firms’ location
choices. In the New Economic Geography models, there is a threshold level of
transaction costs below which the agglomeration mechanism takes place and is
self-sustaining. A small change in the attractiveness of the periphery will not
bring a small relocation of economic activities. Only a very large change in the
attractiveness of the periphery would give it a chance to attract industrial
activities.
2. DATA AND VARIABLES
The dependent variables used in this work are the number of firms acquired and
created by foreign firms in each of the 95 Italian provinces (NUTS-3 level
regions14) and in each of the seven sectors (the list of the industrial sectors
considered is reported in Table 1) in two different periods (1986-1992 and 19931999). The total number of observations is therefore 1,330. The two variables
are summarized in Table 2.
The macro variables (Zi), expected to influence the number of foreign firms
intentioned to entry, are approximated with data coming from different sources
by taking into account a time lag compared with the dependent variables. These
explanatory variables, expressed in logs, may be grouped into five categories:
market demand, agglomeration economies, asymmetric information,
12
See, for example, Vickerman (1990).
Using data on FDI from the United States, Wheeler and Mody (1992) found that
infrastructures play a relevant role in US multinationals location decisions.
14
In Italy there are 20 NUTS-2 regions and within each region there are some provinces
(NUTS-3 level). Data refer to the period before 8 new provinces were created. 95 provinces
are therefore considered rather the present 103.
13
14
infrastructures and local labor market (see Table 3). The expected signs of the
variables are all positive except for “unit labor cost” and “unemployment rate”
(for the case of acquisitions).
Table 2
Distribution of foreign greenfield investments and acquisitions, 1986-99 (Percentage values)
0
1
2
3
4 >4
Greenfields 1986-92 89.7 8.3 0.9 0.5 0.0 0.6
Greenfields 1993-99 92.2 6.5 0.8 0.2 0.3 0.2
0
1
2
Acquisitions 1986-92 60.5 20.9 7.2
3
4
5
6
7
8
9 10 >10
3.9 2.7 1.4 1.2 0.8 0.2 0.2 0.0 1.2
Acquisitions 1993-99 61.2 21.4 7.1
4.2 2.4 0.9 0.9 0.2 0.3 0.2 0.2
1.2
Note: The Table reports the percentage of province/sectors with 0, 1, 2, …, number of new foreign
acquisitions and greenfield investments in the two periods 1986-92 and 1993-99.
Differently from other empirical studies on FDI location, the total amount of
electrical consumption (i.e. the amount of electricity consumed by firms and
households) is considered as proxy for market demand, rather than Gross
Domestic Product (GDP), given that, in the case of Italian provinces, the
available GDP measures tend to underestimate the role of the underground
economy, while electrical consumption is not affected by this problem15.
Potentially, however, the outlet market is much wider than the provincial one.
According to Woodward (1992), the market variable used in the econometric
analysis (MARKET) is a gravity-adjusted measure: it accounts for both the size
of a provincial market and its relative position to other provincial markets. The
variable for a province i is created by taking the sum of the provincial electrical
consumption and the electrical consumption of all other provinces, weighted by
distances: MARKETi = Di + Sk(Dk /d2ik), where, D is the electrical consumption
in province k; and dik is the distance from province i to province k.
15
The two variables are highly correlated (R2=0.91). Moreover, econometric results do not
significantly change while using the two alternative market size measures.
15
Table 3
Variable description
Variables
Agglomeration
Economies
Demand
Asymmetrical
information
Local labor
market
Infrastructures
Description
Source
Mean
Standard
deviation
Electrical consumption
(see Section 3)
Number of manufacturing
establishments in the
province
Enel
7.37
0.81
Istat, Census of
Industry and
Service
8.37
0.84
AdjacentProvince
Agglomeration
Number of manufacturing
establishments in the
adjacent provinces
Istat, Census of
Industry and
Service
8.65
0.62
Stock of Foreign
Plants Within the
Province
Cumulative number of
foreign-owned
manufacturing plants
within the province
Data Bank
Reprint,
Polytechnic of
Milan
2.36
1.15
Stock of Foreign
Plants in
Adjacent
Provinces
Cumulative number of
foreign-owned
manufacturing plants in
adjacent provinces
Data Bank
Reprint,
Polytechnic of
Milan
2.75
1.09
Public
Infrastructure
Index of infrastructure
stock
Confindustria
4.50
0.36
Unit Labor Cost
Average labor cost /
Labor productivity (in
each region)
Istat, Regional
Accounts
4.04
0.06
Unemployment
Rate
Unemployment rate
Istat, Labour
Force Survey
2.27
0.56
Market
Within-Province
Agglomeration
Agglomeration economies are approximated by the number of manufacturing
plants in the same industry in each province, as revealed by the Census data for
the two years 1981 and 1991. As discussed in Head et al. (1999, p.203), external
economies may cross the weak and sometimes artificial provincial boundaries.
To account for nearby activities, the econometric specification of the location
equation must include another variable, measuring the stock of manufacturing
plants in the same industry in adjacent provinces. Thus, a spatially weighted
average of the neighboring values is constructed for the agglomeration variable
using the first-order binary contiguity matrix.
In addition to the “industry” agglomeration effects, recent studies have also
assumed “nationality” agglomeration effects. Head et al. (1995), for example,
state that Japanese investors appear to be attracted to American States with other
Japanese plants in the same industry. Unfortunately, the data set used in the
present paper does not contain any information on the investors’ nationality.
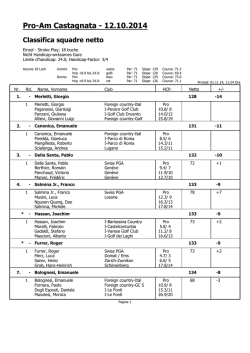
The role of asymmetric information in affecting the location choice of
multinational firms is captured by the (stock) number of foreign manufacturing
16
establishments previously concentrated in each province, as well as in adjacent
provinces16. Figure 2 plots the provincial map of FDI stock in 1996. A simple
statistical analysis suggests that in 1996 the geographical concentration of (the
number of) foreign manufacturing plants was much higher than the spatial
concentration of the total number of manufacturing plants.
Figure 2
Spatial distribution of the stock number of foreign manufacturing establishments in Italy in
1996
$
$
$
$
$ $ $
$$$ $
$
$
$
$
$
$
$ $
$
$ $
$
$
$
$
$
$
$ $
$ $
$
$ $
$
$
$
$
$ $
$
$ $
$
$
$
$
$
$
$
$
$
$
$
$
$
$
$
$
$
$
$
$
Italian Provinces
38
20
11
5
0
to 521
to 38
to 20
to 11
to 5
(22)
(18)
(21)
(19)
(22)
$
$
$
Note: The Legend reports the values of the inter-quintile distribution of the provincial number of foreign
manufacturing plants in Italy and, in brackets, the number of provinces within each class. North-Central
provinces are shown with a star.
Source: Data Bank Reprint, Politecnico of Milan
Provincial differentials in public infrastructures are approximated by a stock
index, developed by Confindustria for the two years 1985 and 1995. Previous
location studies, summarized in Friedman et al. (1992), used to characterize
local labor markets with the measure of a regional average manufacturing wage
(sometimes relative to productivity), its unionization and unemployment rate.
Here, the ratio between industrial workers wage level and the industrial labor
productivity is used as a measure of local labor cost. Unfortunately, this variable
16
In calculating the natural logs of these two variables, a 1 was added since for some
province/sectors the number of foreign establishments was zero.
17
is only available at the NUTS-2 regional level, since there is no information
available on labor cost at NUTS-3 (provincial) level17.
The unemployment rate is also included as independent variable. As discussed
above, the role of the province unemployment rate variations as a location
determinant depends on the foreign entry mode: a high unemployment rate may
serve either as an indicator of labor availability (in the case of greenfield
investments) or as a proxy of less-competitive industrial conditions and lower
quality of life (in the case of acquisitions).
3. REGRESSION RESULTS
This Section contrasts the location determinants of greenfield and acquisition
FDI in Italy. Generally speaking, previous location analyses examined either
aggregate investments or greenfield plants. Rarely, did they contrast greenfield
and acquisition entry. Apart from rare exemptions (see, for example,
O’hUallachain and Reid, 1997), scholars mostly ignore the distribution of
acquisitions, because they are mainly constrained by the supply of acquisition
candidates and play a secondary part in the formulation of regional industrial
development policies (Head et al., 199518). Quite the reverse, the present paper
starts from the recognition that a higher stock of foreign capital (also cumulated
through foreign acquisitions) may have a positive impact on regional
development. Obviously, greenfield investments have a direct impact on
regional employment through job creation, but foreign acquisitions may also
exert an important role in terms of technological and organizational knowledge
transfer.
3.1 A dartboard specification: does the number of investments in the South
fall short of its market potential?
One of the objectives of the paper is to assess the relative attractiveness of the
Mezzogiorno of Italy. While the summary statistics show that the South received
a relatively small fraction of FDI, it is important to know whether the investment
counts fall short of the market potential of the region. Thus, a simple
“dartboard” specification of the location choice model is considered at first
(Column 1 in Table 4 and 5): the greenfield investment count and the acquisition
count are regressed on the size of the market, measured by the gravity-adjusted
17
Actually, we are aware that having variables at different level of aggregation might bias the
estimate of the coefficients’ standard errors.
18
“While new ventures may locate wherever they want, acquirers are limited to the current
locations of potential targets” (Head et al, 1995, p.230).
18
demand variable, and on the dummy variable “Mezzogiorno”, which indicates
whether a province belongs to the South or not. As regard to the functional form,
Table 4
Foreign acquisitions' location determinants in Italy
Variable
Market
1
0.992***
(19.020)
2
0.276***
(3.516)
0.376***
(5.569)
-0.241***
(-3.824)
0.454***
(7.818)
0.230***
(3.312)
3
0.280***
(3.595)
0.266***
(3.925)
-0.131**
(-2.036)
0.442***
(7.331)
0.146**
(2.081)
0.852***
(4.794)
-1.376***
(-10.419)
1.03
4.09
-3.06
-0.964***
(-7.259)
0.67
1.75
-1.08
-0.558***
(-3.444)
1.33
2.32
-0.99
4
0.319***
(3.963)
0.259***
(3.821)
-0.137**
(-2.169)
0.456***
(7.498)
0.129*
(1.760)
0.676***
(3.442)
-1.005***
(-4.260)
-0.292**
(-2.365)
-0.464***
(-2.520)
1.77
2.81
-1.04
13.308***
(4.649)
2.507***
(5.364)
1330
-1441.2
2911.2
38.784***
(3.847)
14.315***
(3.333)
1330
-1371.3
2800.2
39.571***
(3.580)
9.426***
(3.354)
1330
-1358.6
2782.0
43.767***
(3.543)
8.245***
(3.460)
1330
-1346.3
2771.7
Within-Province Agglomeration
Adjacent-Province Agglomeration
Stock of Foreign Plants Within the
Province
Stock of Foreign Plants in
Adjacent Provinces
Public Infrastructures
Unit Labor Cost
Unemployment Rate
Mezzogiorno
Mezzogiorno
(discrete
change)
Mezz = 1
Mezz = 0
d
a
b
Number of observations
Log-likelihood
Bayesian Information Criterion
Note: The dependent variable is the number of firms acquired by foreign firms in each
province and in each sector. Model specification: Negative binomial model with random
effects. t-values in parenthesis. Coefficients of the constant term are not reported. *denotes
t-statistics at the 90% confidence level; ** at 95%; ***at 99%.
a random-effect negative binomial model (NEGBIN2) is used, since both the
restrictions imposed by the NEGBIN2 pooling and by the Poisson regression
model were rejected by different tests19.
19
See Appendix for a discussion on the econometric specifications. In the case of greenfield
investments, however, the evidence of random effects and the rejection of the Poisson
restriction are both less robust.
19
Table 5
Foreign greenfield investments' location determinants in Italy
Variable
1
2
3
4
Market
+1.011***
(9.979)
0.469***
(2.983)
-0.015
(-0.107)
0.074
(0.444)
0.753***
(4.888)
-0.151
(-0.814)
0.414***
(2.610)
-0.125
(-0.885)
0.173
(1.079)
0.707***
(4.552)
-0.153
(-0.856)
1.759***
(4.128)
-0.134
(-0.489)
106.56
(0.297)
0.625*
(2.883)
1330
-439.7
908.2
0.193
(0.742)
99.441
(0.801)
2.062*
(1.864)
1330
-422.5
902.5
1.161***
(3.572)
182.62
(0.588)
2.787*
(1.669)
1330
-414.9
894.4
0.467***
(2.776)
-0.136
(-0.935)
0.189
(1.100)
0.703***
(4.412)
-0.112
(-0.606)
1.395***
(2.849)
-1.907***
(-2.879)
0.076
(0.221)
0.800**
(1.981)
200.28
(0.360)
2.397*
(1.723)
1330
-409.5
898.2
Within-Province Agglomeration
Adjacent-Province Agglomeration
Stock of Foreign Plants Within the
Province
Stock of Foreign Plants in Adjacent
Provinces
Public Infrastructures
Unit Labor Cost
Unemployment Rate
Mezzogiorno
a
b
Number of observations
Log-likelihood
Bayesian Information Criterion
Note: The dependent variable is the number of firms created by foreign firms in each province and
in each sector. Model specification: Negative binomial model with random effects. t-values in
parenthesis. Coefficients of the constant term are not reported. *denotes t-statistics at the 90%
confidence level; ** at 95%; ***at 99%.
Firstly, the coefficient of market size is positive and significant in both
equations, thus indicating that foreign firms concentrate where demand is
highest and serve smaller markets via exporting. Since variables Z
logarithmically enter the FDI equation (E[Y|Z] = exp(blnZ)), bj is an elasticity,
giving the percentage change in the expected number of FDI for 1% change in
Z. Thus, the results suggest that a 1% increase in the market size leads to a 1%
increase in the expected number of foreign acquisitions and greenfield
investments.
Controlling for the market size effect, the coefficient of the dummy variable
Mezzogiorno turns out to be negative and strongly significant in the case of
20
acquisitions, while it is not significantly different from zero in the case of
greenfield investments. Thus, the amount of acquisitions in the South is smaller
than expected, compared to the economic dimension of the area. Instead, the
Mezzogiorno received a number of greenfield investments which is by no means
smaller relative to its market size.
The expected South’s attractiveness of acquisitions can be assessed by
computing the discrete change in the expected value of y for a change in the
dummy variable Mezzogiorno from 0 to 1 (holding Z constant at the sample
mean):
(
)
(
)
DAcquisitions
= exp b ln Z + d 1 - exp b ln Z + d 0 = d
DMezzogiorno
The results show that, if Mezzogiorno equals 1, the expected count of foreign
acquisitions is 1.03; if Mezzogiorno equals 0, the expected count is 4.09. Thus,
being a Southern province, the expected count of foreign acquisitions decreases
by 3.06 (d).
3.2 Foreign acquisitions’ location determinants
This and the next Sections show the estimation results of more general
specifications, including potential location factors other than the market size.
Bayesian Information Criterion tests are used to identify the most reliable
specification.
Table 4 reports the results for the acquisition equation. Firstly, the effect of
different forms of geographical agglomeration is tested (Column 2). The
NEGBIN2 random effect estimated coefficients reveal that the expected number
of foreign acquisitions is higher, the larger the number of domestic
establishments in the same industry. The elasticity of “Within-province
agglomeration” is 0.38%. As already pointed out, however, in the case of
acquisitions this variable may be interpreted as measure of both procurement
opportunities and agglomeration economies, and it is difficult to disentangle
each effect.
Surprisingly, the coefficient of “Adjacent-Province Agglomeration” is negative
and significant (the elasticity is –0.24%). This result reinforces any possible
doubt about the existence of positive agglomeration externalities generated by
geographical concentration of domestic plants in the same industry.
21
Unlike the effects of the two generic agglomeration variables discussed above,
the result of the “Stock of Foreign Plants Within the Province” reveals a
‘follow-the-leader’ pattern of foreign investments “that is difficult to interpret as
anything other than agglomeration effects” (Head et al. 1995, p. 233). The
location of foreign acquisitions is significantly influenced by the location of
previous foreign investments in the same industry. The elasticity of this variable
(0.45%) is higher than that of “Within-Province Agglomeration” (0.38%), thus
suggesting that the attractive effect of prior foreign investments exceeds that of
prior domestic investments.
The border-province variable (“Stock of Foreign Plants in Adjacent Provinces”)
is positive and significant, thus indicating that agglomeration externalities
generated by the stock of foreign plants operating in the same industry cross
province boundaries, although, the magnitude of the effect declines. This result
corroborates the hypothesis that provincial borders do not define the relevant
economic boundaries for agglomeration effects.
“Public Infrastructure” are added in Column 3 to determine whether externalities
generated by public investments provide an additional impetus to foreign firms’
location decisions. The results confirm that the public infrastructure stock has a
strong positive influence on acquisition inflows. The elasticity of the variable is
0.85%; it becomes 0.68 in the most general specification.
The labor market variables are included in Column 4. The variable “Unit Labor
Cost” has the expected sign and its coefficient is statistically significant. Thus,
holding the other variables constant, foreign investors are very responsive to the
differences in labor costs across regions. The variable’s elasticity (-1%) is
considerably higher than that of any other variables. As expected, the
unemployment rate has a negative effect and its coefficient is statistically
significant: foreign investors tend to avoid distressed areas with high
unemployment rates; the elasticity is -0.3%.
It is worth noticing that the demand-pull mechanism has some explanatory
power even after controlling for the other location determinants. In the most
general specification, however, the market variable elasticity strongly decreases
from that observed in the dartboard model (from 0.99 to 0.31%). The dummy
variable “Mezzogiorno” is still negative and significant, thus suggesting that the
South receives a number of foreign acquisitions which is “low” relative to its
economic development. However, the discrete change decreases from -3.06 to –
1.04.
22
As shown in the basic analysis, over the period 1986-99, the geographical
distribution of foreign acquisitions changed. In order to make the model robust
to time variation affecting the relative attractiveness of a province in the eyes of
the average investor, a dummy variable (“Period 1986-92”) was added. This
variable’s coefficient, however, is not significantly different from zero and a
likelihood ratio test reveals that its inclusion does not add significant
explanatory power to the specification.
3.3 Foreign greenfield investments’ location determinants
As expected, foreign greenfield investments’ location determinants are different
from acquisitions’ ones (Table 5). Unlike acquisitions, the “Within-Province
Agglomeration” variable is negative, although not significant in the greenfield
equation: foreign ventures do not emulate their Italian counterparts. This result
conflicts with that of Head et al. (1995 and 1999) and with many other studies,
stating that the domestic number of manufacturing establishments has a positive
influence on FDI inflows. This means that in Italy congestion costs, mainly
connected to the lack of available labor force in Northern cities, generate
centrifugal forces, which contrast agglomeration forces.
Like acquisitions and in line with many other studies (e.g. Wheeler and Mody,
1992; Head et al. 1995; O’Huallachain and Reid, 1997), Table 5 shows that
provinces with a higher stock of foreign manufacturing plants in the same
industry are more likely to attract further “greenfield” investments, even after
controlling for the other provincial characteristics. This variable’s elasticity is
quite high (0.75%), thus confirming the importance of positive agglomeration
externalities conferred by other foreign investors proximity to clusters, which
may be due to the information externalities concerning the operating
environment.
To understand the simultaneous evidence of a positive effect of ‘foreign
agglomeration’ (connected to the spatial concentration of foreign plants) and of
the null effect of ‘generic agglomeration’ (connected to the spatial concentration
of domestic plants), we must consider that location characteristics have changed
over time, firms are not perfectly mobile, and the stock of foreign plants are of
more recent vintage than the overall stock of plants. In this case, foreign
investments distribution may reflect current economic conditions better than the
distribution of all plants.
The two border-province agglomeration variables (“Adjacent-Province
Agglomeration” and “Stock of Foreign Plants in Adjacent Provinces”) are not
significant. Thus, in Italy, agglomeration benefits conferred by proximity to
23
clusters of other foreign investors operate over small geographical areas, such as
provinces, instead of extending over greater distances: unlike what observed in
other countries, namely in the United States (see Head et al. 1995), in Italy
foreign firms are still far from creating extended industrial clusters.
The infrastructure stock is positive and strongly significant (Column 3); its
coefficient is very high (between 1.7% and 1.4%). After controlling for the
public infrastructure effect, the dummy variable “Mezzogiorno” – interestingly
enough - becomes positive and highly significant20. Thus, with similar public
infrastructures levels, the expected number of foreign greenfield investments
attracted by the South would be much higher than that attracted by the NorthCenter. This suggests that, if the strong difference between North and South in
terms of public infrastructures had been removed in the past, congestion costs
connected to the stronger competition on product and labor markets in the North
might have acted as a centrifugal force, encouraging foreign investors to locate
in Southern regions, where production costs are lower, labor is more available
and public incentives are higher. Therefore, the public infrastructure stock
appears as a very important policy variable to promote foreign location to the
South. Section 5 provides simulations to quantify the changes in the
geographical distribution of foreign manufacturing (greenfield) investments that
would have occurred if strong infrastructure differences between North and
South had been removed by State interventions in the past.
Like acquisitions, the unit labor cost has a significant negative effect on foreign
greenfield start-ups. Again, this variable’s elasticity (-1.91) is considerably
higher than that of any other one. The unemployment rate has a positive sign,
although its coefficient is not significant. In the next Section, however, this
result is revised in the light of a different model specification.
3.4 Foreign greenfield investments’ location determinants: an extension
So far, the greenfield analysis has been based on the results of a random-effect
negative binomial regression model. However, neither the evidence of random
effects nor that of non-Piossonness (i.e. the inequality between the mean and the
variance of the distribution) due to unobserved heterogeneity is robust. Thus, in
this Section a different extension of the Poisson regression model is considered
(the Zero Inflated Poisson model), which is based on the assumption that overdispersion arises from the nature of the process generating the zeros (see
Appendix).
20
It was also tested whether this effect on the coefficient of the dummy variable South
occurred after introducing the variable “Unit Labor Cost” or “Unemployment Rate”. The
results confirm that only “Public Infrastructure” have such an impact.
24
First, it is worth noticing that the zero outcome of the greenfield investment
model can arise from two underlying responses. Some provinces may never
attract a greenfield investment in a specific sector, thus the outcome is always
zero. If the province is an attractive one, however, the zero outcome may be just
the number of investments attracted in the period considered and the response
might be some positive number in a different period. A two-regime model is,
therefore, necessary. In the former regime (the splitting equation), a probit
model is used; in the latter, the usual Poisson process is at work. Potentially, the
same set of explanatory variables can be introduced in each stage of the process.
After different attempts, however, a subset of variables was selected to specify
the splitting function: “Within-Province Agglomeration”, “Stock of Foreign
Plants Within the Province”, “Unit Labor Cost” and “Unemployment Rate”. The
variables included in the Poisson function are those included in Column 4 of
Table 5.
Table 6 illustrates the results of the ZAP and the Poisson model. The Vuong
statistics, shown at the bottom of the Table, are higher than 2, clearing arguing
in favor of the splitting model. On the other hand, if the model prediction rather
than its diagnostic is examined, then it appears that the Poisson model performs
better without the regime split21.
The coefficient results shown in Table 6 are strongly consistent with those
reported in Table 5. It is worth noticing that, in the ZAP model splitting
equation, the variable “Unemployment Rate” is positive and significant, even
controlling for the dummy “Mezzogiorno”. This last result strongly corroborates
the assumption whereby a high unemployment rate makes an Italian province
more attractive for greenfield investments.
21
A similar finding was observed by Greene (1994).
25
Table 6
Foreign greenfield investments' location determinants in Italy
Variable
Poisson model
ZAP model
Poisson Equation
Market
Within-Province Agglomeration
Adjacent-Province Agglomeration
Stock of Foreign Plants Within the Province
Stock of Foreign Plants in Adjacent Provinces
Public Infrastructures
Unit Labor Cost
Unemployment Rate
Mezzogiorno
0.504***
(3.004)
-0.146
(-1.095)
0.173
(1.377)
0.726***
(6.464)
-0.118
(-0.864)
1.501***
(3.582)
-1.876***
(-3.270)
0.079
(0.299)
0.871**
(2.298)
Within-Province Agglomeration
-0.182
(-0.669)
-0.510
(-0.899)
-6.756
(-1.549)
4.245**
(2.194)
4.388
(0.100)
Stock of Foreign Plants Within the Province
Unit Labor Cost
Unemployment Rate
Mezzogiorno
Number of observations
Log-likelihood
Voung statistics
0.625***
(3.917)
-0.211
(-1.489)
0.209
(1.349)
0.708***
(5.123)
-0.124
(-0.743)
1.318***
(2.836)
-2.580***
(-4.139)
0.314
(0.924)
1.193***
(2.757)
Splitting equation
1,330
-414.2
1,330
-404.7
4.230
Note: The dependent variable is the number of establishments created by foreign firms in
each province and in each sector. t-values in parenthesis. Coefficients of the constant term
are not reported. Vuong statistics testing ZAP vs. unaltered model is distributed as
standard normal (see Appendix).
26
4. PUBLIC INFRASTRUCTURES AS LOCATION DETERMINANTS:
COUNTERFACTUAL POLICY EXPERIMENTS
As shown above, the coefficient of “Public Infrastructure” is statistically
significant in the greenfield equation and seems to raise a location attractiveness
by a respectable percentage. The purpose of this Section is offering quantitative
simulations of the extent to which the existing public infrastructure stock in the
Mezzogiorno should be increased to encourage foreign firms to heavily invest in
this area. Three different hypotheses are proposed: 1) an “heroic” assumption of
an increase by about 160%; 2) a 80% rise; and 3) a “reasonable” increase by
about 10%. Under those different assumptions, the changes in the geographical
distribution of foreign greenfield start-ups are quantified.
Following Head et al. (1999), for each simulation both a static and a dynamic
version was estimated. In the static version counterfactual policy experiments do
not alter the foreign agglomeration counts (the “Stock of Foreign Plants Within
the Province”), which are exogenously determined by the actual historical
investment pattern. By contrast, the dynamic simulations allow changes to affect
foreign agglomeration counts in successive years. Instead of historical counts,
those simulations apportion foreign investments according to the predicted
probabilities that arise under different hypotheses. Thus, policies that raise
foreign investment in the first period shall enhance the expected value of foreign
investments in the second period through higher foreign agglomeration.
The simulations adopt the coefficients of the greenfield Poisson equation from
Table 6, specified without the dummy variable “Mezzogiorno”. The actual
regional distribution of greenfield investments is reported in Column 1 of Table
7. The predicted distribution is reported in Column 2: it represents the baseline
case when foreign firms locate on the basis of provincial characteristics and a
random term. The predicted distribution fits the actual one quite well. Though
the Southern share is slightly under-predicted, to compute changes caused by
infrastructure variations, the predicted results rather than the actual number of
FDI are used as a benchmark. This prevents reported changes from reflecting
deviations due to the model-data mismatch.
As already said, three different scenarios are taken into account. The first
scenario is a “provocative” one, since it is based on the very strong assumption
that Southern provinces have the same infrastructure as Milan (the most favored
location) in both periods (Column 3). On average, this corresponds to an
increase by about 160% in the Southern public infrastructure stock! The second
scenario assumes that Southern provinces have the average infrastructure level
of North-Center regions in both periods (Column 4). This second assumption
27
corresponds to an increase of about 80% in the Southern public infrastructure
stock. This scenario tells us which changes in the geographical distribution of
foreign start-ups would have occurred if strong infrastructure differences
between Center-North and South had been removed in the past by State
interventions. The third scenario considers a mere 10% increase in Southern
public infrastructures stock (Column 5).
Table 7
Regional distribution of greenfield investments under different hypotheses on public
infrastructures in the South (Percentage values)
1
2
Actual
Predicted
distribution distribution
3
KG South = KG
Milan
(shr D)
4
5
KG South =
KG South
average KG in the increased by 10%
North-Center
(shr D)
(shr D)
Dynamic Static Dynamic Static Dynamic
-11.3
-5.1
-5.2
-0.6
-0.6
North-West
48.9
49.2
Static
-11.0
North-East
Center
31.0
34.3
-7.6
-7.9
-3.6
-3.6
-0.4
-0.4
South
20.0
16.3
+18.6
+19.1
+8.7
+8.8
+0.9
+1.0
Note: The predicted distribution (Column 2) derives from calculating the expected count of foreign
greenfield investments in each province/sector. The employed coefficients come from a greenfield Poisson
equation specified as in Table 6, but without the dummy variable “Mezzogiorno”. The regional distribution
of greenfield investment reported in Columns 3, 4 and 5 stem from the expected count of foreign greenfield
investments in each province/sector under three different hypotheses on the level of Southern public
infrastructures. In the static version counterfactual policy experiments do not alter the foreign
agglomeration count (“Stock of Foreign Plants Within the Province”), which are exogenously derived by
the actual historical pattern of investment. By contrast, the dynamic simulations allow changes to affect
foreign agglomeration counts in successive years.
The Table reports the regional distribution changes in the static and the dynamic
simulations under the three different scenarios. Notice that the dynamic effects
are not strong enough to produce major alterations in the geographical
distribution of foreign investment, because the stock of pre-1986 foreign
investments is large compared to new investments subsequent to that date. Thus,
policies attracting additional foreign investors do not change the overall
geographical distribution of foreign investment so much.
In the first hypothesis the South is strongly better off in terms of investment
count, since the Southern share increases by 18 and 19 percentage points in the
static and dynamic simulations respectively. His gain comes at the expense of
the other regions especially the North-West, whose share of investment declines
by more than 11%. In the second hypothesis the Southern share increases by 9
28
percentage points. Finally, the Table shows that a 10% increase in the Southern
public infrastructure stock would not have an appreciable effect on foreign
investment geographical distribution.
Generally speaking, this experiment corroborates the hypothesis, discussed in
Section 2, that, with endogenous agglomeration effects in force (foreign firms
seems to prefer provinces chosen by preceding foreign investors), a small
change in the attractiveness of the periphery would not bring about any
economic activity relocation. Only a very large change in the periphery
attractiveness would have a chance of attracting industrial activity.
This might sound as a pessimistic signal for policy makers, since it is not
feasible to image an increase in the Southern infrastructure stock by about 160%
(to reach the level of Milan) or by about 80% (to reach the average level of the
North-Center). The message, however, is to heavily invest in infrastructures in
the South (each year the actual expenditure for public works systematically falls
short of the planned figure), while using also other more direct measures aimed
at attracting FDI, such as a higher labor flexibility and financial and fiscal
incentives. This last point will be thoroughly discussed in the last Section.
29
5. CONCLUDING REMARKS AND POLICY IMPLICATIONS
This paper starts from the recognition that FDI may play a key role for the
economic development of the South of Italy (the Mezzogiorno) and tries to
identify which location factors might influence foreign entry in this country.
This issue is gaining relevance because of the progress in the European
integration: the Mezzogiorno of Italy is thus called to compete with several
peripheral areas in the supply of location factors for industrial activities. In the
nineties, the South of Italy was excluded from the big flows of international
investments, which have boosted the economic development of other European
peripheral areas, such as in Ireland and Spain.
The results show that the main location determinants strongly differ according to
the type of foreign investment considered. Firstly, foreign acquisitions’
geographical distribution is not only constrained by the supply of acquisition
candidates. The consistent significance of variables other than the stock number
of existing firms (such as public infrastructures and the prior concentration of
foreign manufacturing firms within the province, as well as in adjacent
provinces) confirms that supply alone does not decide the location of foreign
acquisitions flows in Italy. Thus, scholarly disinterest in the distribution of
acquisitions is unjustified.
Differently from the results of many other studies, foreign ventures in Italy do
not emulate their domestic counterparts. In other words, ceteris paribus, foreign
business groups do not invest more intensively in those regions where there is a
higher concentration of other firms. When foreign investors decide to build new
production facilities in Italy, they are strongly influenced by location decisions
of previous ‘foreign’ investors, but they also must take into account congestion
costs (which contrast agglomeration forces) mainly linked to the lack of
available labor force, especially in the big Northern cities. Therefore, high
unemployment provinces in the South have a greater potential capability of
attracting greenfield FDI than Northern-Central ones.
However, the potential attractiveness of Southern provinces can only emerge if
certain conditions are met: firstly, the necessary infrastructures are to be created;
secondly, the gap between the labor cost and the productivity trends must be
narrowed; thirdly, an adequate system of public incentives aimed at favoring
foreign direct investments must be created.
With regard to the infrastructures, the results of some simulations suggest that,
with endogenous agglomeration effects in force (foreign firms seem to prefer
provinces chosen by other foreign investors), a small improvement in the public
infrastructure stock does not affect the regional distribution of FDI. Only a very
30
strong leap forward in Southern infrastructures might allow a significant
reallocation of foreign capital towards Southern regions. This finding is very
important, since each year the actual expenditure for public works
systematically falls short of the planned figure.
With regard to labor cost, a centralized system of wage bargaining is inadequate
to the development conditions and to the location disadvantages of the South of
Italy. Compared to a strongly negative productivity differential with NorthCentral regions, the average labor cost in the South is not sufficiently different
from the one prevailing in the rest of the country. Thus, collective wage
bargaining should be decentralized at a regional or firm level, thus taking
account of local or firm-specific conditions.
Finally, with regard to the incentives to attract foreign direct investments to the
South, they should be set within what are known as “Contratti di Programma”
(“Planning Contracts”). The evaluation of this policy instrument seems to be
positive. Recently, however, the “Planning Contracts” have been stopped.
Apart from financial incentives, tax incentives should also be prompted to attract
new foreign investments. Some cross-state analysis in the United States (see, for
example, Head et al., 1999) show that regional fiscal differences do substantially
affect the location of Japanese firms in the USA. Furthermore - as demonstrated
by the experience of some European countries, such as Ireland, - the use of fiscal
incentives may be very effective to attract foreign direct investments. However,
when fiscal incentives operate indistinctly over the whole national territory,
there is no room for diversified fiscal treatments which could create an
advantage for substantial capital movements towards developing regions, as it
happened in Ireland.
Thus, the adoption of a regionally diversified fiscal policy aimed at prompting
regional economic growth seems a necessary step to attract investments in the
most backward areas of the South. Nowadays, because of the constraints
imposed by the European Union in the interpretation of “State aids”, the
condition of being a country partition and not a State hampered the introduction
of particular fiscal advantages for the Mezzogiorno. The irrelevance of national
boundaries within an integrated area, such as the European Union, induces,
however, to overcome that approach. The ongoing process of fiscal and
administrative decentralisation taking place in Italy, as well as in many other
European countries, seems to overcome the old positions of the European
Commission on competition distortions induced by State aids granted in some
peripheral areas of Core countries and paves the way to regionally diversified
fiscal policies in Europe, irrespective of the country, which the region belongs
to.
31
APPENDIX: ECONOMETRIC SPECIFICATIONS
The dependent variables yit used in the econometric analysis (the number of
firms acquired and created by foreign firms in each province i and in each period
t) assume discrete values, that is non-negative integer values (count data). The
standard model for count data is the Poisson regression model22. A less
restrictive model, which allows for multiplicative gamma-distributed
unobserved heterogeneity, is the negative binomial model. The most common
implementation of this model is the NEGBIN2 model, with density:
q
G( yi + q ) æ q ö
ç
÷
Pr( yi | zi ) =
yi !G(q ) çè q + li ÷ø
æ li ö
çç
÷÷
è q + li ø
yi
(1)
where q = 1/a. G is the gamma function. The first two conditional moments are:
E[yi|Zi] = li. = exp(b’Zi)
(2)
Var[yi|Zi] = E[yi|Zi] {1+ a E[yi|Zi]}
(3)
The model approaches the Poisson distribution as the dispersion parameter goes
to zero.
Panel data treatments are provided for both the Poisson and negative binomial
models. The random effects model for the negative binomial framework is loglit
= b’Zit + ui, i = 1…N, t = 1 …T, where ui is a random effect for the ith group
such that exp(ui) has a gamma distribution with parameters (qi,qi), which
produces the negative binomial model with a parameter that varies across
groups. Then, it is assumed that qi/(1+qi) is distributed as a beta random variable
with parameters (a,b). All in all, the random effect is added to the negative
binomial model by assuming that the overdispersion parameter is randomly
distributed across groups. Using the beta density, the joint probability of a
province’s FDI inflows over the panel years can be derived:
é
G (l it + y it )! ù
Pr [y i1 , ¼¼ , y iT ] = êP
ú
ë t G (l it )! G ( y it + 1)! û
ö
ö æ
æ
G (a + b )G ç a + å l it ÷G ç b + å y it ÷
t
t
ø
ø è
è
æ
ö (4)
G (a )G (b )G ç a + b + å l it å y it ÷
t
t
è
ø
22
For a thorough review of the literature on count regression models, see Cameron and
Trivedi (1998).
32
This is the basis for the maximum likelihood estimation of b, a and b. Under the
assumption of no random effect, a = b = 0. This restriction can be tested with a
standard Wald test or a likelihood ratio test.
Excess zeros, like unobserved heterogeneity, lead to overdispersion. A more
appropriate formulation for these data is the “Zero Altered Poisson” (ZAP)
model (see Greene, 1994), where with probability qi the only possible
observation is zero, and with probability (1-qi) a Poisson (li) random variable is
observed. Both qi and li may depend on covariates. The overall probability of a
zero outcome is then
Prob[Yi = 0] = qi + (1-qi)Ri(0)
(5)
and
Prob[Yi = y>0] = (1-qi)Ri(y),
(6)
where Ri(y) = e - l li y / y i ! (the Poisson probability)
(7)
i
and
i
li=exp(b’Z)
(8).
Probability qi may follow either a logistic or a normal distribution, so that the
splitting model may be either a logit or a probit model, which is then integrated
into the Poisson regression model. However, there will be a problem
distinguishing the ZAP model from an underlying negative binomial
specification as source of overdispersion. The testing procedure is complicated
by the fact that the ZAP model is not nested within either the Poisson or the
negative binomial models. Vuong (1989) proposed a test statistic for non-nested
models, which appears to have some power to distinguish between nonPiossonness due to over-dispersion of the negative binomial model and the force
of the splitting mechanism in the ZAP part of the model. The statistic is
asymptotically distributed as a standard normal, so its values may be compared
to the critical value from the standard normal distribution, e.g. 1.96.
33
REFERENCES
Bagchi-Sen, S. and K. O. Wheeeler (1989), “A Spatial and Temporal Model of
Foreign Direct Investment in the United States”, Economic Geographics
No. 65, pp.113-29.
Belderbos, R. and M. Carree (2000), “The Location of Japanese Investments in
China: Agglomeration Effects, Keiretsu, and Firm Heterogeneity”,
NIBOR Research Memorandum, RM/00/02.
Blomstrom, M. and A. Kokko (1998), “Multinational Corporation and
Spillovers”, Journal of Economic Surveys, No.12, pp. 247-277.
Cameron, A.C. and P.K. Trivedi (1998), Regression Analysis of Count Data,
Cambridge Mass., Cambridge University Press.
Castellani, D. and A. Zanfei (2001), Technology Gaps, Inward Investments and
Productivity of European Firms, mimeo, University of Urbino.
Chunlai, C., (1997), “Provincial Characteristics and Foreign Direct Investment
Location Decision within China”, ISBN, December 97/16.
Coughlin, C.C., J.V. Terza and V. Arrondee (1991), “State Characteristics and
the Location of Foreign Direct Investment within the United States”,
Review of Economic and Statistics, No.73, pp. 675-683.
DeCoster, G. and X.V. Strange (1993), “Spurious Agglomeration”, Journal of
Urban Economics, No. 33, pp. 273-304.
Devereux, M. P. and R. Griffith (1999), “Taxes and Location of Production:
Evidence from a Panel of US Multinationals”, Journal of Public
Economics No. 68, pp. 335-367.
Dunning J. (1993), Multinational Enterprises and the Global Economy, Boston,
Addison Wesley.
Freidman, J., D. Gerlowski and J. Silberman (1992), “What Attract Foreign
Multinational Corporations? Evidence from Branch Plant Location in the
United States”, Journal of Regional Science, No. 32, pp. 403-418.
Fujita, M., P. Krugman and A.J. Venables (1999), The Spatial Economy: Cities,
Regions, and International Trade, Cambridge Mass., MIT Press.
34
Giunta, A., A. Lagendijk and A. Pike (2000), Restructuring Industry and
Territory: the Experience of Europe’s Regions, London, Stationery
Office.
Glickman, N. and D. Woodward (1988), “The Location of Foreign Direct
Investment in the US: Patterns and Determinants”, International Regional
Science Review, No. 11, pp. 137-54.
Greene, W. (1994), “Accounting for Excess Zeros and Sample Selection in
Poisson and Negative Binomial Regression Models”, Working Paper no.
EC-94-10, Department of Economics, Stern School of Business, New
York University.
Head, C.K., J.C. Ries and D.L. Swenson (1995), “Agglomeration Benefits and
Location Choice: Evidence from Japanese Manufacturing Investments in
the United States”, Journal of International Economics, No. 38, pp.
223-247.
Head,
C.K., J.C. Ries, D.L. Swenson (1999), “Attracting Foreign
Manufacturing: Investment Promotion and Agglomeration”, Regional
Science and Urban Economics, No. 29, pp. 197-218.
Hill, S. and M. Munday (1991), “The Determinants of Inward Investment: a
Welsh Analysis”, Applied Economics, No. 23, pp. 761-9.
Hines, J. (1996), “Altered States: Taxes and the Location of Foreign Direct
Investment in America”, American Economic Review, No. 86, pp.
1076-1094.
Mariotti, S. and M. Mutinelli (1999), “Gli investimenti diretti esteri nel
Mezzogiorno: il passato e le tendenze attuali”, L’Industria, No. 2,
pp. 263-274.
Mariotti, S. and L. Piscitello (1994), “Le determinanti dei differenziali di
attrazione territoriale degli investimenti diretti esteri in Italia”,
L’Industria, No. 2, pp.223-260.
Martin, P.J. and C.A. Rogers (1994), “Industrial Location and Public
Infrastructure”, CEPR Discussion Paper 909.
35
O’hUallachain, B. and N. Reid (1997), “Acquisition versus Greenfield
Investment: the Location and Growth of Japanese Manufacturers in the
United States”, Regional Studies, No. 31, pp. 403-416.
Puga, D. and A. Venables (1996), “The Spread of Industry: Spatial
Agglomeration in Economic Development”, Journal of the Japanese and
International Economies, No. 10, pp. 440-464.
Vickerman, R.W. (1990), “Infrastructure and Regional Development”,
European Research in Regional Science, London, Pion.
Vuong, Q. (1989), “Likelihood Ratio Tests for Model Selection and Non-nested
Hypotheses”, Econometrica, No. 57, pp. 307-334.
Wheeler, D. and A. Mody (1992), “International Investment Location Decisions:
the Case of US Firms”, Journal of International Economics, No. 33, pp.
57-76.
Wei, Y., X. Liu, D. Parker and K. Vaidya (1999), “The Regional Distribution of
Foreign Direct Investment in China”, Regional Studies, No. 33, pp.
857-867.
Woodward, D.P. (1992), “Locational Determinants of Japanese Manufacturing
Start-ups in the United States”, Southern Economic Journal, No. 53, pp.
690-708.
36
© Copyright 2026 Paperzz