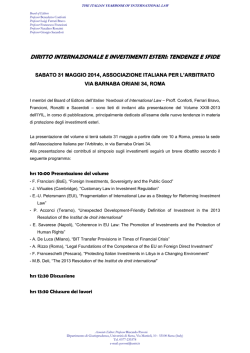
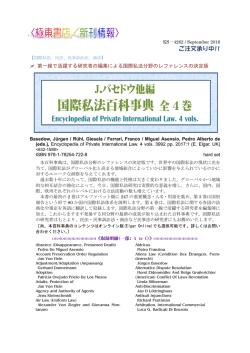
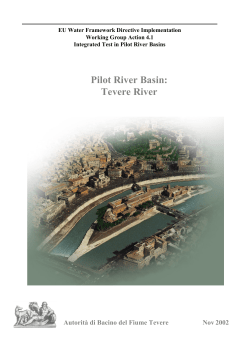
WATER RESOURCES RESEARCH, VOL. 32, NO. 11, PAGES 3367–3374, NOVEMBER 1996
On Hack’s law
Riccardo Rigon,1,2 Ignacio Rodriguez-Iturbe,1 Amos Maritan,3
Achille Giacometti,4 David G. Tarboton,5 and Andrea Rinaldo6
Abstract. Hack’s law is reviewed, emphasizing its implications for the elongation of river
basins as well as its connections with their fractal characteristics. The relation between
Hack’s law and the internal structure of river basins is investigated experimentally through
digital elevation models. It is found that Hack’s exponent, elongation, and some relevant
fractal characters are closely related. The self-affine character of basin boundaries is
shown to be connected to the power law decay of the probability of total contributing
areas at any link and to Hack’s law. An explanation for Hack’s law is derived from scaling
arguments. From the results we suggest that a statistical framework referring to the scaling
invariance of the entire basin structure should be used in the interpretation of Hack’s law.
1.
Introduction
Hack [1957] demonstrated the applicability of a power function relating length and area for streams of the Shenandoah
Valley and adjacent mountains in Virginia. He found the equation
L 5 1.4A 0.6
(1)
where L is the length of the longest stream in miles from the
outlet to the divide and A is the corresponding area in square
miles. Hack also corroborated his equation through the measurements of Langbein [1947], who had measured L and A for
nearly 400 sites in the northeastern United States. Gray [1961]
later refined the analysis, finding a relationship L } A 0.568.
Many other researchers have corroborated Hack’s original
study, and, although the exponent in the power law may slightly
vary from region to region, it is generally accepted to be
slightly below 0.6. Equation (1) rewritten as L } A h with h .
0.5 is usually termed “Hack’s law.”
Muller [1973], on the basis of extensive data analysis of
several thousand basins, found that the exponent in Hack’s
equation was not constant but that it changed from 0.6 for
basins less than 8,000 square miles (20,720 km2) to 0.5 for
basins between 8,000 and 105 square miles (20,720 –259,000
km2), and to 0.47 for basins larger than 105 square miles
(259,000 km2).
As Mesa and Gupta [1987] point out, Muller’s empirical
observations are not consistent with the implications of the
random topology model of channel network structure first in1
Department of Civil Engineering, Texas A&M University, College
Station.
2
Permanently at Dipartimento di Ingegneria Civile e Ambientale,
Università di Trento, Trento, Italy.
3
Istituto Nazionale di Fisica della Materia, Scuola Internazionale
Superiore di Studi Avanzati and Istituto Nazionale di Fisica Nucleare,
Trieste, Italy.
4
Dipartimento di Scienze Ambientali, Università di Venezia, Venezia, Italy.
5
Department of Civil and Environmental Engineering, Utah State
University, Logan.
6
Istituto di Idraulica “G. Poleni,” Università di Padova, Padova,
Italy.
Copyright 1996 by the American Geophysical Union.
Paper number 96WR02397.
0043-1397/96/96WR-02397$09.00
troduced in the classic paper of Shreve [1966]. In fact, they
theoretically derived the value of Hack’s exponent, h, for the
random topology model of channel networks as
h~n! 5
1
2
S
p 1 ~ p /n! 1/ 2
p 2 1/n
D
(2)
where n is the basin’s magnitude. Equation (2) implies a continuously decreasing h(n) with an increasing n. For n 5
10,100, and 500 the exponent h(n) is 0.68, 0.530, and 0.513,
respectively. When n tends to infinity, h tends to the asymptotic value of 0.5. This result makes clear the importance of the
magnitude of the network in the exponent h under the premises of the random topology model. Further and more general results on random trees can also be found in work by
Durret et al. [1991].
The classical explanation for the exponent h being larger
than 0.5 was to conjecture that basins have anisotropic shapes
and tend to become narrower as they enlarge or elongate. The
hypothesis of basin elongation was verified by Ijjasz-Vasquez et
al. [1993] under the framework of optimal channel networks
(OCNs), which are the result of the search of fluvial systems
for a drainage configuration whose total energy expenditure is
minimized [Rodriguez-Iturbe et al., 1992a; Rinaldo et al., 1992].
Thus Hack’s relationship may result from the competition and
minimization of energy in river basins.
Mandelbrot [1983] suggested that an exponent larger than
0.5 in L } A h could arise from the fractal characters of river
channels which cause the measured length to vary with the
spatial scale of the object. Thus (1) would be a reflection of a
fractal dimension of river channels close to d l 5 2 3 0.6 5 1.2
[e.g., Feder, 1988]. However, as explained in detail by Feder
[1988], to derive the fractal dimension of a river from the
previous argument, one needs to assume that the shapes of the
river basins are self-similar. This assumption does not seem to
be verified in nature [Ijjasz-Vasquez et al. 1994; Nikora and
Sapozhnikov, 1993].
Peckham [1995] derived a relationship between Hack’s exponent h and a fractal dimension, say D SST, of a self-similar
tree as h 5 1/D SST. In the case of a space-filling tree, D SST 5
2 and h 5 0.5, while for D SST # 2 Hack’s exponent h can be
higher. Similar arguments connecting Hack’s exponent to the
global fractal characters of the network have been proposed by
Nikora and Sapozhnikov [1993].
One goal of this paper is to suggest a new statistical inter-
3367
3368
RIGON ET AL.: ON HACK’S LAW
Shapes will be called self-similar if the ratio L ' /L \ is constant
for all areas, A, and if the shape of the basins, s, is a constant.
Alternatively, if L ' /L \ decreases as A increases, with s being
constant, basins are self-affine and elongate with A. With s
constant we now define
a~L \! 5 A/L 2\ } L '/L \
(4)
Constant a(L \ ) then implies self-similarity, while a(L \ ) decreasing with A implies self-affinity.
One interpretation of Hack’s law is that the length measured
along channels from the outlet to the divide, L, scales as L \ ,
while s remains constant. Then using (1) in (4), one obtains for
h 5 0.57:
a~L \! } A 122h , A 20.14
(5)
This suggests that a(L \ ) decreases as A increases, implying
that according to Hack’s law, basins elongate with increasing A.
Another interpretation of Hack’s law suggested by Mandelbrot [1983] is that stream channels are fractals and therefore
stream length, L, is scaling as
L } L \fL
(6)
where f L is a fractal scaling exponent. If river basins are
assumed to be self-similar in shape (a(L\) ; constant), one has
A/L 2\ 5 A/L 2/fL , const
and thus L } A
Figure 1. Sketch of a river basin; its diameter, L \ ; and its
width, L ' . Some subbasins are also drawn. For any subbasin
the longest sides of the rectangle enclosing the network are
parallel to the diameter L \ , defined as the straight line from
the outlet to the farthest point in the basin. The shortest sides
are L ' .
pretation of the empirical evidence. Specifically, we focus on
the internal structure of basins whose extension is in the range
of 50 –2000 km2. Theoretical and experimental motivations
justify this choice. At lower scales, diffusive processes interact
with concentrative erosive processes responsible for concave
landforms, and area-length relationships are altered. At very
large scales geologic controls dominate. We expect instead that
at medium to small scales, self-organization plays a predominant role, yielding the observed recurrent characters of river
basins. Furthermore, Montgomery and Dietrich’s [1992] collection of data shows that a composite data set, from 100 m2 up
to 107 km2, can reasonably be fitted with an exponent of 0.5 in
Hack’s relation, and hence a large span of orders of magnitude
in basin area is not the most adequate to fit as a whole when
investigating Hack’s equation.
2.
(7)
, which implies
f L 5 2h
(8)
The more general case compatible with Hack’s law is that
streams are fractals and basins are self-affine. Self-affinity of
watershed shapes may be quantified through the Hurst exponent H [e.g., Meakin et al., 1991; Nikora and Saphoznikov,
1993]:
L ' } L H\
(9)
where H , 1, because by definition L ' , L \ . Then
A 5 sL H11
\
(10)
a~L \! 5 L '/L \ } L H21
\
(11)
and a(L \ ) becomes
For H , 1, a(L \ ) decreases as L \ increases, implying elongation. Using (1) in (4), one obtains
a~L \! } L 1/h/L 2\
(12)
which combined with (6) yields
a~L \! } L \fL/h22
(13)
Thus we have [Maritan et al., 1996]
Does Hack’s Law Imply Elongation?
This section considers the connection between Hack’s law,
the fractal sinuosity of stream channels, and the elongation of
river basins. The meaning of the terms “elongation” and “fractal sinuosity” first needs to be defined.
The planar projection of river basins may be characterized by
A 5 sL 'L \
f L/ 2
(3)
where L ' and L \ are the appropriate measures of length and
width scales shown in Figure 1 and s depends on the shape.
H 5 ~ f L/h! 2 1
(14)
which relates self-affinity, H, the fractal sinuosity of streams,
f L , and Hack’s exponent, h; with reference to the notation of
Maritan et al. [1996], we have f L 5 d l 5 w . Notice that (14)
differs from previous relationships [Meakin et al., 1991; Nikora
and Sapozhnikov, 1993] for the key introduction of the scaling
exponent f L . Self-similarity, on the other hand, implies (8).
One observes that (14) imposes constraints between f L and h.
Thus Hack’s exponents between 0.57 and 0.6 require values of
RIGON ET AL.: ON HACK’S LAW
3369
f L smaller than 1.14 and 1.2, respectively, for elongation to
occur. Higher values of f L will imply contraction of river
basins when increasing with size.
The relationships derived above were first tested in river
channel networks extracted from digital elevations models
(DEMs) using standard procedures [e.g., Jenson and
Domingue, 1988; Tarboton et al., 1991]. The basins used in the
analysis are given in Table 1.
Figure 2a shows the result of Hack’s analysis. While the best
estimate of the slope is close to the commonly found value of
0.6, we notice that the detailed study of the morphology of the
fluvial basins allowed by DEMs permits the analysis of the
statistical fluctuations present in Hack’s type of diagrams.
These fluctuations were neither considered in the original
work by Hack nor in the experimental studies following it.
From Figure 2b we have
L \ } A 0.52
(15)
which gives a Hurst exponent H 5 0.92. The relationship
between L and L \ is presented in Figure 2c:
L } L 1.15
\
(16)
implying a fractal scaling exponent for channel sinuosity of
f L 5 1.15. With f L 5 1.15 and H 5 0.92 in (14), one obtains
h 5 0.60 that matches the value obtained by direct fitting in
Figure 2a.
Thus assuming self-similar shapes and neglecting elongation
would have resulted in h 5 f L /2 5 0.575, and taking streams
as nonfractal would have resulted instead in h 5 1/(0.92 1 1)
5 0.52. In both cases one underestimates the value of h. The
main contribution to the exponent h comes from fractal sinuosity, with a smaller contribution coming from elongation.
The above analysis gives standard results and also clarifies
the conditions which define geometrical elongation. Nevertheless, the requirement that the shape coefficient s is a constant
is too restrictive to be fulfilled exactly. To account for the
Table 1. Geometrical Data Relative to the River Basins
Analyzed
River Basin
Location
A,
km2
L,
km
L \,
km
Guyandotte
Little Coal
Tug Dry Fork
Johns
Big Coal
Racoon
Pingeon
Moshannon
Brushy
Rock Castle
Sturgeon
Island
Wolf
Sexton
Big
Indian
Big
Schoarie Creek Headwater
Pound
Tipton Run
Blackberry Fork
W. Va.
W. Va.
W. Va.
Ky.
W. Va.
Pa.
W. Va.
Pa.
Ala.
Ky.
Ky.
W. Va.
Ky.
Ky.
Ky.
W. Va.
Idaho
N. Y.
Ky.
Pa.
Ky.
2088
984
586
484
449
446
405
393
325
310
295
260
212
186
152
148
146
108
105
64
53
145.1
90.5
63.7
68.8
56.2
53.6
49.1
49.7
52.4
45.9
46.3
30.5
30.3
33.3
30.2
41.0
21.5
18.5
23.5
18.8
18.0
75.8
57.5
41.6
45.7
40.7
35.2
35.3
33.8
29.9
33.5
27.1
23.0
21.7
23.4
21.1
28.3
16.9
15.8
17.8
12.5
13.3
Data were obtained by processing U.S. Geological Survey 7.50
DEMs.
Figure 2. (a) Hack’s law for the basins in Table 1. (b) Elongation for the same set of data as in Figure 2a. An exponent
greater than 0.5 means that basins elongate. (c) Stream length
versus diameter for the basins in Table 1.
natural variability of river network structures, it is necessary to
relax the deterministic definitions in favor of statistical ones.
This will be pursued in the following sections, together with a
generalization of Hack’s law that preserves the validity of (14).
3.
Hack’s Law and Scaling Arguments
Hack’s original work dealt with nonoverlapping basins. In
this section we will start with the assumption that a Hack-type
relationship is valid for the different subbasins embedded in a
larger basin. Thus a statistical framework is developed for the
3370
RIGON ET AL.: ON HACK’S LAW
ple, P(+, a) 5 * `
+ p ( x, a)dx. The distribution p (+, a) will
be assumed to obey a scaling form of the following type:
p ~+, a! 5 ~1/+ j! g@+/l c~a!#
(18)
where l c (a) is a characteristic length and g( x) is a scaling
function that accounts for the finite size of any network. It
satisfies the following properties:
limx3` g~ x! 5 0
(19)
limx30 g~ x! 5 c
(20)
where c is a suitable constant. Equation (18) is a common
assumption when analyzing scaling behavior [e.g., Meakin et al.,
1991; Maritan et al., 1996]. The first condition, (19), ensures the
convergence at infinity of the integral in (17), while (20) gives
a power law behavior for p (+, a) in the infinite size limit, that
is, p(+, `) ; +2j when l c (a) 3 `. Assuming that a Hacktype relationship is valid throughout a basin, whatever characteristic length we use will obey
l c~a! , a h
(21)
p ~+, a! 5 + 2jg~+/a h!
(22)
Thus (18) becomes
The mean value of + with a common contributing area a is
given by
^+& a 5 a h~22j!
E
`
x 12jg~ x! dx
(23)
«
Figure 3. Analysis of the scaling of the moments of stream
lengths with area for Guyandotte River. The top curve shows
the first moment; the following four curves show the ratio
^+ n & a /^+ n21 & a } a h for n 5 2, 3, 4, and 5, respectively,
shifted downward. The plot shows a well defined simple scaling
for at least 2 decades. At the very small scales the scaling is
broken owing to the transition from fluvial to hillslope geometry.
different moments of such a relationship and the resulting
equations are validated through data from DEMs.
The stream length at any point, say +, is defined as the main
distance measured through the network from the point to the
boundary of the basin. Technically, one defines the mainstream
path upstream of any junction following the site having a larger
contributing area until a source is reached. In the case of equal
contributing areas at a junction one chooses the longest path
and, if necessary, makes a random choice. To relate to the
notation adopted throughout this paper, we emphasize that for
subbasins of area a, we denote the mainstream length as +
and, at the closure of the basin, where a 5 A, one has + 5 L.
Denote now by p (+, a) the conditional probability distribution of the stream lengths, +, from points with a given contributing area a. The length distribution is then given by
p̂ ~+! 5
E
da p ~+, a! p~a!
(17)
where p(a) is the probability density function (pdf) of the
contributing areas. We shall further denote with P(+, a) and
P̂(+) the corresponding probabilities of exceedence, for exam-
where the lower limit of the integration is irrelevant because
j , 2. We then have
^+& a , a h~22j!
(24)
If Hack’s law is considered valid for any subbasins embedded
in a basin, then the original relationship is recovered from (24)
when j 5 1. It now has an explicit statistical character referring
to the mean value of (22). Equation (22) explicitly postulates
fractality as it embeds a basic self-affinity in the distribution of
lengths when these are rescaled by a factor a h . Notice that
under this framework any moment of the distribution of
lengths with a common contributing area a is given by
^+ n& a } a h~n2j11!
(25)
^+ n& a/^+ n21& a } a h
(26)
and thus
We have tested the above framework by plotting in double
logarithmic scales the first moment and the ratio of the first
five consecutive moments versus area (e.g., equation (26)) for
the Guyandotte River, the Tug Dry Fork River and the Johns
River. These are shown in Figures 3, 4, and 5. We observe that
clear straight lines emerge whose slopes are 0.56 6 0.01, 0.54 6
0.01, and 0.60 6 0.01. Deviation from the straight line at the
very small scales is due to the transition from a fluvial to a
hillslope type of topography. We have also tested other basins
reported in Table 1 with analogous results. First moments of
the length distribution for the largest basins of Table 1 are
reported in the third column of Table 2. None of the basins
shows a consistent difference between the value of the exponent of the first moment in (24), h(2 2 j ), and the outcome
RIGON ET AL.: ON HACK’S LAW
3371
of the moment ratios, h, in (26), suggesting that j is equal to 1.
Thus the above assessment of Hack’s exponent defined
through scaling arguments yields values close to the original
ones in which suitable nonoverlapping basins were analyzed
with very robust statistics.
Now define +\ as the random variable that represents the
diameter of a subbasin whose outlet is a randomly chosen point
inside the basin. Its distribution can be formally analyzed in
complete analogy with the one of the random variable +. In
particular, its first moment scales with contributing area as
^+ \& a 5 ba h9
(27)
where h9 $ 0.5 and b is a numeric coefficient. In a way
analogous to (10) we introduce H 5 1/h9 2 1 where H , 1
implies self-affinity. The fourth column of Table 2 reports the
value of the Hurst exponent H evaluated as described above,
and the fifth column gives the evaluation of H as in (14). Most
of the values are below 1, and thus the range of H reported by
Maritan et al. [1996] is underestimated.
4. Hack’s Law and the Fractal Structure
of River Basins
Hack’s law generalized as above is now related to the fractal
structure of river basins through the distribution of contributing areas and the distribution of stream lengths.
Rodriguez-Iturbe et al. [1992b] found that the probability
distribution for the contributing area to a randomly chosen
point in a drainage network follows the power law
P@A . a# } a 2b
(28)
Figure 5. Analysis of the scaling of the moments of stream
lengths with area for Johns River. See caption of Figure 3 for
details.
where b is most frequently in the range between 0.43 and 0.45
for basins of very different geologic conditions, climate, vegetation, and soils. The values of b for the basins in Table 1
whose areas are larger than 200 km2 are reported in Table 2.
Maritan et al. [1996] showed that the exponent b can be
expressed as
b 5 ~H 1 1 2 f L!/~H 1 1!
(29)
From (14) we observe also that h 5 f L /(H 1 1). Thus (29)
implies
b1h51
Figure 4. Analysis of the scaling of the moments of stream
lengths with area for Tug Fork River. See caption of Figure 3
for details.
(30)
As shown in Table 2, this is in relatively good agreement with
measurements from DEMs.
Ijjasz-Vasquez et al. [1994] studied the scaling properties of
the main channel and the boundaries of river basins. They
concluded that both are self-affine objects. The boundary of
the basin is composed of two self-affine fractals starting from
the outlet and merging in the farthest point from it. The
straight line joining the outlet and the merging point coincides
with +\ and can be regarded as the analogy of the first collision
time of two self-affine fractals starting from a common origin.
The self-affinity of the two fractal trails is characterized by a
scaling relation similar to (9) between the maximum distance
measured orthogonally from the diameter to the boundary,
which is proportional to L ' , and +\ itself. The basin boundaries studied by Ijjasz-Vasquez et al. [1994] had a well-defined
Hurst exponent, H, between 0.74 and 0.80, in agreement with
the measurements reported by Nikora and Sapozhnikov [1993]
and with the measurements in Table 2, where H $ 0.75.
3372
RIGON ET AL.: ON HACK’S LAW
Table 2. Values Relative to the Rivers in Table 1 Whose
Area Is Larger Than 200 km2
River Basin
fL
h
H
( f L /h) 2 1
b
g
b /h
Guyandotte
Little Coal
Tug Dry Fork
Johns
Big Coal
Racoon
Pingeon
Moshannon
Brushy
Rock Castle
Sturgeon
Island
Wolf
1.06
1.06
1.07
1.06
1.05
1.02
1.06
1.02
1.04
1.06
1.03
1.07
1.07
0.56
0.56
0.54
0.60
0.56
0.52
0.55
0.52
0.54
0.55
0.52
0.54
0.55
0.92
0.92
1.00
0.75
0.89
1.00
0.92
0.96
0.96
0.92
1.01
0.96
0.92
0.89
0.89
0.98
0.77
0.88
0.96
0.93
0.96
0.93
0.93
0.98
0.98
0.96
0.43
0.41
0.41
0.40
0.42
0.45
0.45
0.45
0.43
0.43
0.46
0.43
0.41
0.74
0.74
0.77
0.67
0.75
0.89
0.75
0.86
0.82
0.79
0.92
0.78
0.75
0.77
0.73
0.76
0.67
0.75
0.86
0.82
0.85
0.80
0.78
0.88
0.80
0.75
Here f L , sinuosity exponent; h, Hack’s exponent; H, Hurst’s exponent; b, power law exponent for areas; g, power law exponent for
lengths. Data were obtained after extracting the drainage networks
from DEMs using the threshold A t 5 50 pixels as the maximum
contributing area necessary to maintain a channel. The exponent h was
estimated by fitting ^+& a versus the contributing area in a log-log plot.
The value of H was obtained from ^+ \ & a ; a (1/H)11 where ^+ \ & a is
the expected value of diameters with the contributing area, a. In
column 5, (14) is used to estimate H from the values of f L and h
whose values are reported in columns 2 and 3, respectively. In column
8, g is estimated according to (31) being b and h as given in columns
6 and 3, respectively.
This argument, (29), and (30) clearly show that the selfaffine characteristics (e.g., Hurst exponent) of the basin boundaries are intimately related to Hack’s exponent and the distribution law of contributing areas.
Now consider the random variable defined as the distance,
+, measured through the network from a randomly chosen
point to the boundary of the basin. The exceedence probability
distribution of this distance may be derived from Hack’s law
and the power law distribution of contributing areas.
Calling + the random stream length to the divide, we have
P@+ $ l# } P@A h $ l# 5 P@A $ l 1/h# } l 2b/h ; l 2g
(31)
where b is defined in (28) and h is Hack’s exponent, assumed
here to hold also for the internal structure of a basin. This
holds for j 5 1 in (22). The power law of lengths defined in
(31) has been verified in numerous basins with excellent fitting
throughout several logarithmic scales. It links the aggregation
pattern of areas with the stream length structure of the network and Hack’s law.
Table 2 shows a synthesis of the experimental analyses conducted on the DEMs of the basins in Table 1 with area larger
than 200 km2. The exponent g falls between 0.70 and 0.90 for
values of b between 0.41 to 0.46 and h between 0.52 and 0.60
with an average of 0.55. The average exponents of the probability distributions are 0.79 for the lengths and 0.43 for total
contributing areas.
Figures 6 and 7 show examples of P[+ $ l] for the river
basins whose DEM features have been described in Table 1. In
particular, Figure 6 shows the detailed results obtained for the
Brushy Creek basin where we have used a support area of 50
pixels to define the drainage networks and the lengths are
measured in kilometers. In this case, the exponent of the power
law of lengths is 0.8, the value of b is 0.45, and the value of h
resulting from (31) is 0.56. Figure 7 shows the same results for
the Little Coal River basin.
Figure 6. (a) Brushy Creek with support area 50; (b) P[A . a] versus a (b ; 0.45); (c) P[+ $ L] versus L
(g ; 0.82).
RIGON ET AL.: ON HACK’S LAW
3373
Figure 7. (a) Little Coal River with support area 50; (b) P[A . a] versus a (b ; 20.41); (c) P[+ $ L]
versus L (g ; 0.74).
The consistency of the measured exponents suggests that the
scaling theory developed in this paper is a comprehensive
description of the planar organization of basins.
5.
any randomly chosen point, b, and Hack’s exponent, h. Analyses of DEMs yield an excellent fit to the power law for the
stream lengths and moreover confirm the relation between g,
b, and h.
Conclusions
The results of this paper suggest the following conclusions:
1. Hack’s law appears to hold, in a statistical sense, for
any point inside a basin.
2. The statistical framework developed here predicts
that the ratio of consecutive moments of the distribution of
stream lengths to the divide from points with the same contributing area should follow a power law as a function of area
with the exponent being close to Hack’s h. This prediction is
confirmed in natural basins.
3. Hack’s exponent, the self-affinity of the river basin,
and the fractal sinuosity of its channels are related by H 5
f L /h 2 1. For elongation to occur, H needs to be smaller than
1. This imposes constraints between Hack’s exponent and the
fractal characters of rivers. The values of h and f L obtained in
natural river basins yield H , 1 and thus confirm the tendency
to elongate.
4. Hack’s relationship and the self-affine character of
basin boundaries are related. The values obtained for H and
f L in real basins yield excellent agreement with the commonly
accepted values of h.
5. The exponents b and h are found to be dependent
variables through b 1 h 5 1. Estimations of b and h in
natural basins tend to confirm this dependency.
6. The stream length from any point to the divide follows
a power law distribution whose exponent, g, is the ratio of the
exponent of the power law describing the contributing area at
Acknowledgments. This work was supported by C.N.R. “Gruppo
Nazionale per la protezione dalle catastrofi idrogeologiche,” Linea 3,
Progetti MIEP-METEORAIN, by funds provided by the R. P. Gregory
Chair in Civil Engineering at Texas A&M University, and by
M.U.R.S.T. 40% “Processi Idrologici fondamentali.” Their support is
gratefully acknowledged.
References
Durret, R., H. Kesten, and E. Waymire, On weighted heights of random trees, J. Theor. Prob., 4, 223–237, 1991.
Feder, J., Fractals, Plenum, New York, 1988.
Gray, D. M., Interrelationships of watershed characteristics, J. Geophys. Res., 66(4), 1215–1233, 1961.
Hack, J. T., Studies of longitudinal profiles in Virginia and Maryland,
U.S. Geol. Surv. Prof. Pap., 294-B, 1, 1957.
Ijjasz-Vasquez, E., R. L. Bras, and I. Rodriguez-Iturbe, Hack’s relation
and optimal channel networks: The elongation of river basins as a
consequence of energy minimization, Geophys. Res. Lett., 20(15),
1583–1586, 1993.
Ijjasz-Vasquez, E., R. L. Bras, and I. Rodriguez-Iturbe, Self-affine
scaling of fractal river courses and basin boundaries, Physica A, 209,
288 –300, 1994.
Jenson, S. K., and J. O. Domingue, Extracting topographic structures
from digital elevation models, Hydrol. Proc., 5(1), 31– 44, 1988.
Langbein, W. B., Topographic characteristics of drainage basins, U.S.
Geol. Surv. Prof. Pap., 968-C, 1947.
Mandelbrot, B. B., The Fractal Geometry of Nature, W. H. Freeman,
New York, 1983.
Maritan, A., A. Rinaldo, R. Rigon, A. Giacometti, and I. RodriguezIturbe, Phys. Rev. E, 53, 1510, 1996.
3374
RIGON ET AL.: ON HACK’S LAW
Meakin, P., J. Feder, and T. Jossang, Simple statistical models of river
networks, Physica A, 176, 409 – 429, 1991.
Mesa, O. J., and V. K. Gupta, On the main channel length-area
relationships for channel networks, Water Resour. Res., 23(11),
2119 –2122, 1987.
Montgomery, D. R., and W. E. Dietrich, Channel initiation and the
problem of landscape scale, Science, 255, 826 – 830, 1992.
Muller, J. E., Re-evaluation of the relationship of master streams and
drainage basins: Reply, Geol. Soc. Am. Bull., 84, 3127–3130, 1973.
Nikora, V. I., and V. Sapozhnikov, River network fractal geometry and
its computer simulation, Water Resour. Res., 29(10), 3569 –3575,
1993.
Peckham, S., New results for self-similar tree with application to river
networks, Water Resour. Res., 31(4), 1023–1029, 1995.
Rinaldo A., I. Rodriguez-Iturbe, R. Rigon, R. L. Bras, E. J. IjjaszVasquez, and A. Marani, Minimum energy expenditure and fractal
structures of drainage networks, Water Resour. Res., 28(9), 2183–
2195, 1992.
Rodriguez-Iturbe, I., A. Rinaldo, R. Rigon, R. L. Bras, A. Marani, and
E. J. Ijjasz-Vasquez, Energy dissipation, runoff production, and the
three-dimensional structure of river basins, Water Resour. Res.,
28(4), 1095–1103, 1992a.
Rodriguez-Iturbe, I., E. Ijjasz-Vasquez, R. L. Bras, and D. G. Tar-
boton, Power law distributions of mass and energy in river basins,
Water Resour. Res., 28(3), 988 –993, 1992b.
Shreve, R. L., Statistical law of stream numbers, J. Geol., 74, 17–37,
1966.
Tarboton D. G., R. L. Bras, and I. Rodriguez-Iturbe, On the extraction
of channel networks from digital elevation data, Hydrol. Proc., 5(5),
81–100, 1991.
A. Giacometti, Dipartimento di Scienze Ambientali, Università di
Venezia, D. D. 2137 Venezia, Italy.
A. Maritan, International School for Advanced Studies and Istituto
Nazionale di Fisica Nucleare, Trieste, Italy.
R. Rigon and R. Rodriguez-Iturbe, Department of Civil Engineering, Texas A&M University, CE/TTI Building, Rm. 201, College Station, TX 77843. (e-mail: [email protected]; [email protected])
A. Rinaldo, Istituto di Idraulica “G. Poleni,” Università di Padova,
I-35121 Padova, Italy. (e-mail: [email protected])
D. G. Tarboton, Department of Civil and Environmental Engineering, Utah State University, Logan, UT84322-4110.
(Received March 4, 1996; revised July 30, 1996;
accepted August 2, 1996.)
© Copyright 2026 Paperzz