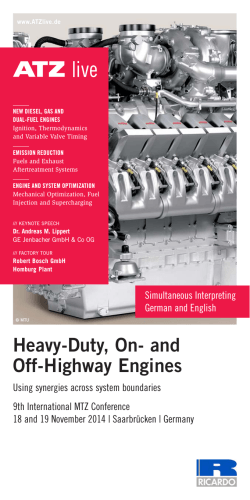
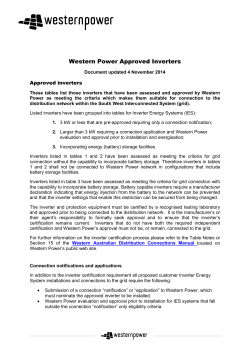
real value
Consolidated INTERIM REPORT
Third Quarter 2014
SolarWorld AG
тАУ SolarWorld 2014 тАУ
For your guidance
┬аCross reference to text passages in the Group Interim ReportтАЙтАвтАЙp.тАЙ00тАЙ//
00 ┬аCross
reference to charts in the Group Interim ReportтАЙтАвтАЙp.тАЙ00тАЙ//
┬аwww.internetlink.comтАЙ//
┬аCross reference to Sustainability in Detail 2013тАЙтАвтАЙp.тАЙS000тАЙ//
┬аCross reference to financial reports of prior yearsтАЙтАвтАЙp.тАЙ000тАЙ//
Rounding differences may occur.
Sol arWorld 2014
Content
// Key figures third quarter 2014
03
04
Selected indicators
04
Quarterly comparison of the consolidated income statements
05
Revenue by region
05
//Letter by the Chairman
07
//Interim group Management report
third quarter 2014* 09
Business development
11
Economic position
18
Material related party transactions
24
Supplementary report
25
Opportunities and risks
26
Forecast report
26
//Consolidated Interim Financial Statements
third quarter 2014* 31
Consolidated income statement
33
Statement of consolidated comprehensive income
35
Consolidated balance sheet
37
Consolidated statement of changes in equity
38
Consolidated cash flow statement
39
Notes on the consolidated interim financial statements
40
//Financial and event calendar
* A more detailed table of contents can be found at the beginning of the main chapters.
50
Sol arWorld 2014тАВ тАвтАВ Ke y figures Third Quarter
04
Key figures
01
Selected indicators // in kтВм
Financial indicators
3rd quarter 2014
3rd quarter 2013
Revenue
180,823
144,455
36,368
EBITDA
6,227
тАУтАЙ25,765
31,992
EBIT
тАУтАЙ4,183
тАУтАЙ35,951
31,768
Consolidated net result
тАУтАЙ8,654
тАУтАЙ63,634
54,980
1stтАЙтАУтАЙ3rd quarter 2014
1stтАЙтАУтАЙ3rd quarter 2013
Change
408,918
345,624
63,294
79.1тАЙ%
68.7тАЙ%
10.4тАЙ%-points
170,364
Financial indicators
Revenue
Foreign quota in % of revenue
Change
107,298
тАУтАЙ63,066
EBIT
76,745
тАУтАЙ94,980
171,725
EBIT in % of revenue
18.8тАЙ%
тАУтАЙ27.5тАЙ%
46.2тАЙ%-points
EBITDA
Capital employed (key date)*
490,896
441,323
49,573
Consolidated net result
489,218
тАУтАЙ134,995
624,213
Consolidated net result in % of revenue
119.6тАЙ%
тАУтАЙ39.1тАЙ%
158.7тАЙ%-points
Total assets
946,402
1,022,733
тАУтАЙ76,331
Equity
263,959
тАУтАЙ148,049
412,008
27.9тАЙ%
тАУтАЙ14.5тАЙ%
42.4тАЙ%-points
Cash flow from operating activities
тАУтАЙ45,454
6,539
тАУтАЙ51,993
Net indebtedness**
297,455
843,167
тАУтАЙ545,712
55,243
19,823
35,420
1stтАЙтАУтАЙ3rd quarter 2014
1stтАЙтАУтАЙ3rd quarter 2013
Change
2,751
2,095
656
Equity ratio (in %)
Investments in intangible assets
and property, plant and equipment
Employee indicators
Employee (key date)
Of which trainees (key date)
Personnel costs ratio (in %)
Revenue per employee (in kтВм)
EBIT per employee (in kтВм)
43
50
тАУтАЙ7
23.8тАЙ%
33.3тАЙ%
тАУтАЙ9.4тАЙ%-points
149
165
тАУтАЙ16
28
тАУтАЙ45
73
* Intangible assets and property, plant and equipment less deferred investments subsidies plus net current assets except for current net liquidity
** Financial liabilities less liquid funds
тАВ back to content
Sol arWorld 2014тАВ тАвтАВ Ke y figures Third Quarter
05
02
Quarterly comparison of the Consolidated income Statements // in kтВм
Q4 2013
Q1 2014
Q2 2014
Q3 2014
Q3 2013
Change
110,197
99,420
128,675
180,823
144,455
36,368
Change in inventories
тАУтАЙ3,326
14,387
12,342
тАУтАЙ7,664
тАУтАЙ43,132
35,468
Own work capitalized
34
174
494
141
436
тАУтАЙ295
Revenue
19,896
153,309
27,889
20,899
9,017
11,882
Cost of materials
тАУтАЙ78,473
тАУтАЙ77,108
тАУтАЙ98,871
тАУтАЙ120,113
тАУтАЙ78,925
тАУтАЙ41,188
Personnel expenses
тАУтАЙ26,732
тАУтАЙ30,287
тАУтАЙ37,107
тАУтАЙ34,695
тАУтАЙ27,588
тАУтАЙ7,107
тАУтАЙ9,963
тАУтАЙ9,776
тАУтАЙ10,367
тАУтАЙ10,410
тАУтАЙ10,186
тАУтАЙ224
тАУтАЙ105,317
тАУтАЙ22,707
тАУтАЙ69,539
тАУтАЙ33,164
тАУтАЙ30,028
тАУтАЙ3,136
Operating result
тАУтАЙ93,685
127,412
тАУтАЙ46,484
тАУтАЙ4,183
тАУтАЙ35,951
31,768
Financial result
тАУтАЙ21,855
535,370
тАУтАЙ8,169
тАУтАЙ7,718
тАУтАЙ19,614
11,896
тАУтАЙ115,539
662,782
тАУтАЙ54,653
тАУтАЙ11,901
тАУтАЙ55,565
43,663
22,228
тАУтАЙ112,651
2,394
3,247
тАУтАЙ8,069
11,316
тАУтАЙ93,312
550,131
тАУтАЙ52,258
тАУтАЙ8,654
тАУтАЙ63,634
54,980
Other operating income
Amortization and depreciation
Other operating expenses
Pre-income tax result
Taxes on income
Consolidated net result
03
Revenue by region // in mтВм
142.2
U.S.
85.5
Germany
112.3
U.S.
108.0
Germany
54.5
Asia
18.1
ROW
Q1тАЙтАУтАЙQ3 2014
108.6
Rest of
Europe
21.3
Asia
16.6
ROW
Q1тАЙтАУтАЙQ3 2013
87.5
Rest of
Europe
тАВ back to content
06
real value
Real Value
In the last couple of months, SolarWorld intro-
REAL VALUE is a self-imposed quality standard,
duced its new claim, REAL VALUE, at big trade
by which SolarWorld measures its work, its pro-
shows worldwide тАУ from Munich to Osaka and Las
cesses and all products. SolarWorld is focusing
Vegas. REAL VALUE has been well-received by
on four authentic and lasting values:
customers and business partners alike.
тАВProven quality
REAL VALUE is the brand essence of SolarWorld AG and has been featured as an integral
part of the company logo since March 2014. Step
by step, SolarWorld is introducing REAL VALUE
into individual solar markets this year to position
тАВFulfilling customersтАЩ needs with leading
solutions
тАВA responsible partner you can trust
┬нworldwide
тАВAuthentic focus on sustainability
itself more clearly than before internationally.
тАВ back to content
Sol arWorld 2014
07
Letter by the Chairman
Dear shareholders, noteholders, employees and customers of SolarWorld AG,
Following a difficult phase, the name SolarWorld is generating positive news again: WeтАЩre growing!
By mid-September, our shipments surpassed the total for the whole of 2013. America is doing particularly well, accounting for 43 percent of our shipments during the third quarter тАУ on a rising trend. At
our Hillsboro site in Oregon, we will therefore be adjusting production to meet the growing demand,
while building up groupwide module capacity to around 1.3 GW in stages.
Apart from the United States, Germany and Italy, we have become firmly established in additional
markets, including France, the United Kingdom and Japan. The internationalization of SolarWorld
is proceeding apace, with new impetus from the roll-out of REAL VALUE, our global brand identity.
Over the course of the year, SolarWorld has seen strong growth in its module supply business. Our
success in the U.S. market, for example, has been driven by high demand for our high-performance
modules featuring the new PERC technology. Conversely, complete solar power systems accounted for
a lower share of the groupwide total. Nevertheless, I am confident that this segment will pick up again
in 2015. Our solutions offering battery storage and intelligent energy management will be a future
growth driver. SunPac LiOn, a new product which we launched in the third quarter, is already attracting a lot of interest.
SolarWorldтАЩs shipments and revenue are growing dynamically, putting us on course to return to
operational profitability. Employees in all departments at all sites are pulling together to achieve the
turnaround in 2015. Capacity utilization at our Arnstadt production plant, which we acquired from
Bosch in March of this year, was swiftly increased during the ramp-up phase. Thanks in particular to
extensive cooperation with the Freiberg site, the new production lines in Arnstadt are now well integrated into the groupтАЩs value chain. But integration is not yet complete: Over the coming months, we
will further harmonize production processes and products across all sites to realize potential for
greater efficiency.
тАВ back to content
Sol arWorld 2014
08
Growth with more efficient processes, maximum quality and forward-looking products тАУ this is our
route to profitability. The sooner we reach our goal, the better. Going a bit faster never hurt anyone.
Bonn, November 12, 2014
Yours sincerely,
Dr.-Ing. E.тАЙh. Frank Asbeck
Chief Executive Officer
тАВ back to content
interim Group Management
report third quarter 2014
тАЖ11тАЖBusiness
11
13
15
17
The stock
The market
Trade
Production
тАЖ18тАЖEconomic
18
21
23
development in the third quarter of 2014
position
Earnings position
Financial position
Assets position
тАЖ24тАЖMaterial
related-party transactions
тАЖ25тАЖ
Supplementary report
25
Disclosure of events of particular importance and their repercussions
25Overall statement by the Management Board
on the economic position at the time of the report
тАЖ26тАЖOpportunities
тАЖ26тАЖ
26
and risks
Forecast report
Expected macroeconomic environment
27
Expected development of the solar power market
28
Future development of business
29
Expected development of revenue and profit or loss
29
Expected financial position
30Overall statement by the Management Board
on the expected development of the group
Sol arWorld 2014тАВ тАвтАВ Interim group Management third quarterтАВ тАвтАВ Business de velopment
Business development in the third quarter of 2014
The stock
During the third quarter of 2014, geopolitical conflicts in the Ukraine and Middle East led to continued uncertainty on the international capital markets. In this climate, the German stock index (DAX)
underwent a significant correction starting in mid-July, after its strong performance in the first half of
2014. It reached its lowest level in the year so far on August 8, 2014, at 8,903 points. During the second
half of August, a brief recovery set in, only to be followed by a downturn in mid-September. Over the
quarter as a whole, therefore, GermanyтАЩs leading share index lost 3.9 percent to close at 9,474 points on
the cut-off date, September 30, 2014. The DAX International Mid 100 (Performance) index, in which
the SolarWorld stock is listed, dropped 5.9 percent during the third quarter of 2014.
The U.S. stock markets painted a more positive picture: Negative sentiment due to the geopolitical
conflicts was temporarily outweighed by the Federal ReserveтАЩs continuing expansionary monetary
┬нpolicy and positive employment data. At the beginning of July 2014, the Dow Jones Industrial Average index broke through 17,000 points for the first time. Toward the end of July, the index suffered
significant falls, touching a low of 16,368 points. From mid-August, the Dow recovered again, even
reaching an all-time high of 17,280 points on September 19, 2014. Overall, it gained 1.3 percent during
the third quarter, to stand at 17,043 points on the cut-off date, September 30, 2014.
The Photovoltaik Global 30 index essentially followed the trend of the major international indices.
Since new installations of solar power systems in China in 2014 look set to come in lower than previously forecast, solar stocks came under additional pressure. On the cut-off date, September 30, 2014,
the Photovoltaik Global 30 index closed at 31 points, marking a loss of 8.4 percent during the third
quarter.
SolarWorldтАЩs stock price performance did not escape the negative overall market trend during the
third quarter of 2014, and moreover experienced sharp volatility. The opening price on July 1, 2014,
was тВм┬а14.70. On July 23, 2014, the price reached a high of тВм┬а16.34, only to fall back to a low of тВм┬а12.35.
In September, SolarWorld stock again briefly topped the 16-euro mark, but another fall set in immediately. Overall, the stock posted a loss of 13.3 percent during the third quarter, closing at тВм┬а12.74.
тАВ back to content
11
Sol arWorld 2014тАВ тАвтАВ Interim group Management third quarterтАВ тАвтАВ Business de velopment
12
04
SolarWorld stock performance in comparison
Period: July 1, 2014тАЙтАУтАЙSeptember 30, 2014
96тАЙ%
DAX
120тАЙ%
94тАЙ%
DAX Int.
Mid 100
(Performance)
110тАЙ%
100тАЙ%
92тАЙ%
Photovoltaik
Global 30
Index
90тАЙ%
80тАЙ%
Jul
87тАЙ%
┬нSolarWorld
Aug
Sep
Qct
Capital stock and shareholder structure
The capital stock of SolarWorld AG remained unchanged during the third quarter of 2014 and stood
at тВм┬а14,896,000.00 on the cut-off date. It is divided into 14,896,000 no-par bearer shares with an
imputed nominal value of тВм┬а1.00.
On July 29 and 30, 2014, Solar Holding Beteiligungsgesellschaft mbH, a company controlled by CEO
Dr.-Ing. E.┬аh. Frank Asbeck, acquired a total of 126,064 SolarWorld shares via the stock exchange.
The average purchase price was approximately тВм┬а15.10. SolarWorld disclosed these transactions in
accordance with ┬з┬а15a of the German Securities Trading Act (WpHG) on July 31, 2014.
www.solar-
world.de/en/directors-dealingsтАЙ//
In September 2014, SolarWorld AG received various voting rights announcements pursuant to ┬з┬а21
WpHG. One of these concerned the reduction by ITOM Investment S.тАК├а r.l. of its direct shareholding in
SolarWorld AG to 0.0┬аpercent. ITOM Investment is a company that was formed solely to handle the
technical implementation of SolarWorldтАЩs financial restructuring. It temporarily managed institutional investorsтАЩ shares on a trustee basis. SolarWorld AG provides an overview of published voting
rights announcements on the companyтАЩs website at
www.solarworld.de/notification-of-voting-rightsтАЙ//.
тАВ back to content
Sol arWorld 2014тАВ тАвтАВ Interim group Management third quarterтАВ тАвтАВ Business de velopment
05
13
Shareholder structure as at September 30, 2014 // in percent
A
D
2014
A // Dr.-Ing. E.тАЙh. Frank Asbeck
(held directly and indirectly) 20.85тАЙ%
B // Qatar Solar S.P.C. 29.00тАЙ%
C // Strategic Value Partners B
D // Free float 9.13тАЙ%
41.02тАЙ%
C
The market
Macroeconomic environment
Global economic growth has stalled in 2014, according to the fall forecast from the Institute for the
World Economy (If W) in Kiel, Germany. Geopolitical crises and turbulence on the financial markets
have had a negative impact on the recovery. If W has tempered its expectations for 2014 and 2015
accordingly.
┬аExpected macroeconomic environmentтАЙтАвтАЙp.тАЙ26тАЙ//
In particular, analysts at If W cited continuing weakness in emerging economies. However, they are
only of minor importance as sales markets for SolarWorld. By contrast, core markets for SolarWorld
such as the United States, Eurozone, United Kingdom and Japan saw dynamic growth.
Yet according to If W, strong economic expansion in Germany during the summer months of 2014 did
not continue as expected. Partly as a result of the escalation of conflict in the Ukraine, export expectations waned, while domestic companies put off investments.
If W reported increasing signs of a substantial boom in German housing construction, with investments
set to increase by 3.3 percent a year in 2014 and 2015. The construction boom in Germany limits the
solar industryтАЩs growth potentials, since it creates attractive work alternatives for the skilled trades.
тАВ back to content
Sol arWorld 2014тАВ тАвтАВ Interim group Management third quarterтАВ тАвтАВ Business de velopment
14
The solar power market
Global demand for solar power products has seen a sharp increase in 2014. This trend has been driven
mainly by the United States, United Kingdom, Japan and China.
The U.S. market continued its fast pace of growth. In the first half-year alone тАУ which in the U.S. is
usually characterized by lower demand тАУ solar power systems with a total capacity of around 2.5┬аGW
were installed, an increase of nearly 50 percent on the previous year. The U.S. Solar Energy Industries
Association (SEIA) expects new installations to reach around 6.5┬аGW for 2014 as a whole. SolarWorld
has received particularly high demand for its monocrystalline high-performance modules from this
market, with sales figures significantly up on the previous year.
┬аTradeтАЙтАвтАЙp.тАЙ15тАЙ//
On June 3 and on July 25, 2014, the U.S. Department of Commerce imposed substantial duties on U.S.
imports of crystalline silicon solar panels made by the state-controlled Chinese solar industry from
solar cells fabricated in third countries using Chinese inputs as well as solar cells made in Taiwan,
regardless of where they are assembled into modules. By mid-year 2014, it was clear that the preliminary remedies to address improper trade practices of the Chinese solar industry were already beginning to restore fair competition in the U.S. market -- to the benefit of domestic producers.
On December 15, 2014, the Department of Commerce will take a final decision on the continuation of
these anti-dumping duties as well as the anti-subsidy duties that were imposed back in June 2014.
Then, in late January, the U.S. International Trade Commission will take a vote on whether the Chinese
trade practices are at least partly the cause of injury to the U.S. domestic solar manufacturing industry, a determination that would activate CommerceтАЩs final duties.
Demand for solar products in Germany was very restrained. During the first nine months of the year,
only around 1.6 (Q1-Q3 2013: 2.7) GW were installed, a decline of 41 percent, compared with the same
period in the previous year. The market was shaken by a further reform of the German Renewable
Energy Sources Act (EEG), which came into force on August 1, 2014. As of that date, 30┬аpercent of the
EEG levy is charged on self-consumed electricity from systems that have an output of more than 10┬аkW.
The levy is currently 6.25 euro cents per kWh, and will be reduced to 6.17 euro cents per kWh from
2015. In 2016, the percentage rate increases to 35 percent, before a final rise to 40┬аpercent in 2017.
Solar power systems that have an output of less than 10┬аkW or which produce less than 10,000┬аkWh per
year are exempt from the levy. This minimum threshold means that self-consumption of solar power
remains attractive for small roof-mounted systems. As a result, the proportion of systems under 10┬аkW
increased from 12 percent of all installations in July 2014 to 32 percent in September. Thanks to its
strong positioning in the private roof-mounted systems segment in Germany, SolarWorld achieved an
increase in market share in this segment to about 20 percent, despite falling overall demand.
тАВ back to content
Sol arWorld 2014тАВ тАвтАВ Interim group Management third quarterтАВ тАвтАВ Business de velopment
In the rest of Europe, the United Kingdom continued to be the most important solar market in 2014.
According to preliminary data, newly installed capacity in the first nine months of the year grew by
66 percent to around 1.5 (Q1-Q3 2013: 0.9) GW. In France, too, the market followed a positive trend:
Demand for solar power systems grew by 57 percent in the first half-year to 0.39 (H1 2013: 0.25)┬аGW.
Growth continued in the third quarter.
The Japanese solar market turned in another robust performance. The roof-mounted systems segment
was particularly active. Around three-quarters of systems installed during the first nine months of
2014 fell into this segment.
Repercussions of the general conditions on business development
During the first three quarters of 2014, on the back of strong demand growth, the SolarWorld group
increased its shipment volumes in the тАЬTradeтАЭ segment by more than one-half compared with the same
period of the previous year. We established a particularly good market position in the United States
with new products in the module segment. In the United Kingdom and Japan, we achieved continuous
sales increases in the roof-mounted systems segment. In Germany, despite collapsing demand, we were
able to increase our sales volume slightly and thus gain market share.
Trade
During the first nine months of the year, SolarWorld┬аAG increased its shipments of solar modules
and kits by 54 percent to 602 (Q1-Q3 2013: 390)┬аMW. By mid-September 2014, we exceeded total shipments of the year 2013 as a whole (548 MW). Moreover, in September, we shipped more than 100 MW
in one month for the first time and thus set a new own record. All in all, we were able to increase shipments in the third quarter, compared with the second quarter, by approximately 40 percent to 270┬аMW.
тАВ back to content
15
Sol arWorld 2014тАВ тАвтАВ Interim group Management third quarterтАВ тАвтАВ Business de velopment
16
In the first nine months of 2014, we recorded our highest growth in the United States, Japan, France
and the United Kingdom. SolarWorldтАЩs strongest individual market was the United States, where we
nearly doubled our shipments compared with the same period of the previous year. The U.S. accounted
for around 40 (Q1-Q3 2013: 30) percent of total business in the first three quarters of 2014.
During the first three quarters in the United Kingdom, we achieved growth that is based primarily on
our well-established business for roof-mounted systems, and this trend looks set to continue.
Sales figures in Germany improved slightly compared with the previous year, even though the countryтАЩs
solar market witnessed a significant decline.
┬аThe solar power marketтАЙтАвтАЙp.тАЙ14тАЙ// Thanks to our tradi-
tional strength in the small systems business, our market share in this segment grew further to about
20 percent.
At the beginning of July 2014, our European sales team signed a contract to supply modules with a
volume of 50┬аMW for a large-scale project outside Europe. We had shipped around 40┬аMW by the end
of the third quarter of 2014. Owing to contractual agreements, we are not able to provide further details of this project until the plant is commissioned.
For the time being, to obviate financial risks and avoid tying up cash on a long-term basis, we have
deferred project planning and the implementation of new turnkey large-scale projects in favor of the
strong supply business.
Having set our strategic sights on the market for complete solar power systems, this business fell short
of expectations, with the result that its share of shipments declined, compared with the same period
of the previous year. However, our innovations in the module field тАУ which are especially distinguished
by performance and esthetics тАУ have been very well-received on the international markets. These include our glass-glass module, our 72-cell module, and our monocrystalline high-performance modules,
with which we have achieved excellent sales, particularly in the United States. The growing module
supply business gives us the opportunity to acquire customers for other products in our portfolio in
the medium and long term.
Turning to storage technology, in the third quarter we began shipping the SunPac LiOn, a complete
solar power solution using lithium iron phosphate batteries. Given the high level of interest in this new
product, we expect shipments to increase next year. To read about SolarWorldтАЩs innovations in solar
power storage and consumption management, see the
┬аConsolidated Interim Report First Half-Year
2014/TradeтАЙтАвтАЙp.тАЙ18тАЙ//.
Beginning in March 2014, we have gradually rolled out our new тАЬSolarWorld тАУ REAL VALUEтАЭ
brand identity in SolarWorldтАЩs individual sales markets to enhance its positioning internationally.
тАВ back to content
Sol arWorld 2014тАВ тАвтАВ Interim group Management third quarterтАВ тАвтАВ Business de velopment
17
Production
During the period under review, the production units of the SolarWorld group were jointly challenged with the task of meeting sharply increasing demand for SolarWorld modules. Cell and module capacities at Freiberg, Germany and Hillsboro, U.S. were almost fully utilized. At both sites, we
began re-activating unused capacities during the third quarter of 2014. Not least because of the high
demand, we were eager to ramp up cell and module production as soon as possible at our Arnstadt,
Germany plant, which we acquired from Bosch in March 2014, and integrate these facilities into the
groupтАЩs value chain.
SolarWorld Industries Th├╝ringen GmbH in Arnstadt has been manufacturing monocrystalline
┬н72-cell modules (Sunmodule XL) since April and has continuously increased production volumes,
┬нi nitially on one line. In August, we started up our second module line in Arnstadt, on which we also
manufacture the Sunmodule XL, since demand is so high. Cell production at SolarWorld Industries
Th├╝ringen also commenced swiftly following the takeover, with successive increases in output. Because of the high volume of cells required by the groupтАЩs own module production units, sales of cells
to external manufacturers have only taken place on a small scale so far.
Cooperation between the three production sites was stepped up during the period under review, especially between Freiberg and Arnstadt, some 125 miles apart. At the Hillsboro and Freiberg sites, we
are simultaneously implementing further measures to optimize processes and streamline the organizational structures. In the United States, we pressed ahead with the integration of sales and production
at Hillsboro.
┬аSupplementary reportтАЙтАвтАЙp.тАЙ25тАЙ// In Freiberg, in July 2014, we merged the three production
subsidiaries Deutsche Solar, Deutsche Cell and Solar Factory into one company, called SolarWorld Industries Sachsen GmbH. Now that the wafer, cell and module stages of the value chain are
integrated in one company at Freiberg, we can make processes even more efficient and cut costs further.
тАВ back to content
Sol arWorld 2014тАВ тАвтАВ Interim group Management third quarterтАВ тАвтАВ Economic position
18
Economic position
Earnings position
Development of revenue and profit or loss
In the first nine months of 2014, groupwide shipments grew by 46.6 percent to 626 (Q1-Q3 2013: 427)
MW. Our groupwide foreign shipments quota for the first three quarters of 2014 increased by 7 percentage points to 83 (Q1-Q3 2013: 76) percent on the back of strong growth in our export markets. In
the third quarter of 2014, overall shipments rose by 39.2 percent to 270 (Q3 2013: 194) MW.
Shipments of solar modules and kits in the тАЬTradeтАЭ segment increased by 54.4 percent to 602 (Q1-Q3
2013: 390) MW. We achieved robust growth particularly in the United States, where we managed to
nearly double our shipments, compared with the same period last year. In this market, we shipped
about 40 percent of our modules and kits in this market. In the European markets of France and the
United Kingdom as well as in Japan, SolarWorldтАЩs shipments grew considerably, too. These three
markets accounted for about 28 percent of our total sales volume. In Germany, too, SolarWorld increased shipments by 4.3 percent, even though the German solar market as a whole contracted by
40.7 percent. The German market accounted for just 17 percent of our total shipments of modules and
kits.
External sales of solar wafers in the segment тАЬProduction GermanyтАЭ decreased in the first three quarters 2014 to 24 (Q1-Q3 2013: 36) MW.
06
Development of shipments // In MW
Modules and kits
(тАЬTradeтАЭ segment)
Wafers
(тАЬProduction GermanyтАЭ segment)
Total
Q1 2014
Q2 2014
Q3 2014
Q3 2013
140
193
270
180
14
10
0
14
154
203
270
194
тАВ back to content
Sol arWorld 2014тАВ тАвтАВ Interim group Management third quarterтАВ тАвтАВ Economic position
The SolarWorld group was able to increase its consolidated revenue in the first nine months 2014 by
18.3 percent or тВм 63.3 million, reaching тВм 408.9 (Q1-Q3 2013: 345.6) million. Due to the higher sales
volume outside Germany, the revenue foreign quota rose by 10.4 percentage points to 79.1 (Q1-Q3 2013:
68.7) percent. In the third quarter, consolidated revenue was up by 25.1 percent to тВм 180.8 (Q3 2013:
144.5) million.
In the тАЬTradeтАЭ segment, revenue from modules and kits rose by 20.6 percent in the first nine months of
2014 to тВм 396.5 (Q1-Q3 2013: 328.8) million. The lower increase in revenue compared with shipments
was due among other factors to a shift in the product mix. While shipments of solar power modules
grew strongly on an international level, sales of complete systems were below target, especially owing
to the weak solar market in Germany. Price declines compared with the previous year were another
factor causing revenue growth to fall short of our expectations in the first three quarters of 2014. Due
to the lower wafer shipments, external revenue in the тАЬProduction GermanyтАЭ segment, which is primarily influenced by our external wafer business, fell by тВм 3.0 million to тВм 11.8 (Q1-Q3 2013: 14.8) million.
Consolidated earnings before interest, tax, depreciation and amortization (EBITDA) improved in the
first nine months 2014 by тВм 170.4 million to тВм 107.3 (Q1-Q3 2013: тАУтАЙ63.1) million. In the third quarter
of 2014, EBITDA was тВм 6.2 (Q3 2013: тАУтАЙ25.8) million.
Adjusted EBITDA in the first nine months of 2014 amounted to 1.5 million тВм. The one-off effects include
a provisional profit of тВм 136.1 million from the acquisition of solar activities from Bosch as well as impairment losses on repayment claims and prepayments of тВм 30.3 million resulting from a commercial
agreement with a raw material supplier. The reduction of the latter by тВм 5.8 million, compared with the
previous quarter, is mostly related to effects of currency translation.
In the тАЬTradeтАЭ segment, EBITDA increased in the first nine months 2014 by тВм 38.3 million to тВм тАУтАЙ9.8
(Q1-Q3 2013: тАУтАЙ48.1) million. EBITDA also grew in the тАЬProduction U.S.тАЭ segment by тВм 14.4 million to
тВм тАУтАЙ5.9 (Q1-Q3 2013: тАУтАЙ20.3) million. In the same period, EBITDA in the тАЬProduction GermanyтАЭ segment
improved by тВм 121.3 million to тВм 120.9 (Q1-Q3 2013: тАУтАЙ0.4) million. Adjusted for the one-off effects mentioned above, EBITDA in the тАЬProduction GermanyтАЭ segment totaled тВм 15.1 million. As expected, the
costs of the production ramp-up at our site in Arnstadt, Germany, continued to reduce EBITDA during
the second and third quarters of 2014. SolarWorld Industries Th├╝ringen GmbH acquired production lines and started manufacturing there only towards the end of the first quarter of 2014. By the third
quarter, we were able to significantly increase capacity utilization, which led to a reduction in ramp-up
costs, compared with the second quarter of 2014.
The basic valuation assumptions and premises on which the impairment tests at the end of 2013 were
based had changed slightly by the cut-off date, September 30, 2014. All in all, however, they did not
lead to the recognition or reversal of impairments on property, plant and equipment.
тАВ back to content
19
Sol arWorld 2014тАВ тАвтАВ Interim group Management third quarterтАВ тАвтАВ Economic position
20
Consolidated earnings before interest and tax (EBIT) improved in the first three quarters of 2014 to
тВм 76.7 (Q1-Q3 2013: тАУтАЙ95.0) million and amounted to тВм тАУтАЙ4.2 (Q3 2013: тАУтАЙ36.0) million in the third quarter. Adjusted for the one-off effects mentioned above, groupwide EBIT came to тВм тАУтАЙ29.1 million in the
first nine months of 2014.
In the тАЬTradeтАЭ segment, EBIT rose to тВм тАУтАЙ11.4 (Q1-Q3 2013: тАУтАЙ50.0) million in the first nine months of
2014. We also significantly improved our operating result, compared with the previous year in the
тАЬProduction GermanyтАЭ and тАЬProduction U.S.тАЭ segments. In the тАЬProduction U.S.тАЭ segment, EBIT rose
to тВм тАУтАЙ12.5 (Q1-Q3 2013: тАУтАЙ28.8) million. In the тАЬProduction GermanyтАЭ segment, EBIT increased by
тВм 120.4 million, compared with the previous year to тВм 103.0 (Q1-Q3 2013: тАУтАЙ17.4) million. Adjusted for
the one-off effects mentioned above, EBIT in the тАЬProduction GermanyтАЭ segment totaled тВм тАУтАЙ2.8 million.
The groupwide financial result for the first three quarters of 2014 stood at тВм 519.5 (Q1-Q3 2013: тАУтАЙ54.9)
million. This includes the restructuring profit of тВм 555.7 million resulting from the financial restructuring.
After offsetting the existing tax loss carryforwards and taking into account the granted tax release,
SolarWorld AG does not need to pay taxes on income for this restructuring profit.
The groupтАЩs consolidated profit after taxes increased by тВм 624.2 million in the first nine months of 2014
to тВм 489.2 (Q1-Q3 2013: тАУтАЙ135.0) million.
Development of material income statement items
In the first nine months of 2014, the cost of materials increased by 52.5 percent to тВм 296.1 (Q1-Q3 2013:
194.2) million. This was mainly due to the significant manufacturing output growth year-on-year, especially taking into account the start of production in our new site in Arnstadt, Germany. As a result of
the output increase as well as further cost optimizations, the cost of materials ratio, however, fell to
69.1 (Q1-Q3 2013: 75.4) percent.
Personnel expenses rose by тВм 16.5 million in the first nine months of the year to тВм 102.1 (Q1-Q3 2013:
85.6) million. Here, the increase can be attributed to the takeover of about 750 employees due to the
ramp-up of our production site in Arnstadt, Germany. Because of the higher overall output personnel
cost ratio fell to 23.8 (Q1-Q3 2013: 33.3) percent.
Depreciation and amortization declined 4.3 percent or тВм 1.3 million to тВм 30.6 (Q1-Q3 2013: 31.9) million
in the first three quarters of 2014.
тАВ back to content
Sol arWorld 2014тАВ тАвтАВ Interim group Management third quarterтАВ тАвтАВ Economic position
Other operating expenses increased in the first nine months of 2014 by тВм 45.2 million to тВм 125.4 (Q1Q3 2013: 80.2) million. This is mainly due to impairment losses on prepayments and repayment claims
amounting to тВм 30.3 million following an agreement with a raw-material supplier. In addition, distribution expenses rose due to the higher shipment volume. Maintenance expenses and expenses for the
additional use of external personnel also contributed to the increase of other operating expenses. The
expense ratio in the first nine months of fiscal year 2014 was 29.2 (Q1-Q3 2013: 31.1) percent.
Compared with the same period of the previous year, other operating income increased by тВм 162.7 million to тВм 202.1 (Q1-Q3 2013: 39.4) million. This increase is attributable in particular to a provisional
profit resulting from the initial accounting for assets acquired from Bosch (тВм 136.1 million). Other operating income increased by тВм 16.8 million due to sales of excess raw materials. Corresponding expenses amounting to тВм 16.1 million are recorded as other operating expenses. Furthermore, positive earnings effects in an amount of тВм 18.3 million resulting from the termination of long-term supply contracts
with wafer customers were recorded.
Financial position
Financing analysis
As compared to December 31, 2013, equity increased substantially by тВм 507.1 million to тВм 264.0
(December 31, 2013: тАУтАЙ243.1) million. This is due primarily to the successful completion of the financial restructuring program and associated capital increase by contribution in kind. The equity ratio
improved to 27.9 percent as at the cut-off date.
The measures implemented as part of the financial restructuring enabled us to reduce our financial
liabilities to тВм 448.6 (December 31, 2013: 1,022.1) million as at September 30, 2014. As a result of
restructuring our financial liabilities, the large majority of our financial liabilities (87.1 percent) are
now once again classified as non-current (December 31, 2013: 52.5 percent) as at the cut-off date.
Investment grants and subsidies recognized in non-current liabilities decreased to тВм 28.5 (December
31, 2013: 31.1) million per end of the period. These public funds accrued on the liabilities side of the
balance sheet are reversed over the period of utilization of subsidized investments through profit or
loss.
тАВ back to content
21
Sol arWorld 2014тАВ тАвтАВ Interim group Management third quarterтАВ тАвтАВ Economic position
22
Non-current provisions increased in the first nine months of 2014 by тВм 3.4 million to тВм 32.8 (December
31, 2013: 29.4) million. This is mainly due to the significantly higher sales figures and associated increase in provisions for guarantees. Compared with December 31, 2013, other non-current liabilities
fell only marginally by тВм 0.1 million to тВм 0.2 million as at the cut-off date.
Investment analysis
In the first nine months of 2014, we invested a total of тВм 8.5 (Q1-Q3 2013: 19.8) million in intangible assets and property, plant, and equipment. About тВм 3.2 million was invested in the тАЬProduction GermanyтАЭ
segment at our German sites. In addition, тВм 1.9 million was invested in the тАЬTradeтАЭ segment and тВм 2.8
million in the тАЬOtherтАЭ segment. Furthermore, as part of an asset deal, we took over manufacturing facilities and other assets from Bosch Solar Energy AG with provisional calculated net fair values amounting to тВм 46.7 million. The acquisition increased SolarWorldтАЩs production capacities at the cell and
module manufacturing stages of the value chain.
Liquidity analysis
Cash flow from operating results was impacted negatively by production ramp-up costs of the subsidiary SolarWorld Industries Th├╝ringen GmbH and totaled тВм тАУтАЙ18.6 million in the first nine months.
In addition, the increased production and shipments volume led to a rise in working capital. Thus, cash
flow from operating activities totaled тВм тАУтАЙ45.5 (Q1-Q3 2013: 6.5) million in the first nine months of 2014.
Cash flow from investing activities amounted to тВм 62.1 (Q1-Q3 2013: тАУтАЙ21.6) million. This change is
mainly the result of cash receipts amounting to тВм 56.0 million, arising from the negative purchase
price agreed for taking over a large proportion of the manufacturing facilities of Bosch Solar Energy
AG. Furthermore, SolarWorld obtained тВм 8.3 million in investment grants. Additional cash receipts
resulted mainly from the disposal of fixed assets from the photovoltaic portfolio of Solarparc GmbH.
Investments of тВм 7.6 (Q1-Q3 2013: 22.0) million in fixed assets had a negative impact on cash flow.
In the first nine months of 2014, cash flow from financing activities amounted to тВм тАУтАЙ32.5 (Q1-Q3 2013:
тАУтАЙ44.0) million. This was particularly affected by financing measures relating to the financial restructuring program. After completion of its financial restructuring, SolarWorld redeemed financial liabilities amounting to тВм 61.2 million and paid interests and restructuring expenses totaling тВм 22.3 million.
SolarWorld also took out a loan of тВм 50.0 million from Qatar Solar Technologies Q.S.C. As at September 30, 2014, liquid funds stood at тВм 151.2 (December 31, 2013: 163.7) million.
тАВ back to content
Sol arWorld 2014тАВ тАвтАВ Interim group Management third quarterтАВ тАвтАВ Economic position
23
Assets position
Asset structure analysis
Compared with December 31, 2013, SolarWorld groupтАЩs total assets increased by тВм 14.6 million to
тВм 946.4 (December 31, 2013: 931.8) million, mainly due to the acquisition of the solar activities from
Bosch.
Non-current assets decreased by тВм 58.6 million to тВм 424.4 (December 31, 2013: 483.0) million. The
main reason for this development was the use of deferred tax assets from tax loss carryforwards in
2014. Particularly because of the acquisition of solar activities from Bosch, property, plant and equipment increased in the first quarter of 2014 to тВм 332.2 (December 31, 2013: 306.9) million. An opposing
effect resulted from the sale of assets from the photovoltaic portfolio of Solarparc GmbH in the third
quarter of 2014.
Inventories (excluding short-term advance payments made) increased as at the cut-off date, September┬а30, 2014, by тВм 38.7 million to тВм 140.9 (December 31, 2013: 102.2) million. At the same time, trade
receivables rose by тВм 39.6 million to тВм 88.5 (December 31, 2013: 48.9) million. All in all, working capital grew by тВм 43.6 million to тВм 177.2 (December 31, 2013: 133.6) million. As at the cut-off date, assets
held for sale totaled тВм 34.6 (December 31, 2013: 7.0) million. The increase by тВм 27.6 million resulted
almost entirely from the acquisition of production facilities and other assets of Bosch Solar Energy AG.
Off balance sheet financial instruments
Off balance sheet financial instruments have no impact on the groupтАЩs asset position.
Assets not shown in the balance sheet
The group had no assets that are not shown in the balance sheet as at September 30, 2013.
тАВ back to content
Sol arWorld 2014тАВ тАвтАВ Interim group Management third quarterтАВ тАвтАВ Material rel ated-part y tr ansac tions
24
Employees
At the end of the third quarter of 2014, a total of 3,409 people worked for the SolarWorld group,
including temporary workers. The groupwide number of full-time employees (i.тАЙe. not including temporary workers) increased by around 31.3 percent, compared with the previous year, to 2,751 (September┬а30, 2013: 2,095). This increase is due principally to the integration of the Arnstadt site, with
around 750 employees, in March 2014. In the United States, however, the number of employees fell
due to restructuring measures in wafer production in 2013, and the integration of sales and production
at the Hillsboro site. Concerning personnel development and HR strategy at SolarWorld, please see
the
07
┬а2013 Annual Group Report/EmployeesтАЙтАвтАЙp.тАЙ066тАЙ//.
Full-time group employees as at September 30 // number of people
2014
2013
Change
2,174*
1,446**
+тАЙ728
552
627
тАУтАЙ75
RoW
25
22
+тАЙ3
Total
2,751
2,095
+тАЙ656
Germany
United States
* incl. 43 trainees
**incl. 50 trainees
Material related-party
transactions
SolarWorld took out a new loan (Super Senior Facility Agreement or short SSFA) from Qatar Solar
Technologies Q.S.C. in the amount of тВм┬а50 million on February 25, 2014. On this loan, interest expenses in an amount of тВм 1.8 million incurred in the first nine months of the year that had been paid in
full at the balance sheet date.
Apart from this transaction and the transactions based on existing long-term agreements (property
leasing and management of solar parks), there were no related-party transactions with a material
effect on the net assets, financial position and result of operations of SolarWorld group in the first
nine months.
тАВ back to content
Sol arWorld 2014тАВ тАвтАВ Interim group Management third quarterтАВ тАвтАВ Supplementary report
Supplementary report
25
Disclosure of events of particular importance
and their repercussions
On October 1, 2014, our U.S. group subsidiary SolarWorld Americas LLC was merged with SolarWorld Industries America Inc. The company was subsequently renamed SolarWorld Americas
Inc., since the name SolarWorld Americas is popular with customers in the United States. Sales,
production and administration at the Hillsboro, U.S. site have been pooled under joint management
since the fourth quarter of 2013. The restructuring of activities in the U.S. was continued in 2014 and
now, after one year, it is complete under company law as well.
Overall statement by the Management Board
on the economic position at the time of the report
The management of SolarWorld AG rates the economic position of the group as difficult. This assessment is based on the earnings, financial and asset position resulting from the consolidated financial
statements for 2013 and the financial statements for the third quarter of 2014 as outlined above, and
ongoing business trends in 2014 at the time of drawing up this interim management report. Although
the financial restructuring of SolarWorld AG was completed on February 24, 2014, the group is in a
challenging position because consolidation in the solar industry is still ongoing and, moreover, the
possibility of difficulties affecting the implementation of the planned operational restructuring measures cannot be ruled out.
тАВ back to content
Sol arWorld 2014тАВ тАвтАВ Interim group Management third quarterтАВ тАвтАВ Opportunities and risks
26
Opportunities and risks
The risk situation for the group did not substantially change during the first nine months of 2014.
Regarding individual risks, we therefore refer to the
┬а2013 Annual Group Report/Risk reportтАЙтАвтАЙp.тАЙ087
et seqq.тАЙ//
The Management Board of SolarWorld AG still considers that the group is exposed to a high level of
risk тАУ particularly because of high competitive pressure, the possibility of worsening regulatory conditions in the solar market, and strong price and cost-cutting pressure. Moreover, failure to meet the
business planning objectives underlying the restructuring program and/or difficulties with implementing the operational restructuring measures could have a negative impact on the financial position of
the SolarWorld group.
Procurement risks were reduced during the first half of 2014. In this regard, the SolarWorld group
reached an agreement with two of three major suppliers concerning long-term raw material supply
contracts.
┬аConsolidated Interim Report First Half-Year 2014/Opportunities and risksтАЙтАвтАЙp.тАЙ28тАЙ//
The companyтАЩs survival is not in jeopardy at the time of producing this report.
Forecast report
Expected macroeconomic environment
The Institute for the World Economy (If W) in Kiel, Germany predicts that growth in global economic
output during 2014 and 2015 will emanate mainly from the advanced economies. If W expects the
global economy to strengthen over the coming year, though the level of activity is likely to remain
moderate initially. The world economy is still susceptible to disruption, If W reports, whether as a result of geopolitical events or turbulence on the financial markets. In the United States тАУ our largest
single market тАУ If W anticipates a further significant increase in manufacturing output. The Eurozone тАУ
тАВ back to content
Sol arWorld 2014тАВ тАвтАВ Interim group Management third quarterтАВ тАвтАВ Forec a st report
also of key importance to us тАУ is forecast to shake off stagnation. In contrast, growth in the emerging
economies тАУ which currently still play only a minor role for SolarWorld тАУ will continue to be subdued,
according to If W.
Compared with its June forecast, If W has lowered its expectations for 2014 as a whole by 0.4 and for
2015 by 0.3 percentage points. If W notes that even these expectations could yet prove too optimistic,
especially if geopolitical tensions worsen.
08
Economic development of our main sales markets* // in percent
Source: Institute for the World Economy (If W), September 2014
2013
2014тАЙe
2015тАЙe
Germany
0.1
1.4
1.9
United States
2.2
2.0
3.0
тАУтАЙ0.4
0.7
1.3
3.2
3.2
3.7
Eurozone
World
* measured according to gross domestic product
Expected development of the solar power market
Analysts expect that between 45 and 50┬аGW of solar power capacity will be installed globally in 2014.
The strongest growth will come from the United States, Japan, the United Kingdom and China. The
positive trend looks likely to continue in 2015.
For the U.S. market, GTM Research predicts growth of 37 percent to 6.5┬аGW for 2014. Demand is set to
increase by an additional 42 percent to 9.2┬аGW in 2015. European markets should also grow, albeit on
a more moderate scale. Market analysts anticipate a market volume of around 10┬аGW for 2015. Around
60 percent of European demand will be attributable to the British, German and French markets.
In Asia, Japan and China will continue to be the main drivers of the high market volume. GTM Research expects Japanese demand to reach 7┬аGW in each of 2014 and 2015. In 2014, the Chinese market will not grow as strongly as originally thought. Analysts anticipate that the target of 13┬аGW will
not be reached. Since the Chinese market is closed to foreign companies, however, these developments
do not directly affect business for SolarWorld AG.
тАВ back to content
27
Sol arWorld 2014тАВ тАвтАВ Interim group Management third quarterтАВ тАвтАВ Forec a st report
28
Future development of business
SolarWorld AG had high levels of incoming orders in the third quarter 2014 that will have an impact
on our business up to 2015 as well. Next year, too, we want to profit from growth in the solar markets
and achieve another significant increase in our shipments. The United States will account for a larger
share. We also want to grow in Japan and a number of European solar markets such as the United Kingdom and Germany.
Our strategic goal is to do more to convince customers of the benefits of our range of complete solar
systems, because in this segment we can more clearly differentiate ourselves from the competition
and offer our customers a higher value. Therefore, in our product portfolio, we will be placing special
emphasis on product innovations such as the SunPac LiOn storage system. We see solutions for storing solar power and managing consumption as being a future driver of our systems business.
In production, we have made it our goal to further harmonize processes across and between sites,
realizing cost-cutting potential. Closer integration of the Arnstadt production lines into the groupтАЩs
value chain is a high priority here.
09
Year-end Production capacities // in MW
Wafer
Cell
Germany (Freiberg)
750
330
650
Germany (Arnstadt)
тАУ
700
200
(250)*
330 (170)*
380
750
1,360
1,230
U.S. (Hillsboro)
Total
Module
* available, non-utilized production capacities
Owing to high demand, we will step up production capacities in the United States. In module production, we will increase capacities from 380 MW to 530 MW. This is the first step to the future expansion
to 630 MW. In our U.S. cell facilities, we will raise production capacities of PERC high power cells by
another 100 MW.
Furthermore, the SolarWorld group will implement additional measures to consolidate its group
structure by the end of 2014. It aims to streamline its organizational structure under company law,
primarily to save costs.
тАВ back to content
Sol arWorld 2014тАВ тАвтАВ Interim group Management third quarterтАВ тАвтАВ Forec a st report
29
Expected development of revenue and profit or loss
SolarWorld AG confirms its statements concerning the expected development of revenue and profit
or loss in the
┬аConsolidated Interim Report First Half-Year 2014/Expected development of revenue and
profit or lossтАЙтАвтАЙp.тАЙ32тАЙ//.
Expected financial position
Scheduled financing measures
Having completed its financial restructuring on February 24, 2014, and after taking out a loan of
тВм┬а50┬аmillion in the first quarter of 2014, SolarWorld AG is not planning any major financing measures for the remainder of 2014.
Planned investments
In the 2014 financial year, we are expecting to make investments totaling a low two-digit million euro
amount. Our investment activities will focus on further efficiency increases in production to achieve
further cost savings.
Expected liquidity development
On September 30, 2014, the groupтАЩs liquid funds totaled тВм┬а151.2 (December 31, 2013: 163.7) million.
Expected liquidity development is influenced to a large degree by operating results, planned interest
payments and potential short-term fluctuations in our working capital.
тАВ back to content
Sol arWorld 2014тАВ тАвтАВ Interim group Management third quarterтАВ тАвтАВ Forec a st report
30
Overall statement by the Management Board
on the expected development of the group
Following the successful completion of financial restructuring in the first quarter of 2014, SolarWorld
focused its energies on the operating business with a view to further enhancing its competitiveness and
ability to act.
SolarWorld has clearly positioned itself with its REAL VALUE brand identity in the intensely competitive international market environment. Thus the group has benefited from growth in the solar markets,
achieving a significantly greater-than-expected increase in shipments.
SolarWorld AG is therefore better positioned to increase shipments and revenue significantly over the
next few years and improve operating results as planned. It is targeting a swift return to profitability.
To achieve profitability, it is necessary to optimize processes in the group and cut costs further. Many
operational restructuring measures are already taking effect. Our top priorities include integrating
the former Bosch site at Arnstadt into the groupтАЩs own value chain and further harmonizing production
across and between locations.
тАВ back to content
Consolidated Interim Financial
Statements third quarter 2014
тАЖ33тАЖ
C onsolidated
income statement
First to Third quarter 2014
тАЖ34тАЖ
C onsolidated
income statement
third quarter 2014
тАЖ35тАЖ
S tatement
of consolidated comprehensive income
First to Third quarter 2014
тАЖ36тАЖ
S tatement
of consolidated comprehensive income
third quarter 2014
тАЖ37тАЖ
C onsolidated
balance sheet
as at September 30, 2014
тАЖ38тАЖ
C onsolidated
statement of changes in equity
first to third quarter 2014
тАЖ39тАЖ
C onsolidated
cash flow statement
First to Third quarter 2014
тАЖ40тАЖNOTES
40тАЖ
ON THE CONSOLIDATED INTERIM FINANCIAL STATEMENTS
49тАЖ
1. Accounting according to International Financial Reporting Standards (IFRS)
2. Accounting and valuation methods
3. Group of consolidated companies
4. Other
5. Material events subsequent to the end of the interim period
6. Segment reporting
тАЖ50тАЖ
Financial and event calendar
40тАЖ
41тАЖ
45тАЖ
48тАЖ
Sol arWorld 2014тАВ тАвтАВ Consolidated Interim Financial Statements Third Quarter
10
33
Consolidated income statement First to Third quarter 2014 // in kтВм
1stтАЙтАУтАЙ3rd quarter 2014
1. Revenue
2. Change in inventories of finished goods and work in progress
1stтАЙтАУтАЙ3rd quarter 2013
408,918
345,624
19,065
тАУтАЙ88,599
809
508
202,097
39,391
5. Cost of materials
тАУтАЙ296,092
тАУтАЙ194,193
6. Personnel expenses
тАУтАЙ102,089
тАУтАЙ85,634
тАУтАЙ30,553
тАУтАЙ31,914
3. Own work capitalized
4. Other operating income
7. Depreciation and amortization
8. Other operating expenses
9. Operating result
тАУтАЙ125,410
тАУтАЙ80,163
76,745
тАУтАЙ94,980
10. Financial result
519,483
тАУтАЙ54,884
11. Result before taxes on income
596,228
тАУтАЙ149,864
12. Taxes on income
13. Consolidated net result
Of which attributable to shareholders of SolarWorld AG
тАУтАЙ107,010
14,869
489,218
тАУтАЙ134,995
489,218
тАУтАЙ134,995
14. Earnings per share
a) Weighted average number of shares outstanding (in 1,000)
b) Consolidated net result (in тВм)
12,084
739
40.49
тАУтАЙ182.76
тАВ back to content
Sol arWorld 2014тАВ тАвтАВ Consolidated Interim Financial Statements Third Quarter
34
11
Consolidated income statement third quarter 2014 // in kтВм
3rd quarter 2014
1. Revenue
2. Change in inventories of finished goods and work in progress
3. Own work capitalized
4. Other operating income
5. Cost of materials
6. Personnel expenses
3rd quarter 2013
180,823
144,455
тАУтАЙ7,664
тАУтАЙ43,132
141
436
20,899
9,017
тАУтАЙ120,113
тАУтАЙ78,925
тАУтАЙ34,695
тАУтАЙ27,588
7. Depreciation and amortization
тАУтАЙ10,410
тАУтАЙ10,186
8. Other operating expenses
тАУтАЙ33,164
тАУтАЙ30,028
тАУтАЙ4,183
тАУтАЙ35,951
тАУтАЙ7,718
тАУтАЙ19,614
тАУтАЙ11,901
тАУтАЙ55,564
9. Operating result
10. Financial result
11. Result before taxes on income
12. Taxes on income
13. Consolidated net result
Of which attributable to shareholders of SolarWorld AG
3,247
тАУтАЙ8,069
тАУтАЙ8,654
тАУтАЙ63,634
тАУтАЙ8,654
тАУтАЙ63,634
14. Earnings per share
a) Weighted average number of shares outstanding (in 1,000)
b) Consolidated net result (in тВм)
14,896
739
тАУтАЙ0.58
тАУтАЙ86.15
тАВ back to content
Sol arWorld 2014тАВ тАвтАВ Consolidated Interim Financial Statements Third Quarter
12
35
Statement of consolidated comprehensive income First to Third quarter 2014 // in kтВм
1stтАЙтАУтАЙ3rd quarter 2014
1stтАЙтАУтАЙ3rd quarter 2013
489,218
тАУтАЙ134,995
0
0
Exchange differences from currency translations
10,967
тАУтАЙ1,504
Deferred taxes relating to exchange differences
on translating foreign operations
Consolidated net result
Items not to be reclassified to profit or loss
Exchange differences from currency translations
тАУтАЙ6,865
тАУтАЙ141
Exchange differences from currency translations, net of tax
4,102
тАУтАЙ1,645
Items that may be reclassified subsequently to profit
4,102
тАУтАЙ1,645
4,102
тАУтАЙ1,645
- Other comprehensive result before tax
10,967
тАУтАЙ1,504
- Deferred taxes relating to other comprehensive result
тАУтАЙ6,865
тАУтАЙ141
Other comprehensive net result
Total comprehensive result
Of which attributable to shareholders of SolarWorld AG
493,320
тАУтАЙ136,640
493,320
тАУтАЙ136,640
тАВ back to content
Sol arWorld 2014тАВ тАвтАВ Consolidated Interim Financial Statements Third Quarter
36
13
Statement of consolidated comprehensive income third quarter 2014 // in kтВм
Consolidated net result
Items not to be reclassified to profit or loss
3rd quarter 2014
3rd quarter 2013
тАУтАЙ8,654
тАУтАЙ63,634
0
0
8,100
тАУтАЙ4,388
Exchange differences from currency translations
Exchange differences from currency translations
Deferred taxes relating to exchange differences
on translating foreign operations
тАУтАЙ4,637
1,414
Exchange differences from currency translations, net of tax
3,463
тАУтАЙ2,974
Items that may be reclassified subsequently to profit
3,463
тАУтАЙ2,974
Other comprehensive net result
3,463
тАУтАЙ2,974
8,100
тАУтАЙ4,388
тАУтАЙ4,637
1,414
- Other comprehensive result before tax
- Deferred taxes relating to other comprehensive result
Total comprehensive result
Of which attributable to shareholders of SolarWorld AG
тАУтАЙ5,191
тАУтАЙ66,608
тАУтАЙ5,191
тАУтАЙ66,608
тАВ back to content
Sol arWorld 2014тАВ тАвтАВ Consolidated Interim Financial Statements Third Quarter
14
37
Consolidated balance sheet as at September 30, 2014 // in kтВм
ASSETS
30.09.2014
31.12.2013
A. Non-current assets
424,402
483,003
I. Intangible assets
10,540
8,425
332,155
306,866
III.Investment property
14,873
15,106
IV.Investments measured at equity
13,556
18,891
V. Other financial assets
24,248
360
VI. Other non-current assets
25,455
11,977
3,575
121,378
II. Property, plant and equipment
VII.Deferred tax assets
B. Current assets
I.Inventories
II. Trade receivables
III.Current income tax assets
IV.Other receivables and assets
V. Other financial assets
VI.Liquid funds
C. Assets held for sale
EQUITY AND LIABILITIES
A. Equity
I.Equity attributable to shareholders of SolarWorld AG
487,445
441,800
162,886
119,151
88,528
48,859
658
1,353
21,367
25,234
62,819
83,541
151,187
163,662
34,555
7,032
946,402
931,835
30.09.2014
31.12.2013
263,959
тАУтАЙ243,084
263,959
тАУтАЙ243,084
14,896
110,795
1. Subscribed capital
2. Capital reserve
158
68
3. Other reserves
11,471
7,369
4. Accumulated results
B. Non-current liabilities
I. Non-current financial liabilities
237,435
тАУтАЙ361,317
507,666
600,023
390,923
536,629
II. Accrued investment grants
28,470
31,105
III.Non-current provisions
32,805
29,414
IV.Other non-current liabilities
V. Deferred tax liabilities
195
302
55,273
2,573
174,776
574,896
I. Current financial liabilities
57,719
485,508
II. Trade payables
52,220
17,456
III.Income tax liabilities
2,304
6,345
IV.Current provisions
8,736
9,987
53,797
55,601
946,402
931,835
C. Current liabilities
V. Other current liabilities
тАВ back to content
Sol arWorld 2014тАВ тАвтАВ Consolidated Interim Financial Statements Third Quarter
38
15
Consolidated statement of changes in equity first to third quarter 2014 // in kтВм
Other reserves
As at Jan. 01, 2013
Subscribed
capital
Capital
reserve
Currency
translation
reserve
110,795
296,562
11,176
Allocation to revenue
reserves
Capital reduction
Capital increase by
┬нcontribution in kind
Disposal of treasury shares
68
тАУтАЙ429,504
тАУтАЙ11,409
296,494
110,795
68
тАУтАЙ134,995
тАУтАЙ136,640
9,531
тАУтАЙ438
тАУтАЙ268,005
тАУтАЙ148,049
тАУтАЙ1,534
тАУтАЙ190
тАУтАЙ93,312
тАУтАЙ95,036
7,997
тАУтАЙ628
тАУтАЙ361,317
тАУтАЙ243,084
тАУтАЙ110,057
110,057
14,151
6
90
14,896
158
Total comprehensive result
1stтАЙтАУтАЙ3rd quarter 2014
As at September 30, 2014
Total
тАУтАЙ438
тАУтАЙ1,645
110,795
Total comprehensive result
4th quarter 2013
As at Dec. 31, 2013
Accumulated
results
тАУтАЙ296,494
Total comprehensive result
1stтАЙтАУтАЙ3rd quarter 2013
As at September 30, 2013
IAS 19
reserve
4,102
12,099
тАУтАЙ628
тАУтАЙ605
13,546
81
177
489,218
493,320
237,435
263,959
тАВ back to content
Sol arWorld 2014тАВ тАвтАВ Consolidated Interim Financial Statements Third Quarter
16
39
Consolidated cash flow statement First to Third quarter 2014 // in kтВм
Result before tax
1stтАЙтАУтАЙ3rd quarter 2014
1stтАЙтАУтАЙ3rd quarter 2013
596,228
тАУтАЙ149,864
+
Depreciation and amortization
30,553
31,914
+
Financial result
(excluding profits and losses from currency translation)
38,484
54,321
тАУ
Profit from disposal of assets
тАУтАЙ1,340
тАУтАЙ604
тАУ
Reversal of accrued investment grants
тАУтАЙ3,602
тАУтАЙ4,981
тАУ
Gain from initial purchase accounting
тАУтАЙ136,124
0
тАУ
Other material non-cash income
тАУтАЙ542,832
тАУтАЙ2,996
=
Cash flow from operating result
тАУтАЙ18,633
тАУтАЙ72,210
+
Changes in prepayments and customer advances
15,058
2,222
тАУ/+ Increase/decrease in inventories
тАУтАЙ35,613
100,225
тАУ
тАУтАЙ40,065
тАУтАЙ7,151
33,889
тАУтАЙ9,090
Increase in trade receivables
+/тАУ Increase/decrease in trade liabilities
+/тАУ Development other net assets
=
Cash flow from operating result and changes in net assets
3,951
тАУтАЙ560
тАУтАЙ41,413
13,437
333
219
тАУтАЙ4,374
тАУтАЙ7,117
+
Interest received
тАУ
Taxes on income paid
=
Cash flow from operating activities
тАУ
Cash payments for investments in fixed assets
+
Cash receipt investment grants
+
Cash receipts from the disposal of fixed assets
+
Cash receipts from negative purchase price
56,000
0
=
Cash flow from investing activities
62,112
тАУтАЙ21,564
+
Cash receipts from borrowings
51,692
0
тАУ
Cash payments from the repayment of loans
тАУтАЙ61,246
тАУтАЙ1,561
тАУ
Interest and restructuring expenses paid
тАУтАЙ22,253
тАУтАЙ42,475
тАУ
Cash payments for equity measures
тАУтАЙ862
0
+
Cash receipts from the disposal of treasury shares
=
тАУ
тАУтАЙ45,454
6,539
тАУтАЙ7,649
тАУтАЙ22,042
8,288
181
5,473
297
177
0
Cash flow from financing activities
тАУтАЙ32,492
тАУтАЙ44,036
Net changes in cash and cash equivalents
тАУтАЙ15,834
тАУтАЙ59,061
+/тАУ Currency and consolidation-related change of cash and
cash equivalents
3,359
тАУтАЙ1,231
+
Cash and cash equivalents at the beginning of the period
163,662
224,109
=
Cash and cash equivalents at the end of the period
151,187
163,817
тАВ back to content
Sol arWorld 2014тАВ тАвтАВ Consolidated Interim Financial Statements Third QuarterтАВ тАвтАВ NOTES
40
NOTES ON THE CONSOLIDATED INTERIM FINANCIAL STATEMENTS
1. Accounting according to International Financial Reporting Standards (IFRS)
Pursuant to article 4 of the Regulation (EC) No. 1606/2002 of the European Parliament and of the
Council of July 19, 2002, on the application of international accounting standards, SolarWorld AG is
obliged to apply the international accounting standards adopted in accordance with articles 2, 3 and
6 of said regulation. These interim financial statements as per September 30, 2014, have accordingly
also been prepared in accordance with IAS 34. These condensed consolidated interim financial statements have not been subject to a review or audit by an auditor.
2. Accounting and valuation methods
In preparing the interim financial statements and establishing the comparative figures for the previous
year, basically the same consolidation principles and accounting and valuation methods as in the 2013
consolidated financial statements have been applied. A detailed description of these methods has been
published in the notes to the 2013 annual report, which can be reviewed and downloaded from the internet at
┬аwww.solarworld.de/financial-reportsтАЙ//.
Accounting pronouncements that became applicable in the 2014 period do not have noteworthy influence on the presentation of the financial position and financial performance of the SolarWorld group.
A detailed presentation of these accounting pronouncements is provided in the notes to the consolidated financial statements 2013 as well.
Estimations and assumptions
In connection with the preparation of the consolidated interim financial statements, management has
to apply estimations and assumptions. These affect the amounts recognized for assets, liabilities and
contingent liabilities as at the balance sheet date as well as the recognized amounts of income and
expenses of the reporting period then ended. Actual amounts may deviate from these estimations.
The substantial discretionary decisions, estimations and assumptions made in preparing the con┬н
solidated interim financial statements remain, in principle, unchanged from those used in preparing
the consolidated financial statements 2013. In addition, estimations regarding the determination of
тАВ back to content
Sol arWorld 2014тАВ тАвтАВ Consolidated Interim Financial Statements Third QuarterтАВ тАвтАВ NOTES
the preliminary initial purchase accounting were made. To determine the fair values of the assets
acquired in a first step, the carrying amounts were in principle assessed due to the fact that the
respective assets had already been impaired on their net realizable values by the seller. Deviating
from this in particular for the assets held for sale realizable market values have been determined
based on already existing appraisals or purchase price negotiations.
Income taxes
The income tax expense of the interim financial statements is mainly calculated on the basis of the
actual tax rates of the respective group companies while considering the effects of material tax-neutral
expenses and income. In addition, deferred tax assets that were set up for tax loss carryforwards existing in the fiscal unity of SolarWorld AG were utilized and charged to expenses due to the restructuring profit incurred. For the taxable restructuring profit remaining after the utilization of existing loss
carryforwards, a tax release has been issued. No deferred taxes on new loss carryforwards of SolarWorld AG as well as on loss carryforwards of the U.S. subsidiaries were capitalized as at September┬а30,
2014.
3. Group of consolidated companies
The group of consolidated companies consists of the subsidiaries, which can be found in the following
graphic.
17
┬аSolarWorld group structure as at September 30, 2014тАЙтАвтАЙp.тАЙ42тАЙet seq.тАЙ//
Effective per June 23, 2014, Deutsche Solar GmbH was renamed SolarWorld Industries Sachsen
GmbH.
Effective per June 24, 2014, Bonn-based corporation Solarparc was transformed into a limited liability
company.
With contract under the law of obligation dated September 22, 2014, Solarparc Projekt IV GmbH &
Co. KG was sold to a third party investor. The entity was deconsolidated in the reporting period, which
made for revenue of kтВм 2,891.
With contract under the law of obligation dated September 25, 2014, Solarparc GmbHтАЩs photovoltaic
portfolio was sold to a third party investor. Upon selling the photovoltaic portfolio, the investments
in the following 18 companies were also sold: Solarparc Nr.1 GmbH to Solarparc Nr.17 GmbH and
Solarparc GbR. The entities were deconsolidated in the reporting period.
SolarWorld Schalke GmbH remains in liquidation.
тАВ back to content
41
SolarWorld 2014
Group structure
42
17
SolarWorld group structure as at September 30, 2014
SolarWorld AG
// Bonn, Germany
100тАЙ%
SolarWorld Industries Sachsen GmbH // Freiberg, Germany
100тАЙ%
Go!Sun GmbH & Co. KG // Bonn, Germany
100тАЙ%
Solarparc Verwaltungs GmbH // Freiberg, Germany
100тАЙ%
Solarparc Ziegelscheune GmbH & Co. KG // Freiberg, Germany
100тАЙ%
SolarWorld Innovations GmbH // Freiberg, Germany
100тАЙ%
SolarWorld Solicium GmbH // Freiberg, Germany
100тАЙ%
SolarWorld Czech s.r.o. // Teplice, Czech Republic
100тАЙ%
SolarWorld Industries America Inc. // Hillsboro, U.S.
100тАЙ%
SolarWorld Industries Deutschland GmbH // Bonn, Germany
1тАЙ%
99тАЙ%
SolarWorld Industries America LP // Camarillo, U.S.
21.26тАЙ%
78.74тАЙ%
SolarWorld Industries Services LLC // Camarillo, U.S.
100тАЙ%
SolarWorld Americas LLC // Camarillo, U.S.
100тАЙ%
SolarWorld Industries Americas LLC // Camarillo, U.S.
100тАЙ%
SolarWorld Asia Pacific PTE Ltd. // Singapore, Singapore
100тАЙ%
SolarWorld Ib├йrica S.L. // Madrid, Spain
100тАЙ%
SolarWorld France SAS // Grenoble, France
100тАЙ%
SolarWorld Africa (Pty.) Ltd. // Cape Town, South Africa
100тАЙ%
Solarparc GmbH // Bonn, Germany*
100тАЙ%
Solarparc Rubin Verwaltungs GmbH┬а// Bonn, Germany
100тАЙ%
SolarWorld Industries Th├╝ringen GmbH┬а// Bonn, Germany
49тАЙ%
SolarWorld AG & Solar Holding GmbH in GbR Auerm├╝hle // Bonn, Germany
29тАЙ%
Qatar Solar Technologies Q.S.C. // Doha, Qatar**
* Structure of the subgroup on next page
**Consolidated at equity
тАВ back to content
SolarWorld 2014
Group structure
18
43
Solarparc Sub-Group structure as at September 30, 2014
Solarparc GmbH
// Bonn, Germany
100тАЙ%
Solarparc Project V GmbH & Co. KG┬а// Bonn, Germany
100тАЙ%
Solarparc Donau I GmbH┬а// Bonn, Germany
100тАЙ%
Solarparc Donau II GmbH┬а// Bonn, Germany
100тАЙ%
Go!Sun Verwaltungs GmbH┬а// Bonn, Germany
100тАЙ%
Solarparc Deutschland I GmbH┬а// Bonn, Germany
100тАЙ%
Solarparc Diamant Verwaltungs GmbH┬а// Bonn, Germany
100тАЙ%
Solarparc Brillant GmbH┬а// Bonn, Germany
тАВ back to content
Sol arWorld 2014тАВ тАвтАВ Consolidated Interim Financial Statements Third QuarterтАВ тАвтАВ NOTES
44
Production lines of Bosch Solar Energy AG taken over
On March 12, 2014, as planned, SolarWorld Industries Th├╝ringen GmbH, a wholly owned sub┬н
sidiary of SolarWorld AG, Bonn, acquired a large part of the production lines and other assets from
Bosch Solar Energy AG in Arnstadt, Germany.
The acquisition increases production capacities at the cell and module stages of the value chain and
strengthens the groupтАЩs technological basis.
The initial accounting for the business combination is still incomplete at the time of the publication of
these interim financial statements, especially with respect to the purchase price allocation. This is due
to the comprehensive information-processing, which has already been started, however, could not be
finalized yet. Thus, SolarWorld AG makes use of the facilitation of IFRS 3.45. This mainly concerns
the measurement of the net assets at fair value as well as the resulting gain from a bargain purchase
(тАЬbadwillтАЭ).
The purchase price for the manufacturing facilities and other assets payable by SolarWorld AG
amounted to тВм 3.00. In addition, a payment of тВм 120.0 million payable by Bosch to SolarWorld AG
was agreed (тАЬnegative purchase priceтАЭ).
The purchase price was due at closing date. The negative purchase price is subject to a payment plan
with a term until March 2018.
Material transactions which would have to be disclosed separately from the business combination
according to IFRS 3.51 have not happened.
The preliminary determination of the fair value of the net assets at acquisition date and the resulting
gain from a bargain purchase (тАЬbadwillтАЭ) in the amount of kтВм 136,124 is as follows:
тАВ back to content
Sol arWorld 2014тАВ тАвтАВ Consolidated Interim Financial Statements Third QuarterтАВ тАвтАВ NOTES
in kтВм
Intangible assets
895
Property, plant and equipment
45,824
Current assets
35,014
- Inventories
- Other financial assets
- Assets held for sale
Total assets
Deferred tax liabilities
3,092
2,407
29,515
81,733
тАУтАЙ59,823
Non-current pension provision
Current provisions
Other current liabilities
Total liabilities
Identifiable net assets at fair value
тАУтАЙ431
тАУтАЙ3,500
тАУтАЙ1,855
тАУтАЙ65,609
16,124
Purchase price
0
Negative purchase price
120,000
Preliminary gain from a bargain purchase
136,124
The resulting gain is recognized and disclosed in other operating income.
For purposes of the segment reporting, SolarWorld Industries Th├╝ringen GmbH has been attributed to the operating segment тАЬProduction GermanyтАЭ. In the reporting period, SolarWorld Industries Th├╝ringen GmbH has generated external revenues in an amount of kтВм 20 and has made a profit
of тВм 122.1 million, including the above-disclosed preliminary badwill. If the acquisition had taken
place at the beginning of the reporting period, it would have had no effect to the above-mentioned
amounts, as the manufacturing facilities were restarted only at the acquisition date.
4. Other
Contingent liabilities
Our subsidiary SolarWorld Industries Sachsen GmbH (formerly Deutsche Solar GmbH) is currently the defendant in a court proceeding with a silicon supplier. The subject of the court proceeding
is the non-acceptance of silicon from long-term silicon contracts concluded with this silicon supplier.
Due to the non-acceptance, the silicon supplier claims a total of USD 676 million on the basis of a тАЬtake
or payтАЭ obligation and in damages. On the basis of external legal opinions, the company believes that
the silicon contracts in question violate European antitrust law, which could mean that the ┬нpurchase
тАВ back to content
45
Sol arWorld 2014тАВ тАвтАВ Consolidated Interim Financial Statements Third QuarterтАВ тАвтАВ NOTES
46
obligation as well as the contracts per se might be null and void. At this point in time, the outcome of
the proceedings cannot be estimated. Depending on the outcome, however, it is possible that SolarWorld Industries Sachsen GmbH might be liable for damages up to the claimed amount.
A first-instance ruling of the Munich I District Court states that a brand of SolarWorld AG infringes
trademark rights and that SolarWorld AG must compensate the plaintiff for any loss that resulted or
results from the utilization of a sign for photovoltaic systems. SolarWorld AG appealed this judgment. The appeal proceeding is still ongoing. A decision will probably be reached next year. So far, no
loss is quantified and an actual claim for damages is not pending. A reliable estimation for any potential outflow of resources on the basis of these facts and circumstances can thus not be made.
Impairment tests
The basic valuation assumptions and premises on which the impairment tests at the end of 2013 were
based had changed slightly by the cut-off date, September 30, 2014. All in all, they did not lead to the
recognition or reversal of impairments on property, plant and equipment.
Comments on the cash flow statement
In addition to the repayment of financial liabilities that can be taken from the cash flow, the sale of
Solarparc GmbHтАЩs photovoltaic portfolio reduced the financial liabilities by тВм 1.0 million while the
deconsolidation of Solarparc Projekt IV GmbH & Co. KG further reduced it by тВм 1.7 million. These
are non-cash transactions, as each purchaser assumed the corresponding liability.
Implementation of capital measures
On January 13, 2014, the Cologne Higher Regional Court approved applications for summary judgments, which SolarWorld AG filed in October 2013. As a result, it was possible to implement the
noteholdersтАЩ and shareholdersтАЩ resolutions that were adopted in August 2013. Furthermore, in January
2014, all creditor groups and noteholder representatives as well as the new investor Qatar Solar S.P.C.
signed the final restructuring agreement. On January 20, 2014, the capital reduction in the ratio of
150:1 was entered in the commercial register. On January 27, 2014, the German Federal Financial Supervisory Authority (BaFin) approved the prospectuses for the new shares and bonds that were issued
as part of the financial restructuring program. On February 24, 2014, the implementation of the capital increase by contribution in kind for SolarWorld AG was entered in the commercial register of the
Local Court of Bonn. As a result, the financial liabilities of SolarWorld AG were reduced from around
тВм 1 billion by тВм 570 million to тВм 427 million and the financial restructuring, which began in January
2013 was completed. The resulting restructuring profit of тВм 555.7 million is recognized and disclosed
in financial result.
тАВ back to content
Sol arWorld 2014тАВ тАвтАВ Consolidated Interim Financial Statements Third QuarterтАВ тАвтАВ NOTES
The capital increase by contribution in kind increased the share capital of SolarWorld AG from
тВм 744,800.00 by тВм 14,151,200.00 to тВм 14,896,000.00. The share capital of SolarWorld AG is now
divided into 14,896,000 no-par value shares to which a pro-rata amount of the share capital of
тВм 1.00 per share is attributed.
Treasury shares
In May 2014, SolarWorld AG sold 6,164 treasury shares in total for an amount of kтВм 177. Thus, no
treasury shares were held by the company at balance sheet date. The effects from this disposal on the
individual items in equity are shown in the consolidated statement of changes in equity.
Weighted average number of shares outstanding
The simplified capital reduction in the first quarter 2014 resulted in a reduced number of shares in the
ratio of 150:1; previous yearsтАЩ figures of the weighted average number of shares outstanding and of
earnings per share have been adjusted in accordance with IAS 33.64 accordingly.
Authorized capital
SolarWorld AGтАЩs first Annual General Meeting since the completion of financial restructuring was
held on May 30, 2014. At the meeting, shareholders authorized the Management Board to increase the
companyтАЩs capital stock by a maximum total of тВм 7,448,000.00 once or several times in accordance with
the Supervisory Board until May 30, 2019, by issuing new, no-par bearer shares or registered shares in
exchange for cash contributions or contributions in kind. The aim is to enable a flexible and rapid response to market conditions in the future while minimizing the negative impact on the companyтАЩs share
price.
Supervisory Board
Furthermore, the Annual General Meeting elected five new members to the Supervisory Board of
SolarWorld AG, which had been enlarged from three to six persons in the course of the financial
restructuring. The long-serving chairman of the Supervisory Board Dr. Claus Recktenwald and Board
member Marc M. Bamberger did not stand for re-election, with the result that both ceased to be members of the Supervisory Board of SolarWorld AG with effect from the end of the meeting on May 30,
2014.
тАВ back to content
47
Sol arWorld 2014тАВ тАвтАВ Consolidated Interim Financial Statements Third QuarterтАВ тАвтАВ NOTES
48
The newly elected members of the Supervisory Board were:
тАвDr. Khalid K. Al Hajri, Doha, Qatar
тАвFaisal M. Alsuwaidi, Doha, Qatar
тАвHeiner Eicherm├╝ller, Scottsdale/Arizona, United States
тАвDr. Andreas Ple├Яke, Herrsching am Ammersee, Germany
тАвJ├╝rgen Wild, Vaucresson, France
Chairmanship of the newly elected Supervisory Board was assumed by Dr. Georg Gansen, resident in
Bonn, Germany, who had previously been re-elected as a Supervisory Board member at the Extraordinary ShareholdersтАЩ Meeting on August 7, 2013. Heiner Eicherm├╝ller became deputy chairman.
5. Material events subsequent to the end of the interim period
Restructuring of U.S. activities under company law
On October 1, 2014, SolarWorld Americas LLC was merged with SolarWorld Industries America
Inc. and was subsequently renamed SolarWorld Americas Inc.
тАВ back to content
Sol arWorld 2014тАВ тАвтАВ Consolidated Interim Financial Statements Third QuarterтАВ тАвтАВ NOTES
49
6. Segment reporting
19
Information on operating segments first to third quarter 2014 // in MтВм
Production
Germany
Production
U.S.
Trade
Other
Reconciliation
Consolidated
409
Revenue
12
0
397
0
0
Intersegment revenue
283
122
0
8
тАУтАЙ413
Total revenue
295
122
397
8
тАУтАЙ413
EBITDA
121
тАУтАЙ6
тАУтАЙ9
3
тАУтАЙ1
Scheduled depreciation
тАУтАЙ18
тАУтАЙ7
тАУтАЙ2
тАУтАЙ4
Operating result (EBIT)
103
тАУтАЙ13
тАУтАЙ11
тАУтАЙ1
External revenue
108
тАУтАЙ31
тАУтАЙ1
77
519
Financial result
596
Result before income taxes
тАУтАЙ107
Income taxes
Consolidated net result
20
409
489
Information on operating segments first to third quarter 2013 // in MтВм
Production
Germany
Production
U.S.
Trade
Other
Reconciliation
Consolidated
346
Revenue
External revenue
15
2
329
0
0
Intersegment revenue
151
86
0
12
тАУтАЙ249
Total revenue
166
88
329
12
тАУтАЙ249
346
EBITDA
Scheduled depreciation
Non-scheduled ┬нdepreciation
Operating result (EBIT)
Financial result
Result before income taxes
Income taxes
Consolidated net result
0
тАУтАЙ21
тАУтАЙ48
6
0
тАУтАЙ63
тАУтАЙ17
тАУтАЙ6
тАУтАЙ2
тАУтАЙ5
0
тАУтАЙ30
0
тАУтАЙ2
0
0
0
тАУтАЙ2
тАУтАЙ17
тАУтАЙ29
тАУтАЙ50
1
0
тАУтАЙ95
тАУтАЙ55
тАУтАЙ150
15
тАУтАЙ135
тАВ back to content
Sol arWorld 2014тАВ тАвтАВ Financial and e vent c alendar
50
Financial and event calendar 2014
November 13, 2014Publication of Consolidated Interim Report 3rd quarter 2014
www.solarworld.de/financial-reports
Financial and event calendar 2015
March 26, 2015Publication of Annual Group Report 2014
www.solarworld.de/financial-reports
Press Conference on Financial Statements, Bonn (Germany)
AnalystsтАЩ Conference on Financial Statements, Bonn (Germany)
May 15, 2015Publication of Consolidated Interim Report 1st quarter 2015
www.solarworld.de/financial-reports
June 2, 2015Annual General Meeting, Bonn (Germany)
August 14, 2015Publication of Consolidated Interim Report 1st half 2015
www.solarworld.de/financial-reports
November 13, 2015Publication of Consolidated Interim Report 3rd quarter 2015
www.solarworld.de/financial-reports
тАВ back to content
THE Interim GROUP REPORT IS ALSO AVAILABLE IN GERMAN. PDF FILES CAN BE FOUND ON OUR HOMEPAGE AT
WWW.solarworld.de/financial-reports .
Design of cover and image part, Final Artwork & Production:
Kreativ Konzept, BonnтАЙ/тАЙBerlin // www.kreativ-konzept.com
Design of inner part:
STRICHPUNKT GMBH, STUTTGART/BERLIN // WWW.STRICHPUNKT-DESIGN.DE
Photography:
Frank Gr├дtz, Detlev M├╝ller, Hagen Willsch
Contact our team:
SolarWorld AG
Investor Relations
Martin-Luther-King-Str. 24
53175 Bonn, Germany
www.solarworld.com
[email protected]
Phone: +49тАЙ228тАЙ/тАЙ559тАЙ20-470
Fax: +49тАЙ228тАЙ/тАЙ559тАЙ20-9470
© Copyright 2026 Paperzz