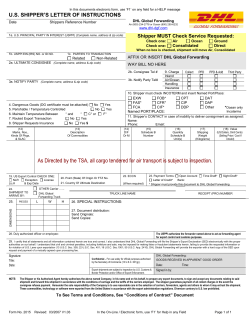
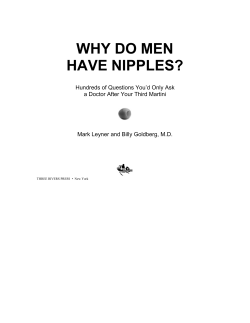
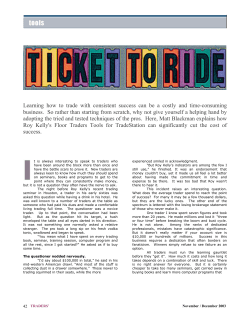
F/Y 2013/14 Coffee Export Trading Report
Alemseged Assefa &
Akalu Abdela, ECEA
Addis Ababa
November 2014
_
Ethiopian Coffee Exporters’ Association
Table of Contents
Page
1. Introduction -----------------------------------------------------------------
1
2. Overall Coffee Export Volume & Value ------------------------------
3
3. Coffee Export Price Movement-----------------------------------------
5
4. Individual Companies Export Performance ------------------------
8
5. Coffee Export Destination ----------------------------------------------
16
6. Buyers of Ethiopian Coffees -------------------------------------------
20
7. Summary and Conclusion------------------------------------------------
29
F/Y 2013/14 Coffee Export Trading Report
Ethiopian Coffee Exporters’ Association
_
1. Introduction
Coffee is the world's most widely traded agricultural commodity. World coffee production estimate
for 2013/14 was 150.1 million of 60 kilogram bags and Ethiopia's coffee produce is estimated to
reach close to 400,000 tons representing above 4.2 percent of the world production. Coffee is
Ethiopia's main source of foreign exchange income accounting for 22 percent of the total gross export
in the economy in F/Y 2013/14.
During the coffee season 2013/14 F/Y, the Ministry of Trade had planned to export 277,500 metric
tons or 4.6 million bags of 60 kilos coffee generating over US$ 1.1 billion to the economy.
Ethiopia produces varieties of coffees that have rich original flavors and exports coffees of different
types & grades, namely Sidama, Djimmma, Lekempti, Harrar, Yirgacheffe, Limmu, Teppi, Ghimbi,
Keffa forest, Gemadro, Bebeka, Godere, Bench, Bale, Anderacha, Zege, Amaro, Arsi, Kochere,etc, and
with this special types of coffees Ethiopia’s coffees are highly valued by consumers in the importing
countries.
However, the country has not used its natural potential and much remains to be done to maximize
our coffee supply, and generate higher income likewise what other countries with a similar natural
endowment have been able to benefit much from the global coffee market. Although coffee is still the
dominant foreign exchange earner to the Ethiopian economy, the coffee sector when compared to
some of the other major coffee producing countries in Latin America and South East Asia has yet to
experience the same level of development and growth.
In this brief report, the export trading feature for the 2013/14 F/Y coffee season will be reviewed
where details will be provided on ECEA members and non–members export level, export value of each
exporter, twelve months average ICE price, our coffee export destination in the global market and the
names of Ethiopian coffee buyer. The paper is prepared to furnish useful information and data on
individual exporters export activity, the Ethiopian coffee market in the global coffee trade and our
trading partners.
F/Y 2013/14 Coffee Export Trading Report
1
Ethiopian Coffee Exporters’ Association
_
Finally, the main aspects and features of the coffee export trading business of the year , issues and
matters that need to be considered over and took into in undertaking the coffee export business are
provided in the summary and conclusion section of the report.
F/Y 2013/14 Coffee Export Trading Report
2
Ethiopian Coffee Exporters’ Association
_
2. Overall Coffee Export Volume & Value
Total coffee exported during 2013/14 (2006 Eth. F.Y) was 190,873 metric tons and the income
generated was US$ 718.8 million. The export volume compared to last year's export volume of
198,835 metric tons showed a decline of 7,835 metric tons or about 4 percent. Similarly, the export
income exhibited a fall of 3.5 percent which come down from US$ 745 to about US$ 719.0 million.
The export income fall was attributed mainly due to the instability of Arabica Coffee price in the
global market, the continued economic crises in the advanced economies and a sustained coffee
surplus in the world market.
The average Inter-continental Exchange (ICE) coffee price of New York, where the Arabica coffee
traded is priced daily based on world coffee trading, which was 123 US cents /lb in July 2013 ended at
171.9 US cents/lb in June 2014, indicating an average price rise of 39.3 percent, as the coffee price
started to rise from January 2014 onwards with the news the Brazilian drought.
In general, the Arabica coffee price showed up and down trend because of unstable global coffee
market. The Inter-continental Exchange (ICE) average price starting from 123 US cents/lb in July 2013
continued to decline for the first five months reaching 105.8 US cents/lb in November 2013. In
December, it rose to 111.6 US cents/lb and continued to surge reaching 196.6 US cents/lb in April,
which was the maximum average ICE price recorded during the year. The price again slightly fell to
190.2 US cents/lb in May, and in June it went down to 171.9 US cents/lb.
And the year ended with an average ICE price of 142.07 US cents/lb, which appeared low compared
to the previous three years average ICE price. The average yearly price for 2012/13 was 149.7 US
cents/lb, and the year before in 2011/12 the average yearly price was 215.2 US cents /lb. And in
2010/11, the average yearly price of Arabica coffee in the New York trading market was 226.26 US
cents /lb.
F/Y 2013/14 Coffee Export Trading Report
3
_
Ethiopian Coffee Exporters’ Association
The average yearly prices for the last four years (2010/2011-2013/14), therefore, indicate that the
Arabica Coffee prices in the international market has generally tended to decline making the coffee
price in the global market very unstable and unpredictable. This has made the coffee business risky
and difficult affecting coffee farmers, growers, suppliers, traders, exporters, etc in coffee producing
countries.
Total coffee exported during the twelve months period of 2013/14 F/Y (2006 Eth. F.Y) is provided in
the following table to observe the volume and value trend of each month coffee supply to the global
market.
Table 1: F/Y 2013/14 Coffee Export Volume and Value
No.
1
2
3
4
5
6
7
8
9
10
11
12
Month
Volume
(In tons)
July
15,710.86
August
14,836.94
September 10,053.77
October
10,515.82
November
8,057.50
December
6,887.94
January
9,943.89
February
13,139.76
March
21,230.30
April
25,619.29
May
28,677.16
June
26,200.09
Total
190,873.32
Raw Data Source: MOT
Volume
(Share in
%)
volume
cumulative
share in %
8.23
7.77
5.27
5.51
4.22
3.61
5.21
6.88
11.12
13.42
15.02
13.73
100.00
8.23
16.00
21.27
26.78
31.00
34.61
39.82
46.70
57.83
71.25
86.27
100.00
100.00
Value
(In’000
USD)
53,411.17
50,270.62
33,620.51
35,248.58
27,154.98
22,851.16
34,472.57
49,324.60
81,046.95
101,872.57
118,498.91
111,017.90
718,790.52
Value
(Share in
%)
7.43
6.99
4.68
4.90
3.78
3.18
4.80
6.86
11.28
14.17
16.49
15.45
100.00
Value
cumulative
share in %
7.43
14.42
19.10
24.01
27.78
30.96
35.76
42.62
53.90
68.07
84.55
100.00
100.00
As can be observed from table 1, the monthly coffee export volume and value were variable
showing a rise and fall. The export volume starting with 15,710.86 tons in July 2013 went down to
14,837, 10,054, 10,516, 8,058 and 6,888 tons in August, September, October, November and
December 2013, respectively. However, in January 2014, the export volume picked up to 9,944 tons
further grew to 13,140 tons in February, 21,230 tons in March, 25,619 tons in April, and 28, 677
tons in May 2014. The May shipment was the largest recorded shipment that accounted for
F/Y 2013/14 Coffee Export Trading Report
4
_
Ethiopian Coffee Exporters’ Association
15 percent of the total export for the year. However, in June 2014, the export volume declined to
26,200 tons which was the second largest volume of coffee export for the year. There are
significant differences between the highest exports volumes recorded on May 2014 and the lowest
observed in December 2013, which showed a difference of 21,789 tons.
3. Coffee Export Price Movement
During July 2013– June 2014, the average green beans coffee export ICE price was 142.07 US
cents/lb. The export price of last year’s twelve months was 149.74 US cents/lb and compared to
last year's average price, and the year before July 2011 – June 2012, exhibited a significant fall by
73 US cents/lb or 33.9 percent.
Table 2: ICE Arabica Coffee Price Comparison, 2010/11 - 2013/14
(US cents/lb)
2013/14 change over
previous month
Fiscal Year
No.
1
2
3
4
5
6
7
8
9
10
11
12
Month
July
August
September
October
November
December
January
February
March
April
May
June
Yearly Average
2010/11 2011/12 2012/13 2013/14
In figure
in %
163.17
252.15
180.60
123.04
-0.39
-0.3
173.54
256.43
165.68
117.35
-5.69
-4.6
186.23
260.17
171.66
113.82
-3.53
-3.0
188.07
231.90
164.75
112.79
-1.03
-0.9
204.88
230.67
146.84
105.82
-6.97
-6.2
219.80
223.08
140.90
111.62
5.80
5.5
236.12
223.25
150.06
117.91
6.30
5.6
258.91
208.73
141.55
155.16
37.25
31.6
272.07
186.48
138.30
188.64
33.48
21.6
281.72
178.66
137.3
196.59
7.95
4.2
276.90
173.69
135.84
190.22
-6.37
-3.2
257.97
156.80
123.43
171.92
-18.30
-9.6
226.62
215.17
149.74
142.07
-
-
As indicated in table 2, the average annual ICE price of 2013/14 coming to US$ 142.07/lb was
slightly lower than the average price registered in 2012/13 exhibiting a fall by 7.67 US cents/lb or
5.4 percent. This indicates that the global coffee market in the past three years was characterized
by instability and price volatility.
F/Y 2013/14 Coffee Export Trading Report
5
Ethiopian Coffee Exporters’ Association
_
Graph 1: Arabica Coffee Average ICE Price on Monthly Basis, 2010/11 – 2013/14
Graph2: F/Y 2006 (2013/14) Average Price on Monthly Basis
Source: Ministry of Trade
As shown in graph 2 above, the average monthly price was 3,400 USD/ton in July 2013 but
declined to 3,318 USD/ton in December 2013. The price, however, rose to 3,467 USD/ton in
January 2014, went up further to 4,237 USD/ton in June 2014.The annual average price was 3,630
USD/ton.
F/Y 2013/14 Coffee Export Trading Report
6
_
Ethiopian Coffee Exporters’ Association
The monthly export volume and value of F/Y 2009/2010-2013/2014 are provided in the following
table to observe the pattern of volume export and income earned in each coffee export month.
Table 3: 2002 – 2006 E.F.Y Coffee Export Volumes and Value
2013/14
(2006 E.F.Y)
No.
2012/13
(2005 E.F.Y)
2011/12
(2004 E.F.Y)
2010/11
(2003 E.F.Y)
2009/10
(2002 E.F.Y)
Month
Volume
(In tons)
Value
(In
'000USD)
Volume
(In tons)
Value
(In '000USD)
Volume
(In tons)
Value
(In
'000USD)
Volume
(In tons)
Value
(In
'000USD)
Volume
(In tons)
Value
(In
'000USD)
1
July
15710.9
53411.2
12423.0
54844.0
12697.8
70936.2
20091.1
66929.0
14599.9
41967.3
2
August
14836.9
50270.6
21834.6
89352.3
12985.0
71728.3
20566.6
68730.4
13645.3
40672.7
3
September
10053.8
33620.5
13492.5
55087.5
10573.2
59240.0
14862.6
49074.0
7070.2
22051.2
4
October
10515.8
35248.6
15905.9
58952.8
8472.3
47967.9
15632.3
52749.4
8308.0
24272.0
5
November
8057.5
27155.0
17367.4
63991.1
7307.1
38312.3
12725.2
42699.4
5607.1
16542.6
6
December
6887.9
22851.2
10916.7
38922.7
5144.0
25945.0
11223.7
40225.8
5505.6
17416.5
7
January
9943.9
34472.6
9936.5
37302.6
7037.1
38040.0
13684.5
59409.0
8342.3
29454.4
8
February
13139.8
49324.6
13914.7
54494.1
10908.1
59661.0
13790.0
67257.0
11644.6
39375.0
9
March
21230.3
81046.9
15374.0
60920.7
18530.8
93760.0
18058.0
94300.0
17633.0
56990.0
10
April
25619.3
101872.6
17540.0
61423.8
19976.5
92467.7
17561.1
92240.8
24629.0
75027.0
11
May
28677.2
118498.9
22577.2
78540.5
26585.0
116305.0
19473.9
107039.3
26619.0
79515.0
12
June
26200.1
111017.9
27424.0
91055.9
29175.0
118548.0
18448.5
100995.7
28576.4
84971.7
Total
190873.3
718790.5
198706.4
744888.1
169391.9
832911.4
196117.6
841649.7
172180.5
528255.4
Average price
USD/ton
3,629.63
3,790.01
5,138.64
4,246.09
3,096.70
As seen in table 2, during 2013/2014 F/Y total coffee export volume reached 190,873 metric tons and
the income generated was USD$718.9 million which when compared with 2012/2013 export volume
showed a fall by 7,833 metric tons or 4 percent. In value terms, income earned from the 190,873
metric tons export amounted to USD$718.8 million which compared to the F/Y 2012/13 export
income of USD$ 744.9 million was less by USD$ 26.0 million or 3.6 percent.
Although the export volume was significantly higher by 21,481 or 12.7% when seem against 2011/12
export volume of 169,392 metric tons, the foreign exchange generated was lower by USD$
114.1million or 13 percent . The causes for the fall in income are attributed mainly due to the
continued price decline of the Arabica coffee in the global market.
F/Y 2013/14 Coffee Export Trading Report
7
Ethiopian Coffee Exporters’ Association
_
However, as 196,118 metric tons was exported in F/Y 2010/11, the export volume of F/Y 2013/14
compared to this export level was lower by 5,244 metric tons or 2.6 percent but in value terms it
decreased by USD$ 122.9 million or 14.6%.
In sum, although the export volume was significantly higher by 18,693 metric tons or 10.9% to the
export level of F/Y 2009/2010 amounting to 172,180 metric tons, the foreign exchange generated in
F/Y 2009/10 was greater by USD$ 190.5 million or 36 percent.
The export Volume and value of coffee of the last five years when shown graphically looks as follows.
Graph 3: Comparison of F/Y 2009/2010 - 2013/14 Export Volume & Value
Raw Data Source: MOT
4. Individual Companies Export Performance
Table 3 illustrates the performance of the individual coffee export of ECEA members in terms of
quantity, value and market share. Horra Trading stood first followed by Oromia Coffee Farmers
Cooperative Union and Abbahawa Trading Private Ltd Company.
Horra Trading accounted for 5.69% of the total export in value, Oromia Coffee Farmers Cooperative
5.11% and ABBAHAWA Trading Plc 4.42%. The first top 10 exporters accounted for 48 percent of the
total value of members export and the rest 79 members accounted for the remaining 52 percent.
Coffee exported and income earned by ECEA members is indicated below in detail in table 3.
F/Y 2013/14 Coffee Export Trading Report
8
_
Ethiopian Coffee Exporters’ Association
Table 4: ECEA Members Coffee Export Volume & Value
No.
1
2
3
4
5
6
7
8
9
10
11
12
13
14
15
16
17
18
19
20
21
22
23
24
25
26
27
28
29
30
31
32
33
Exporter
Horra Trading
OROMIA COFFEE FARMERS COOP. P.L.C
ABBAHAWA TRADING PRIVATE LIMITED CO
TRACON TRADING PRIVATE LIMITED COM
MULLEGE PRIVATE LIMITED COMPANY
SIDAMA COFEE FARMERS COOPERA UNION
S.A BAGERSH PLC
ETHIOPIAN GRAIN TRADE ENTERPRISE
CABEY PRIVATE LIMITED COMPANY
ADULINA COFFEE EXPORTER PLC
ALETA LAND COFFEE PRIVATE LIMITED C
BNT INDUSTRY & TRADING P.L.C
ALFOZ PLC
WELDEYESUS BUSINESS PRIVATE LIMITED
GMT INDUSTRIAL PRIVATE LIMITED COMP
BASHANFER TRADING PLC
HAILESSLASSIE AMBAYE INDUSTRIAL PLC
BIRRA COFFEE GENERAL TRADING PLC
TESTI TRADING PLC
DAYE BENSA COFFEE EXPORT PRIVATE LI
MAMO KACHA PLC
LEGESSE SHEREFA PRIVATE LIMITED COM
A.T.L. TRADING PLC
A.S.K.INTERNATIONAL TRADING PLC
ALTAYSIR TRADING PRIVATE LIMITED CO
ROMINA PRIVATE LIMITED COMPANY
ALTA COMPUTEC PRIVATE LIMITED COMPA
MORDOCOFE P.L.C
SEID YASSIN PRIVATE LIMITED COMPAN
AMBASSA ENTERPRISE PRIVATE LIMITED
ASMA INTERNATIONAL BUSINESS PLC
S.M.S PLC
DURAMI PRIVATE LIMITED COMPANY
Volume
(in ton)
Value
(In
000’USD)
12,900.00
6,722.16
9,907.80
7,428.60
6,415.98
4,170.60
5,318.16
5,719.74
5,294.70
4,665.24
4,093.20
2,454.01
3,670.80
4,098.50
3,546.48
2,515.20
1,951.20
2,016.00
2,576.70
2,827.80
2,536.80
1,787.10
2,193.60
1,872.00
1,954.95
1,314.00
1,904.40
1,010.40
1,238.40
1,318.80
1,226.40
1,202.40
1,351.20
F/Y 2013/14 Coffee Export Trading Report
40,670.12
36,484.46
31,596.55
27,946.29
26,132.67
24,838.97
21,615.02
19,982.21
18,876.28
18,523.03
14,539.62
13,857.89
13,847.66
13,328.31
12,586.41
10,920.66
9,901.12
9,680.58
9,577.56
9,344.76
9,129.95
7,202.30
7,025.02
6,699.20
6,470.97
6,224.94
6,206.40
5,107.63
5,023.24
4,911.13
4,812.96
4,666.67
4,649.95
Average % age market
share
Price
USD/Kilo Volume Value
3.15
5.43
3.19
3.76
4.07
5.96
4.06
3.49
3.57
3.97
3.55
5.65
3.77
3.25
3.55
4.34
5.07
4.80
3.72
3.30
3.60
4.03
3.20
3.58
3.31
4.74
3.26
5.06
4.06
3.72
3.92
3.88
3.44
6.80
3.54
5.22
3.92
3.38
2.20
2.80
3.02
2.79
2.46
2.16
1.29
1.94
2.16
1.87
1.33
1.03
1.06
1.36
1.49
1.34
0.94
1.16
0.99
1.03
0.69
1.00
0.53
0.65
0.70
0.65
0.63
0.71
5.69
5.11
4.42
3.91
3.66
3.48
3.03
2.80
2.64
2.59
2.04
1.94
1.94
1.87
1.76
1.53
1.39
1.36
1.34
1.31
1.28
1.01
0.98
0.94
0.91
0.87
0.87
0.72
0.70
0.69
0.67
0.65
0.65
9
_
Ethiopian Coffee Exporters’ Association
34
35
36
37
38
39
40
41
42
43
44
45
46
47
48
49
50
51
52
53
54
55
56
57
58
59
60
61
62
63
64
65
66
67
68
69
70
71
WONBERTA GENERAL IMPORT & EXPORT P.
ETHIO AGRI-CEFT PRIVATE LIMITED COM
AYINAGE GENERAL TRADING PLC
BAMINIF TRADING PRIVATE LIMITED COM
MOPLACO TRADING PLC
G H T Y GENERAL TRADING PRIVATE LIM
WONDO TRADE AND INVESTMENT
COMPANY
AKLILU KASA CHIRISA (NARDOS COFFEE
BEBEKA COFFEE ESTATE SHARE COMPANY
DUKALE WAKAYO DAKOLA
GREEN GOLD ETHIOPIA PRIVATE LIMITED
GREEN COFFEE AGRO INDUSTRY PRIVATE
TESFAY GEBREMARYAM GIDEY
GUJI COFFEE EXPORT PRIVATE LIMITED
COFFEE PLANTATION DEVELOPMENT ENTER
HELEN GEBRENGUS GEBEREHIWOT
MOGES AYENEW ABEBE
KEDIJA AHMED MOHAMMED
MULUNEH KAKA DUMESO
GEDYON GIRMA ABERA
ROBEREA PLC
MOHAMMED LALO YESUF
HAICCOF LIMITED PLC
ADDIS EXPORTE PLC
AINGE GENERAL TRADE PLC
MOCHALAND IMPORT & EXPORT PLC
ETCOF TRADING P.L.C
IBRAHIM HUSEN MOHAMMED
SEIDO HASSEN AMANU
TEKLE TEKUE GEBREAREGAY
BELAYNEH KINDE MOKONNEN
GUNA TRADING HOUSE PRIVATE LIMITED
K.I.W TRADING P.L.C
GHION INDUSTRIAL AND COMM. P.L.C
ABADIR COF TRADING PRIVATE LIMITED
ZEGE PLC
METAD AGRICULTURAL DEVELOPMENT PLC
HAYDER ABAMECHA ABADIKO
1,215.60
1,240.26
938.52
990.00
762.86
1,285.98
4,601.74
4,534.11
4,379.01
4,095.28
4,064.51
4,026.63
3.79
3.66
4.67
4.14
5.33
3.13
0.64
0.65
0.49
0.52
0.40
0.68
0.64
0.63
0.61
0.57
0.57
0.56
1,341.60
1,048.98
1,151.64
1,007.22
824.40
901.20
900.00
486.90
746.52
542.40
633.38
571.20
690.00
576.00
415.20
480.00
337.21
280.80
363.90
360.00
326.40
352.80
288.00
350.64
322.80
276.60
290.40
268.80
172.20
252.00
149.40
268.80
3,997.41
3,912.77
3,733.92
3,490.18
3,356.99
3,146.70
2,718.04
2,280.67
2,218.54
2,163.90
2,135.62
1,965.09
1,899.48
1,757.47
1,533.38
1,510.27
1,483.56
1,410.56
1,387.39
1,379.06
1,307.96
1,307.66
1,207.80
1,178.23
1,041.00
1,014.08
998.16
950.69
903.69
883.34
791.72
718.73
2.98
3.73
3.24
3.47
4.07
3.49
3.02
4.68
2.97
3.99
3.37
3.44
2.75
3.05
3.69
3.15
4.40
5.02
3.81
3.83
4.01
3.71
4.19
3.36
3.22
3.67
3.44
3.54
5.25
3.51
5.30
2.67
0.71
0.55
0.61
0.53
0.43
0.48
0.47
0.26
0.39
0.29
0.33
0.30
0.36
0.30
0.22
0.25
0.18
0.15
0.19
0.19
0.17
0.19
0.15
0.18
0.17
0.15
0.15
0.14
0.09
0.13
0.08
0.14
0.56
0.55
0.52
0.49
0.47
0.44
0.38
0.32
0.31
0.30
0.30
0.28
0.27
0.25
0.21
0.21
0.21
0.20
0.19
0.19
0.18
0.18
0.17
0.16
0.15
0.14
0.14
0.13
0.13
0.12
0.11
0.10
F/Y 2013/14 Coffee Export Trading Report
10
_
Ethiopian Coffee Exporters’ Association
72
ERMAGE BUSINESS PLC
73
KK PRIVATE LIMITED COMPANY
74
ZEBAD GENERAL EXPORT & IMPORT P.L.C
75
SOUTHERN REGION FARMERS COOPERATIVE
76
MAWI COFFEE AND GENERAL BUSINESS P.
77
TADESSE DESTA AMENE
78
COSTA MEMORIES TRADING PLC
79
ERSADE TRADING PRIVATE LIMITED COMP
80
PREMIUM COFFEE PLC
81
BAZEN AGRO INDUSTRY PRIVATE LIMITED
82
FITSUM TAFERE GEBREMEDHEN
83
PAUL RIES AND SONS (ETHIOPIA) PLC
84
AL-SAM PRIVATE LIMITED COMPANY
85
BARKUME COFFEE EXPORT PRIVATE LIMIT
86
BRIDGETECH PRIVATE LIMITED COMPANY
87
ALMAZ ZELEKE MARU
88
COFFEE PROCESSING AND WAREHOUSE ENT
Grand Total
Raw Data Source: MoT
153.60
183.60
153.60
107.80
72.00
115.38
112.80
71.40
57.60
72.00
82.92
38.40
38.40
19.20
19.20
18.00
9.00
143,938.83
665.41
512.05
463.92
417.55
337.30
330.34
317.11
255.53
213.76
192.06
184.61
152.38
135.45
93.12
71.11
67.06
33.73
552,308.37
4.33
2.79
3.02
3.87
4.68
2.86
2.81
3.58
3.71
2.67
2.23
3.97
3.53
4.85
3.70
3.73
3.75
3.84
0.08
0.10
0.08
0.06
0.04
0.06
0.06
0.04
0.03
0.04
0.04
0.02
0.02
0.01
0.01
0.01
0.00
75.90
0.09
0.07
0.06
0.06
0.05
0.05
0.04
0.04
0.03
0.03
0.03
0.02
0.02
0.01
0.01
0.01
0.00
77.32
In total, the 88 members of the ECEA exporting 143,939 metric tons or 76 percent of the total export
volume generated US$ 552.3 million or 77.3 percent of the total export income. However, since there are
coffee exporters that are not members of the Association, out of 126 non-members exporters only 20
exporters accounted for 76 percent of the total value of non-members exported.
Coffee quantity exported and income earned by non-ECEA members is indicated below in table 4.
Table 5: Non-members Export Volume & Value
No.
1
2
3
Volume
(In tons)
Exporter
KEMAL ABDELA INTERNATIONAL PRIVATE
SARA YIMER ALI
YIRGA CHEFFE COFFEE FARMERS COOPERA
9,576.00
3,144.00
1,562.70
Value
(In
000’USD)
30,732.52
11,410.29
10,449.02
F/Y 2013/14 Coffee Export Trading Report
Average
Price
USD/Kilo
3.21
3.63
6.69
% age market
share
Volume
5.05
1.66
0.82
Value
4.30
1.60
1.46
11
_
Ethiopian Coffee Exporters’ Association
4
5
6
7
8
9
10
11
12
13
14
15
16
17
18
19
20
21
22
23
24
25
26
27
28
29
30
31
32
33
34
35
36
KURU ETHIOPIA COFFEE
DEVELOPMENT PL
PRIMROSE SERVICE PROVIDER P.L.C
LIMMU COFFEE FARM
ABEBE MULEGETA KASSA
ALMAZ SEYOUM BEYENE
EBUNA TRADING PLC
TEPI GREEN COFFEE ESTATE SHARE
COMP
TADE GG HIGH LAND FOREST
COFFEE PRO
A.U.R TRADING P.L.C
MAMIMES TRADING PLC
HUSSEN MARSHLLO SEID
/MARSHLLO COFF
ARKEN GENERAL TRADING PLC
KFLE TSEGAY BEYENE
FATUM JEMAL ZEYNE
BECHU INTERNATIONAL TRADING
PLC
MORMORA COFFEE PLANTATION
PLC
BEREKET RESE SHIBESHI
LEMLEM TESFEU GEBRE
SOLOMON HAYAL HAILU
ALUMASHU GENERAL TRADING P.L.C
ALULA G/MICHAEL PAULOS
GEBRESLASE KAHSAY TESEMA
TEKLAY BERHANE KEBDEW
TEKLAY HAGOS GEBREGZABHER
MUNA SALAH MAHJER
ASENAKECH THOMASE BEYENE
MEKONNEN NEGASHE YEBYO
KAFA FOREST COFFEE FARMERS
COOPERAT
SISAY TETEMKE BITEWLEGN
SEKELA INDUSTRIAL PLC
ABRHA KASAHUN ABAY
BERHE HAGOES GEBRE
LIMU-INARA FARMERS MULTIPURPOSE CO
2,474.40
2,566.80
2,089.44
1,899.80
1,850.40
1,166.40
9,102.55
8,244.10
8,138.07
6,193.85
5,910.72
4,205.55
3.68
3.21
3.89
3.26
3.19
3.61
1.30
1.35
1.10
1.00
0.98
0.62
1.27
1.15
1.14
0.87
0.83
0.59
787.20
3,517.49
4.47
0.42
0.49
515.70
558.00
994.76
3,085.03
3,036.60
3,010.97
5.98
5.44
3.03
0.27
0.29
0.52
0.43
0.43
0.42
750.00
558.00
945.79
684.00
2,697.83
2,519.10
2,452.19
2,343.42
3.60
4.51
2.59
3.43
0.40
0.29
0.50
0.36
0.38
0.35
0.34
0.33
480.00
2,328.42
4.85
0.25
0.33
350.40
589.20
708.00
682.32
259.50
398.64
532.26
464.64
485.70
396.00
138.72
416.40
1,791.95
1,728.14
1,656.59
1,639.26
1,542.55
1,342.07
1,309.09
1,237.46
1,219.28
1,174.68
1,109.40
1,017.53
5.11
2.93
2.34
2.40
5.94
3.37
2.46
2.66
2.51
2.97
8.00
2.44
0.18
0.31
0.37
0.36
0.14
0.21
0.28
0.24
0.26
0.21
0.07
0.22
0.25
0.24
0.23
0.23
0.22
0.19
0.18
0.17
0.17
0.16
0.16
0.14
194.40
307.50
300.00
313.14
251.40
982.23
857.08
851.99
758.31
749.58
5.05
2.79
2.84
2.42
2.98
0.10
0.16
0.16
0.17
0.13
0.14
0.12
0.12
0.11
0.10
134.40
739.74
5.50
0.07
0.10
F/Y 2013/14 Coffee Export Trading Report
12
_
Ethiopian Coffee Exporters’ Association
37
38
39
40
41
42
43
44
45
46
47
48
49
50
51
52
53
54
55
56
57
58
59
60
61
62
63
64
65
66
KALME P.L.C
ZELALEME ESHETU G/AMANUEIL
BERHIE GEBREMEDHIN
WOLDEMARIAM
NINE BROTHERS TRADING PLC
FISHA TESGAY TESFAYE
ALTEHET INDUSTRIAL PLC
SAID ADEM BEDANE COMMODITY
TRADE PL
AMERSON GENERAL TRADING P.L.C
AFEWORK FISEHA WAHSAY
ABEZAR EXPORT PLC
NAFISIFE INTERNATIONAL BUSINESS
PLC
GUOSHE GEBRESILASSIE
GEBREMICHIALE
G AND F COFFE EXPORT PLC
ARAYA GEBREMICHAEL
GEBREAMLAK
DAMOTA WOLAYTA FARMER'S
HIBRET SIRA
ABDELLA ESHETU HAILU/ /FOUR A &
SE
WONGEL GENERAL TRADE PRIVATE
LIMITE
LEMA EDETO AND HIS CHILDREN
SH.CAP
GEBRESLASE GEBREMEDHIN ABAY
LEGAWAYYU GENERAL TRADING PLC
FENAOL COFFEE TRADING PLC
GUOUSHE DEMOEZ GONGUL
AGTD GENERAL EXPORT PRIVATE
LIMITED
LIMMU KOSSA AGRO INDUSTRY
P.L.C.
BEREHANE KAHESAY ADEHENOME
BERHANE GEBREEGZIABHER BERU
MEBRATU HAGOS GEBREYOHANNES
ABDULWASI AHMED ABRAHIM
KEBIR COFFEE TRADING PLC
NASIR SHAFI BEKER
281.64
268.80
735.15
732.78
2.61
2.73
0.15
0.14
0.10
0.10
277.92
108.00
246.06
180.00
710.38
692.36
671.92
666.00
2.56
6.41
2.73
3.70
0.15
0.06
0.13
0.09
0.10
0.10
0.09
0.09
133.20
162.60
217.92
152.00
664.69
614.85
601.07
580.64
4.99
3.78
2.76
3.82
0.07
0.09
0.11
0.08
0.09
0.09
0.08
0.08
108.00
564.80
5.23
0.06
0.08
195.24
96.00
514.43
512.52
2.63
5.34
0.10
0.05
0.07
0.07
163.38
467.38
2.86
0.09
0.07
111.60
442.39
3.96
0.06
0.06
126.00
404.64
3.21
0.07
0.06
134.40
391.54
2.91
0.07
0.05
55.00
140.46
72.00
72.00
125.22
386.45
379.77
356.40
351.00
348.11
7.03
2.70
4.95
4.88
2.78
0.03
0.07
0.04
0.04
0.07
0.05
0.05
0.05
0.05
0.05
120.24
346.69
2.88
0.06
0.05
75.60
124.86
123.72
120.54
72.00
76.80
72.00
342.07
333.84
326.56
320.58
309.60
303.07
302.40
4.52
2.67
2.64
2.66
4.30
3.95
4.20
0.04
0.07
0.07
0.06
0.04
0.04
0.04
0.05
0.05
0.05
0.04
0.04
0.04
0.04
F/Y 2013/14 Coffee Export Trading Report
13
_
Ethiopian Coffee Exporters’ Association
67
68
69
70
71
72
73
74
75
76
77
78
79
80
81
82
83
84
85
86
87
88
89
90
91
92
93
94
95
SENAIT TEMLESO ASGEDOM
GAHMAMO TRADING PLC
OROMIA FORESTRY AND WILD LIFE
ENTER
MOHAMMOD AHMED KALID
LEGESSE TSEHAY TEDLA
LEGU TRADING PRIVATE LIMITED
COMPAN
BAHLBI YOHANES FISUH
LEM KEFFA COFFEE & SPICES AGRO
INDU
WOLDEGEBRIEL GEBREYOHANNES
HAGOS
DEDESSA AGRO INDUSTRY PRIVATE
LIMIT
BOGINDA COFFEE DEVELOPMENT
PRIVATE
MATIWOS ERSUMO GDEBO
BELAY WELASHA COFFEE & SPICES
PLC
BENCH MAJI FOREST COFFEE
PRODUCERS
E.A.A.T IMPORT AND EXPORT PLC
HAGOS KASAHUN ABAY
FITWI ALEMU KAHSAY
YETI AGRO FORESTRY P.L.C
HALLA JEMAL ABDELA
TESFASILASA MEHARI GEBERSILASA
ASEFA DUKAMO KEROMA
L.H COFFEE AGRO INDUSTRIES PLC
HABTAMU SILLA DEA
ABRHET TADESE KIDANE
COFFEE CULTURE COFFEE EXPORT
PLC
TITE EXPORT P.L.C
LUBBABA & HER FAMILY BUSINESS
PLC
NIGUSE LEMMA EDETO
M.S.A OIL SEEDS & CEREALS
EXPORTIN
108.00
115.20
301.32
299.85
2.79
2.60
0.06
0.06
0.04
0.04
74.82
72.00
116.52
299.71
298.80
296.93
4.01
4.15
2.55
0.04
0.04
0.06
0.04
0.04
0.04
76.80
104.22
279.46
273.33
3.64
2.62
0.04
0.05
0.04
0.04
42.00
273.15
6.50
0.02
0.04
79.62
228.48
2.87
0.04
0.03
56.40
228.34
4.05
0.03
0.03
32.40
57.60
216.27
215.55
6.68
3.74
0.02
0.03
0.03
0.03
72.00
203.17
2.82
0.04
0.03
36.05
72.00
79.26
86.82
37.80
38.40
59.58
20.52
36.00
19.20
40.20
201.29
196.20
194.30
191.00
179.37
148.15
143.10
127.40
125.96
124.87
120.63
5.58
2.73
2.45
2.20
4.75
3.86
2.40
6.21
3.50
6.50
3.00
0.02
0.04
0.04
0.05
0.02
0.02
0.03
0.01
0.02
0.01
0.02
0.03
0.03
0.03
0.03
0.03
0.02
0.02
0.02
0.02
0.02
0.02
24.20
36.00
107.61
103.68
4.45
2.88
0.01
0.02
0.02
0.01
36.00
18.00
100.80
95.24
2.80
5.29
0.02
0.01
0.01
0.01
72.00
92.16
1.28
0.04
0.01
F/Y 2013/14 Coffee Export Trading Report
14
_
Ethiopian Coffee Exporters’ Association
96
97
98
99
100
101
102
103
104
105
106
107
108
109
110
111
112
113
114
115
116
117
118
119
120
121
122
123
124
125
126
GASHAWU KINIFE DESITA
CHERCHER ODA BULTUM FARMERS
COOP.
MAJI AGRO FORESTERY PLC
MAG INTERNATIONAL PRIVATE
LIMITED C
PISHON AGRI BUSINESS P.L.C
REZIYAN COFFEE EXPORT PLC
SHISHAY GEBREMEANTA
WOLDEGEBRIEL
KEMAL MUSSA SIRAJE
BERHAN AGRICULTURAL &
COMMERCIAL P.
SHIMEKIT DABA MUMECHA
MOHAMMEDAWIL AHMED
MOHAMMED
BAGERSH AGRO PLC
TSEGEREDA ASGEDOM MEDHANE
GALE KAMISSE AGROINDUSTRY PLC
WATTO COFFEE DEVELOPMENT
PRIVATE LI
HUSSEIN MOHAMMED HASSEN
MEDINA DUALE ADAWE
DESALIGN GEBREMICHAEL BUTA
AKMEL NURI SIRAJ
AHMED MOHAMMEDNUR SALHE
SEID ABDUREHMAN HASSEN
FATUMA IBRAHIM ABDI
ZLN GENERAL BUSINESS PLC
BAHAR AHMED MOHAMED
USEMAIL BERE MOHAMMED
MESAF TRADING P.L.C
SEADA ABDI HASSEN
MEKO ALI BILALE
TSEHAY TUJI TASSEW
ARDO LIBEN OLHAYE
WUBIANCH GADISSA TEREFE
Grand Total
Data Source: MoT
19.20
84.68
4.41
0.01
0.01
12.00
19.20
79.20
71.96
6.60
3.75
0.01
0.01
0.01
0.01
19.20
19.20
18.00
69.84
67.30
66.60
3.64
3.51
3.70
0.01
0.01
0.01
0.01
0.01
0.01
24.72
15.00
64.27
62.83
2.60
4.19
0.01
0.01
0.01
0.01
18.00
17.40
54.89
48.72
3.05
2.80
0.01
0.01
0.01
0.01
18.00
5.40
4.68
2.40
47.62
42.06
23.40
18.58
2.65
7.79
5.00
7.74
0.01
0.00
0.00
0.00
0.01
0.01
0.00
0.00
2.46
4.50
26.61
1.54
0.72
0.24
1.76
1.76
0.11
1.32
1.03
0.02
0.54
0.29
0.08
0.15
0.00
45,714.37
17.41
13.50
10.65
10.28
6.35
1.21
0.79
0.71
0.60
0.53
0.41
0.32
0.24
0.13
0.07
0.06
0.01
161,990.11
7.08
3.00
0.40
6.68
8.82
5.05
0.45
0.40
5.45
0.40
0.40
16.00
0.45
0.45
0.90
0.40
1.78
0.00
0.00
0.01
0.00
0.00
0.00
0.00
0.00
0.00
0.00
0.00
0.00
0.00
0.00
0.00
0.00
0.00
24.10
0.00
0.00
0.00
0.00
0.00
0.00
0.00
0.00
0.00
0.00
0.00
0.00
0.00
0.00
0.00
0.00
0.00
22.68
F/Y 2013/14 Coffee Export Trading Report
15
_
Ethiopian Coffee Exporters’ Association
The 126 non-members coffee exporters , bigger than the 89 member exporters by 37, exported 45,714
metric tons or 22.68 percent of the total export volume generating US$ 162.0 million or 24.1 percent of
the total coffee export earnings.
The export volume and value amount of both groups depict that member exporters in number is less than
non-members, but do export a considerably higher volume accounting for more than 77 percent of the
total coffee export income for the year.
The export volume and value of both ECEA members and non-members is summarized in table 5 to see
their shares in total export volume and value.
Table 6: Summary of ECEA Members & Non-members Export Volume and value
Volume
(in ton)
Exporter Category
ECEA Members
Non- ECEA Members
Grand Total*
Raw Data Source: MOT
143,938.83
45,714.37
189,653.20
Value
(In 000’USD)
552,308.37
161,990.11
714,298.48
Share (%)
Value
Volume
75.90
24.10
100.00
77.32
22.68
100.00
The export volume and value of ECEA members and non- members when depicted graphically
appears as follows.
Graph 4: Comparisons of ECEA members & Non-members Export Volume and Value
F/Y 2013/14 Coffee Export Trading Report
Note: * The export volume and value is not the same as shown in the table 2 for F/Y2013/14 since there is
1,220.13 metric tons valued at US$ 4,492.04 million whose details are not yet known or provided by
Ministry of Trade (MOT).
16
Ethiopian Coffee Exporters’ Association
_
5. Coffee Export Destination
Ethiopian coffees were exported to more than 50 countries during the year which compared to
last year, numbering 58 countries, showed 8 less countries export destination. The European Union
countries numbering 20 countries accounted for 47 percent of the coffee volume exported and for
46 percent of the export income obtained during the year.
Asian countries accounted for 32 percent of the total coffee exported and 31 percent of the export
income. Similarly, North America’s export quantity and value were 10 and 13 percent, respectively.
African countries importing 16,049 metric tons had an export value of 47,863 USD which
accounted for 8.5 percent of the export volume and 6.7 percent of the export income which
exceeded by 3.7 percent in volume and 3.1 percent in value compared to the previous year. The
rest two Oceania countries, namely Australia and New Zealand, accounted for 2.32 percent in
export volume and 2.9 percent in export.
One noted change or development this year is that United States which imported 14,415.48 metric
tons valued at US$ 70 million last year, increased its import volume by 22 percent reaching
17,583.76 metric tons. The export value to United States also showed a marked difference showing
a rise of US$ 16.1 million, a 23 percent growth. As a result, United States this year has become the
third largest buyer of Ethiopian coffees, after Germany and Saudi Arabia.
This tells that United States could become a growing market for the Ethiopian coffee in the future
and, hence, there is a need to undertake an aggressive marketing work to export an increasing
volume of high quality coffees to the country.
In general, as shown in the table 5, the top 10 countries, mostly industrialized countries, importing
86.8 percent of the coffee exported during the year accounted for 83.5 percent of the foreign
exchange income obtained from coffee export. This explains that the coffee market in these
traditional destinations need to be strengthened further and new markets be explored to mitigate
the risk arising from too much dependence on traditional destinations or markets.
F/Y 2013/14 Coffee Export Trading Report
17
_
Ethiopian Coffee Exporters’ Association
Table 7: Coffee Export by Destination
Total Export
No.
Country
Volume
(In tons)
1
2
3
4
5
6
7
8
9
10
11
12
13
14
15
16
17
18
19
20
21
22
23
24
25
26
27
28
29
30
31
32
Germany
Saudi Arabia
United States
Japan
Belgium
Italy
France
Korea, Republic of
Sudan
United Kingdom
Australia
Sweden
Djibouti
Jordan
Somalia
Spain
Netherlands
Canada
Russian Federation
United Arab
Emirates
South Africa
New Zealand
Taiwan, Province
of China
Finland
China
Israel
Greece
Yemen
Norway
Viet Nam
Switzerland
Mexico
Value
(In
�000USD$)
Average
Price
40,888.80
29,038.99
17,583.76
17,787.84
14,270.20
9,633.54
10,611.24
5,435.56
8,496.67
4,824.72
3,871.26
3,222.48
3,503.82
2,574.00
2,787.01
1,711.20
1,241.64
1,329.08
1,659.00
148,475.51
108,364.64
86,016.78
60,198.56
52,397.29
37,331.56
34,879.06
22,512.56
21,687.09
21,442.09
16,978.99
12,879.58
11,262.63
10,584.72
10,066.14
7,155.49
6,165.29
6,000.16
5,640.75
US$/Kilo
3.63
3.73
4.89
3.38
3.67
3.88
3.29
4.14
2.55
4.44
4.39
4.00
3.21
4.11
3.61
4.18
4.97
4.51
3.40
1,550.34
962.40
521.58
5,031.57
3,868.03
3,389.34
782.70
864.30
888.68
748.80
567.00
357.90
158.76
288.00
264.12
189.00
3,222.47
3,135.05
2,991.23
2,441.98
1,807.62
1,079.15
882.65
868.58
833.15
776.99
Share in %
Volume
Individual
Country
Value
Cumulative
Individual
Country
Cumulative
21.56
15.31
9.27
9.38
7.52
5.08
5.60
2.87
4.48
2.54
2.04
1.70
1.85
1.36
1.47
0.90
0.65
0.70
0.87
21.56
36.87
46.14
55.52
63.05
68.13
73.72
76.59
81.07
83.61
85.65
87.35
89.20
90.56
92.03
92.93
93.58
94.28
95.16
20.79
15.17
12.04
8.43
7.34
5.23
4.88
3.15
3.04
3.00
2.38
1.80
1.58
1.48
1.41
1.00
0.86
0.84
0.79
20.79
35.96
48.00
56.43
63.76
68.99
73.87
77.02
80.06
83.06
85.44
87.24
88.82
90.30
91.71
92.71
93.57
94.41
95.20
3.25
4.02
6.50
0.82
0.51
0.28
95.98
96.48
96.76
0.70
0.54
0.47
95.91
96.45
96.92
4.12
3.63
3.37
3.26
3.19
3.02
5.56
3.02
3.15
4.11
0.41
0.46
0.47
0.39
0.30
0.19
0.08
0.15
0.14
0.10
97.17
97.63
98.10
98.49
98.79
98.98
99.06
99.21
99.35
99.45
0.45
0.44
0.42
0.34
0.25
0.15
0.12
0.12
0.12
0.11
97.38
97.81
98.23
98.57
98.83
98.98
99.10
99.22
99.34
99.45
F/Y 2013/14 Coffee Export Trading Report
18
_
Ethiopian Coffee Exporters’ Association
33
34
35
36
37
38
39
40
41
42
43
44
45
46
Latvia
Portugal
Denmark
Egypt
Estonia
Morocco
Nigeria
Slovenia
Singapore
Turkey
Romania
Hong Kong
Kyrgyzstan
Swaziland
47
48
49
50
Korea, Democratic
People's Rep. of
Poland
Georgia
Lebanon
Total
120.00
115.20
94.80
112.60
76.80
76.80
91.20
57.60
36.00
56.40
38.40
38.40
36.00
19.20
556.02
491.01
402.33
376.61
310.03
267.09
259.70
216.30
185.38
184.50
142.22
107.94
90.48
75.77
4.63
4.26
4.24
3.34
4.04
3.48
2.85
3.76
5.15
3.27
3.70
2.81
2.51
3.95
0.06
0.06
0.05
0.06
0.04
0.04
0.05
0.03
0.02
0.03
0.02
0.02
0.02
0.01
99.52
99.58
99.63
99.69
99.73
99.77
99.81
99.85
99.86
99.89
99.91
99.93
99.95
99.96
0.08
0.07
0.06
0.05
0.04
0.04
0.04
0.03
0.03
0.03
0.02
0.02
0.01
0.01
99.53
99.60
99.65
99.71
99.75
99.79
99.82
99.85
99.88
99.90
99.92
99.94
99.95
99.96
13.02
18.00
19.20
19.20
189,653.19
75.30
66.93
65.61
58.56
714,298.48
5.78
3.72
3.42
3.05
3.77
0.01
0.01
0.01
0.01
100.00
99.97
99.98
99.99
100.00
200.00
0.01
0.01
0.01
0.01
100.00
99.97
99.98
99.99
100.00
200.00
The top 10 countries export quantity and value is shown in graph 3 in descending order to observe
the importance of these countries market destination for the Ethiopian coffees.
Graph 5: Top 10 Ethiopian coffee importing countries
F/Y 2013/14 Coffee Export Trading Report
19
_
Ethiopian Coffee Exporters’ Association
6. Buyers of Ethiopian Coffees
Nearly 317 companies in 50 countries bought Ethiopian coffees in F/Y 2013/14. The top 20 buyers
held a market share of 56 percent of total export value, and out of 317 companies the top 50
companies held about 82 percent of the whole export Value. Of the top buyers, Volcaffe Ltd held a
market share of 8.8% (12.36%),* Bernhard Rothfos Gmbh
4.2%(3.59%), Al-Khair Trading
4.06%(4.79%), Almustanee Trading 3.67%(2.59%) , Mitsui and Co.Ltd 3.39%(4.92%), Taloca Gmbh
3.01% (5.13%), Schlute SA 2.86%(1.82%), Falcon Commodities Limited 2.79%(1.55%), Ecom Agro
Industrial 2.45% (1.59%) , Hamburg Coffee Company 2.29%(2.26%).
The coffee quantity bought by each buyer and the value amount of the purchased coffee is
indicated below in table 7.
* Note: The figures in brackets represent percentage share in F/Y 2012/13.
Table 8: Ethiopian Coffees Buyer Companies
No
1
2
3
4
5
6
7
8
9
10
11
12
13
14
15
16
17
18
19
Buyer
VOLCAFE LTD
BERNHARD ROTHFOS GMBH
AL-KAHIR TRADING OFFICE CO LTD
ALMUSTANEER TRADING EST
MITSUI AND CO LTD
TALOCA GMBH CHOLLERSTRASSE
SCHLUTER SA
FALCON COMMODITIES LIMITED
ECOM AGRO INDUSTRIAL
HAMBURG COFFEE COMPANY
ROYAL COFFE,INC.3306 POWEL
ILLY CAFFE SPA FLAVIA 110 34147
NOBEL AMERICAS RESOPURCES CROP.107
TRABCCCA B.V STATIONSPLEIN 51 1012
EFICO S.A VOYEBOE UF 3.CH
WALTER MATTER S.A
INTER AMERICAN COFFEE INC.
SUCAFFINA SA PLACE ST GERVAIS
N.V GROUP SOPEX S.A GENERAAL
Volume
(In tons)
16,940.45
8,541.66
6,462.00
7,376.60
7,876.80
6,124.80
4,303.33
3,770.38
5,346.84
4,517.60
2,487.36
2,956.80
4,467.60
2,578.38
3,618.00
3,441.43
2,536.32
3,679.02
3,244.80
F/Y 2013/14 Coffee Export Trading Report
Value
(In
�000USD)
62,828.70
29,856.86
28,987.23
26,217.90
25,625.61
21,504.06
20,400.30
19,698.92
17,506.20
16,349.38
14,794.04
14,409.63
13,997.31
13,702.85
13,516.83
13,274.98
12,683.77
11,992.33
10,606.42
% age share
Volume
8.93
4.50
3.41
3.89
4.15
3.23
2.27
1.99
2.82
2.38
1.31
1.56
2.36
1.36
1.91
1.81
1.34
1.94
1.71
Value
8.80
4.18
4.06
3.67
3.59
3.01
2.86
2.76
2.45
2.29
2.07
2.02
1.96
1.92
1.89
1.86
1.78
1.68
1.48
20
_
Ethiopian Coffee Exporters’ Association
20
21
22
23
24
25
26
27
28
29
30
31
32
33
34
35
36
37
38
39
40
41
42
43
44
45
46
47
48
49
50
51
52
53
54
55
56
57
58
59
60
LUCKY HOME HOUSE HOLD
SALIM S.BIN MAHFOUZ
RUSSIAN COFFEE COMPANY LIMITED C/O
SALEM ABDULKADIR BAJUBAIR SONS
MARKETING AGROINDUSTRIES DMCC
MAISON P. JOBIN+ CIE S.A.S. 169.
MERCON COFFEE
LOUIS DREYFUS COMMODITIES
ITOCHU EUROPE PLC THE BROADGATE
AL NAMLAH AND CO.LTD.
MARUBENI EUROPE PLC RIVER PLATE
PRINCES MC FOODS EUROPE BOOMP JES
A.R.C AZIENDE RIUNITECAFFEE S.P.A
LUCKY HOME GENERAL TRADING LLC
AMEED FOOD INDUSTRIES
BALSER TRADING AG GUETERSTRASSE 4
BROOK'S CO. LTD
TOUTON S.A
ALTAWAFUQ ALSHAME EST
COFFY HANDLES GESELLSCHAFT
BAHADI TRADING
SOJITZ CORPORATION 1-1
HEINRICH CHRISTEN G.M.B.H
FINAGRA(UK)LTD
AL MOMARES FOR TRADING EST.
EFICO G M B H TORNESCHER WEG 109
OLAM INTERNATIONAL LIMITED 9
NESTLE UK LTD
PARAGON COFFEE TRADING COMPANY
ASTRA FOOD COMPANY LTD.
D R WAKEFEILD AND COMPANY THOMPSON
KAFFEE IMPORT COMPAGNIE GMBH PICK
BENECKE COFFEE GMBH+CO.KG
ALOIS DALLMAYR KAFFE BERLIN GMBH
ARABIAN TEA HOUSE TRADING EST.
CAFE IMPORTS 2617 E.HENNEPIN AVE.
TRADE AID IMPORTERS 174 GAYHURST RD
CAFEMA INTERNATIONAL SA AVENUE DE
ARMAJARO TRADING LIMITED
SALEM ABDULLAH BIN MAHFOOZ EST.
NKG BERO ITALIA S.P.A PLAZZA SAN
4,035.24
2,740.50
2,775.58
2,521.02
2,374.80
2,302.80
2,457.60
2,092.80
2,133.00
2,028.00
1,869.00
1,525.20
1,967.40
2,372.65
1,314.00
1,647.60
2,196.00
1,843.20
1,748.05
1,555.20
1,318.40
1,324.99
1,381.20
1,227.60
1,393.68
1,077.60
1,164.60
855.00
1,047.84
1,170.00
763.80
1,164.30
1,009.80
1,129.20
1,151.40
543.84
396.00
483.00
764.40
648.00
609.60
F/Y 2013/14 Coffee Export Trading Report
10,108.16
9,915.75
9,516.15
9,093.55
8,973.35
8,389.52
8,016.14
7,726.00
7,126.58
6,591.04
6,581.03
6,313.92
6,312.30
6,247.88
6,224.94
6,107.74
6,074.27
5,986.92
5,888.98
5,367.21
5,243.57
5,180.46
5,000.08
4,754.95
4,733.12
4,579.51
4,387.01
4,373.04
4,068.75
3,976.61
3,856.92
3,849.89
3,801.59
3,775.95
3,549.00
3,270.54
2,744.07
2,697.77
2,627.72
2,554.20
2,387.50
2.13
1.45
1.46
1.33
1.25
1.21
1.30
1.10
1.12
1.07
0.99
0.80
1.04
1.25
0.69
0.87
1.16
0.97
0.92
0.82
0.70
0.70
0.73
0.65
0.73
0.57
0.61
0.45
0.55
0.62
0.40
0.61
0.53
0.60
0.61
0.29
0.21
0.25
0.40
0.34
0.32
1.42
1.39
1.33
1.27
1.26
1.17
1.12
1.08
1.00
0.92
0.92
0.88
0.88
0.87
0.87
0.86
0.85
0.84
0.82
0.75
0.73
0.73
0.70
0.67
0.66
0.64
0.61
0.61
0.57
0.56
0.54
0.54
0.53
0.53
0.50
0.46
0.38
0.38
0.37
0.36
0.33
21
_
Ethiopian Coffee Exporters’ Association
61
62
63
64
65
66
67
68
69
70
71
72
73
74
75
76
77
78
79
80
81
82
83
84
85
86
87
88
89
90
91
92
93
94
95
96
97
98
99
100
AHMED AR BIN AFIF TRADING
SABA FOR IMPORT AND EXPORT CO LTD
KHALID ALDEREA FOR TRD AND MKTG EST
AZIENDE RIUNITE CAFFE S.P.A
WEB COR SA A-ONE BUSINESS
CONTINENTAL TRADE AND COMMODITY SE
COEX COFFEE INTERNATIONALINC.
SUSTAINABLE HAREST LTD.721 NW
A.VAN WEELY B.V
DURU INTERNATIONAL
KEFFA COFFEE LLC 1001 CROMWELL
J.ONE COFFEE
ARABIAN DEVELOPMENT COMPANY FOR
SEOUL ENERGY RESOURCES CO., LTD 607
OLAM AMERICAS,USA
COFFEE DOMAIN PTE LTD
AL-BAHHAR FOOD TRADING EST
KANEMATSU CORPORATION
GROUP SOPEX NV GENERAAL LEMANSTRAAT
NORDIC APPROCH C/O TIM WENDELBOE
SUPREMO NV OOSTERLINGENPLEIN
GLOBAL COFFEE TRADING FZCO,OFFICE
WALKER COFFEE TRADING LP
AL HAWRAA TRADING
CTCS LTD ALEXANDER HOUSE
AL FATEH TRADING SHOPS. AL SHEIKH
AL MUSTANEER TRAADING EST
LIST + BEISLER GESELLSCHAFT
COOPERATIVE COFFEES INC.
ABAS ADEM
PHOENIX TRADING NV
GEBER.WESTHOFF GMBH+CO.ROH+ROESTKARGC COFFEE INC. 1330 GREENE AVENUE
S.ISHIMITSU AND CO.,LTD.,
WATARU & CO.LTD.
AL AMJAAD EST
ALOMRANIA CONTRACTS AND TRADING EST
BRIZ COFFEE
AXUM TRADING LLC450 TH STREET HOBOK
INTERNATIONAL TRADE MANAGEMENT,
522.00
921.18
651.20
696.12
670.80
513.60
726.80
281.10
289.80
501.12
330.30
367.20
525.94
266.40
210.60
305.40
378.00
271.02
363.60
215.40
400.80
326.40
235.20
378.00
412.80
402.00
396.00
216.60
180.00
471.10
307.20
384.00
202.80
183.00
142.38
270.00
256.00
230.40
162.00
134.40
F/Y 2013/14 Coffee Export Trading Report
2,381.50
2,291.30
2,276.45
2,198.18
2,150.54
2,006.17
1,996.69
1,738.71
1,726.73
1,679.09
1,549.67
1,521.32
1,516.16
1,499.51
1,447.16
1,417.30
1,385.10
1,354.81
1,349.51
1,347.02
1,309.16
1,307.96
1,272.03
1,252.57
1,251.89
1,236.94
1,227.06
1,221.60
1,188.90
1,125.93
1,051.30
1,048.90
943.52
927.33
915.91
898.56
879.06
858.42
857.17
846.89
0.28
0.49
0.34
0.37
0.35
0.27
0.38
0.15
0.15
0.26
0.17
0.19
0.28
0.14
0.11
0.16
0.20
0.14
0.19
0.11
0.21
0.17
0.12
0.20
0.22
0.21
0.21
0.11
0.09
0.25
0.16
0.20
0.11
0.10
0.08
0.14
0.13
0.12
0.09
0.07
0.33
0.32
0.32
0.31
0.30
0.28
0.28
0.24
0.24
0.24
0.22
0.21
0.21
0.21
0.20
0.20
0.19
0.19
0.19
0.19
0.18
0.18
0.18
0.18
0.18
0.17
0.17
0.17
0.17
0.16
0.15
0.15
0.13
0.13
0.13
0.13
0.12
0.12
0.12
0.12
22
_
Ethiopian Coffee Exporters’ Association
101
102
103
104
105
106
107
108
109
110
111
112
113
114
115
116
117
118
119
120
121
122
123
124
125
126
127
128
129
130
131
132
133
134
135
136
137
138
139
140
141
ARTISAN BFRANDS 43-45 CARRINGTON
BAHAKEEM FOR TRADING
ALLY BRAZILIAN COFFEE MERCHANTS
FAWZI GENERAL TRADING
G.BIJDENDIJK BV
INICIATIVAS COMERCIALES NAVARRAS SL
ORGINAL FOOD GMBH KARTAEUSERSTR.61
EQUAL EXCHANGE
MONACO
M.I.COFFEE CORPORATION 2ND FLOOR
AROMA COFFEE
N.J DOUK AND SONS INC 407 MC GILL
RAJAB HANIEH AND SONS CO.
ICONA SA.,CI.PRINCEPPE DE VERGARA,
INTER KOM S.P.A VIA BERNINI N.20
DAARNHOUWER +CO B.V. KORTE HOGENDIJ
TWIN TRADING LIMITED 1 CURTAIN
HASAN AL TOURI TRADING.
RIFT VALLEY TRADING LLC,USA
NATIONAL COMMERCIAL BANK ACCT OF
ECO ORGANIC FOODS 83-85 MANSELL ST
EL CAFETAL CO,LTD 566-13,SHINSA-DON
LIKAY GEN.TRADING CO.U.LTD
GEPA GESELLSCHAFT Z.FOERDE-RUNG
GABAYO HUMBE GONDE
MOHAMMED ALAMARI EST
CKCO
GRUPPO IZZO S.R.L VIA PASSANTISOPEX ASIA PTE LTD 19A DUXTON ROAD
SALEM S.BIN MAHFOOZ
EUGENATTE GMBH
MOWFOOR TRADING EST ABLISHMENT
NV GROUP SOPEX SA
SEID ABDELLA ALZAHARANI EST
ABDULHADI OMAR BAFARAT,JEDDAH,
H.A.BENNETT & SONS PTY LTD 2.2
OXFAM FAIRTRADE VERVERIUSTRAAT 15
FAHAD SAAD,ALKHULAIF EST
MI COFFEE
CONSORZIO CTM ALTROMERCATO SCARL VI
EURO COMMODITIES LTD
134.40
248.90
133.20
281.64
249.60
192.00
144.00
108.00
153.60
126.00
184.40
114.00
216.00
211.20
153.60
134.40
76.80
198.00
91.20
162.00
134.40
115.80
159.24
76.80
165.60
155.52
108.00
96.00
96.60
91.20
151.20
128.24
115.20
108.00
72.00
57.60
57.60
108.00
74.40
57.60
115.20
F/Y 2013/14 Coffee Export Trading Report
827.52
800.60
755.15
735.15
732.70
674.71
663.40
654.77
653.55
646.53
640.68
596.46
581.40
562.54
560.85
542.23
541.80
534.60
522.97
507.60
477.46
469.89
467.85
461.38
451.97
436.64
430.96
428.36
425.43
423.45
421.11
403.99
400.43
397.80
390.55
389.56
370.37
364.68
352.99
351.33
351.09
0.07
0.13
0.07
0.15
0.13
0.10
0.08
0.06
0.08
0.07
0.10
0.06
0.11
0.11
0.08
0.07
0.04
0.10
0.05
0.09
0.07
0.06
0.08
0.04
0.09
0.08
0.06
0.05
0.05
0.05
0.08
0.07
0.06
0.06
0.04
0.03
0.03
0.06
0.04
0.03
0.06
0.12
0.11
0.11
0.10
0.10
0.09
0.09
0.09
0.09
0.09
0.09
0.08
0.08
0.08
0.08
0.08
0.08
0.07
0.07
0.07
0.07
0.07
0.07
0.06
0.06
0.06
0.06
0.06
0.06
0.06
0.06
0.06
0.06
0.06
0.05
0.05
0.05
0.05
0.05
0.05
0.05
23
_
Ethiopian Coffee Exporters’ Association
142
143
144
145
146
147
148
149
150
151
152
153
154
155
156
157
158
159
160
161
162
163
164
165
166
167
168
169
170
171
172
173
174
175
176
177
178
179
180
181
AGETCO GENERAL TRADING PLC
HARU INTERNATIONAL CORPORATION 9F
NINETY PLUS COFFEE LLC
COFFEETEAM NV GENERAAL LEMANSTR 74
DOMINION TRADING LLC
THE DRIP 1508-29 SECHO-DONG SEOCHOCAFFEBENE CO.LTD
EL-CAFE S.A
HAKSON CO.LTD DESTINATION KOREA.
BISSAT FRERES
SHANDONG ORIENTAL HAIGE TRADING CO.
TALCO GMBH CHOLLERSTRASSE 4 6300
OMER SALEM BAOBED
HANKOOK COFFEE CO.LTD.
AMCAFE INC 459 MAIN STREET NEW
ABDULAZIZ AL AL HOMAIDIHI EST
THE NATIONAL COMMERCIAL BANK
MYKO TRADING SPA
WEINGEIST LTD 15 STATION PARADE
AL SAAHE TRADING FZE
FORTUNA STAR GENERAL TRADING
GOLDEN TRESS COFFEE 244 42
BALZAC BROS.AND COMPANY
BAFARAT TRADING GROUP
FRANCE ALTER ECO 30 BOULVARED DE LA
KENCAF IMPORTING
ALI SALEH ALMARBAEL FACTORY
FED EX TRADE NETWORK
M/S BIN MAHFOOZ TRADING EST
OROMIA KAFFA,INC 2535 W 235TH ST.
WERTFORM GMBH CAFESTRASE 1 DE-21107
ITOCHU CORPORATION TOKEH 5-1
GHEBREMSKEL TESFAMARIAM GHIDEY
SALEM ABDUL KADIR BAJUBAIR SONS
GOODS CONSIGNED TO NEVSKIEPOROGI
SAID ABDULLAH AL-ZAHRANI EST
ELLIM COFFEE
JONKER EN SCHUT B.V. HARSELAARSEWEG
SALEH A.BABAKER SONS CO
W.M.CAHN(PTY)LIMITED 25B TENTH AV
108.00
75.60
50.04
57.60
61.08
55.20
57.60
76.80
49.20
108.00
62.34
115.20
72.00
36.00
54.00
54.00
76.00
76.80
75.60
72.00
79.20
37.20
38.40
54.00
38.40
57.90
108.00
38.40
36.00
36.00
38.40
72.00
84.48
54.00
76.80
54.00
56.40
38.40
52.80
54.00
F/Y 2013/14 Coffee Export Trading Report
350.09
346.30
333.71
328.04
325.87
325.86
322.04
319.59
309.02
306.00
297.24
295.87
290.68
283.34
275.50
273.60
273.60
268.36
252.95
251.93
249.79
242.94
236.62
234.90
232.81
228.33
227.38
225.40
223.20
222.22
220.11
214.29
213.75
210.60
209.95
208.80
206.75
205.29
198.24
194.52
0.06
0.04
0.03
0.03
0.03
0.03
0.03
0.04
0.03
0.06
0.03
0.06
0.04
0.02
0.03
0.03
0.04
0.04
0.04
0.04
0.04
0.02
0.02
0.03
0.02
0.03
0.06
0.02
0.02
0.02
0.02
0.04
0.04
0.03
0.04
0.03
0.03
0.02
0.03
0.03
0.05
0.05
0.05
0.05
0.05
0.05
0.05
0.04
0.04
0.04
0.04
0.04
0.04
0.04
0.04
0.04
0.04
0.04
0.04
0.04
0.03
0.03
0.03
0.03
0.03
0.03
0.03
0.03
0.03
0.03
0.03
0.03
0.03
0.03
0.03
0.03
0.03
0.03
0.03
0.03
24
_
Ethiopian Coffee Exporters’ Association
182
183
184
185
186
187
188
189
190
191
192
193
194
195
196
197
198
199
200
201
202
203
204
205
206
207
208
209
210
211
212
213
214
215
216
217
218
219
220
221
GUANGZHOU ECF IMPORT & EXPORT
ANBASSA
BRIGHT WORLD PETROLUM FZT
VILAC CO.LTD, 815,MOONHYUN-DONG
DULL LLO C/O ASCAIEW DEWEKE OR
TRADE HOUSE LALIBELA LLC
TAIFEI INDUSTERIAL CO.,LTD NO.63,
GAZI MOHAMMED S.SROOR EST
ABISSINICA KOREA CO.,LTD 46-3
TADE AID IMPORTERS 174 GAYHURST RD,
KIC
ONA COFFEE WHOLESALE
WAKEFIELD & CO.Ltd.
GAMSUNG INTERNATIONAL CO., LTD
TRACON TRADI
GOITOM KIROS GEBREMEDHN
XORXIOS S.L
COFFEE PLANT 22 BGANGNAM -DERO 44
AL OMARANIA CONTACTS AND TRADING
RAMAJARO TRADING LIMITDED
EALTER MATTER SA AVENUE DE CHAMPEL
CAMPOS COFFEE THIRTY SECOND BEAN
M/S S.ISHIMITSU AND CO. LTD
CAFE LULU CO.LTD NO.35,SHENGPING
ORIGN TRADERS PTY LTD 10 HOLBECHE
TERAMERICAN COFFEE GMBH AM
SA MEO 112 QUAI DE L OUEST 59000
SIDERALLOYS INTLSA VIA CONTONALE
MECCA COFFEE ROASTERS PTY LIMITED 2
SINOPHARM FORTUNE WAY COMPANY
EL PUENTE GMBH LISE-MEITNER-STR.9
SKHALID ALDERA TRADING AND MKT EST
SOCIETE BELCO-11 RUE FARADY 33700
AMERICAN COFFEE CORPORATION
ALROBAEIA FOR EXPORT
A.POORTMAN ( LONDON ) LTD 83-85
TERRA COFFEE AND TEA LTD 290 PORTGGETCO GENERAL TRADDING LLC
SEVEN SEEDS 114 BERKELY ST
QUIJOTE KAFFEE MARCKMANNSTRASE 30
57.60
37.80
85.92
36.00
57.68
38.40
38.40
57.30
36.00
18.00
38.40
19.20
38.40
30.00
38.40
58.92
28.80
18.00
36.00
38.40
36.00
19.20
18.00
18.00
19.32
18.00
38.40
38.40
19.20
19.20
19.20
38.00
18.00
38.40
38.40
18.00
18.00
38.40
18.00
18.00
F/Y 2013/14 Coffee Export Trading Report
186.56
179.37
176.14
172.80
171.14
166.85
160.85
158.95
155.79
154.76
152.38
152.36
151.72
150.07
149.00
148.70
138.32
136.91
135.00
134.61
130.95
126.99
126.98
126.59
123.88
123.02
122.75
121.38
118.52
118.25
114.29
112.10
110.91
110.05
109.49
109.13
107.94
107.51
107.14
107.14
0.03
0.02
0.05
0.02
0.03
0.02
0.02
0.03
0.02
0.01
0.02
0.01
0.02
0.02
0.02
0.03
0.02
0.01
0.02
0.02
0.02
0.01
0.01
0.01
0.01
0.01
0.02
0.02
0.01
0.01
0.01
0.02
0.01
0.02
0.02
0.01
0.01
0.02
0.01
0.01
0.03
0.03
0.02
0.02
0.02
0.02
0.02
0.02
0.02
0.02
0.02
0.02
0.02
0.02
0.02
0.02
0.02
0.02
0.02
0.02
0.02
0.02
0.02
0.02
0.02
0.02
0.02
0.02
0.02
0.02
0.02
0.02
0.02
0.02
0.02
0.02
0.02
0.02
0.01
0.01
25
_
Ethiopian Coffee Exporters’ Association
222
223
224
225
226
227
228
229
230
231
232
233
234
235
236
237
238
239
240
241
242
243
244
245
246
247
248
249
250
251
252
253
254
255
256
257
258
259
260
FINE WOOD GENERAL TRADING COU
SYDNEY
OROMIA KOREA LTD.273TH STREET SONGROTTERDAM NETHERLAND JOKER EN SCHUT
UNIVERSAL EXCHANGE CENTER
STRAIGHT
MOLEDINA COMMODITIES INC-5501
DESTA GENERAL TRADING (U)LTD
NPO KOMA IDAKI BUILDING 3F,3-4-16
SAEED ABDELLAH ALAHRANI EST
GLOBUS COFFEE LLC
SHINE STEED INTERNATIONAL INC.
MAK IMPORTS.LLC
NAJEEB SAEED QASSEM EST
MARE TERRA
M/S RAJAB HANIEH AND SONS
DER URKAFFEE MAG.ERNA REICHINGER
SWALKER COFFEE TRADING LP 2900
TNTERAMERICAN COFFEE INC.19500
SPECIALLY SELECTED BY TRABOCCA BV
SPECIALLY PERPARD FOR SOLBERG
ABREHAM HEZKIAS HAZOFIM 8/3
GT BEANS CORP.
AZ CHURCH SUPPLY LLC 2324, WAYLAND
KHALEL FAISAL ADEEB ABUKHARAMA NEAR
TAIFEI INDUSTRIAL CO.,LTD
NAJ INTERNATIONAL GENERAL TRADING
DANIELS SPICES LTD
QINGDAO LEFEI TRADING CO.,LTD.
ZAHARAT EL BON BRAZILI
F.L MICHAELIS
DONGKYUNG PHARM CO.,LTD BOEUN 22-9
HEREZEL PORSAMAHI LTD
PERSNAM CORPORATION NO.501,
GIZA FOODS, EGYPT
TALOUMIS & CO.
GIANFRANCO FERRERO PRESIDENT OF ASS
QUALITA INTERNATIONAL
WM CAHN(PTY) LIMITED
40.80
18.00
18.60
19.20
33.30
33.30
18.00
36.18
18.00
18.00
19.20
18.00
18.00
43.20
13.50
36.00
18.00
16.20
18.00
19.20
19.20
19.20
19.20
18.00
19.20
19.20
18.00
18.00
15.00
19.00
19.20
19.08
19.20
18.00
18.00
12.72
8.76
15.00
18.00
F/Y 2013/14 Coffee Export Trading Report
104.08
103.18
103.18
101.59
99.92
99.90
97.22
97.03
95.24
90.00
89.74
89.29
89.29
86.64
86.57
86.40
83.33
80.95
79.37
78.31
78.31
78.31
77.76
77.38
76.80
76.03
75.40
75.40
74.52
72.20
67.73
67.67
67.20
66.60
66.00
65.78
65.66
62.83
61.39
0.02
0.01
0.01
0.01
0.02
0.02
0.01
0.02
0.01
0.01
0.01
0.01
0.01
0.02
0.01
0.02
0.01
0.01
0.01
0.01
0.01
0.01
0.01
0.01
0.01
0.01
0.01
0.01
0.01
0.01
0.01
0.01
0.01
0.01
0.01
0.01
0.00
0.01
0.01
0.01
0.01
0.01
0.01
0.01
0.01
0.01
0.01
0.01
0.01
0.01
0.01
0.01
0.01
0.01
0.01
0.01
0.01
0.01
0.01
0.01
0.01
0.01
0.01
0.01
0.01
0.01
0.01
0.01
0.01
0.01
0.01
0.01
0.01
0.01
0.01
0.01
0.01
0.01
26
_
Ethiopian Coffee Exporters’ Association
261
262
263
264
265
266
267
268
269
270
271
272
273
274
275
276
277
278
279
280
281
282
283
284
285
286
287
288
289
290
291
292
293
294
295
296
297
298
KOREA MCNULTY CO LTD
DAVIDSONS & SONS CUSTOMS BROKERS
NIMA NOUR
INETYPLUS COFFEE
BILLIE INDUSTRAL CORPORATION 7F,NO
DIYABLAR TARIM URUNLERI VE GIDA
SWALTER MATTER SA AVENUE DE CHAMPEL
NORWEGIAN ETHIOPIAN AGRICULTURAL
MUSE TESFAYOHANNES GEBREHIWOT
ROYAL GOLDEN GENERAL TRADING(LLC)
M/S FOR ACCOUNT OF M/S MARUBENI
PAPAGEORGIOU GEORGIOS 59,CHALDIAS
SHENZHEN ZUNWEILU TRAD COMP.LTD.
ARC AZIENDE RIUNITE CAFFE SPA
YESLOGISTICS CROP,APLUS COFFEE
ALEX THE COFFE 282-1 BAEGAM-MYEON,
ALPEREN GIDA TICARERT VE SAN.LTD
ASWAR ALBILAD TRD.CO.
PINACLE TRADING PLC DUBA-UAE
MOHAMMED ALI NEJDI
ASKIAS SHMUEL MOSHAB AZERIKAM
FISSEHA EZKIAS MOSHAB AZIKAM 90
BOON COMMODITIES DMCC
K-ONE TRADING CO.LTD
AMARE TERRA
BUNNA HOUSE SARL ETHIOPIA STREET
DONG JIN TRADING 839-16 GYO 1 DONG,
SHEBA ENTERPRISE INC 97 FAIRLAWN
KETEMA WOLDE GEORGIS
MEHAMMED ALI NIGDI IMPORT
MTC GROUP KOREA
YONATAN TRADING FZC
MAYEE COFFEE NEDERLAND B.V
TAF-I.TALOUMIS&COMOPLACO TRADING P.
JEBENA COFFEE COMPANY
M/S RAW COFFEE COMPANY
JACKSAMS INVESTMENTS LIMITED
MAF TRADING 50 STREET,SANA'A,YEMEN
19.20
9.60
18.49
9.00
13.80
19.20
18.00
18.00
18.00
18.00
9.00
18.00
7.34
19.20
9.00
6.00
18.00
21.60
15.00
18.06
9.60
9.60
9.00
5.00
4.50
4.84
3.00
4.68
4.02
7.98
3.00
4.80
3.00
1.80
0.96
0.24
2.64
1.00
F/Y 2013/14 Coffee Export Trading Report
60.87
58.20
57.77
57.54
56.65
56.64
56.35
54.89
54.00
54.00
51.59
47.62
47.54
46.98
46.17
44.76
43.20
43.19
43.10
40.33
40.21
40.21
32.56
31.42
27.08
25.83
24.01
23.40
19.89
18.12
17.86
14.40
12.57
12.50
8.97
7.94
6.44
5.50
0.01
0.01
0.01
0.00
0.01
0.01
0.01
0.01
0.01
0.01
0.00
0.01
0.00
0.01
0.00
0.00
0.01
0.01
0.01
0.01
0.01
0.01
0.00
0.00
0.00
0.00
0.00
0.00
0.00
0.00
0.00
0.00
0.00
0.00
0.00
0.00
0.00
0.00
0.01
0.01
0.01
0.01
0.01
0.01
0.01
0.01
0.01
0.01
0.01
0.01
0.01
0.01
0.01
0.01
0.01
0.01
0.01
0.01
0.01
0.01
0.00
0.00
0.00
0.00
0.00
0.00
0.00
0.00
0.00
0.00
0.00
0.00
0.00
0.00
0.00
0.00
27
_
Ethiopian Coffee Exporters’ Association
299
300
301
302
303
304
305
306
307
308
309
310
311
312
313
314
315
316
317
THE JAVA FACTORY 1113
AUEL AB (AKTIEBOLAG) ORG*556942MD TRADING
AGNI FOSCOLOU DESTINATION
NORDIC ABYSINIA KLEMETINKATU
RED FOX COFRACHANTS LLC
M/S MICHAEL
THE SQUARE MILE COFFEE
EMERTAINC (ELKRIDGE)
EOUAL ENERGRESOURES
MUENCH HAUSEN GMBH GEEREN
CIRCLE PRODUCTIS GMBGH,
LOS ANGELES COFFICE (LAX)
MAHDI MUHAMED
DUKEM MARKET LLC
THE BUSHWICK SEED COMPANEY
ETHIO COMMERICAL TRADE 2-3735
DAVID CHA
TRV GENERAL TRADING LIMITED
Grand Total
0.42
0.48
0.60
0.36
0.30
0.18
0.22
0.18
0.24
0.24
0.18
0.06
0.01
1.03
0.02
0.34
0.08
0.02
0.00
189,653.19
F/Y 2013/14 Coffee Export Trading Report
4.80
3.92
3.70
2.42
1.91
1.81
1.78
1.57
1.25
1.21
1.19
0.60
0.49
0.41
0.32
0.15
0.07
0.07
0.01
714,298.48
0.00
0.00
0.00
0.00
0.00
0.00
0.00
0.00
0.00
0.00
0.00
0.00
0.00
0.00
0.00
0.00
0.00
0.00
0.00
0.00
0.00
0.00
0.00
0.00
0.00
0.00
0.00
0.00
0.00
0.00
0.00
0.00
0.00
0.00
0.00
0.00
0.00
0.00
100.00 100.00
28
Ethiopian Coffee Exporters’ Association
_
7. Summary and Conclusion
As coffee is the major export commodity of the economy the government has planned in fiscal year
2013/2014 to export 277,500 metric tons and earn 1.1 billion USD. However, 190,873 metric tons or
69 % of the planned volume and US$ 718.8 million or 65 percent of the value was achieved. When
we see the monthly coffee shipment, we find that 114,867 metric tons of coffee was exported and
US$ 461.8 million was obtained during the last five months of the year, February - June 2014. These
accounted for 60 and 64 percent of the total coffee export volume and income for the year. This
shows that the country has enough coffee in stock but the first half year performance was so poor
that the total performance was far below what was expected. The coffee export income obtained
during the year accounted for 22 percent of total goods export earning of the year, in which the
coffee export share was the lowest so far observed in the goods export income of the country.
A total of 215 individuals or companies were involved in the coffee export business during the year,
of which 89 (41.4%) were Ethiopian Coffee Exporters Association members (ECEA) and the rest 119
exporters (58.6%) were non-members. The ECEA members accounted for more than 77.3% percent
of the total export value and non–members held the remaining 22.7 percent export value.
With regard to the price level of coffee exported, we find that 29 percent of ECEA members export
price per kilo was between US$ 4-6 per kilo, while 71 percent of them had an export price of US$ 23.9 per kilo. On the other hand, 11 percent of non-members export price was US$ 6-8.8 per kilo,
while 22 percent had 4-5.9 per kilo and the rest 66 percent exported at a price of US$ 0 .4-3.9 per
kilo. One non-member export price was US$16 per kilo, but the export quantity was very smallish
amounting to only .02 ton or 20 kilos.
There is, therefore, a need for exporters to trade in better quality coffees so as to earn higher price
to their exports as Ethiopian rich original flavor coffees can be sold at a premium price if better
quality coffees are consistently supplied to coffee markets in the industrialized and high income
countries.
F/Y 2013/14 Coffee Export Trading Report
29
Ethiopian Coffee Exporters’ Association
_
During the year the coffees were exported to 50 countries in five continents of the world. As in
previous years, European countries share of Ethiopian coffee import accounted for 47 percent of
total coffee export volume taking a lion's share. Asia accounted for 32 percent and African countries
took 8.5 percent which when compared to last year was lower by 3.7 percent. American region
export was higher by 2 percent compared to last year which accounted for 11 percent in value
terms. Oceania, the fifth Continent, constituting Australia and New Zealand accounted for 2.8
percent of coffee export value. So, more market destinations need to be explored and an aggressive
marketing work or exercise should be undertaken by exporters to seize the opportunities in all
destination market, especially at this time where the global coffee demand is forecast to exceed the
global coffee supply because of the Brazilian drought that is thought to impact the country's
Arabica coffee production.
Regarding buyers, there
were 317 companies that bought the Ethiopian coffees. But, although their number is large, 50
buyers held a share of 82 percent from the total exports and the remaining 267 buyers took only 18
percent of total exports. In F/Y 2012/13 and 2013/2104, 20 buyers of the top Ethiopian coffee
buyers accounted for nearly 60 percent. So, there is a need to make concerted efforts by exporters
to find buyers that demand larger quantity with a better price. Also, the business relationship with
existing buyers needs to be strengthened and exporters should ensure their customers that they
would always meet or fulfill the obligations they entered in their coffee contract sales.
In total, exporters and other stakeholders, specially the Ministry of Trade, should evaluate the
domestic and the global coffee market situations carefully and ought to learn lessons from the
unstable world coffee market and trading business, trade in closely observing and understanding
the world coffee market situation. Exporters should also design new strategies and ways to
mitigate the impacts of the underlying coffee price volatility in remaining afloat in the coffee export
business. There is, therefore, a need for all actors in the coffee commodity value chain to examine
carefully the problems facing the coffee trading and export business, and take appropriate
measures and actions for the coffee sector to become sustainable and benefit more the farmers,
collectors, suppliers traders, exporters, growers and, of course, the economy.
F/Y 2013/14 Coffee Export Trading Report
30
Ethiopian Coffee Exporters’ Association
_
Notes and References
1. Ministry of Trade export data 2009/10 – 2013/14
2. ICE Futures Coffee (July 2013 – June 2014).
3. F/Y 2011/12 Coffee Export Trading Special Report – Alemseged Assefa and Engedashet
Tsegaye (September 2012).
4. Ethiopia’s Coffee – Perspective from 2009/10 – 2011/12 Coffee Season and the Long
Term Vision of the Sector - Alemseged Assefa and Getaneh Arega (November 2012).
5. F/Y 2012/13 Annual Coffee Export Performance and Price Analysis Report –
Alemeseged Assefa and Getaneh Arega (October 2013).
6. Wikepedia.
7. www.coffeenetwok.com
F/Y 2013/14 Coffee Export Trading Report
31
© Copyright 2026 Paperzz