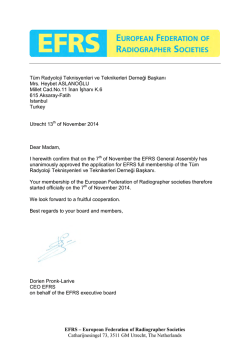
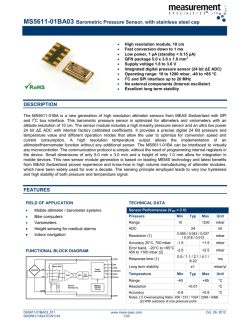
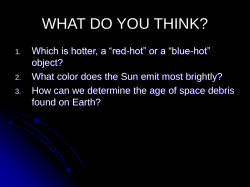
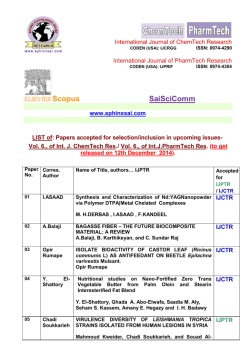
This paper was published in Optics Letters and is made available as an electronic reprint with the permission of OSA. The paper can be found at the following URL on the OSA website: http://www.opticsinfobase.org/ol/abstract.cfm?URI=ol-37-24-5214. Systematic or multiple reproduction or distribution to multiple locations via electronic or other means is prohibited and is subject to penalties under law. 5214 OPTICS LETTERS / Vol. 37, No. 24 / December 15, 2012 Blue emissions in Dy3+ doped Y4Al2O9 crystals for temperature sensing Zuzanna Boruc,1,* Marcin Kaczkan,1 Bartosz Fetlinski,1 Sebastian Turczynski,2 and Michal Malinowski1 1 Institute of Microelectronics and Optoelectronics, Koszykowa 75, Warsaw 00-662, Poland 2 Institute of Electronic Materials Technology, Wolczynska 133, Warsaw 01-919, Poland *Corresponding author: [email protected] Received October 24, 2012; revised November 19, 2012; accepted November 19, 2012; posted November 20, 2012 (Doc. ID 178579); published December 13, 2012 Temperature dependent emission spectra and decay times of trivalent dysprosium (Dy3 ) activated Y4 Al2 O9 (YAM) crystals have been studied for the first time (to our knowledge). The ratio of emission lines intensity can be used in temperature measurements, as it is not dependent on the variability of absolute intensity. The Boltzmann model was applied for modeling the temperature variation of the 4 I15∕2 and 4 F9∕2 states emissions relative intensities 455 and 481 nm, respectively. The calculated approximation gives highest sensor sensitivity of about 3 × 10⁻³ °C−1 for the 600°C–800°C range, which allows for an expectation of usefulness of Dy3 :YAM in high-temperature luminescence thermometry. Also, the measured decay times are suitable for temperature sensing. © 2012 Optical Society of America OCIS codes: 160.2540, 160.5690, 280.0280, 280.6780. Dysprosium doped crystals have been quite well-known as temperature sensors for over two decades [1–3] especially by the fluorescence intensity ratio (FIR) method. However, not many papers about combinations of dysprosium ion with various hosts can be found in the field of phosphor thermometry. The FIR method is based on the variation of two emission lines and therefore it is desirable for those lines to be quite well thermally coupled. Such coupling allows the Boltzmann distribution to be applied for approximation of the ratio’s temperature dependence. Another method of using fluorescence features for temperature measurements is the decay time method. This method has a more complicated measurement process, but it often gives higher sensor sensitivities than the FIR method. In this work, we investigated thoroughly the temperature influence on the emissions of 0.3% at. Dy3 :Y4 Al2 O9 (Dy:YAM) polycrystal in the form of rod 2–3 mm in diameter and 8 mm (initially few centimeter) long obtained by the micro-pulling-down method. Y4 Al2 O9 (YAM), with the formation of monoclinic and space group P21∕c, is one of four crystalline phases in Y2 O3 :Al2 O3 maintaining ratio 2∶1 (Y4 Al2 O9 ). The Y atoms are coordinated to either six or seven oxygen atoms [4]. Other phases in the system are cubic garnet YAG (Y3 Al5 O12 ), orthorhombic perovskite YAP (YAlO3 ), and metastable hexagonal structure phase YAH (YAlO3 ), with the same stoichiometry as YAP, observed during the synthesis by soft chemistry methods. Dy:YAM samples were grown in the Institute of Electronic Materials Technology in Warsaw. The spectroscopic characteristics of Dy:YAM at room and low temperature have already been investigated [5]. YAM undergoes phase transition at about 1377°C [6], which results in material cracking during standard Czochralski growth method. Therefore, the micro-pulling-down method [7] was used to obtain the samples. As the cross-relaxation (CR) process was unfavorable for our study, only a 0.3% at. doped sample was investigated. Emission measurements were performed using Digikrom 480 grating monochromator manufactured by CVI 0146-9592/12/245214-03$15.00/0 Laser Corporation followed by a photomultiplier tube and SR400 gated photon counter manufactured by Stanford Research Systems. The excitation line was 355 nm obtained by the third harmonic of pulsed Continuum Surelite Nd:YAG laser (10 ns pulse-width, repetition rate 10 Hz). Fluorescence dynamics profiles were recorded using SR-430 multichannel analyzer controlled by a PC. The Dy3 energy levels structure together with excitation spectra for Dy:YAM is presented in [5]. There are two closely lying levels: 4 F9∕2 and above it 4 I15∕2 with the smallest energy gap between them of about 600 cm−1 at 10 K. At room temperature emission bands originating from the considered levels are nearly overlapping making the thermal excitation of the 4 I15∕2 level more probable. Although the maximum phonon energy of 813 cm−1 (obtained from Raman spectra measured in Institute of Electronic Materials Technology) is quite high, the possibility of 4 F9∕2 emission quenching by multiphonon relaxation is very low because the energy gap between 4 F9∕2 level and the nearest lower lying level is about 7 × 103 cm−1 , which is equal to eight phonons. The temperature dependences of 4 I15∕2 and 4 F9∕2 emission lines were measured and are presented in Fig. 1. The plots were normalized to unity at 4 F9∕2 emission line (481 nm). The significant increase of 4 I15∕2 level emission Fig. 1. (Color online) Temperature variability of the emission spectra. The spectra were normalized to unity for 4 F9∕2 emission intensity. © 2012 Optical Society of America December 15, 2012 / Vol. 37, No. 24 / OPTICS LETTERS 5215 Table 1. Boltzmann Based Approximations of Experimental Data intensity with growing temperature could be observed, which is the evidence of 4 I15∕2 level population thermal growth. The measure of energy delivered to the system by temperature is kT value and the probability of the system being in state with energy E is equal to exp (−ΔE∕kT). This means that for kT equal to ΔE there is a probability of 0.37 that the ion will be in the higher state. The kT value changes from 200 cm−1 for room temperature to 680 cm−1 for 700°C. As the excitation line of energy is over 28 × 103 cm−1 , the 4 I15∕2 and 4 F9∕2 levels can be excited after the phonon relaxation from the higher levels and the distribution of their populations in thermal equilibrium would be directly dependent on the kT value. Thus, the thermal coupling of the discussed pair of levels is predicted to follow Boltzmann distribution: N A ∕N B C⋅ exp −E∕kT , where N A , N B are the populations of considered energy levels and C is constant, which depends on the radiative transition rates and the degeneration of these levels. The ratio R of intensity values at 455 nm (line A, 21978 cm−1 ) and 481 nm (line B, 20790 cm−1 ) was plotted against the inverted temperature. The Arrhenius plot of the obtained data is presented in Fig. 2, which compares experimental data with theoretical values. The experimental plot is slightly nonlinear and it maintained this tendency also when using integrated intensities (the comparison was made to confirm the reliability of the obtained dependencies). The slope is approximately equal to the theoretical value (1188 cm−1 ) only in the middle part. However, by dividing the plot into two parts (below and over 300°C) it can be approximated quite well by two linear functions shown in Fig. 2 and listed in Table 1. The differences in slopes corresponding to ΔE values for lower (<300°C) and higher temperatures (>300°C) may come from the quenching processes that decrease emission intensity. For comparison, the results obtained for YAG [8] arrange linearly on Arrhenius plot, as the ΔE value is constant. The difference between YAG and YAM matrices may come from the crystal lattice character. Since YAG has cubic formation, there is only one site that could be occupied by Y ions (substituted then by Re3 ions), whereas in YAM there are four possible sites making emission variation with temperature more complicated and therefore harder to predict. In fact, three sites should be considered. As two sites in YAM are very similar [9] and could be hard to distinguish. Some of our past low temperature measurements (at 10 K) seem to confirm this idea because even 0.3% doped samples of YAM characterized, by little nonexponentiality, and whose source could be in different lattice sites. Also, low temperature emission spectra of 4 F9∕2 state reveal three different sites of Y ion present in this host [5]. Another issue that cannot be ignored is growth of the kT value with temperature, which results in the activation of new CR channels. Many possible CR channels leading to de-excitation of 4 F9∕2 level in Dy:YAG were proposed in [10]. The CR process results in a faster decrease of emission intensity than it could be expected, e.g., from the multiphonon relaxation. Taking into account the probability of the observational error occurrence, the dependence based on theoretical ΔE value obtained from the energy difference between chosen emission lines have also been calculated and is presented in the lower part of Table 1. The respective sensor sensitivity is shown in Fig. 3. The resulting sensor sensitivity is expressed by the derivative: dR∕dT R⋅ ΔE∕kT2 and results for all temperature ranges are shown in Fig. 3. It can be seen that the sensitivity is highest for 600°C–800°C range and equals more than 3 × 10⁻³ °C−1 . When the theoretical ΔE value is applied in the Boltzmann equation, the maximum sensitivity is obtained for 600°C, however it should be remembered that this dependence does not agree entirely with measured values. In [3] results obtained for Dy:Al2 O3 are presented for temperatures up to 450°C. Although, we cannot refer much about those results because of a narrow temperature range, it can be seen that sensor sensitivities for temperatures below 300°C are in good agreement with our results, as well as the obtained ΔE values (0.8 × 10⁻³ °C−1 , 986 cm−1 in [3] and about 1.5 × 10⁻³ °C−1 , 1000 cm−1 in this work, see Figs. 2 and 3). Fig. 2. (Color online) Arrhenius plot of the intensity ratio temperature dependence. Fig. 3. (Color online) Temperature dependence of the predicted sensor sensitivity. 23°C < T < 300°C 300°C < T < 700°C ln R 1.5 − 1438.7∕ ln T 273 R 4.5⋅ exp −1438.7∕ R T 273 23°C < T < 700°C ln R 2.0 − 1709.4∕ T R 7.4⋅ exp −1709.4∕ T 2.4 − 1937.6∕ T 273 11.0⋅ exp −1937.6∕ T 273 R 273 273 5216 OPTICS LETTERS / Vol. 37, No. 24 / December 15, 2012 Fig. 4. (Color online) Temperature dependence of the decay times. The inset on the right shows the same dependence in the logarithmic scale, and the inset on the left shows the obtained sensor sensitivity. In [3] the authors measured the ΔE value also for higher concentrations (1% and 2%) and the ΔE values were growing. It is clear that it should be attributed to the growing probability of energy transfer processes (like the CR process), which is consistent with our explanation of two ranges with different ΔE values caused by activation of new CR channels. It has to be noted that we considered emission intensities as corresponding directly to the populations of the levels, that is I A ∕I B N A ∕N B . However, this assumption does not always have to be true. The CR process is an example of the exception to this rule. It can significantly decrease the intensity of emission (not whole population would be transferred to the lower level by radiative transition) while N parameters refer to the populations resulting from thermal equilibrium. At the same time the population of the second considered level would stay unchanged due to lack of any resonance transitions. Yet another source of difference between theoretical and experimental value of ΔE is the simplification in presented model assuming that there are only two electronic states (two discrete values of energy), which are considered as corresponding to 4 F9∕2 and 4 I15∕2 levels. The decay times were measured for the same temperature range. The effective decay time values increased from 486 μs for room temperature to 662 μs for 700°C. This is quite unique in rare earth doped materials, as so-called temperature quenching was expected to be observed. However, observed tendency is similar to the reported for Dy:YAB [11]. The authors note that there seems to be a specific behavior for dysprosium doped materials and explain the phenomenon by significantly different values of the rates of transitions from Stark components of 4 F9∕2 level. The experimental results together with obtained approximations and sensor sensitivity are presented in Fig. 4. It can be seen that decay times of Dy:YAM could be useful for temperature sensing for temperatures below 300°C, as the resulting sensor sensitivity is at least two orders of magnitude higher than that obtained for the FIR method. Above 300°C the sensitivity decreases fast with growing temperature, the τ T plot flattens. However, the very fast decrease of the decay times (resulting in high sensitivity) is observed for much higher temperatures, e.g., for Dy:YAG above 1100°C) [12]. Nevertheless, FIR method is much easier in application as no absolute values resulting from measurements are needed, making FIR method less prone to observational error and thus potentially more precise and reliable. In conclusion, there are four key points to present, (1) there are two parts of temperature ranges with different activation energies (1000 cm−1 for T < 300°C and 1347 cm−1 for T > 300°C), which could be caused by multisite effects and CR process; (2) increasing temperature causes activation of new CR channels due to rich energy level structure; (3) the sensor sensitivity for FIR method is highest for 600°C–800°C range and equals more than 3 × 10⁻³ °C−1 ; and (4) the decay time temperature characteristics can be used as temperature sensor only for temperatures below 300°C and above 1000°C. At the end of this work, the issue of the tradeoff between sensor sensitivity in FIR method and energy gap to be overcome by ion excitation needs to be mentioned. On the one hand, the higher energy gap is preferable due to larger resulting sensor sensitivity (steeper slope on Arrhenius plot), but on the other hand the larger the energy gap, the smaller the possibility of transferring electrons to a higher level. Taking both issues into account, it should be remembered that the main objective of the future research is not high sensor sensitivity, but the best combination of energy level structure and crystal lattice interaction, as it determines final efficiency of the sensor. The dysprosium doped materials have already been studied in some papers as they seem to be quite matched to the requirements posed. This work was supported by the Polish Ministry of Science and Higher Education Grant No. N N515 081537. References 1. S. W. Allison and G. T. Gillies, Rev. Sci. Instrum. 68, 2615 (1997). 2. A. R. Bugos, S. W. Allison, L. J. Dowell, and G. T. Gillies, in Conference Proceedings—IEEE SOUTHEASTCON (IEEE, 1990), Vol. 3, p. 877. 3. N. Rakov, L. R. A. Bispo, and G. S. MacIel, Opt. Commun. 285, 1882 (2012). 4. H. Yamane, M. Shimada, and B. A. Hunter, J. Solid State Chem. 141, 466 (1998). 5. Z. Boruc, B. Fetlinski, M. Malinowski, S. Turczynski, and D. Pawlak, Opt. Mater. 34 2002 (2012). 6. H. Yamane, M. Omori, A. Okubo, and T. Hira, J. Am. Ceram. Soc. 76, 2382 (1993). 7. T. Fukuda and V. I. Chani, eds., Advances in Materials Research 8, Shaped Crystals: Growth by Micro-PullingDown-Technique (Springer 2007). 8. J. P. Feist and A. L. Heyes, http://in3.dem.ist.utl.pt/ downloads/lxlaser2000/pdf/18_1.pdf. 9. Y. Rabinovitch, O. K. Moune, D. Tetard, and M. D. Faucher, J. Phys. Chem. A 108, 8244 (2004). 10. M. Klimczak, M. Malinowski, J. Sarnecki, and R. Piramidowicz, J. Lumin. 129, 1869 (2009). 11. G. Dominiak-Dzik, W. Ryba-Romanowski, L. Kovacs, and E. Beregi, Radiat. Meas. 38, 557 (2004). 12. M. R. Cates, S. W. Allison, S. L. Jaiswal, and D. L. Beshears, “YAG:Dy and YAG:Tm fluorescence to 1700 C,” Technical paper of ISA, 49th International Instrumentation Symposium, Orlando, Florida, USA, May 4–8, 2003, paper no. TP03AERO033.
© Copyright 2026 Paperzz