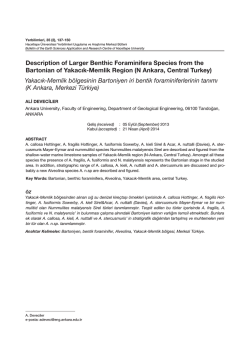
Tarım Bilimleri Dergisi
Journal of Agricultural Sciences
Dergi web sayfası:
www.agri.ankara.edu.tr/dergi
Journal homepage:
www.agri.ankara.edu.tr/journal
TARIM BİLİMLERİ DERGİSİ — JOURNAL OF AGRICULTURAL SCIENCES 20 (2014) 302-316
Tar. Bil. Der.
Development of a UV-based Imaging System for Real-Time Detection
and Separation of Dried Figs Contaminated with Aflatoxins
Ömer Barış ÖZLÜOYMAKa
a
Çukurova University, Faculty of Agriculture, Department of Agricultural Machinery, Adana, TURKEY
ARTICLE INFO
Research Article
Corresponding Author: Ömer Barış ÖZLÜOYMAK, E-mail: [email protected], Tel: +90 (322) 338 64 08
Received: 02 July 2013, Received in Revised Form: 08 January 2014, Accepted: 20 February 2014
ABSTRACT
The risks of diseases and economical losses resulting from aflatoxin contamination to the agricultural products are a
significant problem. In this study, a prototype system for real-time detection and separation of dried figs contaminated
with aflatoxins was developed and tested. The main components of the system are 365 nm wavelength UV light sources,
CCD cameras, optical sensors, image processing and automation software, belt conveyors that carry dried figs, and
automatic separation units in a dark room. Four UV black-light lamps were installed on the aluminum roof of both the
belt conveyor systems, to enhance the effectiveness of reflective illumination of the dried figs in the detection leg of
the process. The monitoring set up consisted of two cameras with high resolution and low distortion 9 mm lenses, and
two CCD color sensors. The imaging system, which had an exposure time of 8.12 ms, could capture images of dried
fig samples moving on the belt at speeds of 0.18 m s-1 and 0.06 m s-1 for belt 1 and belt 2, respectively. The system
uses two cameras, as both sides of the dried figs were required to be scanned. Figs contaminated with aflatoxins can
be separated pneumatically, by an automatic separation system. The prototype system was tested by using 400 dried
figs. The prototype system achieved a 98% success rate in the detection and separation of the dried figs contaminated
with aflatoxins. Turnover efficiency and hourly machine capacity of the system were calculated as 82% and 34.56 kg/h,
respectively. Additionally, total system efficiency was calculated as 80.36%. Thus, the system was found effective and
convenient for real-time detection and separation of the dried figs contaminated with aflatoxins.
Keywords: Aflatoxin detection; Dried fig; UV reflection; Real-time image processing
Aflatoksinli Kuru İncirlerin Gerçek Zamanlı Tespiti ve Ayrılması İçin
UV Görüntüleme Sisteminin Geliştirilmesi
ESER BİLGİSİ
Araştırma Makalesi
Sorumlu Yazar: Ömer Barış ÖZLÜOYMAK, E-posta: [email protected], Tel: +90 (322) 338 64 08
Geliş Tarihi: 02 Temmuz 2013, Düzeltmelerin Gelişi: 08 Ocak 2014, Kabul: 20 Şubat 2014
ÖZET
Tarımsal ürünlere aflatoksin bulaşmasından kaynaklanan hastalık riskleri ve ekonomik kayıplar önemli bir sorundur. Bu
çalışmada; gerçek zamanlı aflatoksinli kuru incirin tespiti ve ayrılması için bir prototip sistem geliştirilmiş ve denenmiştir.
Development of a UV-based Imaging System for Real-Time Detection and Separation of Dried Figs Contaminated..., Özlüoymak
Karanlık bir odada bulunan sistemin temel parçaları; 365 nm dalga boyuna sahip UV ışık kaynakları, CCD kameralar,
optik sensörler, görüntü işleme ve otomasyon yazılımları, kuru incirleri üzerinde taşıyan bantlar ile otomatik denetimli
ayırma üniteleri şeklindedir. Sürecin algılama bölümünde; kuru incirlerin ışık yansıtma etkinliğini arttırmak için, her
bir taşıyıcı bant sisteminde alüminyum bir çatı üzerine yerleştirilmiş dört adet UV siyah ışık lamba bulunmaktadır. İki
kameradan oluşan görüntüleme düzeneği; yüksek çözünürlüklü ve düşük bulanıklığa sahip iki adet 9 mm lens ve iki
adet CCD renkli algılayıcıdan oluşmaktadır. 8.12 ms’lik pozlama süresine sahip olan görüntüleme sistemi; görüntüleri,
hareket halindeki kuru incir örneklerinden 0.18 m s-1 birinci bant ve 0.06 m s-1 ikinci bant hızlarında alabilmektedir. Kuru
incirlerin her iki yüzeyini de tarayabilmek için, sistemde iki adet kamera kullanılmıştır. Aflatoksinli incirler; otomatik bir
ayırma sistemi kullanılarak, pnömatik olarak ayrılmıştır. Prototip sistem, 400 adet kuru incir kullanılarak test edilmiştir.
Prototip sistem, aflatoksinli kuru incirlerin saptanmasında ve ayrılmasında % 98 başarı oranına ulaşmıştır. Sistemin
çevirme etkinliği % 82, saatlik makine kapasitesi ise 34.56 kg h-1 olarak hesaplanmıştır. Bunlara ek olarak, toplam sistem
etkinliği % 80.36 olarak hesaplanmıştır. Böylece sistem, aflatoksinli kuru incirlerin gerçek zamanlı tespiti ve ayrılması
için etkili ve uygun bulunmuştur.
Anahtar Kelimeler: Aflatoksin tespiti; Kuru incir; UV yansıtma; Gerçek zamanlı görüntü işleme
© Ankara Üniversitesi Ziraat Fakültesi
1. Introduction
Aflatoxins, which are toxic metabolites of the
Aspergillus flavus and the Aspergillus parasiticus
fungi, are naturally occurring food contaminants.
Aflatoxins can affect a wide range of commodities
including cereals, oilseeds, spices and tree nuts, as
well as milk, meat and dried fruits (WHO 2005).
These fungi are capable of growing when the
conditions of temperature, relative humidity, and
moisture are favorable (Iamanaka et al 2007).
Well-known within the agricultural community,
aflatoxins have been studied for over forty years due
to their widespread occurrence and their significant
impact on the crops (WHO 2005). Aflatoxins are
considered to be the most toxic metabolites among
the mycotoxin classes, and pose a potential risk to
human and animal health. Aflatoxin B1 is known to
be a potent hepatocarcinogen for humans (Iamanaka
et al 2007). The World Health Organization (WHO)
hosted a workshop to create an integrated plan,
intended to generate culturally appropriate, long
term public health strategies, to reduce the aflatoxin
exposure in the developing countries (WHO 2005).
Aflatoxin was first reported in 1961 in peanuts.
Aflatoxin has been commonly associated with
peanuts, cereal grains, cotton seed meal, and milk
from animals that have consumed such seeds
(Buchanan et al 1975). Dried figs exported from
Turkey are sometimes rejected because of aflatoxin
contamination. If this issue is evaluated from
similar points of view for Turkey, the first study in
Turkey on aflatoxins in hazelnuts was conducted
in 1967. Shelled hazelnuts exported to Canada and
the United States of America were rejected because
they contained aflatoxins (Heperkan 2006).
Aflatoxigenic fungi grow on fig fruits during
their growth, ripening, and drying phases, but they
thrive especially during the ripening and the over
ripening phases. Toxigenic fungi may grow and
form aflatoxins on the outer surface or inside the
cavity even if no damage occurs on the skin. The
critical periods for aflatoxin formation in dried fig
fruits start with the ripening of figs on the tree. It
progresses during the over-ripening period, when
they lose water, shrivel and fall down onto the
ground, and continues until they are fully dried
on drying trays (Embaby et al 2012). Both the
skin and the inner cavity of the fig fruits can be
contaminated by the fungi. Fungal growth and the
subsequent mycotoxin production are influenced
by a variety of complex interactions between
intrinsic and extrinsic factors, as well as stress
factors and physical damage. The intrinsic factors
include moisture content or water activity (aw), pH,
redox potential (Eh), nutrient content (substrate),
inhibitors and osmotic pressure. The extrinsic
factors are related to environmental conditions such
as temperature, relative humidity (ERH) and gases
Ta r ı m B i l i m l e r i D e r g i s i – J o u r n a l o f A g r i c u l t u r a l S c i e n c e s
20 (2014) 302-316
303
Aflatoksinli Kuru İncirlerin Gerçek Zamanlı Tespiti ve Ayrılması İçin UV Görüntüleme Sisteminin Geliştirilmesi, Özlüoymak
in the environment. Factors promoting mycotoxin
production can differ from mould to mould. It has
been reported that mycotoxin production begins
on the tree. Even if the aw values during the drying
phase are found to be safe, rain or dew during drying
can lead to an increase in the moisture levels in the
dried figs. Further development of toxigenic fungi
and mycotoxin production can be observed in such
cases. Climatic conditions such as high humidity,
moderate temperatures and sudden rains may also
promote fungal growth. In addition to the drying
stage, storage is another important critical stage that
is susceptible to mycotoxin production (Heperkan
et al 2012).
It has been reported that dietary aflatoxin
exposure in parts of Africa and Asia has been
associated with primary liver cancer, especially
in hosts with chronic Hepatitis B Virus (HBV)
infection (Perz et al 2006).
In recent years, spectral imaging techniques
have been developed for scanning agricultural and
food products. Scientists use two main approachesthe line scan approach and the area scan approach,
for capturing spectral images (Qin et al 2012). The
line-scan image acquisition technique was used for
automated detection of pistachio defects by machine
vision (Pearson et al 2001) and in the eggplant
grading machine (Kondo et al 2005). Applications
based on the area-scan technique include detecting
peel defects, grading fruits based on surface defects,
and inspecting fecal contamination of animals.
The UV-fluorescence imaging technique has been
selected for detecting areas on dried figs that are
contaminated with aflatoxin (Özlüoymak 2012). For
this application, an important band (i.e., 365 nm) for
inspecting aflatoxin contamination was identified
during UV band selection (Steiner et al 1988).
A new method for separating pistachio nuts
contaminated with aflatoxins, based on processing
the picture under a 365 nm UV light was introduced
by using neural network (Karami & Mirabolfathy
2006). The UV absorption by aflatoxins was
monitored in a GY agar medium using UV
photography. In the UV photographs, aflatoxin-
304
producing molds were identified as gray or black
colonies, whereas moulds not producing aflatoxins
appeared as white colonies (Yabe et al 1987).
Nowadays, products contaminated with
aflatoxins are separated using traditional methods in
dark rooms by humans. These methods are laborintensive and require a lot of time. In the traditional
separating process, the emission of green radiation
by the figs contaminated with aflatoxins when
placed under UV light is beneficial. Being invisible
in daylight, aflatoxin contamination cannot be seen
without the aid of the UV light. Figs contaminated
with aflatoxins are separated manually.
The main aim of this study is to develop a
prototype real-time detection and separation system
for dried figs contaminated with aflatoxins.
2. Material and Methods
2.1. Material
2.1.1. Real-time detection and separation system to
manage aflatoxin contamination
A real-time detection and separation system
for aflatoxin contamination was designed,
manufactured and set up in a darkened laboratory
(Figure 1), as aflatoxin contamination can only be
seen in the dark, under UV lighting. The machine
has a small scale conveyor belt system, consisting
of optical inspection and pneumatic separation
units, in an empty chamber. In order to be able
to examine the effects of aflatoxins on the dried
figs for the determination of contamination, two
identical machines were produced. These machines
can transport dried fruits on the conveyor belt with
a 0.37 kW 3 phase 4 pole electric motor (GAMAK,
AGM714b), at an adjustable speed using component
drives (ABB micro drives, ACS150). The suitable
speed for the dried figs on the conveyor belt was
determined through experimentation.
Aflatoxin contamination can be found on both
sides of the fig. Being a flat fruit; the fig must be
checked on both sides. Consequently, the conveyor
belt system was designed to have two progressive
Ta r ı m B i l i m l e r i D e r g i s i – J o u r n a l o f A g r i c u l t u r a l S c i e n c e s
20 (2014) 302-316
Development of a UV-based Imaging System for Real-Time Detection and Separation of Dried Figs Contaminated..., Özlüoymak
Figure 1- Aflatoxin contaminated dried fig separating machine
Şekil 1- Aflatoksinli kuru incir ayırma makinası
stages. There are two belt conveyors in series. One
side of the fig is analyzed on the first belt conveyor.
When the fig proceeds to the second conveyor, it is
flipped and turned upside down. This facilitates the
inspection of the other side of the fig. Thus, with
the help of a dual conveyor belt system (Figure 2)
that facilitates the flipping of flat figs, both sides of
the fig can be inspected. A schematic diagram of the
aflatoxin contamination detection and separation
system is illustrated in Figure 3. Basically, it consists
of a system control unit, a lighting unit, a camera
unit, and a separation unit.
System control unit (SCU): The system
control unit comprises of a data acquisition card
(National Instuments, NI USB-6009), a computer
equipped with a fire-wire PCI card (Allied Vision
Technologies, FW-PCI3201), a relay card, a voltage
divider circuit card and a DC power supply. The
fruits passing in front of the optical sensor trigger
the camera. The captured images are then transferred
to the computer. According to the decision for dried
figs, pneumatic kickers could be controlled by
using the system control unit. The optical sensors
detecting the fruits generate an output signal. By
using the divider circuit card; this signal level, which
is sent to the cameras, was restricted to a maximum
of 5 V. According to their positions on the conveyor
belt in the field of view, images of moving dried figs
captured by the cameras can be sent to the computer.
Fire wire cables are used for transferring the image
data between the cameras and the computer. 8-pin
I/O cables (Allied Vision Technologies, 8-pin
HIROSE), compatible with AVT Guppy series, were
used for triggering the cameras. As seen in Figure 4,
the DC power supply, the UV lamps and the motor
drives can be controlled by using the LabVIEW
interface as well. A system software (Figure 4) was
developed for building real-time machine vision
applications by using the LabVIEW Professional
Development Module and the Vision Development
Module (National Instruments).
Ta r ı m B i l i m l e r i D e r g i s i – J o u r n a l o f A g r i c u l t u r a l S c i e n c e s
20 (2014) 302-316
305
Aflatoksinli Kuru İncirlerin Gerçek Zamanlı Tespiti ve Ayrılması İçin UV Görüntüleme Sisteminin Geliştirilmesi, Özlüoymak
Figure 2- Dual conveyor belt system designed for figs dried
Şekil 2- Kuru incir için tasarlanan çift bantlı taşıma sistemi
Figure 3- Schematic diagram of the aflatoxin contamination detection system
Şekil 3- Aflatoksin tespit sisteminin şematik gösterimi
306
Ta r ı m B i l i m l e r i D e r g i s i – J o u r n a l o f A g r i c u l t u r a l S c i e n c e s
20 (2014) 302-316
Development of a UV-based Imaging System for Real-Time Detection and Separation of Dried Figs Contaminated..., Özlüoymak
Figure 4- LabVIEW real-time user interface
Şekil 4- LabVIEW gerçek zamanlı kullanıcı arayüzü
The Lighting unit: The lighting unit, which
comprises of four 36W UV black-light lamps
(Philips, TL-D/08), is placed parallel to the moving
direction of the conveyor belt. A dome reflector,
which is constructed with aluminum, is located
above the UV lights to irradiate uniform reflectance
illumination onto the dried figs in the detection area.
The Camera unit: In area-scan imaging, a camera
is used to capture the image of a specific area. The
area-scan method was chosen because of its highly
configurable capabilities for acquiring, analyzing,
and logging images over a two-dimensional scanning
area for the detection of aflatoxin contamination.
9 mm lenses are chosen for the optical system for
the cameras. The cameras used in the system were
produced by Allied Vision Technologies and the
lenses were manufactured by FUJINON. To capture
color images, two identical FireWire (IEEE 1394a)
color cameras (AVT Guppy F-033 C) were used.
Each camera has a 1/3” CCD sensor (SONY IT CCD
ICX424AL/AQ), with a maximum resolution of 656
(H) x 494 (V) (full frames). To increase the real-time
detection accuracy, both cameras for the detection
system were fixed to work in Format 7-Mode 0,
Bayer RG 8 pixel format, with an exposure time of
8.12 ms. The frame capture rates of the cameras can
be moved up to 58 fps with a resolution of 656x494
(effective picture size-full frame). Cameras on the
system acquired images at 0.58 fps for belt 1 and
0.28 fps for belt 2, respectively. The time required
for the image processing in the system was 2.456 ms,
on the developed software. The image processing
process was repeated a 1000 times on a trial basis
to ensure the accuracy of the imaging system time.
A Dell Studio XPS 435MT desktop computer was
used for the system software. This computer has
an Intel Core i7 CPU and image processing was
achieved on this machine. It should be noted that
the time required for the image processing process
may vary from processor to processor according to
the computer’s processor speed. The focal length of
the camera unit was 9 mm, and the working distance
(the distance between the lens and the top of the
sample being observed) was 160 mm. The imaging
Ta r ı m B i l i m l e r i D e r g i s i – J o u r n a l o f A g r i c u l t u r a l S c i e n c e s
20 (2014) 302-316
307
Aflatoksinli Kuru İncirlerin Gerçek Zamanlı Tespiti ve Ayrılması İçin UV Görüntüleme Sisteminin Geliştirilmesi, Özlüoymak
Figure 5- Pneumatic separation unit wiring diagram
Şekil 5- Pnömatik ayırma ünitesi devre şeması
Figure 6- Pneumatic controlled separation unit
Şekil 6- Pnömatik kontrollü ayırma ünitesi
system’s view area was calculated as 91.1 mm x
68.6 mm with a spatial resolution of 7.2 pixels mm-1
(182.88 dpi). The imaging system does not capture
regions outside of the camera’s sight. Besides, an
optical sensor (SICK, MHT15-P2347) was used to
trigger the cameras.
The Separation unit: In order to remove the dried
figs contaminated with aflatoxins from the conveyor
belt system, a pneumatically controlled separation
unit was designed and fabricated for each line. The
equipment of the separation unit comprises of an
308
optical sensor (SICK, MHT15-P2347), a pneumatic
cylinder (TEKMAK), an electro-pneumatic
converter (STNC, TG2521-08), a lubricator (STNC,
TC 2010-02), and an air compressor (Typhoon,
TW2501-24). This unit was designed for each line
to operate separately and independently from each
other and the pressure line of both conveyor belts
was fed from its own resources. The wiring diagram
of the pneumatic separation unit is shown in Figure
5. The separating system is controlled by the System
Control Unit (SCU), and each line is equipped with
Ta r ı m B i l i m l e r i D e r g i s i – J o u r n a l o f A g r i c u l t u r a l S c i e n c e s
20 (2014) 302-316
Development of a UV-based Imaging System for Real-Time Detection and Separation of Dried Figs Contaminated..., Özlüoymak
Figure 7- Fluorescence excitation and emission principle (NI 2008)
Şekil 7- Floresans uyartım ve saçınım prensibi (NI 2008)
a pneumatic kicker triggered by an optical sensor
(Figure 6) using the system software.
2.2. Methods
2.2.1. Automated fluorescent imaging techniques
There are many benefits to using fluorescence
instead of the regular visible light. Firstly, the
basic principles of fluorescence excitation and
emission must be known. Fluorescent compounds
or fluorophores are capable of absorbing light
at one wavelength and emitting light at a longer
wavelength. When a fluorescent compound absorbs
a photon, it’s outer shell of electrons move from
a ‘ground’ state to an ‘excited’ state. It can both
release this energy as thermal radiation and return
to the ground state, or it can release part of the
energy to its molecular environment and then emit a
photon with less energy and consequently a longer
wavelength (NI 2008).
As mentioned, the light emitted as fluorescence
is at a higher wavelength (lower energy) than the
incoming excitation light. This concept is illustrated
in Figure 7. The biggest advantage of using the
fluorescence method is the ability to detect extremely
small amounts. This is because fluorescence, with
the appropriate filters, measures a light source on a
perfectly black background (NI 2008).
In this system, the dried figs were exposed to
the 365 nm wavelength UV light source. Thus,
aflatoxin on the diseased fruits emitted a longer
wavelength by absorbing the light. Thus aflatoxins,
which are invisible in daylight (outside the limits of
human vision), were rendered visible. Regions with
aflatoxin become visible, radiating bright greenish
yellow fluorescence under UV light (365 nm).
2.2.2. Image processing and classification method
Figure 8 summarizes the image processing
and classification algorithms for the detection
of aflatoxin contamination in dried figs. After
acquiring the original images from the cameras,
image buffering functions of the system software
are used for retrieving again to image masking
images. To segregate aflatoxin contaminated areas,
the thresholding method is applied to the image after
image buffering. Image masking is applied to the
acquired binary image, which is obtained by using
the binary image inversion method. A dried fig mask
image is produced when applying original fruit
Ta r ı m B i l i m l e r i D e r g i s i – J o u r n a l o f A g r i c u l t u r a l S c i e n c e s
20 (2014) 302-316
309
Aflatoksinli Kuru İncirlerin Gerçek Zamanlı Tespiti ve Ayrılması İçin UV Görüntüleme Sisteminin Geliştirilmesi, Özlüoymak
images and aflatoxin contaminated area images.
A final decision is then taken on the condition of
aflatoxin contamination in the fig, after applying all
the image processing processes. The times required
for determining and separating dried figs with
aflatoxin contamination were 1.83 s for belt 1 (at
belt speed of 0.18 m s-1) and 2.73 s for belt 2 (at belt
speed of 0.06 m s-1), respectively.
belong to a gray-level interval, called the threshold
interval, and setting all other pixels in the image
to black (NI 2006). Object and background pixels
have intensity values grouped into two dominant
modes. One obvious way to extract the objects from
the background is to select a threshold, T, which
separates these modes. Then, any point (x,y) in the
image at which f(x,y) > T is called an object point.
Otherwise, the point is called a background point. In
other words, the segmented image, g(x,y), is given
by
g ( x, y ) = 1
g ( x, y ) = 0
⇒ f ( x, y ) > T ⇒ f ( x, y ) ≤ T (1)
(2)
Where; g(x,y) is the processed image obtained by
using thresholding method; f(x,y) is the pixel value
of the image on the xth column and yth row; T is
the selected thresholding value (Gonzalez & Woods
2007). The resulting image is referred to as a binary
image. For color images, three thresholds must be
specified, one for each color component.
A sample is considered as having aflatoxin
contamination if there are remaining red pixels in
the final image. Decision on the level of aflatoxin
contamination is taken according to the calculated
diseased area in the form of pixels and number of
particles with aflatoxin. Otherwise, the system
decision about the sample is uncontaminated.
2.2.3. Real-time aflatoxin detection for dried fig
samples
Figure 8- The flowchart of program used for
detection of dried figs contaminated with aflatoxin
Şekil 8- Aflatoksinli kuru incirlerin tespitinde
kullanılan program akış şeması
In this study, the most well-known “image
thresholding method” among the image processing
techniques was used. Thresholding consists of
segmenting an image into two regions-a particle
region and a background region. In its simplest form,
this process works by setting to white all pixels that
310
The aforementioned image processing and
classification methods were ratified by determining
aflatoxin affected regions on dried figs. As
shown in Figure 9, to accomplish the detection
of aflatoxin contamination, real-time decision
procedures for dried fig samples moving on the
conveyor belt were developed. The output trigger
signals produced by the optical sensors activated
the cameras and then the captured images were
transferred from one sample to the computer.
Only one surface of the fig (e.g., ‘X’, or ‘Y’) was
captured by each camera (Figure 9). Decision
for each conveyor belt was independent and the
kickers were controlled according to this decision,
Ta r ı m B i l i m l e r i D e r g i s i – J o u r n a l o f A g r i c u l t u r a l S c i e n c e s
20 (2014) 302-316
Development of a UV-based Imaging System for Real-Time Detection and Separation of Dried Figs Contaminated..., Özlüoymak
Figure 9- The real-time decision procedure for dried figs in action
Şekil 9- Hareket halindeki kuru incirler için gerçek zamanlı karar verme yöntemi
to separate the figs with aflatoxin contaminated. If
the result for a fig sample was ‘Uncontaminated’,
it would pass the kickers and drop to a bin at the
end of the line. If the result for a fig sample was
‘Aflatoxin Contaminated’, the fig sample would
be kicked off the belt conveyor.
It should be noted that only the front or the back
faces of each fruit could be covered by each camera
unit. In the course of the experiment, several dried
figs were placed on the first conveyor belt, moving
at a speed of 0.18 m s-1. To provide for an accurate
return action of the fruit, the second conveyor belt
was set to move at a speed of 0.06 m s-1. Thus,
images of the diseased areas on the fig could be
captured when the figs were moving on the conveyor
belt. As the samples were being placed one by one
manually on the conveyor belt and as the surface
inspection was only partial, the system didn’t fulfill
the real-life requirements for aflatoxin inspection.
In this study, the author has tried to design a new
system for the detection of aflatoxin contamination.
The main aim was to test the effectiveness of the
methodology and the suitability of the software
and hardware of the prototype. In the future, by
considering the new modifications for the detection
system (e.g., by using side-angle cameras per unit to
scan lateral sides of the figs), the inspection capacity
of the system will be increased for the entire surface
of each fig.
2.2.4. The preparation of dried fig samples
The real-time aflatoxin contamination detection
system was tested using dried figs (Ficuscarica).
Fruit samples were obtained from an exporting
company in İzmir, Turkey at the end of the drying
season of 2012. The samples with healthy surfaces,
and diseased surfaces were manually separated
by human inspectors in the company. The dried
fig samples were separated into two categories as
‘Contaminated’ and ‘Uncontaminated’. 200 diseased
dried figs were selected from the ‘Contaminated’
class, and 200 healthy dried figs were selected for
the ‘Uncontaminated’ class. Thus a total of 400
dried figs were tested on the developed system.
Prior to the tests, the fig samples were stored in a
refrigerator at a temperature of 4 ˚C. About 1 hour
before the test, the figs were removed from the
refrigerator so that they were in equilibrium with
the room temperature.
3. Results and Discussion
3.1. Image processing results
Fluorescent sorting with the image processing
algorithms was examined and aflatoxin contaminated
figs with the property of “bright greenish yellow”
fluorescent excitation were determined. To recognize
the “bright greenish yellow” color of contaminated
figs, a dark room was designed with 365 nm
Ta r ı m B i l i m l e r i D e r g i s i – J o u r n a l o f A g r i c u l t u r a l S c i e n c e s
20 (2014) 302-316
311
Aflatoksinli Kuru İncirlerin Gerçek Zamanlı Tespiti ve Ayrılması İçin UV Görüntüleme Sisteminin Geliştirilmesi, Özlüoymak
Figure 10- Sample photographs taken for detection of aflatoxin formation on dried figs
Şekil 10- Kuru incirler üzerindeki aflatoksin oluşumunun tespiti için çekilen örnek fotoğraflar
wavelength UV lamps, and sample images were
taken with the camera. After the capturing process,
pictures of figs with aflatoxin contamination were
analyzed and the areas with aflatoxin were detected
using digital image processing techniques.
Aflatoxins radiate by showing phosphorescent
properties on the wavelength of 365 nm. As shown
in Figure 10(a) and (b), in the photos taken in
daylight, no difference can be seen between the
figs. However, as shown in Figure 10 (c) and (d),
in the pictures of the same fruits captured in a dark
environment with UV lighting, areas on the figs
contaminated with aflatoxins became visible. In
other words, while healthy figs didn’t radiate under
the UV lighting, contaminated figs radiated “bright
greenish yellow” color.
312
The color thresholding method was applied
to obtain images in the RGB (Red, Green, Blue)
format. A new image was obtained by overlaying
the threshold image back onto the original image.
This process is known as “masking” in the image
processing parlance. In this way, the masking
process was completed by overlapping the original
image and the processed image. Color parameters
used in the system were determined for the red color
in the range of 0-255, for the green color in the
range of 0-155, and for the blue color in the range
of 0-180. The combination of these color parameters
provided the thresholding value of the system for
“bright greenish yellow” color. This process was
performed in Labview for 2.456 ms, by looking for
areas over a certain threshold fluorescence that were
greater than a certain threshold mass.
Ta r ı m B i l i m l e r i D e r g i s i – J o u r n a l o f A g r i c u l t u r a l S c i e n c e s
20 (2014) 302-316
Development of a UV-based Imaging System for Real-Time Detection and Separation of Dried Figs Contaminated..., Özlüoymak
Figure 11- Identification of aflatoxin contamination on the dried fig using thresholding method
Şekil 11- Eşikleme yöntemi kullanılarak kuru incir üzerindeki aflatoksinin saptanması
Figure 11 demonstrates the major processes of
the image processing and classification method for
identifying aflatoxin contamination. The masked
image was obtained from the thresholded image,
and the background of the original image was
removed. Aflatoxin contamination of the fig was
marked with red in the masked image and other
areas (e.g., dried fig peel, background of conveyor
belt, and some other defects and diseases) were
darker than the aflatoxin contaminated areas.
Threshold values as mentioned above were decided
by the experience gathered in the pilot study on
fixed and moving dried figs on the conveyor belt.
At the end of the thresholding process, most of the
dried fig surface areas disappeared in the binary
image. Unwanted areas such as normal fig peel,
background of the conveyor belt, and some other
defects and diseases were successfully eliminated,
and as a result, they were turned into black. Only
aflatoxin contaminations remained as red areas in
the final image of classification. While the sample
moved on the conveyor belt, images of both sides of
the fruit were acquired. Evidently, only the aflatoxin
contamination remained in the final images.
Normal dried fig surfaces, background of the
conveyor belt, and some other defects and diseases
were not detected. ‘Aflatoxin contaminated’ and
‘Uncontaminated’ decisions were given according
to the final images of the dried figs.
Healthy and aflatoxin contaminated dried figs
were examined graphically in the range of 0-255
color space, thus differences were observed by
using color histograms. While the x-axis referred
Ta r ı m B i l i m l e r i D e r g i s i – J o u r n a l o f A g r i c u l t u r a l S c i e n c e s
20 (2014) 302-316
313
Aflatoksinli Kuru İncirlerin Gerçek Zamanlı Tespiti ve Ayrılması İçin UV Görüntüleme Sisteminin Geliştirilmesi, Özlüoymak
Figure 12- Identification of healthy fig samples on the color space
Şekil 12- Renk uzayında sağlıklı incir örneklerinin saptanması
Figure 13- Identification of aflatoxin contaminated fig samples on the color space
Şekil 13- Renk uzayında aflatoksinli incir örneklerinin saptanması
to the color intensity, the y-axis referred to the
number of pixels (pixel density) for each chart. The
results of the study show that, healthy and aflatoxin
contaminated figs have similar characteristic charts
among themselves. The graphs obtained (Figure
12 and Figure 13) are similar in structure with the
studies of BT (2006) and RPBS (2009).
314
3.2. System classification efficiency results
The system classification efficiency results are
summarized in Table 1 to distinguish between
aflatoxin contaminated dried figs and samples without
aflatoxin contamination. As seen in the table, 96%
of the aflatoxin contaminated figs were accurately
classified into the ‘Aflatoxin Contaminated’ class.
Ta r ı m B i l i m l e r i D e r g i s i – J o u r n a l o f A g r i c u l t u r a l S c i e n c e s
20 (2014) 302-316
Development of a UV-based Imaging System for Real-Time Detection and Separation of Dried Figs Contaminated..., Özlüoymak
Table 1- System classification efficiency results for dried figs contaminated and uncontaminated with
aflatoxin
Çizelge 1- Aflatoksinli ve aflatoksinsiz kuru incirler için sınıflandırma ve sistem etkinliği sonuçları
Class
Number
(Surface condition)
Contaminated
(n=200)
Uncontaminated
(n=200)
200
Identification
and separation
efficiency (%)
*
Misclassified
8
Turnover
efficiency
(%)
Total system
efficiency
(%)
Hourly machine
capacity (kg h-1)
82
80.36
34.56
96
200
0
100
400
8
98
, since the main purpose of the study was about detecting and separating of aflatoxin contaminated dried figs, the conveyor turnover
efficiency was omitted for the classification experiments.
*
8 samples among 200 aflatoxin contaminated dried
figs were incorrectly classified. Classifying of the
200 samples in the ‘Uncontaminated’ class was
100%. Identification and separation efficiency was
98% during the test. There were red pixels in the final
images after applying real-time image procedures to
the aflatoxin contaminated dried figs. Identification
and separation efficiency, turnover efficiency,
hourly machine capacity and total system efficiency
are also listed in Table 1. As listed in Table 1, total
system efficiency of the system was calculated as
80.36% by multiplying the identification and the
separation efficiencies with the turnover efficiency.
Optimal operating parameters before calculating
the turnover efficiency was obtained by determining
the different falling heights between belt conveyors
and considering the speed combinations of the belts
together. According to the results obtained from
experimental data, the first belt had to be faster than
the second one. Turnover efficiency of the system
was calculated as 82% under these conditions.
Parameters affecting the dried fig turnover efficiency
were, the size of the dried fig belt conveyor contact
area, the location of the center of gravity of the dried
figs and the sticking effect of the figs (resulting from
the natural properties of figs).
According to the operating parameters
(different falling heights between belt conveyors,
speed combinations of the belts, etc.), hourly
machine capacity of the system was calculated as
34.56 kg h-1, which is listed in Table 1.
4. Conclusions
A real-time aflatoxin contaminated dried fig
detection and separation system was developed at
the wavelength of 365 nm. Dried figs were irradiated
with a UV light source in a dark environment and
abnormal reflection of aflatoxin contaminated
figs was identified using cameras. A special
software was created to identify the contaminated
products at the time of transferring images to the
computer. Aflatoxin contaminated products were
photographed by using cameras under the UV light
sources, the captured images were transferred to
the computer using image processing techniques,
and aflatoxin contamination was detected. Finally,
two certain decisions-‘Aflatoxin contaminated’
and ‘Uncontaminated’ for dried figs were given for
the final images. The average system classification
efficiency was 98% for 400 dried figs.
The detection performance could be enhanced
by using more cameras. Consequently, fruit surfaces
could be scanned completely and inspection of
contaminated figs could be achieved successfully in
future works. In further investigations, operational
efficiency and capacity could be increased by
using multiple channels in these systems, instead
of feeding the line with a single row. Choosing
aflatoxin contaminated figs from the line, where all
figs (aflatoxin contaminated and uncontaminated)
are moving on the conveyor belt together, could be
Ta r ı m B i l i m l e r i D e r g i s i – J o u r n a l o f A g r i c u l t u r a l S c i e n c e s
20 (2014) 302-316
315
Aflatoksinli Kuru İncirlerin Gerçek Zamanlı Tespiti ve Ayrılması İçin UV Görüntüleme Sisteminin Geliştirilmesi, Özlüoymak
another approach by using a special robotic arm and
image processing techniques. Besides, the turnover
efficiency could be increased through innovations in
the turnover unit.
Karami M A & Mirabolfathy M (2006). Neural Network
to Separate Aflatoxin Contaminated Pistachio Nuts.
Proc. IVth IS Pistachios and Almonds, Acta Hort.
726: 605-610
This study will be a model for researchers, who aim
to work on similar topics, and it will have a positive
effect on system design in many different areas.
Kondo N, Chong V K, Ninomiya K, Nishi T, Monta M &
NAMBA K (2005). Application of NIR-Color CCD
Camera to Eggplant Grading Machine. ASAE Annual
International Meeting, Paper Number: 056073: 1-9
Acknowledgements
NI (2006). National Instruments Tutorial, Thresholding
an Image. http://zone.ni.com/ devzone/cda/tut/p/
id/2916#toc0#toc0 (Access date: 06.09.2007)
The author gratefully acknowledges the financial
support of Republic of Turkey Ministry of
Science, Industry and Technology and AKYUREK
Technology Company. The author would also like
to thank Prof. Dr. Emin GÜZEL of University of
Çukurova, for his help and support in building this
detection and separation system.
References
BT (2006). Bioscope Test: Dried Figs – Aflatoxin
Detection. Bioscope Fig Test. Sample Comparison
between Normal Figs and Figs With Aflatoxin,
France, December 16
Buchanan J R, Sommer N F & Fortlage R J (1975).
Aspergillus flavus Infection and Aflatoxin Production
in Fig Fruits. American Society for Microbiology,
Applied Microbiology 30(2): 238-241
Embaby E M, Hagagg L F & Abdel-Galil M M (2012).
Decay of Some Fresh and Dry Fruit Quality
Contaminated by Some Mold Fungi. Journal of
Applied Sciences Research 8(6): 3083-3091
Gonzalez R C & Woods R E (2007). Digital Image
Processing Third Edition. Pearson International
Edition prepared by Pearson Education.
Heperkan D (2006). The importance of mycotoxins and a
brief history of mycotoxin studies in Turkey, Special
issue “Mycotoxins: hidden hazards in food”. ARI
Bulletin of IstanbulTechnical University 54, 18‒27
Heperkan D, Moretti A, Dikmen C D & Logrieco A F
(2012). Toxigenic fungi and mycotoxin associated
with figs in the Mediterranean area. Phytopathologia
Mediterranea 51(1) 119−130
Iamanaka B T, Menezes H C, Vicente E, Leite R S F
& Taniwaki M H (2007). Aflatoxigenic fungi and
aflatoxins occurrence in sultanas and dried figs
commercialized in Brazil. Food Control 18(2007):
454-457
316
NI (2008). National Instruments Tutorial, Automating
Fluorescent Imaging Techniques. http://www.ni.com/
white-paper/3034/en/ (Access date: 28.11.2013)
Özlüoymak Ö B (2012). A Research on Separation
System Design of Aflatoxin Contaminated Dried Fig.
PhD Thesis, Çukurova University, Institute of Natural
and Applied Sciences, Department of Agricultural
Machinery (Unpublished), Adana, Turkey
Pearson T C, Doster M A & Michailides T J (2001).
Automated Detection of Pistachio Defects by
Machine Vision. Applied Engineering in Agriculture
17(5): 729–732
Perz J F, Armstrong G L, Farrington L A, Hutin Y J F
& Bell B P (2006).The contributions of hepatitis B
virus and hepatitis C virus infections to cirrhosis
and primary liver cancer worldwide. Journal of
Hepatology 45(2006) 529–538
Qin J, Burks T F, Zhao X, Niphadkar N & Ritenour M A
(2012). Development of a two-band spectral imaging
system for real-time citrus canker detection. Journal
of Food Engineering 108: 87-93
RPBS (2009). Rapid Prescreening of Biological Systems.
Measurement of Bioharmonic Signals, Business
Summary Quarter
Steiner W E, Rieker R H & Battaglia R (1988).
Aflatoxin Contamination in Dried Figs: Distribution
and Association with Fluorescence. Journal of
Agricultural Food Chemistry 36(1): 88-91
WHO (2005). Public Health Strategies for Preventing
Aflatoxin Exposure. http: // www.who. int/ipcs/
events/ 2005/ workshop_report.pdf, (Access date:
25.10.2007)
Yabe K, Ando Y, Ito M & Terakado N (1987). Simple
Method for Screening Aflatoxin-Producing Molds
by UV Photography. Applied and Environmental
Microbiology 53(2): 230-234.
Ta r ı m B i l i m l e r i D e r g i s i – J o u r n a l o f A g r i c u l t u r a l S c i e n c e s
20 (2014) 302-316
© Copyright 2026 Paperzz