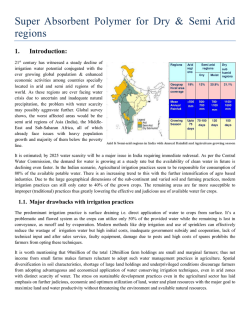
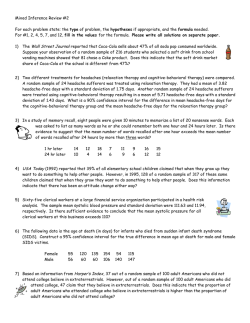
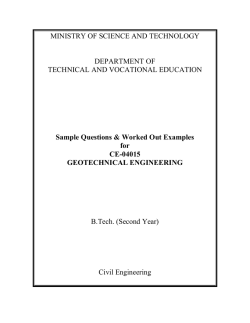
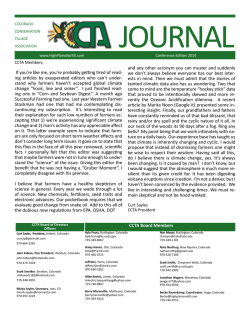
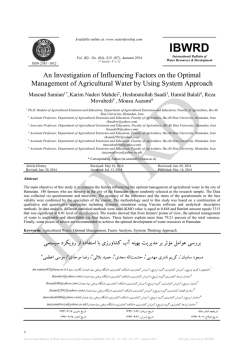
Journal of Agricultural Sciences
Dergi web sayfası:
www.agri.ankara.edu.tr/dergi
Journal homepage:
www.agri.ankara.edu.tr/journal
Tar. Bil. Der.
Mass Balance Criteria in Soil Salinity Management: Different
Irrigation Water Qualities and Leaching Ratio
Engin YURTSEVENa, Hasan Sabri ÖZTÜRKb, Sertan AVCIa
a
Ankara University, Faculty of Agriculture, Department of Farm Structures and Irrigation, Ankara, TURKEY
b
Ankara University, Faculty of Agriculture, Department of Soil Science and Plant Nutrition, Ankara, TURKEY
ARTICLE INFO
Research Article
Corresponding Author: Engin YURTSEVEN, E-mail: [email protected], Tel: +90 (312) 596 12 08
Received: 21 August 2013, Received in Revised Form: 23 December 2013, Accepted: 8 January 2014
ABSTRACT
The accumulation of excess soluble salts in the root zone of arid and semiarid irrigated soils is a widespread problem
that seriously affects crop productivity. The cultivated soil profile under irrigation is the main media in which the
salinization occurs. In this study, the effects of different irrigation water salinity and leaching ratio on soil profile salt
mass balance changes were investigated in alfalfa (Medicago sativa L.) cultivated PVC lysimeters (115 cm in height and
40 cm diameter). Three irrigation water salinity (S1, S2, and S3, 0.25, 1.5 and 3.0 dS m-1, respectively) and four leaching
ratios, LF, (10%, 20%, 35% and 50% more water than ET) levels were used in a fully randomized factorial design
experiment with three replications. The total salt mass balance was calculated from the subtraction of total salt mass
concentration supplied with irrigation water and total salt mass concentration washed out with the drainage water. When
the salinity content of irrigation water increased leaching of SO42- and Cl- accumulation in the soil increased. Increase in
the leaching ratio (LF) caused increase in the leaching of Cl- through the soil profile. The major cations, Ca2+, Mg2+, and
Na+, in the soil were also evaluated for their total mass concentrations regarding salinity content of irrigation water and
LF. Ca2+ concentration in the soil profile increased with salinity level and the leaching ratio, whereas Mg2+ and Na+ mass
concentrations decreased considerably. This is due to the high Ca2+ adsorption in the soil than that of Na+. The effect of
LF on the ion mass accumulation or leaching varied depending on the ion type.
Keywords: Solute transport; Leaching; Soil salinity; Soil mass balance; Column experiment
Toprak Tuzluluğu Yönetiminde Tuz Dengesi Kavramı: Farklı Sulama
Suyu Tuzluluğu ve Yıkama Oranı
ESER BİLGİSİ
Araştırma Makalesi
Sorumlu Yazar: Engin YURTSEVEN, E-posta: [email protected], Tel: +90 (312) 596 12 08
Geliş Tarihi: 21 Ağustos 2013, Düzeltmelerin Gelişi: 23 Aralık 2013, Kabul: 8 Ocak 2014
ÖZET
Kurak ve yarı-kurak alanlarda toprakta biriken fazla tuzlar yaygın bir sorun olarak karşımıza çıkmaktadır. Tarım
alanlarında tuzlulaşmanın meydana geldiği temel ortam sulanan alanlardır. Bu çalışmada, farklı sulama suyu tuzluluğu ve
TARIM BİLİMLERİ DERGİSİ — JOURNAL OF AGRICULTURAL SCIENCES 20 (2014) 103-111
Tarım Bilimleri Dergisi
Mass Balance Criteria in Soil Salinity Management: Different Irrigation Water Qualities and Leaching Ratio, Yurtseven et al
yıkama oranlarının toprak profilindeki tuz dengesine olan etkileri, yonca (Medicago sativa L.) yetiştirilen PVC kolonlarda
(115 cm uzunluğunda ve 40 cm çapında) incelenmiştir. Çalışmada 3 sulama suyu tuzluluğu (0.25, 1.5 ve 3 dS m-1 sırasıyla
S1, S2, and S3) ve 4 yıkama oranı (gereğinden % 10, 20, 35 ve 50 daha fazla sulama suyu) konuları 3 tekrarlamalı olarak
tesadüf parsellerinde faktöriyel deneme şeklinde denenmiştir. Profildeki tuz dengesi, sulama suyu ile sağlanan toplam
tuz miktarından, drenaj suyu ile dışarı atılan miktarın farkından hesaplanmıştır. Sulama suyunun tuz içeriği artıkça, fazla
miktardaki Cl- nedeniyle topraktan SO42- yıkanması artmış ancak HCO3- artmamıştır. Çözünebilir anyonlardan SO42profilden yıkanırken Cl-, sulama suyu tuzluluğunun artmasına bağlı olarak birikmiştir. Yıkama oranının artması toprak
profildeki Cl- yıkanmasına neden olmuştur. Toplam tuz dengesi, topraktaki başat katyonlar için de (Ca2+, Mg2+, ve Na+)
sulama suyunun tuz konsantrasyonu ve yıkama oranına göre değerlendirilmiştir. Toprak profilindeki Ca2+ miktarı sulama
suyu tuzluluğu ve yıkama oranlarına bağlı olarak artma gösterirken, Mg2+ ve Na+ dengesi önemli bir şekilde azalmıştır.
Bu Ca2+ ‘un Na+’a göre toprakta daha fazla tutulması nedeniyledir. Genelde yıkama oranlarının tuz dengesi üzerine etkisi
iyonlara bağlı olarak değişiklik göstermektedir.
Anahtar Kelimeler: Çözelti hareketi; Yıkama; Toprak tuzluluğu; Toprak tuz dengesi; Kolon denemesi
© Ankara Üniversitesi Ziraat Fakültesi
1. Introduction
Increasing pressure on agricultural food production
in semiarid areas forces the farmers use marginal
quality of irrigation water. On the other hand,
irrigation solely guarantees sustainable production
in such area. After using low quality irrigation water
for many years, soil salinization, ultimately, has
become the key factor challenging sustainability.
Irrigation has long played a key role to produce
food, feed, and fiber to meet the needs of the
expanding world population (Oster et al 2012).
The water scarcity and some other problems such
as water-logging, salinization, and soil and water
quality degradation are threatened the future of
irrigated agriculture. For sustainable irrigation,
innovative and more efficient agricultural water
management development is required. Particularly,
avoiding of some applications as disposing of saline
drainage waters into surface waters or onto lands is
a primary event of salinization and soil and water
quality degradation (Skaggs et al 2006).
Water is an essential element in one’s life by
sustaining the economic development and growth.
Therefore, anywhere in the world sustainability of
maintaining a safe and dependable water supply
would be more important (Hutson & Ickert 2012).
The excess soluble salts accumulated in the root
zone of arid and semiarid irrigated soils is a common
problem that seriously affects crop productivity all
104
around the world. According to Corwin et al (2007)
the evapotranspiration is the essential mechanism
causing the accumulation of salt in the soil, to be
concentrated salts in the remaining soil water. Soil
salinity affects plants in different ways; loss of stand,
reduced plant growth and yield, and even worst
crop failure. Salinity reduce plant water uptake by
increasing the osmotic pressure so it would more
difficult for the plant to extract water. Excessive
concentrations of some specific ions may also cause
ion toxicity or spoil the nutritional balance of plants.
A considerable part of world’s total food and
fiber (35-40%) in encountered from the irrigated
agriculture, and all around the world, roughly half
of all irrigated soils is affected by soil salinity,
and almost 20 million ha of this amount is heavily
affected by salinity (Rhoades & Loveday 1990). To
prevent the accumulation of excessive soluble salts
in irrigated soils, more water than required to meet
the evapotranspiration needs of the crops must pass
through the root zone to leach excessive soluble
salts. This additional irrigation water has typically
been expressed as the leaching requirement (LR)
(Richards 1954; Rhoades 1974).
The total ion concentration leached out from
the soil profile is strictly dependent on the leaching
water amount applied and the management practices
of the LR. The remain concentration of soluble salts
after leaching water passed through the soil profile,
caused soil salinity at the end of the irrigation
Ta r ı m B i l i m l e r i D e r g i s i – J o u r n a l o f A g r i c u l t u r a l S c i e n c e s
20 (2014) 103-111
Toprak Tuzluluğu Yönetiminde Tuz Dengesi Kavramı: Farklı Sulama Suyu Tuzluluğu ve Yıkama Oranı, Yurtseven et al
period. The differentiation of the total concentration
leached and total concentration added also with the
irrigation water, called mass balance and resulted
the total salt remaining in the soil profile. Added
and leached salt concentrations are being calculated
by using the soluble salt concentrations of the
irrigation water and drainage water, which is passed
through the soil profile and leached ions from the
profile (Richards 1954; Zhong 2011). The plant
uptake of the salt constituents such as Na+, Ca2+,
Mg2+, generally are not taken into consideration but,
might be important amount of uptake by the plants
(Zhong 2011). And different salinity constituents
play different role to be uptaken by plants; While
some of them (Mn, Na+) could be taken easily, some
(K+, Mg2+) are not (Al-Absi et al 2009). Yıldız &
Terzi (2011) researched twelve cultivars of barley
(Hordeum vulgare L.) subjected to different NaCl
concentrations and classified according to their salt
tolerance at early seedling stage.
In this study, the total mass balance calculated
using the differentiation of the total ion concentration
that entering into the soil profile with the irrigation
water and leached out from the profile with drainage
water which is the water percolated and went out
from the end point of the soil columns. During the
calculation the ion concentration used by the crop
roots by taking them into the body is neglected.
2. Material and Methods
The outdoor lysimeter system used in this study
located at the experimental field of Ankara University,
Ankara, Turkey. The experiments were conducted
in PVC lysimeters (115 cm in height and 40 cm in
diameter) cultivated with alfalfa (Medicago sativa L.).
The soil used was taken from the experimental field,
sieved from 2 mm sieve and filled up homogenously
for all the columns considering their original bulk
density. The physical and chemical characteristics of
the soil are given in Table 1.
The soil texture is sandy clay loam with the bulk
density of 1.31 g cm-3. The soil was irrigated ten
times in the first year and six for the second year.
The drainage water samples were collected just after
the irrigation applications as the leaching volume
from the cups located under each column.
For the lyzimeter experiments, three irrigation
water salinity (S1, S2, and S3, 0.25, 1.5 and 3.0 dS m-1,
respectively) and four leaching fraction treatment
(LF1, LF2, LF3 and LF4, 10, 20, 35 and 50% more
irrigation water than required for evapotranspiration,
respectively) levels, as a fully randomized design
experiment were used with three replication. For
artificial salinization of the irrigation water, NaCl and
CaCl2 salts were added in the tap water considering
the SAR less than 1. The properties of irrigation
waters used in the experiments are given in Table 2.
Table 1- Some physical and chemical characteristics of soil
Çizelge 1- Toprağın bazı fiziksel ve kimyasal özellikleri
pH
8.18
Na+ *
1.48
EC
Bulk density Field capacity Wilting point Organic matter
(dS m-1)
(g cm-3)
(%)
(%)
(%)
0.816
1.310
23.06
17.38
1.33
Ca2+ *
Mg2+ *
K+ *
Total *
SO42- *
4.9
2.26
0.28
8.92
3.05
Sand
(%)
58
CO32- *
Silt
(%)
21
HCO3- *
4.59
Clay
(%)
21
Cl- *
1.28
Texture
SCL
Total *
8.92
*, unit is mmolc L-1
Table 2- The average ion concentrations of the irrigation waters used (mmolc L-1)
Çizelge 2- Denemelerde kullanılan sulama sularının ortalama iyon konsantrasyonları (mmolc L-1)
Treatmentsts
S1
S2
S3
Cl0.50
13.08
27.74
NO220.00
0.00
0.00
NO30.00
0.00
0.00
SO4-2
0.24
0.35
0.37
CO320.00
0.00
0.00
HCO31.60
1.90
1.90
Total
2.34
15.52
30.20
Ta r ı m B i l i m l e r i D e r g i s i – J o u r n a l o f A g r i c u l t u r a l S c i e n c e s
Na+
0.43
1.94
3.56
K+
0.07
0.04
0.05
20 (2014) 103-111
Mg2+
1.14
0.56
0.57
Ca2+
0.70
13.24
26.12
Total
2.34
15.79
30.29
105
*, unit is mmolc L-1
The soil texture is sandy clay loam with the bulk density of 1.31g cm-3. The soil was irrigated ten times in the
first year and six for the second year. The drainage water samples were collected just after the irrigation
applications as the leaching volume from the cups located under each column.
MassFor
Balance
in Soil Salinity
Management:
Different
Irrigation Water
and (S
Leaching
et al 1.5
andYurtseven
S3, 0.25,
theCriteria
lyzimeter
experiments,
three
irrigation
waterQualities
salinity
1, S2,Ratio,
and 3.0 dS m-1,
respectively) and four leaching fraction treatment (LF 1, LF2, LF3 and LF4, 10, 20, 35 and 50% more irrigation
water than required for evapotranspiration, respectively) levels, as a fully randomized design experiment were
irrigation
water requirement
was determined
and CNaCl
areand
theCaCl
ion concentrations
Ciwwater,
dw
usedThe
with
three replication.
For artificial
salinization of theWhere;
irrigation
2 salts were added in
of
irrigation
and
drainage
water;
D
are the are
according
to
TDR
measurements,
and
soil
samples.
the tap water considering the SAR less than 1. The properties of irrigation waters used iwinand
theDexperiments
dw
total
irrigation
and
the
total
drainage
water
amounts,
The TDR
measurements
were taken only from
given
in Table
2.
the burial probes placed in the center block of the respectively.
experiment,
while water
the soilrequirement
samples forwas
soil determined
moisture according
The irrigation
to TDR measurements,
andamount
soil samples.
Ion concentration
and total water
were The
TDR
measurements
onlythefrom
burial probes
placed
in
the
center
-1 block of the experiment, while
measurement
were were
takentaken
from
twothespare
considered as mmolc L , and liters respectively.
the
soil samples
forwith
soil the
moisture
measurement were taken
from to
the
two the
spare
with
lysimeters
irrigated
S1 water.
According
SMB,
soillysimeters
profile wasirrigated
considered
as the S 1
water.
The amount of irrigation water to bring the salinized when the results were positive, or leached
when the results
moisture content to its field capacity (-33 kPa) was out from the salinity constituents
-1
Table 2- The average ion concentrations of the irrigation
waters
used (mmol
cL )
were
negative.
So the
accumulation
or leaching
calculated
and,
later,
it
was
multiplicated
by
1.1,
Çizelge 2- Denemelerde kullanılan sulama sularının ortalama iyon konsantrasyonları (mmol c L-1)
1.2, 1.35, and 1.5 for the LF1, LF2, LF3 and LF4 phenomena was evaluated. In this study, the total
treatments, respectively. Experimental columns mass balances were calculated for the major salinity
2+
2+
constituents
of Na+, Ca
, Mg
, SO42+2-, NO3-2+, HCO3-,
were irrigated with
irrigation
2Treatmentsts
Cl- dripNO
NO3system.
SO4-2
CO32HCO3-- Total
Na+
K+
Mg
Ca
Total
2
and Cl individually.
After
irrigation,
S1 each 0.50
0.00 drainage
0.00 water
0.24 samples
0.00
1.60
2.34
0.43
0.07
1.14
0.70
2.34
were collected
from
the
bottom
part
of
the
lyzimeters
S2
13.08
0.00
0.00
0.35
0.00
1.90
15.52
1.94
0.04
0.56
13.24
15.79
and soil samples were taken each every 20 cm up 3. Results and Discussion
S3
27.74
0.00
0.00
0.37
0.00
1.90
30.20
3.56
0.05
0.57
26.12
30.29
to 100 cm depth. Salinity constituents (electrical Figure 1 shows the total amount of drainage water
+
+
2+
2+
2the calculated
leaching
fractions
forwas
the calculated
leaching and,
, K , Cawater
, Mgto ,bring
SO4 ,the
HCO
, and
conductivity,
pH,ofNa
The amount
irrigation
moisture
content
to its field
capacity
(-33kPa)
3
treatments,
as
average
replications
for
both
years.
)
were
determined.
Total
salinity
(EC),
was
and
Cl
later, it was multiplicated by 1.1, 1.2, 1.35, and 1.5 for the LF 1, LF2, LF3 and LF4 treatments, respectively.
The
leaching
ratios
were
11,
15,
18,
and
20%
for
determined bycolumns
the procedures
described
by drip
Richards
Experimental
were irrigated
with
irrigation system.
o
the
first
year,
and
7,
15,
21,
and
25%
for
the
second
(1954), in 25 C, with electrical conductivity
The materialized
LF ratios
that
After each
irrigation,
water
samples were year.
collected
from the bottom
part ofwere
the different
lyzimeters
and soil
instrument
(YSI
3000). drainage
Laboratory
measurement
samples
were
taken
each
every
20
cm
up
to
100
cm
depth.
Salinity
constituents
(electrical
conductivity,
pH,
Na +,
the
theoretical
ones.
The
reasons
for
that
is
unequal
of pH was made with glass electrode pH meter
+
2+
2+
2, Ca ,Mi
Mg151).
, SOAll
HCO
) were
determined.
Total salinity
(EC),
was determined
by the procedures
K
distribution
of the
irrigation
water through
soil
4 ,the
3 , and
(Martini
cation
andClanion
analysis
o
C,
with
electrical
conductivity
instrument
(YSI
3000).
Laboratory
described
by
Richards
(1954),
in
25
surface,
the
way
of
calculation
of
the
amount
of
were performed by ion chromatography system
measurement
of
pH
was
made
with
glass
electrode
pH
meter
(Martini
Mi
151).
All
the
cation
and
anion
analysis
irrigation
water
and
the
difference
the
salinity
level
(Dionex ICS 1600).
were performed by ion chromatography system (DionexofICS
1600).
the columns.
The formula for calculating the leaching ratio
Thethe
SMBs
were
calculated
using
values
the simple
leaching fraction
LF equation
Thewas
formula
for calculating
the leaching
ratio values was
simple
leaching
fraction
LFEquation
equation (2)
given by
for
all
the
main
exchangeable
ions
in
the
drainage
Richards
(1954);
given by Richards (1954);
water and the results are shown in Figure 2 and 3.
𝐷𝐷𝑑𝑑𝑑𝑑
The entering salts were considered the ones which
𝐿𝐿𝐿𝐿 = 𝐷𝐷 (1) came into the soil with (1)
irrigation water, and the
𝑖𝑖𝑖𝑖
exiting salts were those leached out with drainage
Where; Ddw, drainage water amount; and Diw, water. The SAR of the soil was not well correlated
Where; 𝐷𝐷𝑑𝑑𝑑𝑑 , Drainage
water amount; and 𝐷𝐷𝑖𝑖𝑖𝑖 , Total irrigation water amounts in liter.
total irrigation water amounts in liter.
with neither irrigation water salinity nor LF. It means
The mass balance of the salinity constituents that the SAR values did not change significantly
was calculated as a differentiation of the total ion with the variation of the irrigation water salinity and
3 leaching ratios.
the
mass
concentration
supplied
irrigation
water, was
The
mass balance
of thewith
salinity
constituents
calculated as a differentiation of the total ion mass
and the total supplied
ion masswith
concentration
that leached
concentration
irrigation water,
and the total ion mass concentration that leached from the soil with
3.1. SMB for anions
drainage
neglecting
thewater,
plant ion
extraction
from the water,
soil with
drainage
neglecting
thefrom the soil profile.
The SMB variations and the correlation coefficients
plant ion extraction from the soil profile.
The soil mass balance (SMB) formula is;
of the major anions SO42-, HCO-3 and Cl- among
The soil mass balance (SMB) formula is;
the treatments are given in Figure 2 for both years.
Figure 2 shows that the leaching of SO42- increased
(2)
[(𝐶𝐶
)
(𝐶𝐶
)]
𝑆𝑆𝑆𝑆𝑆𝑆 =
(2)
𝑖𝑖𝑖𝑖 × 𝐷𝐷𝑖𝑖𝑖𝑖 −
𝑑𝑑𝑑𝑑 × 𝐷𝐷𝑑𝑑𝑑𝑑
Where, 𝐶𝐶𝑖𝑖𝑖𝑖 and 𝐶𝐶𝑑𝑑𝑑𝑑 , are the ion concentrations of irrigation and drainage water; 𝐷𝐷𝑖𝑖𝑖𝑖 and 𝐷𝐷𝑑𝑑𝑑𝑑 , are the total
106
Ta r ı m B i l i m l e r i D e r g i s i – J o u r n a l o f A g r i c u l t u r a l S c i e n c e s
20 (2014) 103-111
irrigation and the total drainage water amounts, respectively.
Ion concentration and total water amount were considered as m molc l-1, and liters respectively. According to
SMB, the soil profile was considered as salinized when the results were positive, or leached out from the salinity
constituents when the results were negative. So the accumulation or leaching phenomena was evaluated. In this
study, the total mass balances were calculated for the major salinity constituents of Na +, Ca2+, Mg2+, SO42-, NO3-,
Toprak Tuzluluğu Yönetiminde Tuz Dengesi Kavramı: Farklı Sulama Suyu Tuzluluğu ve Yıkama Oranı, Yurtseven et al
2010
2011
Figure 1- Total measured drainage water (Dw) amounts and accrued leaching ratios (LR) for the leaching
treatments
Şekil 1- Yıkama konuları için ölçülen drenaj suyu toplamları(Dw) ve gerçekleşen yıkama oranları (LR)
with the leaching rate for all the salinity levels
of irrigation water. Most of the soluble SO42- was
leached in the first year. The second year, the
leaching was relatively similar, however lower
in amount, since no SO42- was added to irrigation
water. The higher the salinity of irrigation waters
the higher the correlation between concentrations
and leaching fractions. The correlation coefficients
between the SO42- concentration and leaching
fractions were 0.460, 0.897 and 0.942 for S1, S2 and
S3, respectively. This means that the changes in SO42concentration in the soil was highly correlated with
irrigation water salinity. This could be explained by
exchange of SO42- ions in the soil solid surface by
another ion or in other way, by increasing of SO42releasing from the soil surface.
Cl is the only anion used for salinization
of the irrigation water. For almost all salinized
treatments (S2 and S3) the total mass balance was
positive. It means that in salinized treatments less
Cl- was leached out with drainage water than the
added volume. In S3 treatment, Cl- accumulation
decreased with increasing leaching fraction in both
years. The high negative correlation coefficient
(R2=0.843-0.869) between leaching ratio and the
Cl- concentration in drainage water were found in
S3 salinity level for both years (Figure 2). No Cl-
accumulation was detected for S1 treatment. Cl- is
leached easily from the soil and moves with the
same speed as soil water in the coarse soil (Öztürk
& Özkan 2002).
In all treatments, the SMBs of HCO3- were
positive. In the irrigations for both years there was
a determined accumulation of HCO3-, although its
amount was not high. Even though the tap water was
the only source for HCO3- (i.e. bicarbonate was not
one of the added salinity constituent to the irrigation
water) it was not easily leached out from the profile.
The correlation was higher in the second year (0.92
for S2, and 0.76 for S3 treatments) (Figure 2).
3.2. SMB for cations
The major cations in the soil, Ca2+, Mg2+, and Na+,
were taken into account for the salt mass balance
calculations. The Ca2+ concentrations of the soil
profile increased with saline water irrigation (S2
and S3) (Figure 3) but did not change considerably
with leaching fraction. In S1 treatment, in which
tap water was used for irrigation, low amount of
Ca2+ leached from the soil profile. Increasing the
Ca2+ concentrations in irrigation water caused the
accumulation of Ca2+ in the profile, i.e. positive
salt balance. The correlation coefficients between
the LF and mass concentrations were low and so
Ta r ı m B i l i m l e r i D e r g i s i – J o u r n a l o f A g r i c u l t u r a l S c i e n c e s
20 (2014) 103-111
107
Mass Balance Criteria in Soil Salinity Management: Different Irrigation Water Qualities and Leaching Ratio, Yurtseven et al
2010
2011
Figure 2- Total mass balances of some major anions related to the accrued leaching ratios, for the first year
(2010) and the second year (2011) experiments
Şekil 2- Birinci yıl (2010) ve ikinci yıl (2011) denemeleri icin bazı anyonların, gerçekleşen yıkama oranlarına
bağlı olarak toplam tuz dengesi değerleri
the relationship was not significant. Results of
the experiments done by Islam (1993) revealed
that while the exchangeable Ca2+ increased, the
exchangeable Mg2+ and Na+ decreased in the
soil when fresh river water is used, but Ca2+ and
108
Mg2+ increased more remarkably and those of
exchangeable Na+ and total exchangeable cations in
soil decreased more sharply, when saline drainage
water is used for leaching.
Ta r ı m B i l i m l e r i D e r g i s i – J o u r n a l o f A g r i c u l t u r a l S c i e n c e s
20 (2014) 103-111
Toprak Tuzluluğu Yönetiminde Tuz Dengesi Kavramı: Farklı Sulama Suyu Tuzluluğu ve Yıkama Oranı, Yurtseven et al
2010
2011
Figure 3- Total mass balances of some major cations related to the accrued leaching ratios, for the first year
(2010) and the second year (2011) experiments
Şekil 3- Birinci yıl (2010) ve ikinci yıl (2011) denemeleri icin bazı katyonların, gerçekleşen yıkama oranlarına
bağlı olarak toplam tuz dengesi değerleri
The total mass concentration of Mg2+ was
negative for almost all treatments, which means that
the Mg2+ in the soil was leached out during irrigation
with different LFs. This was expected since no Mg2+
was added to the irrigation water or to the soil and
the other cations, especially Ca2+, in the salinized
irrigation water replaced the soil adsorption surfaces
and removed them (Kijne at al 1998). The higher
the LF, the higher the salinity level and the more the
Mg2+ leached. The only exception was the little Mg2+
Ta r ı m B i l i m l e r i D e r g i s i – J o u r n a l o f A g r i c u l t u r a l S c i e n c e s
20 (2014) 103-111
109
Mass Balance Criteria in Soil Salinity Management: Different Irrigation Water Qualities and Leaching Ratio, Yurtseven et al
accumulation in the S1 level during the second year.
The high correlation coefficients (R2=0.94, 0.93 and
0.99, 0.95 for S2 and S3 treatments for both years,
respectively) between the Mg2+ concentration and
leaching ratio are found on the S2 and S3 treatments.
References
The net Na+ leaching from the soil profile was
determined for all the salinity levels and LF for
both years. The increased LF caused the increased
leaching of the Na+. This is probably because of
the adsorbed Ca2+ and the released Na+ in the soil
exchange surfaces. The correlation coefficients
between the Na+ concentration and leaching ratios
are 0.421, 0.897 and 0.957 in the first year and 0.936,
0.921 and 0.970 in the second year for S1, S2 and S3,
respectively. Related to the cation intercourse, Siczek
et al (2008) reported that the leaching of cations is
dependent on the concentrations of other cations in
the soil solution. For example, Jalali & Rowell (2003)
reported that the increase of potassium would result
with the increase of Ca2+ due to the ability of calcium
ions. Because calcium ions can displace potassium
ions from the exchange pools into the solution.
Corwin D L, Rhoades, J.D. & Simunek J (2007).
Leaching requirement for soil salinity control:
Steady-state versus transient models. Agricultural
Water Management 90: 165–180
4. Conclusions
Salt mass concentration in the soil profile generally
varies with the irrigation practices. Irrigation
water salinity is the major factor for this variation.
The salts coming with the irrigation water are
washed out with the leaching fraction depending
on the irrigation water amount. In our column
experiments, SO42- was washed out relatively
easier than the other anions such as Cl-, and HCO3. This is a relative comparison, because the initial
concentration of SO42- was very low and no SO42was added by irrigation and, therefore, its leaching
was very effective. Although chloride is known
by its high mobility in the soil compared to other
anions, when an excess amount of it is added to the
soil by irrigation, it can be accumulated for a while.
The addition of Ca2+ together with Na+ by irrigation
water causes the accumulation of Ca2+ and the
washing out of other cations, e.g. Mg2+ and Na+. This
is because of the preferences of the soil adsorption
surfaces. SMB should be taken into account for soil
reclamation and management of arid and semiarid
soils. It gives a very general but simple conclusion.
110
Al-Absi K M, Al-Nasir F M & Mahadeen A Y (2009).
Mineral content of three olive cultivars irrigated with
treated industrial wastewater. Agricultural Water
Management 96: 616–626
Hutson A C & Ickert R A (2012). Sustainability in water
supply. In: World Environmental and Water Resources
Congress 2012: Crossing Boundaries, ASCE, pp.
2856-2872
Islam Md Z (1993). Leaching Effect of Saline Drainage
Water on Exchangeable Cations in Soil. Journal of
Irrigation, Engineering and Rural Planning 24: 4-18
Jalali M & Rowell D L (2003). The role of calcite and
gypsum in the leaching of potassium in a sandy soil.
Experimental Agriculture 39: 379-394
Kijne J W, Prathapar S A, Wopereis M C S & Sahrawat
K L (1998). How to Manage Salinity in Irrigated
Lands: A Selective Review with Particular Reference
to Irrigation in Developing Countries. SWIM Paper
2. Colombo, Sri Lanka: International Irrigation
Management Institute, Sri Lanka
Oster J D, Letey J, Vaughan P, Wu L & Qadir M (2012).
Comparison of transient state models that include
salinity and matric stress effects on plant yield.
Agricultural Water Management 103:167–175
Öztürk H S & Özkan İ (2002). Solute movement in large
soil columns during different ponded infiltration.
Australian Journal of Agricultural Research 53: 183189
Rhoades J D (1974). Drainage for salinity control. In:
van Schilfgaarde J (Ed.), Drainage for Agriculture.
Agronomy Monograph No. 17. SSSA, Madison, WI,
pp. 433–461
Rhoades J D & Loveday J (1990). Salinity in irrigated
agriculture. In: Stewart B A & Nielsen D R (Eds.),
Irrigation of Agricultural Crops. Agronomy
Monograph No. 30. SSSA, Madison, WI, pp. 1089–
1142
Richards L A (1954). Diagnosis and Improvement of
Saline and Alkali Soils. U.S. Dept. Agriculture,
Handbook 60. U.S. Government Printing Office,
Washington
Ta r ı m B i l i m l e r i D e r g i s i – J o u r n a l o f A g r i c u l t u r a l S c i e n c e s
20 (2014) 103-111
Toprak Tuzluluğu Yönetiminde Tuz Dengesi Kavramı: Farklı Sulama Suyu Tuzluluğu ve Yıkama Oranı, Yurtseven et al
Siczek A, Kotowska U, Lipiec J & Nosalewiczl A (2008).
Leaching of potassium, magnesium, manganese and
iron in relation to porosity of tilled and orchard loamy
soil. Acta Agriculturae Scandinavica Section B- Soil
and Plant Science 58: 60-65
Skaggs T H, Poss J A, Shouse P J & Grieve C M
(2006). Irrigating forage crops with saline waters: 1.
Volumetric lysimeter studies. Vadose Zone Journal 5:
815–823
Yıldız M & Terzi H (2011). Türkiye’de Ekimi Yapılan Bazı
Arpa Çeşitlerinde Erken Fide Evresi Tuz Toleransının
Belirlenmesi. Tarım Bilimleri Dergisi 17(1): 1-9
Yurtseven E, Avcı S, Öztürk H S, Altınok S & Selenay M
F (2012). Drainage water quality management: impact
of different irrigation water quality and leaching
fractions on drainage water salinity. In: Proceedings
of the VIII. International Soil Science Congress
“Land Degradation and Challenges in Sustainable
Soil Management” 15–17 May, İzmir, Turkey
Zhong H (2011). Salt mass balance study and
plant physiological responses for an enhanced
salt phytoremediation system. Master Thesis
(Unpublished), Waterloo University, Ontario, Canada
Ta r ı m B i l i m l e r i D e r g i s i – J o u r n a l o f A g r i c u l t u r a l S c i e n c e s
20 (2014) 103-111
111
© Copyright 2026 Paperzz