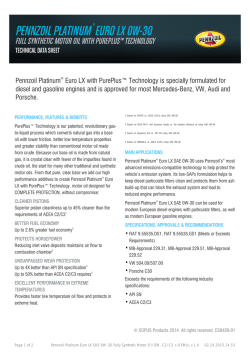
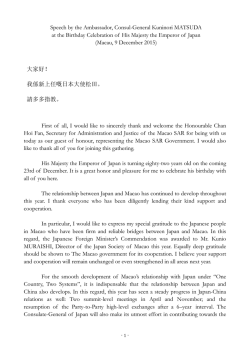
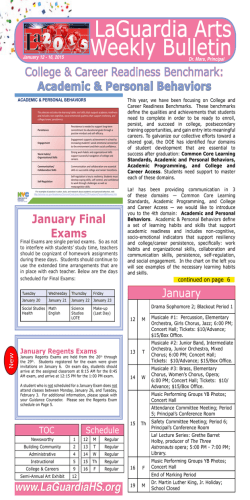
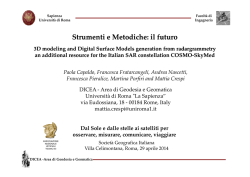
Ref. Ares(2014)2051263 - 23/06/2014 EUROPEAN COMMISSION HEALTH AND CONSUMERS DIRECTORATE-GENERAL Directorate D - Health systems and products D4 – Substances of Human Origin and Tobacco Control Brussels, SANCO. D4/ IH/ac ARES(2013) SUMMARY OF THE 2013 ANNUAL REPORTING OF SERIOUS ADVERSE EVENTS AND REACTIONS (SARE) FOR BLOOD AND BLOOD COMPONENTS (DATA COLLECTED FROM 01/01/2012 TO 31/12/2012) Article 8 of Directive 2005/61/EC provides that Member States shall submit to the Commission an annual report, by 30 June of the following year, on the notification of serious adverse reactions and events (SARE) received by the competent authority using the formats in Part D of Annex II and C of Annex III. This document intends to provide a summary report of the data collected during 2012 (from 1st January to 31st of December) received from the Member States, including preliminary conclusions. 1. DATA COLLECTION METHODOLOGY The first SARE reporting exercise for blood and blood components was launched in 2008. Since then DG SANCO has worked together with groups of national experts to refine the SARE reporting exercise. More recently a Working Group on haemovigilance, whose members are nominated by the national Competent Authorities, has met on a yearly basis to discuss improvements to the SARE reporting tools. These are: 1) An electronic reporting template to be filled in by Member States with the data collected in the previous year (1st January to 31st December). Once completed by Member States this is sent in html format to a DG SANCO hosted database. The template used in 2013 (for 2012 data) was version 2.3. 2) A common approach document which, although it is not legally binding, provides guidance to Member States when filling out the electronic SARE reporting template as required by Directive 2005/61/EC. First published in 2008, the Common Approach has been regularly updated to clarify points of ambiguity and inconsistency. This has in turn resulted in a gradual increase of the quality of the data collected from the Member States. In 2013, version 4 of the Common Approach document was available to those reporting SARE 2012 data. Commission européenne, B-1049 Bruxelles / Europese Commissie, B-1049 Brussel - Belgium. Telephone: (32-2) 299 11 11. E-mail: [email protected] 2. MAIN FINDINGS OF THE 2012 DATA COLLECTION 2.1. General comments For the 2013 exercise (data reported in 2012), a revised version of the 'Common approach for definition of reportable serious adverse events and reactions' was developed by the Commission, together with the Haemovigilance Working Group. The PDF reporting template was also revised and refined. Some of the changes included collection of data on denominator totals, the addition of a dedicated section for more than one blood component, and the removal of classification A/B for imputability levels 2-3. Responses were received from all EU28 Member States, Liechtenstein and Norway, with 3,964 reporting facilities. All countries reported SARs and most reported SAEs, but in many cases not all denominators were reported, raising questions about the availability/accuracy of data. The data was presented at the November 2013 meeting of the competent authorities on blood and blood components. Although data quality has continuously improved (17 countries reported receiving complete data), the data presented here is considered partial and should therefore be interpreted with caution (a further 10 countries received at least 80% of the expected data and three did not report this figure). 2.2. Denominators All Member States, Liechtenstein and Norway submitted replies to the questionnaire, thereby complying with the annual report submission established by Article 8. In the following section, as well as in the analyses, data from all countries supplying data from at least 80% of facilities (hospitals or blood establishments) have been included. In total, 13,351,948 units of blood components were reported as transfused by facilities in EU and EEA countries. It should be noted that this is not the total number of units transfused, as only 20 countries (AT, BE, BG, CZ, DK, EE, EL, ES, HR, IE, IT, LI, LT, MT, NL, NO, PT, RO, SE and UK) reported this figure for at least one blood component and only 19 countries for at least three blood components. The breakdown by component is shown below. Figure 1: Units transfused (per blood component). 2 Component Units Transfused (100,000) Red blood cells 99.6 Platelets 13.1 Plasma 20.3 Whole blood 0.4 Total 133.5 According to the reports, 3,595,155 recipients (patients) were transfused in 2012.As above, these are partial figures, only sixteen countries (AT, BE, BG, CZ, EE, ES, HR, IE, IT, LI, LT, MT, PT, RO, SE and UK) provided data on both units transfused and the number of recipients of blood. Four countries (DK, EL, NL and NO) only provided data about units of blood components transfused, and three countries (CY, FR and PL) provided information on recipients but not units transfused. The seven remaining countries (DE, FI, HU, LU, LV, SI and SK) did not provide any data for units transfused or the number of recipients. The breakdown by component is shown below. Figure 2: Recipients (per blood component) (AT, BE, CY, CZ, ES, HR, IE, IT, LI, LT, MT, PT, SE and UK provided per component data, totalling 2,274,651 recipients). Component Recipients Transfused (100,000) Red blood cells 18.2 Platelets 2.0 Plasma 2.5 Whole blood 0.0 Total 22.7 Twenty-six EU Member States (AT, BE, BG, CY, CZ, DE, EE, EL, FI, FR, HR, HU, IE, IT, LT, LU, LV, MT, NL, PL, PT, RO, SE, SI, SK and UK) and Liechtenstein provided data regarding units of blood components issued in 2012. Overall, a total number of 25,129,344 units of blood were issued in 2012. Figure 3: Units issued (per blood component). 3 Component Units Issued (100,000) Red blood cells 179.2 Platelets 25.8 Plasma 45.8 Whole blood 0.5 Total 251.3 Twenty EU Member States (AT, BE, BG, CY, DK, ES, FI, FR, HR, HU, IT, LT, LU, LV, MT, NL, PL, PT, RO and SK), Norway and Liechtenstein provided data regarding total blood collections in 2012. Overall, there were 12,169,172 whole blood collections and 1,930,107 apheresis collections in 2012. 2.3. Serious Adverse Reactions (SAR) 2.3.1. Information by country In 2012, a total of 1,813 SAR with a likely or certain attribution to the blood or blood component transfused (i.e. at imputability level 2-3) were reported by the 28 Member States, Liechtenstein and Norway. This equates to 13.6 SAR per 100,000 units transfused or conversely 7,365 units transfused per SAR. This figure should, however, be interpreted with caution. This is most likely an over-estimation of the number of SAR per units transfused, as only 19 countries provided data for units transfused for at least three blood components, but all reported the number of SAR (for this sub-set of countries there were 10.3 SAR per 100,000 units transfused and 9,689 units transfused per SAR). Eight countries (BG, CY, LI, LU, LV, MT, RO and SK) did not report any SAR (level 23) attributed to blood and blood components in 2012. Where SAR and units transfused were both reported, the number of units transfused per SAR (level 2-3) ranged from 2,116 to 124,099 across countries. These figures should also be interpreted with caution as many reports are still partial and differences between countries do not necessarily indicate a safer system. In fact, a higher number of SAR reported may indicate a more reliable and accurate reporting system, and a lower number of SAR may indicate underreporting. 2.3.2. Information by blood component Figure 4: Percentage of SAR per blood component and units transfused per SAR (for those countries which report units transfused and SAR for at least three blood components). 4 Component Units transfused -1 SAR Red blood cells 12,034 Platelets 3,875 Plasma 9,664 Whole blood 44,680 Of the 1,813 level 2-3 SAR reported: 1,058 SAR were related to red blood cells, 426 SAR were related to platelets, 290 SAR were related to plasma, 1 SAR was related to whole blood, and 38 SAR were related to more than one blood component. 2.3.3. Information by category of SAR The 1,813 SAR (level 2-3) reported were classified as follows: Immunological haemolysis: 125 cases (6.89% reported SAR), of which 42 cases due to ABO antibody (2.32%), and 83 cases due to other allo-antibodies (4.58%), Non-immunological haemolysis: 7 cases (0.39% reported SAR), Anaphylaxis/hypersensitivity: 710 cases (39.16% reported SAR), Transfusion related acute lung injury (TRALI): 69 cases (3.81% reported SAR), Transmitted infections: 35 cases (1.93% of reported SAR), of which: 24 cases of bacterial infections (1.32%), 10 cases of viral infection (3 HBV, 1 HCV, 3 HEV, 1 case HIV-1/2, 1 West Nile virus and 1 parvovirus) (0.55%), and 1 case of parasitical infection (malaria) (0.06%), This number concerns infectious agents that were present in the final preparation and transfused to the patient. It should be noted that safety and quality measures from donation to transfusion eliminate the vast majority of infectious agents at earlier stages. Post transfusion purpura: 15 cases (0.83% reported SAR), Graft versus host disease: 2 cases (0.11% reported SAR), Other SAR: 850 cases (46.88% of reported SAR). This category includes: 448 cases of febrile non-haemolytic transfusion reaction (FNHTR) (24.71%), 179 cases of transfusion associated circulatory overload (TACO) (9.87%), 5 70 cases of transfusion associated dyspnea (TAD) (3.86%), 1 case of hypertension (0.06%), and 1 case of delayed serologic transfusion reaction (DSTR) (0.06%). Of the 1,813 cases of SAR reported, there were 22 deaths from immunological haemolysis (5 cases), bacterial infections (3 cases), anaphylaxis (1 case), graft versus host disease (1 case), TRALI (4 cases), TACO (6 cases), TAD (1 case) and other (1). Figure 5: Percentage of SARs per category. 2.3.1. SAR in donors Eighteen countries (BE, CY, DE, DK, FI, FR, HR, IT, LI, MT, NL, NO, PL, PT, RO, SE, SI and UK) reported a total of 2,494 SAR in donors. This equates to 22.5 SAR per 100,000 collections or 4,436 collections per SAR in those countries which reported both SAR in donors and figures on collections. A subset of countries also provided additional information to the Commission on SAR in donors. Based on these reports, we can see that many of the reactions in donors were related to blood vessel injuries, nerve injuries, vasovagal episodes, or cardiovascular reactions. 6 2.4. Serious Adverse Events (SAE) 2.4.1. Information by country SAE were reported by 26 Member States (AT, BE, BG, CY, CZ, DE, DK, EE, EL, ES, FI, FR, HR, IE, IT, LT, LU, LV, MT, NL, PL, PT, RO, SE, SI and UK), Liechtenstein and Norway. The total number of SAE reported for 2011 was 2,953. 2.4.2. Information by type of SAE The 2,953 SAE reported were linked to the following activity steps: Whole blood collection: 861 SAE (29.16%), Apheresis collection: 94 SAE (3.18%), Testing of donations: 302 SAE (10.23%), Processing: 200 SAE (6.77%), Storage: 336 SAE (11.38%), Distribution: 320 SAE (10.84%), Materials: 76 SAE (2.57%), and Other activity steps: 764 events (25.87% reported SAE). This category includes 'compatibility testing', 'transport', ‘IT system errors’ and 'bacterial contamination'. Figure 6: Serious adverse events by activity step. 7 2.4.3. Information by Specification of SAE The 2,953 SAEs were attributed to one of the following specifications: Human Error: 1,802 SAE (61.02%) Equipment failure: 418 SAE (14.16%) Product defect: 484 SAE (16.39%) Other: 249 SAE (8.43%), including 'organisational errors' or unclassified SAE. Figure 7: Serious adverse events per specification. 3. TOWARDS AN IMPROVED REPORTING IN 2014 A revised version of the 'Common approach for definition of reportable serious adverse events and reactions' will be developed by the Commission, together with the Haemovigilance Working Group, before the launch of the 2014 SARE reporting exercise. In particular, improved SAE guidelines will be developed to minimise the number of serious adverse event deviations and specifications that are reported as ‘other’. The PDF reporting template for the 2014 reporting exercise (for data reported in 2013) will remain largely the same to facilitate reporting and allow for future between year comparisons. 4. DISCUSSION AND CONCLUSIONS The number of SAR in recipients (level 2-3) reported for 2012 is low (1,813), especially when compared to the number of units of blood components transfused in the EU (13.6 SAR per 100,000 units transfused or 7,365 units transfused per SAR overall). This figure is similar to that reported in 2012, but higher than in 2010. However, considering that the data reported is partial, year on year comparisons should be interpreted with caution. The results also show that the number of deaths resulting from blood transfusion is low (0.165 deaths per 100,000 units transfused or 606,907 units transfused per death overall). 8 It is, however, important to note that of the 22 deaths reported to the Commission, the majority were not attributable to the quality and safety of the blood component, but rather clinical practice or unforeseen reactions. For SAE, the reported figures also are lower than in previous years (2,953), (11.8 SAE per 100,000 units issued or 8,510 units issued per SAE overall). This may be the result of improvements in data collection, which have meant that only ‘serious’ adverse events are reported. It should however be noted that on an individual Member State basis a higher number of SAE reported may indicate a more reliable and accurate reporting system, and a lower number of SAE may indicate under-reporting. The large number of SAE reported due to human error highlight the importance of root cause analysis to determine the ultimate cause of serious adverse events. Overall, the results show that blood and blood components in Europe are safe. At the European level the exercise has allowed Member States to share experience and knowledge on haemovigilance helping to develop their national systems. Individual countries should however continue to use this exercise to evaluate the safety of their national blood sectors and identify where quality issues occur, ultimately improving the safety and quality of blood in the entire EU. 9
© Copyright 2026 Paperzz