気象衛星センター 技術報告 第23号 1991年11月
GMS-4 Observations of Volcanic Eruption Clouds from
Mt.
Pinatubo, Philippines
Masami
Tokuno*
Abstract
Visible
Mt.
and
Pinatubo,
at one
hour
studied
and
textures
infrared
intervals
cloud's
surface
were
by
indicated
appeared
(心−83
imageries
Philippines
the
the
temperature
UT
A giant
more
than
and
diameter,
and showed
temperature
area
indicating
surrounding
several
the
covered
the volcano
occurred
the cloud
than
the area
up to 100 km upwind.
the
imageries
showing
tropopause
were
a “wave”
The
temperature
of − 27 °Cwas located
spread
At
400 km in
Furthermore,
a higher
in the surrounding
0840
UT
the
a surface
suggests
This
out to an area
at 0740 UT.
having
This
from
Time)
was injected into the stratosphere.
of 20 m/sec.
activity continued.
and
(VECs)
(Universal
300 tanin diameter.
temperature
hot spots (Q;−30 °C) appeared
decreased,
VEC
an area
in its surface temperature
volcano's
−60 °C further expanded
material
indicating
clouds
satellite. These
disc-shaped
10 °Cgreater
an easterly wind
an increase
with
that
thereby
against
eruption
0540 − 0940 UT
meteorological
features.
visible image
was
volcanic
15, 1991 from
°C). In addition. a small hot spot with a maximum
cloud radially expanded
1
gigantic
on June
geostationary
following
in the 0640
at the center of the cloud.
thus
of the
taken
the volcano.
surface
temperature
temperature
higher
than
that a radial flux of injected hot
after 0740 UT.
sible, however,
few
analyses
have
been
performed
Introduction
Volcanic
gained
ence
eruption
much
attention
on global
are
accessible,
thereby
and
remotely
The
making
first Japanese
additional
was
launched
vals.
and
to study
sensing
volcanic
Arai (1983)
Mt.
El Chichon,
GMS
multispectral
the development
while
imageries
and
uso]
1987
Philippines
accompanied
ved
is an
The
VECs
15, 1991),
which
GMS-4
occur-
(15°O7'N,
were
being
obserimag-
GMS-4.
present
investigation
UT
m, June
by gigantic
eruption
Pinatubo
at l hr intervals using the multispectral
eries from
providing
volcanic
on Mt.
120°2O'E. altitude: 1745
hourly
(Universal
on
study
reports
the
the development
imageries
Time)
obtained
on June
results
of VECs
from
of an
using
0540 − 0840
15, 1991.
at 3 hr interGMS
(1987)
of eruption
2. VEC
photoashes
Visible Imagery
Figures l − 4 show
used
Features
a series of VEC
visible
(VIS) imagery photographs taken at l hr intervals
study
from 0540 − 0840 UT
clouds
The
23 volcanoes。
March
century's largest
easily
meteorologi-
to analytically
dispersal
using this data.
This
Many
activities。
of volcanic
Sawada
on VECs
red in the
in 1977, with this
imageries
the movement
from
In
not
satellites subsequently
multispectral
graphs
safety.
and
geostationary
low-resolution
Funada
recently
it difficult to monitor
useful tool to monitor
cal satellite (GMS)
from
aviation
located
As a result. satellite remote
extremely
and
have
due to their significant influ-
climate
volcanoes
VECs.
clouds (VECs)
VECs
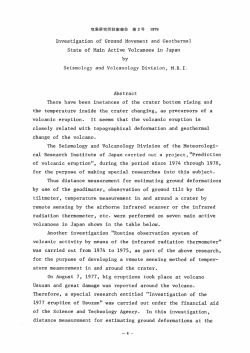
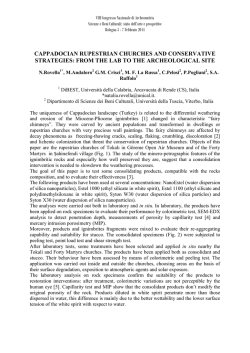
on June 15,1991.
in Fig. 1(0540 UT)
are character-
ized by a visible gray area (A) and disc-shaped
hourly
imagery
became
pos-
clouds which
* Meteorological SatelliteCenter
一一1−
appear
in the center of LUZON
DiuBD[OA padBqsosip E aiBDipui ApAipadsaj g due v
Lfl OWO IE XjaSBiui siqisi
v
a t amSia
一
.るコ︵︶一.1 31UE010A pasjMsip puB pnoiD uonfliua
I66T 'SI sunf リ
1991
N0.23 NOVEMBER
NOTE
TECHNICAL
CENTER
SATELLITE
METEOROLOGICAL
気象衛星センター 技術報告 第23号 1991年11月
li・゛t'尚7一撃ク1
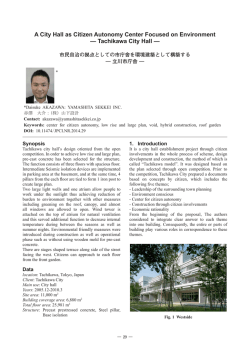
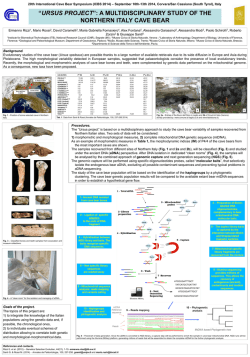
■sajnjxai sabm。 dub.juaiiuns 10 uoijoaipj oj anp aDUEJBadde ajiqM b 。v\ous
')g \ padEus-Dsip aq; jo Mopeqs B ajBDipui AiaAipadsaj ^ pue g'V Xn ()W(こo
UDiii.vi s'A
j -1
q0 sdoj
Ajsaeiu! aiq!S!y\ z smSi^
−3−
\…………
j(4
‥卿
t ’− i i
1
●・.*i
Sj
●
jt
Ui-H……i.1
jj,j!?ji
1
:i.I
、. ̄=tl'
-、..!j4:
バ
l
jべ.?
t
IIい’rll“゛
・4
♪
v-'£*
−4−
!・
a
jtべL4︲It″・I
OUBDTOA oqn^eui<j *iw
、S・
g 3-in3ij
. E'・-_り
' j'・. ・
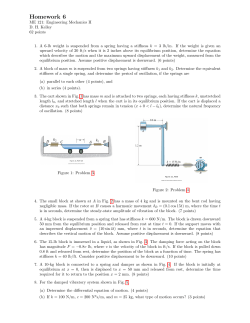
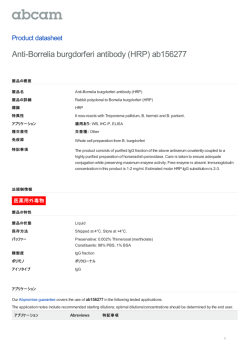
in0t^L0*Qr9’1661 t’-SWD
j.4y・
・1゛.
/l
xf[ ot^ZO J” AJaSBiui aiqisf^
yt::j
L
八丁゛ド
spnop uon
−
・ゝ
じg \ padEusosip am io modbus b dub 9DUBJBaddB
〃r−
●・
●
4;
9
こ.`
ajm.tt B SuiAEu S33A io sdoj aqj ajBoipui X[9A!P3dsaj g puB y ■
●
tu
こ
r<ii
7−4
\
0
李
●
、
♂
●
1991
N0.23NOVEMBER
NOTE
TECHNICAL
CENTER
SATELLITE
METEOROLOGICAL
−
l
anp SB3JB ajiq.tt
コ
- 一ヱ
’
勁一・
:’
.】_.
.フフ弓
笏 ̄
=-
-一一
t ajn^ij
一一一’
−
一一
−
lJ’
IIII。i。。 一一・?・ご﹃y
}‘・
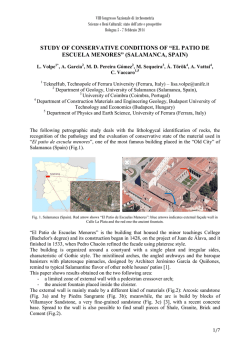
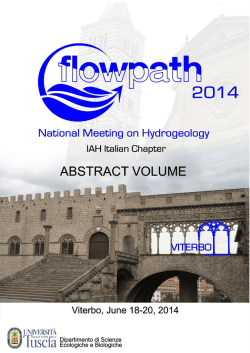
j n Ot'HO }” AJtSJ^Kiui aiqisi a
・IE
−−−
.・?゜Ξこ・.
--r・
Lこ
?●一哨
---
きこ
,
'SMcDBus ^jJA 'luiiiiuns Id uoipauaj oj
1
∼
−
■S>)jrHXaj 。3ABM。 pUE
v ■
・−
−
.j− n
,
S' )-q A paswdsip ajBDipui AiaMpadsaj n pue 3 a '
ざい
濤
−・
・‥・-・一 一
几こ.L・.
一
一a-
rt≪'
'ti
−一一
気象衛星センター 技術報告 第23号 1991年11月
−=一一一一
’7二
METEOROLOGICAL
island.
The
SATELLITE
formation
clouds repeatedly
and
appeared
eries taken
on the morning
area
which
the next
VEC
as can
The
top
of the
shadows
on the disc-shaped
One
shaped
ter.
are at a higher
hour
VEC
The
later (Fig.
white
their shadows
appeariiw
to the east
they travel westward
The
both
last VIS
further
extension
especial】y 200 km
also
westward
away
image
from
up
from
dispersion
of
are
at higher
by “waves”
shown
in the image
VEC
obtained
imageries
west
respectively
of the
white due to
VECs
cast
and
the
of the
disc-
VECs
(Figs.
speed
when
owed
and
the volcano (A)。
The
next
0740
the vo】cano, and
(A).
White
UT.
In
and
eastward
major
hourly
VIS
and
(b)
the volcano
of
the
VECs
as expected.
extension
was
(22 m/sec)
extension
the
on the volfoil-
northward
(25
directions。
occurred
largest
from
average
VEC
velocity
occurred
side (%20
m/sec),
with all the velocities showing
boundaries obtained
the volcano's
0640 −
extension
from
successive hourly VIS imageries
(Fig.
1 - 4)
on
occurred
the largest
respectively
(39 m/sec),
this case
L 2o? |
−6−
disc-
(a)
the VEC's
side(47 m/sec),
significant decrease.
Figure 5 Extensions of VEC
4,
of the
Fig. l as a basis。
by the southward
m/sec),
shows
6
velocity of this extension
as
UT)
and
initial extension
cano's westward
and
succesive
Figures
the distance between
0540 − 0640 UT,
average
from
4).
of the VEC
using
which
3, (B);Fig.
the boundaries
1 -
show
the edge
The
diame-
altitudes
and highlight effects caused
shaped
white
of the
one。
the shadow
of the VEC.
UT),
VECs
VECs
5 shows
the
to 600 km in diameter.
upwind
are revealed
from
4.0840
these
side
(C)on the southeastern
Figure
are clearly observed
(Fig.
northwestern
(D)).
from
up to 400 ㎞in
tops
the
1991
should be noted that the textures of the VECs
result from
thus indicating
3,0740
on
the disc-shaped
It
altitudes。
further expands
seen
their shadows
by the sun angle (Fig. 2, (C);Fig.
These
VEC,
and
(A)
appear
the ref】ectionof sunlight on them.
(B)
VECs
N0.23NOVEMBER
and extending
located
VEC.
areas
than
having
on the surrounding
(B),
NOTE
side indicate
UT),a
is observed.
on the east edge
VECs
Another
2,0640
A shadow
appears
be seen
these
the volcano。
(Fig.
VEC
center of the disc-shaped
that they
day.
20 km west of the volcano
disc-shaped
cloud
from
image
up to 300 km in diameter.
of
as the fuzzy pattern
westward
VIS
di9c-shaped
its center
of that
(B) is shown
is dispersing
remarkable
dispersion
TECHNICAL
in all the satellite imag-
visible gray
In
CENTER
east
a
気象衛星センター 技術報告 第23号 1991年11月
●X■▲
(33S/ID) X1ID019A uoisua^xg
WEST
EAST
: *BST
:EAST
:NORTH
:SOUTH
︵日ぶ︶aouBisiQ
七
→
←
←一一曇-一一・
七
●一一一一一通r一一∼
0
0840
0540 0640 0740
Satellite
Observat ion Time (UT)
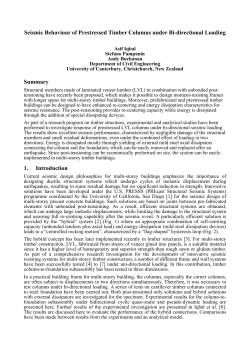
Figure
6 (b)
50
0540
0840
0640 0710 0740
Satellite
Observation
Time (UT)
Figure
Figure 6 (a) Distance changes in the N,S. E, W
6 (a)
directions between the volcano and the VEC
shownin Fig. 5. (b) Same as (a) except chages in VEC
ofpumiceous lapi111occurred.
Form
0740 − 0840 UT
ed up to 50 km upwind
the VEC
with
In
fl】rtherexpand-
Fig.
with
isotherm
3.
VEC
Infrared
Imagery
emitted
ved.
plane
infrared
from
The
surface
homogeneous
atmosphere
ary.
(IR)
the surface
VEC
investigate
of the
IR
VEC
is assumed
cloud
(1987)
VECs
layer
temperature
from
reported
occurred
were
in an
is generally
IR
higher
to be
applicable
were
Figures
contrastingly
VEC
the
tern-
same
is
−80
(B)
°C
less
observed
psudocolor
observation
IR
north
whereas
(D)
the
about
as
and
ture and
in the
located
being
another
dew
(b)
−7−
of the volcano。
show
wind
located
to
the
tempera-
(approximatdy
sea
are
that
at
height is
HTl
) occur in the stratosphere-
in
level)
It is believed
while
at
(13.1N,
− 80 °Cthe VEC
to the tropopause.
the
speed
(Fig. 5). The
at 100 mb
less than
disperesed
LEGASPI
correspondingly
area
area (−60∼
and
and
−83 °Cand 20m/sec.
(>−80°C
2.
warmest
respectively
point.
area
in the
is in the center
warmer
tropopause/咄16㎞above
equivalent
in
The
to the far west
speed
An
in a fan-shaped
and
(Fig.
−80 °Cand
is observed
一60°C (HT2)
south of volcano
wind
VECs
tropo pause.
volcano.
11 (a)
temperatures
imageries
times
of the
Figures
east of the vEC。
°C (HTl)
LAOAG(18.2N,120.5E)
injected into the stratosphere。
at the
VEC
the
7,(C))is less than
一70
air temperature.
thus it is believed that these
7 − 10 show
by
patterns
of the dispersed
is greater than
123.7E).
were
vicinity of the volcano.
enclosed
wave
appear
−70 °C) is observed
in the troposphere。
VECs
has
disc-shaped
to that in the
than
of HTl,
to VECs
the highest temperatures in
Section
VEC
phenomenon
Pinatubo's
taken
which
to
than
of warmer
Fig.
surrounding
bound-
However,
VECs
warmer
at its origin, with the
being
and
is equivalent
isothermal
imageries
the surface. This
considered
area
and
temperature
1, (B),
obser-
that the lowest
of the penetration
under
the
−80 °Cwhich
The
radiances
to be a parallel
GMS
in the lee area
origin's because
occurring
used
and
surface temperature
perature
Images,
overlying a non reflecting lower
Sawada
(A),
UT)the
Features
than
In the
7(0540
coincident
a velocity of 15 m/sec.
boundary
extension velocity. At 0710 UT a heavy fal】
The
and
HT2
heights
AiaA^Dsasaj j
09- puB 3. OZ- u^qj jauuBM sbsjb aJB zxH P”e UH ' O. 0i- 09-︶
^
●
O. 08- ”^Ml sssi s^g^ pssjaasip '3^ 08- UBqj j3mo[ sajnjBjadiusj qjiM sujauBd
uuaqiosi f)^ 08- 941 M paso[3U3 DHA padEqs-osip aqj ajEOipui A[3A!P8dS3j q puE f] 'g '
・
33A pasjaasip b puB
v
SP'S
S
一’・
IL==一..=
−8−
}uau am uo awos m一〇3 ai{︸ Aq pajBDipui ajB sajnjBjadtusj。 Xfl Ot'QO IB XjaHEiui >ji jo[ODopnsj r ajnSij
︻︷J
t
]i
aABM
〔〕
・L″r︲・り’
,畠.
1991
N0.23 NOVEMBER
NOTE
TECHNICAL
CENTER
SATELLITE
METEOROLOC】CAL
□
l
v '
一一
●
`・
|●
f「
−9−
−
一一
一一
−
一一
-
一
一一
一
一一
−
一 一
一一
-
一
一一
一
一一
−
一
一
一
一
−
一
一
一一
一
一一
一
一
I
Sij sb quibs g ajnXij
I●
10 OWO IB jdaoxa ^ ■
一
一
−一
一一
_
A aqj Jo gSpa am ajBDipui ApAipadssj ftii pue 9 '
・
3 09- u^m jajB9a2 eaae ajnjEjaduiaj e due '︵U・品−∼a1︶sajn}EJSdiU9} jaMoi ujim sujajjed
SAEM '03
一
コ士︱−
一一
一−
一
気象衛星センター 技術報告 第23号 1991年n月
皿
a
●
●
[コ
●
一一
¬=
㎜㎜
一
一一
一一
一
一
一一
一‥
一
一一
−一
言ザ言ナプ……5
一一
一一
−
-
−
-
一一
一一
一
一
一一
一一
一
−一
一
−一
一
一一
・一
㎜
■■
一一
‥
一
一一
一一
一
一一
一一
一一
一一
一一
一
一一
一
一
一一
一一
一一
一
一一
一一
一−
一一
一一
一一
一一
‥一
一
一
一
一
一一
−
-一一一一
。一一一一 一 一
一一一一 一 一
tF°゜
!1
じ
つ。。っよ,‥
レ∇………∇2 ̄・92
c wnSu
な;
N0.23NOVEMBER
・.
‘︵U・吊−汐︶siods
−10−
NOTE
Xn OPLO IE ;d3Dxa g aij sb amec
一
TECHNICAL
jauSm B sgjEDipui v
一
CENTER
IBjaAaS SUIABU BSJE 9jrHBjadUI9J
一一
}0U
1
1
一一
SATELLITE
r一− 一一
METEOROLOGICAL
1991
き=
皿
ゞt
り
≪..
‘.’ld!L4
門
J
■-
゛1
t
[]
1
i
●
−
|
「7」
D
。柘
−11
j SB auiBC; nr ainSijt
│
一一
・(D.09- 09-)siuaiiEd 3ABM ajniEjgdiuai jau2iu sajBDipui v ' I D 0*80 ?b jdSDxa o -31
−j
1﹃﹁1
−
気象衛星センター 技術報告 第23号 1991年11月
METEOROLOGICAL
of HT1/HT2
SATELLITE
are measured
level using the assumption
CENTER
at 18/21㎞above
that the VEC
TECHNICAL
sea
NOTE
The
last IR image
the westward
from a vertical profilebased on the tropical atmo-
the surface
sphere model (McClatchey
and
both HTl
and HT2
than at 0540 UT.
et. al.,1972)。
shows that
mum
ward
(maxi-
The
next IR image
ward extension of HT2,
HT3,
hourly
at a height of 23 Im above sea level。
(Fig. 9,0740
the eastward extension of HTl.
UT)
the
shows
HT2
and the increase of surface temprerature
0740 UT
VIS image
(Fig. 3, (O)
correspond
°C), and
As
HT3
fall of pumiceous
compared
area
having
respectively
between
of HTl
east・
show
the
the volcano
(−70
lapilli was
and
°C), HT2
°C). It is important
to the
injected hot material
temperature
1t is
wave
the extension
to
of
after a
observed
on the
especially up to 100 km upwind。
The
on the appearance
on the VEC's
in all directions (30 minutes
HT3
volcano's activity is considered to have
appear
0740 −0840 UT
the high temperature areas west of the volcano.
continued based
temperature
(−50
that from
ground),
to
of HT2.
higher
- (c)
isotherm
occurred
heavy
shown in the
in
the volcano.
expansion
distance variations
recognize
the westward dispersion of
12 (a)
boundary
(−60
the rapid west-
surrounding the volcano. White VECs
surrounding
that
UT)shows
the decrease
side (Fig.10,(A))。
Figures
temperature of −27 °C),being located in the
center of HT2
temperature
to note
10,0840
of HT3,
patterns ( ―50∼−60°C)
a new temperature
area appears greater than −50 °C(HT3)
(Fig.
dispersion
the further eastward
interesting
have extended to 3 times larger
Furthermore,
1991
(A))。
tempera-
ture is equivalent to ambient temperature derived
In Fig. 8(0640 UT)the
IR image
N0.
23NOVEMBER
this additionally
dispersions
of HTl
and
suggests
that a radial f】ux of
occurred
after 0740 UT.
of a higher
several
hot
4.
spots
(々−30 °C)which surrounds the volcano (Fig. 9,
Siunmary
Visible
IR
imageries
of the
100
●X
べ
S
X
S
●
ゝ
溥
y4
vol-
Wind
Speed→/'叫
タハシ
’^rtr u ︵\ f︷r
200
/y
︵1︶ajnss3J(j
30 釦
︵qui) ajnssajH
0 0 0
0 0 0
Rり p0 7
500
gigantic
*^^. tl t
r″
and
?S
1000
`ヽ、
80
60
40
20
20
60
40 -20
0
20
lenperilure
(X) IPUPP£atijr£CC}
Figure
11 (a) Figure
11 (b)
Figure
11 Air
123.7E).
temperature.
00 UT
June
dew
point. and
wind
at(a)LAOAG(18.2N,120.5E),(b)LEGASPI(13.1N,
15, 1991.
−12−
気象衛星センター 技術報告 第23号 1991年11月
●X■▲
WEST
EAST
NORTH
︵日ざ
200
aouBisin
匹 ︵j︶DDUtJSin
150
100
50
0540
0640
Satellite
Figure
0640 0710 0740
0840
0710 0740
Observation
Satellite
Time (UT)
12 (a)
Observation
Figure
Time (UT)
12 (b)
300
0 0
20 15
︵1︶SSt召
250
□m
50
Saiellite
Observat
Figure
i on
Time
(UT)
12 (c)
Figure 12 Distance changes in the N, S, E, and W directions between the volcano and the isotherm
boundary of (a) HTl (-70 °C).(b) HT2 (-60 °C).(c) HT3 (-50°C).
canic eruption clouds (VECs)
from Mt. Pinatubo, ed
in the 0640 UT
visibleimage
and covered an
Philippines were taken on June 15,1991 from 0540 area 300 kl in diameter.
−0940 UT
at one hour intervals by the GMS-4 2)
The laieest average velocity of the VEC
ex ten-
satellite.These imageries were studied and indjcat- sion(47 m/sec) occurred from 0540 −0640 UT
ed the following: on the volcano's westward
1)A giant VEC
showing “wave” textures appear- 3 )At 0640 UT
−13−
was
side.
the surface temperature of VEC
METEOROLOGICAL
was
more
than
tropopause
(>−50
SATELLITE
CENTER
10 °C higher than the temperature
( ―80 °C),and
a temperature
°C) with
temperature
a small
hot
TECHNICAL
of
sis Division
area
for
spot (a maximum
of − 27 °C) appeared
of
the VEC.
4)
The
height
of the
high
temperature
(>−50°C)was心23㎞above
5)
The
VEC
radially
area
up
N0.
23NOVEMBER
1991
of the Meteorological
many
helpful
are given
Director,
and
Division,
for
manuscript,
sea level.
expanded
their
thanks
at the center
NOTE
Kroda,
Yotuya,
to Dr.
Particular
Analysis
System
their beneficial
and
University,
discussions.
to Mr.
Mr.
Satellite Center
Division
Engineering
comments
Koyaguchi,
on
the
Kumamoto
for his advice.
to 400 km in
Reference
diameter
increase
against
in its surface
0640 − 0740 UT,
surrounding
6)
At
an easterly wind
with
0840
UT
of the volcano.
than
the
creased,
The
occurred
VEC
further
surface
occurred
°C)
expanded
temperature
the
Funada,
H.
tion
of volcanic
chon.
up to
cal
up to 200 km upwind
surrounding
suggesting
injected hot material
from
present.
to 100 km upwind.
temperature
thereby
being
especially
−60 °Cspread
surface
temperature
An
several hot spots (^-30
the volcano
600 km in diameter,
of 20 m/sec.
and
Note,
from
observa・
volcano
El Chi-
Satellite Center
7, 13 −27 (inJapanese
Techni-
with
English
abstract).
greater
McClatchey,
R.
the
erties
of the
volcano
de
Envim.
Res.
flux
(1983):GMS-2
ashes
Meteorological
whereas
that a radial
K. Arai
of
Sawada,
after 0740 UT.
Y.
volcanic
image
A.
et al. (1972):Optical
atmosphere
Papers
(3rd
N0. 411.
ed.).
108 pp・
et al. (1987):Study
on
eruptions
eruption
data
based
obtained
by
on
propAFCRL
the
analyses
of
cloud
geostationary
Acknowledgments
Gratitude
is extended
to members
of the Analy-
meteorological
satellite (GMS).
Meteorol.
Inst.. No.
Res.
GMS-4号によるフィリピンのピナツボ火山噴火の火山雲の観測
徳野 正己
気象衛星センター解析課
フィリピンにあるピナツポ火山は,1991年6月15日大噴火をし,それによる巨大な火山
雲が発生した。
1991年6月15日5時40分から9時40分(世界標準時)の間に日本の静止気
象衛星「ひまわり4号」が観測した毎時間の可視・赤外画像からこの巨大な火山雲の特徴
を解析した結果,次のことがわかった。直径約300
kmの円盤状の巨大な火山雲が6時40分
の可視画像に現れた。この火山雲の表面には,波状性の隆起が見られた。火山雲の表面温
度は中心付近に−27°Cの高温点を持ち,圏界面温度(約一83°C)より10°C以上も高く観
測された。このことは,火山雲が成層圏に突入したことを意味している。 7時40分には,
約一30
°Cの高温域が,火山上空の周囲をリング状に取り巻くようにこの火山雲に現れた。
更に,この円盤状の火山雲は表面温度を上昇させながら,東風(約20
直径400
m/sec)に逆らって
kmにまで拡大した。8時40分には,火山周辺の火山雲の温度は低下したが,−60°C
以上の高温域は更に風上100
kmまで拡大した。このことは,火山雲に注入された高温の物
質が,7時40分の後に放射状に広がったことを示唆している。
14
Tech.
22. 335 pp・
Rep.
© Copyright 2026 Paperzz