BANQUE FEDERATIVE DU
CREDIT MUTUEL
ANNUAL FINANCIAL REPORT
2013
Banque Fédérative du Crédit Mutuel – Société Anonyme (French Limited Company) with share capital of €1,329,256,700
Headquarters: 34, rue du Wacken – 67913 Strasbourg Cedex 9 – Tel: +33 (0)3 88 14 88 14
Telegraphic address: CREDITMUT – Telex: CREMU X 880034 F – Fax: +33 (0)3 88 14 67 00
SWIFT address: CMCIFRPA – Trade and Companies Register Strasbourg B 355 801 929 – ORIAS No. 07 031 238
Intra-community VAT number: FR 48 355 801 929
CONTENT
I.
PRESENTATION OF BFCM GROUP ...............................................................................................3
I.1 - BFCM Group within the CM11-CIC Group .......................................................................................... 4
I.2 – BFCM group’s key figures – Solvency ratio and ratings ...................................................................... 6
I.3 - CM11-CIC Group organization and business lines................................................................................ 8
II.
CORPORATE GOVERNANCE OF BFCM .....................................................................................10
II.1 - BFCM Board of Directors ................................................................................................................... 11
II.2 - Report on the Board of Directors' operation and internal control procedures .................................... 22
II.3 - Statutory auditors' report on the report of the Chairman of the Board of Directors ........................... 35
II.4 - Report on the anti-money laundering and counter terrorist financing policy ..................................... 37
III.
FINANCIAL INFORMATION ABOUT BFCM GROUP ................................................................40
III.1 - BFCM group management report ..................................................................................................... 41
III.2 - Recent developments and outlook..................................................................................................... 47
III.3 - Risk Report........................................................................................................................................ 48
III.4 - Risks related to the group and to the banking activity ...................................................................... 68
III.5 - Consolidated financial statements of BFCM Group ......................................................................... 77
III.6 - Report of the Statutory Auditors on the consolidated financial statements of BFCM Group ......... 123
IV.
KEY FINANCIAL POINTS RELATING TO BFCM'S ANNUAL FINANCIAL STATEMENTS 125
IV.1 - Management report on BFCM's annual financial statements .......................................................... 126
IV.2 - BFCM’s financial statements........................................................................................................... 128
IV.3 - Information on subsidiaries and associated companies ................................................................... 159
IV.4 - Statutory auditors’ report on the company financial statements ...................................................... 161
V.
SOCIAL AND ENVIRONMENTAL RESPONSIBILITY .............................................................163
V.1 - General information .......................................................................................................................... 164
V.2 - Methodology - Indicators.................................................................................................................. 172
V.3 - CSR report – 2013 ............................................................................................................................ 177
V.4 – Certification by the independent auditor of the presence of employment, environmental and social
information in the management report ...................................................................................................... 182
VI.
LEGAL INFORMATION ABOUT BFCM .....................................................................................184
VI.1 - Shareholders .................................................................................................................................... 185
VI.2 - Statutory Auditors’ report on regulated agreements and commitments .......................................... 201
VI.3 - Sundry information ......................................................................................................................... 206
VII. ADDITIONAL INFORMATION ....................................................................................................210
VII.1 - Documents available to the public .................................................................................................. 211
VII.2 - Person responsible for the information ........................................................................................... 211
VII.3 - Person responsible for the annual financial report.......................................................................... 211
VII.4 - Statutory Auditors ........................................................................................................................... 211
VII.5 - BFCM annual financial report cross-reference table ..................................................................... 212
2
I.
PRESENTATION OF
BFCM GROUP
3
I.1 - BFCM Group within the CM11-CIC Group
The cooperative sector and the BFCM group together constitute the CM11-CIC group.
The regulatory scope (cooperative sector or Crédit Mutuel 11 Group or CM11 Group) consists of the
Crédit Mutuel Centre Est Europe, Crédit Mutuel Sud-Est, Crédit Mutuel Ile-de-France, Crédit
Mutuel Savoie-Mont Blanc, Crédit Mutuel Midi-Atlantique, Crédit Mutuel Centre, Crédit Mutuel
Dauphiné-Vivarais, Crédit Mutuel Loire-Atlantique et Centre-Ouest, Crédit Mutuel Méditerranéen,
Crédit Mutuel Normandie and Crédit Mutuel Anjou federations, the Caisses de Crédit Mutuel which
are members of their respective federations and Caisse Fédérale de Crédit Mutuel (CF de CM). This
entity owns 99% of Banque Fédérative du Crédit Mutuel.
BFCM Group consists of:
-
Banque Fédérative du Crédit Mutuel, CM11-CIC Group’s holding company, which owns a
93.8% equity interest in Crédit Industriel et Commercial (CIC) and also performs financing and
capital markets activities;
-
Crédit Industriel et Commercial, the holding company of CIC Group and head bank for the
network, which is also a regional bank in Ile-de-France and carries out investment, financing and
capital markets activities;
-
specialized institutions by business line in France and abroad.
CM11-CIC Group has 24.1 million customers, 4,669 points of sale and 65,430 employees.
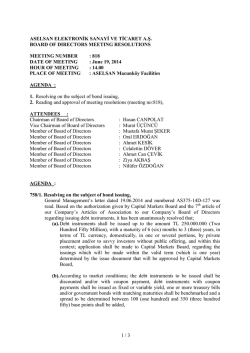
CM11-CIC Group and BFCM Group general organizational chart
GROUPE CM11-CIC
Périmètre règlementaire
Crédit
Groupe BFCM
Mutuel
11 Fédérations
(1)
Caisse Fédérale de Crédit
Mutuel
(CF de CM)
(Caisses 82,1% - ACM Vie Mut 17,9%)
Caisses
de Crédit Mutuel
des 11 fédérations
Centre Est Europe
Sud-Est
BANQUE FEDERATIVE DU CREDIT MUTUEL
(CF de CM 92,6% - Caisses régionales et Caisses locales 6,5%)
Financier
CIC Nord Ouest
100%
CIC Est
100%
Technologie
CIC Ouest
100%
CIC Sud Ouest
100%
CIC Lyonnaise de Banque
100%
Banca Popolare di Milano
6,60%
Euro Information • EID - EIP • EIS - Sicorfé • EP Surveillance • EIDS - ETS •
Euro GDS • Euro P3C • Euro TVS • EurAfric Information • IID / DPS •
OpenTrust • CardProcess • EI Telecom • Axxès • EP Services •
EuroInformation Intl’ • Factor Soft • Fivory SAS • Monetico
Assurance
Savoie-Mont Blanc
GACM • ACM Vie SAM • ACM Vie SA • Sérénis Vie • ICM LIfe • ACM IARD •
Sérénis Assurances • Partners Assurances • ACM Ré • ACM Services •
Procourtage • Agrupacio AMCI • ACMN IARD • RACC Seguros • RMAWatanya • Astree • Desjardins Assurances
Centre
Dauphiné-Vivarais
Loire-Atlantique Centre-Ouest
Méditerranéen
Normandie
Anjou
Crédit Industriel
et Commercial
Asset management* • Bail* • Epargne salariale* • Gestion* • Factor* •
Securities* • Titres* • Aidexport* • BECM • BECM Monaco • Filaction • ESN
• C2C • Crédit Mutuel – CIC Home Loan SFH • Fivory EME
Ile-de-France
Midi-Atlantique
93,8%
(BFCM)
Immobilier
Aménagement foncier* (Sarest) • Promotion immobilière* (Ataraxia) •
Participations immobilières* (Soparim) • Réalisations immobilières*
(Sofedim) • Agence immobilière* (Afedim) • Gestion immobilière* • Lease*
• Crédit Mutuel Habitat
4,40%
Banco Popular Español
50%
TARGOBANK Espagne
100%
TARGOBANK Allemagne
100%
54,6%
Gestion privée
CIC Banque Privée • CIC Banque Transatlantique (France, Luxembourg,
Belgique, Singapour, Montréal) • Banque de Luxembourg • Banque CIC
Suisse • CIC Banque Pasche • Dubly Douilhet Gestion
Capital - développement
CM-CIC Capital Finance
CIC Iberbanco
Cofidis Participations
Groupe SOFEMO
50%
50%
100%
Banque Casino
26,2%
BMCE Bank
33,5%
Banque de Tunisie
(1) Centre Est Europe ; Sud-Est ; Ile-de-France ; Savoie-Mont Blanc ; Midi-Atlantique ; Centre ; Dauphiné-Vivarais ; Loire-Atlantique et Centre-Ouest ; Méditerranéen ; Normandie ; Anjou
*Filiales CM-CIC
4
I.1.1 - The cooperative sector
The Caisses de Crédit Mutuel (CCM) are the lowest-level units of the banking network making up the
CM11-CIC Group. The local Caisses under the control of their stock-owning members are registered as
variable capital credit cooperative companies with limited liability, or as cooperative trading companies with
limited liability. Each local Caisse operates independently and provides local banking services.
The federations, entities with the status of associations in which membership is compulsory for the local
Caisses, are the policy-making bodies that set the Group’s strategic directions and organize solidarity among
the Caisses.
The Caisses de Crédit Mutuel, the ACM Vie mutual companies and the federations collectively own Caisse
Fédérale de Crédit Mutuel (CF de CM). This French corporation has the status of a cooperative banking
company ("société anonyme à statut de société coopérative de banque") and overall responsibility for the
delivery and coordination of the services common to the network. Caisse Fédérale de Crédit Mutuel
centralizes all the funds held on deposit by the Caisses while at the same time refinancing them and
allocating funds on their behalf as required by regulations (mandatory reserves, assigned deposits, etc.).
Initially serving the Caisses of the Crédit Mutuel Centre Est Europe (CMCEE) federation, Caisse Fédérale de
Crédit Mutuel has, through partnership agreements signed between 1993 and 2011, put its logistical and
financial support resources to work on behalf of the Caisses from 10 other federations. The collective
banking license for the successive new entities was granted by the French Credit Institutions and Investment
Firms Committee (Comité des établissements de crédit et des entreprises d’investissement, CECEI).
The CM11 network now comprises 1,382 Caisses, 2,015 points of sale and 6.8 million customers, including
4.8 million stock-owning members in 83 French departments, with a combined population of more than 45
million.
The 11 federations, the local Crédit Mutuel Caisses which are members of their respective federations and
Caisse Fédérale de Crédit Mutuel together make up the regulatory scope, also known as the cooperative
sector or CM11 Group. The cooperative sector owns a 99% equity interest in Banque Fédérative du Crédit
Mutuel (BFCM).
I.1.2 - BFCM Group
The current configuration of Banque Fédérative du Crédit Mutuel is the result of restructuring operations
carried out in 1992. The restructuring was designed to clarify the functions performed by the
Group’s various entities by distinguishing the cooperative activities of the parent company (local Caisses,
Caisse Fédérale de Crédit Mutuel and the federations) from the diversified operations controlled by BFCM, a
holding company.
BFCM is therefore the parent company of the group's subsidiaries and coordinates their activities. These
subsidiaries are active in finance, insurance, electronic banking and information technology. BFCM performs
the central refinancing function on behalf of CM11-CIC Group. It is responsible for financial relations with
large corporates and local authorities through its payment processing, lending and financial engineering
activities. BFCM also acts as custodian for investment funds (Organismes de Placement Collectif – OPC).
In its role as holding company, BFCM owns:
- 93.8% of Crédit Industriel et Commercial, CIC Group’s holding company and head bank of the
network, which also carries out investment, financing and capital markets activities;
-
52.8% of Groupe des Assurances du Crédit Mutuel, which controls ACM IARD SA and ACM Vie
SA and designs and manages insurance product lines in the property and casualty, liability, personal
and life insurance segments;
-
various institutions specialized by business line, both in France and abroad (including Banque
Européenne du Crédit Mutuel, Cofidis Group, Targobank Germany, CM-CIC Asset Management,
CM-CIC Factor, etc.).
BFCM, CIC, GACM and the various institutions specialized by business line all make up BFCM Group.
5
I.2 – BFCM group’s key figures – Solvency ratio and ratings
The 2011 figures take into account IAS19-R and the accounting treatment of the investment in Banco Popular Español.
2013
2012
Net banking income
8,445
8,159
7,740
Operating income
2,282
2,057
1,503
Net income
1,484
1,200
1,086
1,211
930
852
62%
63%
63%
Net income attributable to the group
Cost-to-income ratio
1
2011
(1) Ratio of overheads to net banking income
€ millions
397
400
16.0
18.3
20.0
Shareholder's equity and deeply subordinated securities
(€ billions)
382
Total Assets (€ billions)
2011
2012
2013
2011
2012
2013
Net customer laons (€ billions)
2013 structure of net laons
Other
7%
Operating
16%
165.4
165.8
169.6
Home
39%
2011
2012
2013
Consumer &
Revolving
14%
Equipment &
Leasing
25%
2013 structure 2013 of bank deposits
Customer deposits (€ billions)
Other savings
accounts, Home
purchase
savings
23%
excluding SFEF
Term accounts
30%
132.0
142.4
2012
2013
6,210
119.7
2011
Retail banking
Other
4%
Current
accounts
39%
2011
2012
2013
Insurance
Financing
Capital markets
Private banking
Private equity
-446
-449
-704
119
100
93
444
464
432
513
603
401
314
485
324
1,338
1,318
NBI by business line (€ millions)
875
5,854
6,215
Livrets bleus,
Livrets A
4%
Logistics & Holding
6
CM11-CIC Group European solvency ratio and BFCM ratings
Pursuant to Article 4.1 of CRBF Regulation 2000-03 of September 6, 2000 on prudential oversight on a
consolidated basis, BFCM, which is part of the CM11-CIC Group consolidation scope, is not subject to
compliance with management ratios on a sub-group basis or provisions regarding internal capital adequacy
referenced in Article 17bis of CRBF Regulation 97-02. This waiver also applies to the Basel II measures (see
Article 1 of CRBF decision of February 20, 2007).
As of December 31, 2013, reported equity and super-subordinated securities totaled €33.4 billion and Tier 1
capital was €22.6 billion.
Growth in total shareholders' equity and deeply subordinated securities (€ billions)
33.4
35.0
31.2
30.0
27.9
25.5
23.5
25.0
20.3
20.1
2007
2008
18.4
20.0
15.5
15.0
12.6
10.0
5.0
4.0
4.3
1996
1997
6.1
6.9
1998
1999
9.1
8.2
7.9
2000
2001
10.5
0.0
2002
2003
2004
2005
2006
2009
2010
2011
2012
2013
The core Tier 1 solvency ratio, calculated according to Basel 2.5 rules, was 14.6%, one of the best in Europe,
which facilitates the group's access to the financial markets. Information on CM11-CIC Group’s solvency
ratio risks are presented in the section “Information on Basel II Pillar 3”.
Under Basel 3 rules, defined in the Capital Requirements Regulation of June 26, 2013 effective from January
1, 2014, the core Tier 1 ratio at December 31, 2013 was 13.0%. In addition, the group's leverage ratio was
5.2%.
16%
T1 capital ratio *
Basel 2.5
14.10%
12.50%
12%
10.30%
10%
10.80%
(without transitional
measures)
Core Tier 1 ratio**
Overall ratio**
Leverage ratio
13.0%
15.8%
5.2%
14.60%
14%
Basel 3
At 12/31/2013
(minimum ratio of 3% to be
complied with by January
1, 2018)
11.00%
8.78%
** as required under CRR/CRD4; risk-weighted for the
equity-accounted value of group insurance companies
8%
6%
2008
2009
2010
2011
2012
2013
* T1 ratio from 2008 to 2011 : with Basel I additional requirements in terms of floors
BFCM's short-term rating assigned by Fitch Ratings was downgraded on July 17, 2013 from F1+ to F1
following the downgrade of the French government's rating on July 12, 2013. The short-term ratings
assigned by Standard & Poor's and Moody's remained unchanged in 2013.
Moody's and Fitch Ratings confirmed BFCM's long-term rating, while Standard & Poor's reduced it by a
notch given France's outlook and economic environment. This downgrade does not call into question Crédit
Mutuel's fundamentals. The group’s ratings remain as high as those of any French bank and attest to the
soundness of its financial structure.
7
Long-term rating
Short-term rating
Outlook
Standard & Poor’s
A
A-1
Stable
Moody’s
Aa3
P-1
Negative
Fitch Ratings
A+
F1
Stable
I.3 - CM11-CIC Group organization and business lines
CM11-CIC Group, which consists of the cooperative sector and BFCM Group, is controlled by 11 Crédit
Mutuel federations: Centre Est Europe, du Sud-Est, Île-de-France, Savoie-Mont Blanc, Midi-Atlantique,
Loire-Atlantique et Centre-Ouest, du Centre, Normandie, Dauphiné-Vivarais, Méditerranéen and Anjou.
These federations are members of the Confédération Nationale du Crédit Mutuel, the central body whose
mission is to represent the group before the public authorities, promote and defend its interests and exercise
control over the federations.
The competitive positioning1 is analyzed at the level of the Crédit Mutuel Group as a whole, whose retail
banking and insurance business lines make it a major retail banking and insurance player in France. Crédit
Mutuel Group has a 17.3% market share for bank credit and a 14.9% market share for deposits. In other
segments, Crédit Mutuel Group ranks as follows:
No. 1 banking and insurance company for property and casualty insurance
No. 1 bank for associations and works councils
No. 2 bank in electronic banking
No. 2 bank in farm lending
No. 3 bank in home loans
No. 3 bank for SMEs
No. 1 bank for consumer credit in Europe
CM11-CIC Group’s market share for deposits and bank credit remained generally stable in 2013, at 11.38%
and 13.42%, respectively.
CM11-CIC market share
(source CEFIT)
2011
13.31%
13.24%
13.42%
2012
2013
11.39%
11.50%
Deposits
11.38%
Credits
The group did not market new products or carry out new activities in 2013.
1 The
sources of the rankings are explicitly stated; otherwise the information is based on internal sources.
8
BFCM Group simplified organizational chart
BFCM Group
Retail banking
Retail banking networks
CIC
CIC
Ile de
France
Banque
Européenne du
Crédit Mutuel
TARGOBANK
(Germany)
CIC Iberbanco
TARGOBANK
(Spain)
Regional
Banks
Specialized products and services
Groupe
Cofidis
Participations
Groupe
SOFEMO
Banque
Casino
CM-CIC
Factor
CM-CIC
Bail
CM-CIC
Lease
CM-CIC
Asset
Management
CM-CIC
Epargne
Salariale
CM-CIC
Immobilier
Crédit Mutuel-CIC
Home Loan SFH
Insurance
Groupe des
Assurances du
Crédit Mutuel
Financing
BFCM – CIC
Large corporate
and Institutional
Customers
CIC
Specialized
Financing
CIC
International
Activities
Market activities
CM-CIC
Marchés
CM-CIC
Securities
Private banking
Banque de
Luxembourg
Groupe Banque
Transatlantique
Banque CIC Suisse
CIC
Banque Pasche
CIC
Singapour
Banque privée
Private equity
CM-CIC
Capital Finance
9
II. CORPORATE
GOVERNANCE OF
BFCM
10
II.1 - BFCM Board of Directors
II.1.1 - Composition of the Board of Directors
The legal provisions related to the composition of the Board of Directors and the terms of office of its
members are presented below.
The May 7, 2013 Ordinary Shareholders' Meeting renewed the terms of office of the following directors:
Gérard Cormorèche, Etienne Grad, Michel Lucas and Jean-Paul Martin.
On May 7, 2013, the Board of Directors renewed the term of office of the Chairman and CEO and co-opted
Hervé Brochard, a member of the Board of Directors, to replace Eckart Thomä.
In addition, on November 22, 2013 the Board of Directors appointed Aimée Brutus as non-voting director,
replacing Alain Demare.
Summary table of the composition of the Board of Directors
Director's name
Michel Lucas
Position
Chairman and CEO
Date of
appointment
Expiration
date
10/22/2010
12/31/2015
Jacques Humbert
Director
5/3/2006
12/31/2014
Jean-Louis Boisson
Director
5/3/2006
12/31/2014
Gérard Bontoux
Director
5/6/2009
12/31/2014
Hervé Brochard
Director
5/10/2013
12/31/2013
Maurice Corgini
Director
5/3/2006
12/31/2014
Gérard Cormorèche
Director
5/10/2007
12/31/2015
Roger Danguel
Director
5/7/2008
12/31/2013
François Duret
Director
5/11/2011
12/31/2013
Pierre Filliger
Director
5/11/2011
12/31/2013
Jean-Louis Girodot
Director
5/7/2008
12/31/2013
Etienne Grad
Director
12/17/2010
12/31/2015
Jean-Paul Martin
Director
5/10/2007
12/31/2015
Gérard Oliger
Director
5/7/2008
12/31/2013
Albert Peccoux
Director
5/3/2006
12/31/2014
Alain Têtedoie
Director
5/10/2007
12/31/2014
Michel Vieux
Caisse Fédérale du Crédit Mutuel
Maine-Anjou, Basse-Normandie
Director
5/11/2011
12/31/2013
Director
11/18/2011
12/31/2014
Representative
Daniel Leroyer
Non-voting directors:
René Barthalay, Jean Louis Bazille, Yves Blanc, Michel Bokarius, Aimée Brutus, Gérard Diacquenod, MarieHélène Dumont, Bernard Flouriot, Monique Groc, Robert Laval, Fernand Lutz, Jacques Pages, Alain Tessier,
Dominique Trinquet.
11
II.1.2 - Information regarding members of the Board of Directors and Executive Management
II.1.2.1 - Board of Directors
Michel Lucas, Chairman and Chief Executive Officer
Born May 4, 1939 in Lorient (56)
Work address:
Fédération du Crédit Mutuel Centre Est Europe
34, rue du Wacken 67000 Strasbourg
Other functions:
Chairman and Chief Executive Officer: Carmen Holding Investissement, Crédit Industriel et
Commercial.
Chairman of the Board of Directors: Confédération Nationale du Crédit Mutuel, Fédération du
Crédit Mutuel Centre Est Europe, Caisse Fédérale de Crédit Mutuel, Groupe des Assurances du
Crédit Mutuel, Assurances du Crédit Mutuel Vie SA, Assurances du Crédit Mutuel IARD SA,
Assurances du Crédit Mutuel Vie SAM, Banque du Crédit Mutuel Île-de-France, International
Information Developments, Direct Phone Services, Républicain Lorrain, Est Républicain, Dernières
Nouvelles d’Alsace, Liberté de l’Est.
Chairman: Crédit Mutuel Cartes de Paiements, Europay France.
Chairman of the Supervisory Board: Banque Européenne du Crédit Mutuel, Euro Information
Production (GIE).
Vice-Chairman of the Supervisory Board: CIC Iberbanco, Banque de Luxembourg (Luxembourg).
Member of the Board of Directors: ACMN IARD, Astree (Tunis), Assurances Générales des Caisses
Desjardins (Quebec), Banque de Tunisie (Tunis), Banque Marocaine du Commerce Extérieur, CIC
Banque Transatlantique, Banque Transatlantique Belgium (Brussels), Caisse de Crédit Mutuel "Grand
Cronenbourg", CRCM Midi-Atlantique, CIC Lyonnaise de Banque, Dauphiné Libéré, Est Bourgogne
Média, Groupe Progrès SA.
Member of the Supervisory Board: Manufacture Beauvillé, CM-CIC Services (GIE), CM-CIC
Capital Finance.
Member of the Management Committee: Euro Information, Euro Information Développement,
EBRA.
Permanent representative of BFCM on the Management Board of Sofédis.
Jacques Humbert, Vice-Chairman of the Board of Directors
Born July 7, 1942 in Patay (45)
Work address:
Fédération du Crédit Mutuel Centre Est Europe
34, rue du Wacken 67000 Strasbourg
Other functions:
Chairman: Union des Caisses de Crédit Mutuel du District de Mulhouse.
Member of the Board of Directors: Caisse de Crédit Mutuel la Doller, Fédération du Crédit Mutuel
Centre Est Europe, Caisse Fédérale de Crédit Mutuel, Société Française d’Edition de Journaux et
d’Imprimés Commerciaux "l’Alsace".
Permanent representative of ADEPI on the Board of Directors of GACM, of BFCM on the Board
of Directors of Crédit Industriel et Commercial.
12
Jean-Louis Boisson, Member of the Board of Directors
Born August 2, 1948 in Bresse (01)
Work address:
Fédération du Crédit Mutuel Centre Est Europe
34, rue du Wacken 67000 Strasbourg
Other functions:
Chairman: Union des Caisses de Crédit Mutuel du District de Bourgogne Champagne
Chairman of the Board of Directors: Caisse de Crédit Mutuel de Montbard Venarey
Vice-Chairman of the Board of Directors: Fédération du Crédit Mutuel Centre Est Europe
Vice-Chairman of the Supervisory Board: Banque Européenne du Crédit Mutuel
Member of the Board of Directors: Confédération Nationale du Crédit Mutuel, Caisse Fédérale de
Crédit Mutuel, Targobank Spain, Est Bourgogne Média
Member of the Supervisory Board: Euro Information Production
Gérard Bontoux, Member of the Board of Directors
Born March 7, 1950 in Toulouse (31)
Work address:
Crédit Mutuel Midi-Atlantique
6, rue de la Tuilerie - 31112 Balma Cedex
Other functions:
Chairman: Fédération du Crédit Mutuel Midi-Atlantique, Caisse Régionale du Crédit Mutuel MidiAtlantique
Member of the Board of Directors: Confédération Nationale du Crédit Mutuel, Caisse Fédérale de
Crédit Mutuel, Caisse de Crédit Mutuel Toulouse Saint-Cyprien
Member of the Supervisory Board: Banque Européenne du Crédit Mutuel
Permanent representative of CRCM Midi-Atlantique on the Board of Directors of GACM, of
Marsovalor on the Board of Directors of CIC Sud-Ouest.
Hervé Brochard, Member of the Board of Directors
Born March 6, 1948 in Colmar (68)
Work address:
Fédération du Crédit Mutuel de Normandie
17, rue du 11 novembre - 14052 Caen Cedex
Other functions:
Chairman of the Board of Directors: Fédération du Crédit Mutuel de Normandie, Caisse
Régionale de Crédit Mutuel de Normandie, Caisse de Crédit Mutuel de Caen Ecuyère, Créavenir,
Norfi
Vice-Chairman of the Board of Directors: Association des Amis de Jean Bosco
Member of the Board of Directors: Confédération Nationale du Crédit Mutuel, Caisse Fédérale de
Crédit Mutuel
Member of the Supervisory Board: Banque Européenne du Crédit Mutuel
13
Permanent representative: of Caisse Régionale du Crédit Mutuel de Normandie on the Board of
Directors of GACM, of Fédération du Crédit Mutuel de Normandie on the Board of Directors of
Centre International du Crédit Mutuel.
Maurice Corgini, Member of the Board of Directors
Born September 27, 1942 in Baume-les-Dames (25)
Work address:
Fédération du Crédit Mutuel Centre Est Europe
34, rue du Wacken 67000 Strasbourg
Other functions:
Chairman: Union des Caisses de Crédit Mutuel du District de Besançon
Member of the Board of Directors: Fédération du Crédit Mutuel Centre Est Europe, Caisse
Agricole Crédit Mutuel, Crédit Industriel et Commercial, Caisse de Crédit Mutuel Baume-ValdahonRougemont
Co-Managing Partner: Cogithommes Franche-Comté
Gérard Cormorèche, Member of the Board of Directors
Born July 3, 1957 in Lyon (69)
Work address:
Crédit Mutuel du Sud-Est
8-10, rue Rhin et Danube – 69266 Lyon Cedex 09
Other functions:
Chairman: Fédération du Crédit Mutuel du Sud-Est, Caisse de Crédit Mutuel du Sud-Est, Cecamuse
Chairman of the Board of Directors: Caisse de Crédit Mutuel Neuville-sur-Saône, Caisse Agricole
Crédit Mutuel
Vice-Chairman of the Board of Directors: Confédération Nationale du Crédit Mutuel, MTRL
Member of the Board of Directors: Caisse Fédérale de Crédit Mutuel, Société des Agriculteurs de
France, Cautionnement Mutuel de l’Habitat (CMH)
Vice-Chairman of the Supervisory Board: CMAR (Crédit Mutuel Agricole et Rural)
Managing Partner: Scea Cormorèche Jean-Gérard, Sàrl Cormorèche
Permanent representative of CCM Sud-Est on the Board of Directors of ACM Vie SAM
Roger Danguel, Member of the Board of Directors
Born August 3, 1946 in Sélestat (67)
Work address:
Fédération du Crédit Mutuel Centre Est Europe
34, rue du Wacken 67000 Strasbourg
Other functions:
Chairman: Union des Caisses de Crédit Mutuel du District de Sélestat
Chairman of the Board of Directors: Caisse de Crédit Mutuel de Sélestat-Scherwiller
Member of the Board of Directors: Fédération du Crédit Mutuel Centre Est Europe, Confédération
Nationale du Crédit Mutuel
Member of the Supervisory Board: Banque Européenne du Crédit Mutuel, Editions Coprur
14
Permanent representative of Banque Fédérative du Crédit Mutuel on the Board of Directors of
Caisse Centrale du Crédit Mutuel
François Duret, Member of the Board of Directors
Born March 18, 1946 in Chartres (28)
Work address:
Fédération du Crédit Mutuel du Centre
105, Faubourg Madeleine 45920 Orléans Cedex 9
Other functions:
Chairman: Fédération Régionale des Caisses de Crédit Mutuel du Centre, Caisse Régionale de
Crédit Mutuel du Centre, Caisse de Crédit Mutuel Agricole du Centre, Caisse de Crédit Mutuel
d’Auneau (Eure-et-Loir), Soderec
Vice-Chairman: Syndicat Agricole du Dunois
Member of the Board of Directors: Caisse Fédérale de Crédit Mutuel, CRCM
Vice-Chairman of the Board of Directors: Confédération Nationale du Crédit Mutuel
Member of the Supervisory Board: Banque Européenne du Crédit Mutuel
Permanent representative: of Caisse Régionale du Crédit Mutuel du Centre on the Board of
Directors of ACM Vie SAM and of Caisse de Crédit Mutuel Agricole as a member of the Board of
Directors, of Caisse de Crédit Mutuel Agricole du Centre on the Board of Directors of Fédération du
Crédit Mutuel Agricole et Rural, of Caisse Régionale du CMC as Chairman of the Supervisory
Board of Soderec
Pierre Filliger, Member of the Board of Directors
Born November 27, 1943 in Rixheim (68)
Work address:
Fédération du Crédit Mutuel Méditerranéen
494, avenue du Prado BP 115 – 13267 Marseille Cedex 08
Other functions:
Chairman: Fédération du Crédit Mutuel Méditerranéen, Caisse Régionale du Crédit Mutuel
Méditerranéen, the Camefi local Caisse, the Marseille Prado local Caisse, the Crédit Mutuel
Méditerranéen local Caisses being created
Member of the Board of Directors: Confédération Nationale du Crédit Mutuel, Caisse Fédérale de
Crédit Mutuel
Permanent representative of Crédit Mutuel Méditerranéen to ACM Vie SAM
Non-voting director: Board of Directors of Crédit Industriel et Commercial
Jean-Louis Girodot, Member of the Board of Directors
Born February 10, 1944 in Saintes (17)
Work address:
Crédit Mutuel Île-de-France
18, rue de la Rochefoucault 75439 Paris Cedex 09
Other functions:
Chairman of the Board of Directors: Fédération des Caisses de Crédit Mutuel d’Ile-de-France,
Caisse Régionale de Crédit Mutuel d’Ile-de-France, Caisse de Crédit Mutuel de Paris Montmartre
Grands Boulevards, several Crédit Mutuel Caisses during their start-up phase
15
Chairman: Comité Régional pour l’Information Economique et Sociale (CRIES), AUDIENS,
Mutuelle Univers-Mutualité
Vice-Chairman: Chambre Régionale de l’Economie Sociale et Solidaire d’ Ile-de-France (CRESS),
Coopérative d’Information et d’Edition Mutualiste (CIEM)
General Secretary: Fédération Nationale de la Presse Spécialisée (FNPS), Syndicat de la Presse
Magazine et Spécialisée
Member of the Board of Directors: Confédération Nationale du Crédit Mutuel, Caisse Fédérale de
Crédit Mutuel, AFDAS, Crédit Industriel et Commercial, Centre International du Crédit Mutuel
Member of the Supervisory Board: Euro Information Production – WELCARE
Permanent representative: of Caisse Régionale du Crédit Mutuel Île-de-France on the Board of
Directors of ACM Vie SAM, of FNPS on the Commission Paritaire des Publications et Agences de
Presse
Etienne Grad, Member of the Board of Directors
Born December 26, 1952 in Illkirch Graffenstaden (67)
Work address:
Fédération du Crédit Mutuel Centre Est Europe
34, rue du Wacken 67000 Strasbourg
Other functions:
Chairman: Union des Caisses de Crédit Mutuel de la Communauté Urbaine de Strasbourg, SAS
Grad Etienne Conseil et Développement
Chairman of the Board of Directors: Caisse de Crédit Mutuel Cours de l’Andlau
Member of the Board of Directors: Fédération du Crédit Mutuel Centre Est Europe
Managing Partner: SCI Lemilion
Daniel Leroyer, permanent representative of CFCM Maine-Anjou et Basse-Normandie, Member
of the Board of Directors
Other functions
Chairman of the Board of Directors: Fédération du Crédit Mutuel de Maine-Anjou Basse
Normandie, Caisse Fédérale du Crédit Mutuel Maine-Anjou Basse Normandie, Caisse Générale de
Financement (CAGEFI), Créavenir (Association), Caisse de Crédit Mutuel du Pays Fertois, Caisse
de Crédit Mutuel Solidaire de Maine-Anjou Basse Normandie
Member of the Board of Directors: Confédération Nationale du Crédit Mutuel, SAS Assurances du
Crédit Mutuel Maine-Anjou Normandie, Crédit Industriel et Commercial, SAS Volney Bocage
Vice-Chairman of the Supervisory Board: Soderec
Member of the Executive Committee: Fondation du Crédit Mutuel
Permanent representative of Fédération du Crédit Mutuel Maine-Anjou, Basse-Normandie as
member of the Board of Directors of Gie Cloe Services and as Vice-Chairman of the Board of
Directors of Centre International du Crédit Mutuel; of Caisse Fédérale du Crédit Mutuel de MaineAnjou et Basse Normandie on the Board of Directors of SAS Volney Développement, of Assurances
du Crédit Mutuel IARD SA.
16
Other functions exercised by Caisse Fédérale de Crédit Mutuel Maine-Anjou, Basse-Normandie
Chairman of the Board of Directors: SAS Assurances du Crédit Mutuel Maine-Anjou, Normandie
Member of the Board of Directors: Caisse Centrale du Crédit Mutuel, Assurances du Crédit
Mutuel IARD SA, Crédit Mutuel Paiements Electroniques CMPE, CM-CIC Epargne Salariale, SAS
Océan Participations, Gie Cloe Services, SCIC d’HLM Mayenne Logis Groupe CIL 53, SA Logis
Familial Mayennais Groupe CIL 53, Groupe des Assurances du Crédit Mutuel, SAS Volney
Développement, SAS Volney Bocage
Member of the Supervisory Board: Soderec
Member of the Management Committee: Euro Information SAS
Managing Partner: Sidel SNC
Jean-Paul Martin, Member of the Board of Directors
Born October 22, 1939 in Metz (57)
Work address:
Fédération du Crédit Mutuel Centre Est Europe
34, rue du Wacken 67000 Strasbourg
Other functions:
Chairman: Union des Caisses de Crédit Mutuel du District de Metz
Member of the Board of Directors: Fédération du Crédit Mutuel Centre Est Europe - CME 57
Member of the Supervisory Board: Targobank Deutschland GmbH – Targo Management AG –
Targobank AG – CM Akquisitions GmbH
Gérard Oliger, Member of the Board of Directors
Born July 7, 1951 in Bitche (57)
Work address:
Fédération du Crédit Mutuel Centre Est Europe
34, rue du Wacken 67000 Strasbourg
Other functions:
Chairman: Union des Caisses de Crédit Mutuel du District de Sarreguemines
Chairman of the Board of Directors: Caisse de Crédit Mutuel Emile Gentil (Volmunster)
Member of the Board of Directors: Fédération du Crédit Mutuel Centre Est Europe
Albert Peccoux, Member of the Board of Directors
Born November 2, 1939 in St. Martin Bellevue (74)
Work address:
Crédit Mutuel Savoie-Mont Blanc
96, avenue de Genève BP56 74054 Annecy Cedex
Other functions:
Chairman: Fédération du Crédit Mutuel Savoie-Mont Blanc, Caisse Régionale du Crédit Mutuel
Savoie-Mont Blanc
Member of the Board of Directors: Confédération Nationale du Crédit Mutuel, Caisse Fédérale de
Crédit Mutuel, Caisse de Crédit Mutuel d’Annecy-les-Fins, Centre International du Crédit Mutuel
17
Permanent representative of CRCM Savoie-Mont Blanc on the Board of Directors of ACM Vie
SAM
Alain Têtedoie, Member of the Board of Directors
Born May 16, 1964 in Loroux Bottereau (44)
Work address:
Fédération du Crédit Mutuel de Loire-Atlantique et du Centre Ouest
46, rue du Port Boyer BP 92636 – 44236 Nantes Cedex 3
Other functions:
Chairman: Fitega, Fiterra
Chief Executive Officer: Nanteurop
Chairman of the Board of Directors: Fédération du Crédit Mutuel de Loire-Atlantique et du
Centre Ouest, Caisse Régionale du Crédit Mutuel de Loire-Atlantique et du Centre-Ouest
Vice-Chairman of the Board of Directors: Caisse de Crédit Mutuel de Saint Julien de Concelles
Member of the Board of Directors: Confédération Nationale du Crédit Mutuel, Caisse Fédérale de
Crédit Mutuel
Chairman of the Supervisory Board: CM-CIC Services
Chairman of the Supervisory Board: CM-CIC Immobilier
Member of the Supervisory Board: Banque Européenne du Crédit Mutuel
Permanent representative: - of Fédération du Crédit Mutuel LACO to the Chairmanship of
Investlaco, of Caisse Régionale de Crédit Mutuel LACO on the Board of Directors of ACM Vie and
Managing Board of SCI Champs de Mars 2015, of EFSA on the Board of Directors of Banque CICOuest, of Ufigestion 2 on the Board of Directors of CM-CIC Bail
Michel Vieux, Member of the Board of Directors
Born April 12, 1951 in Gap (05)
Work address:
Fédération du Crédit Mutuel Dauphiné-Vivarais
130-132, avenue Victor Hugo 26009 Valence Cedex
Other functions:
Chairman of the Board of Directors: Fédération du Crédit Mutuel Dauphinais-Vivarais, CCM
Pierrelatte
Vice-Chairman: "La Cascade" association
Member of the Supervisory Board: Banque Européenne du Crédit Mutuel
Member of the Board of Directors: Caisse Fédérale de Crédit Mutuel, Confédération Nationale du
Crédit Mutuel, CCM Agriculture de Valréas
II.1.2.2 - Executive Management
Alain Fradin, Chief Operating Officer
Born May 16, 1947 in Alençon (61)
Work address:
Banque Fédérative du Crédit Mutuel
34 rue du Wacken 67000 Strasbourg
18
Other functions:
Chairman: CIC Migrations
Chairman of the Board of Directors: Targobank Spain, CM-CIC Bail
Chairman of the Supervisory Board: CIC Iberbanco, Cofidis, Cofidis Participations
Vice-Chairman of the Supervisory Board: Targobank Deutschland GmbH, Targobank AG,
Targo Management AG, CM Akquisitions GmbH
Chief Executive Officer: Confédération Nationale du Crédit Mutuel, Caisse Centrale du
Crédit Mutuel, Fédération du Crédit Mutuel Centre Est Europe, Caisse Fédérale de Crédit
Mutuel
Member of the Board of Directors: Boréal, CM-CIC Titres, Banque du Crédit Mutuel Île-deFrance, Banco Popular Español
Member of the Management Committee: Euro-Information, Bischenberg, EI Telecom
Member of the Supervisory Board: CM-CIC Services, Eurafric Information.
Permanent representative: of CIC on the Management Committee of Euro GDS, of CIC
Participations on the Board of Directors of CIC Nord-Ouest and of CIC Ouest, of Groupe des
Assurances du Crédit Mutuel on the Board of Directors of Sérénis Vie, of BFCM on the Board
of Directors of Crédit Mutuel Cartes de Paiements, of CFdeCM on the Board of Directors of
Crédit Mutuel Paiements Electroniques
II.1.2.3 - Remuneration of key executives
Guidelines
On October 23, 2008, Crédit Mutuel Group and the French government signed the standard agreement
related to the new government guarantee provided to the financial sector. Under this agreement, the group
made several commitments regarding the status and remuneration of and commitments to the directors and
corporate officers, in addition to those required by the applicable laws and regulations. Several decisions
were taken in this regard by BFCM's Board of Directors on December 19, 2008 and by CIC's Supervisory
Board on February 26, 2009.
BFCM does not refer to the AFEP-MEDEF corporate governance code given that 95% of its shares are held
by entities of Crédit Mutuel Group.
As a result of the change in CIC's management method and in the directors and corporate officers of CIC and
BFCM, the respective boards of the two companies, at meetings on May 11 and July 1, 2011 for BFCM and
May 19, 2011 for CIC, defined the new remuneration policies for these officers and the commitments made
to them.
This remuneration and these commitments were set by the governing bodies of BFCM and CIC on the
recommendations of the respective remuneration committees.
Non-executive corporate officers – in other words all directors except the Chief Executive Officer – do not
receive directors' fees or remuneration of any kind.
Implementation
The key executives affected by the remuneration policies include the Chairman and Chief Executive Officer
and the Chief Operating Officer.
The Chairman and Chief Executive Officer does not have an employment contract, and the employment
19
contract of the Chief Operating Officer was suspended effective May 1, 2011.
Acting on the recommendation of the Remuneration Committee, on May 19, 2011 CIC's Board of Directors
decided to make an annual payment of €550,000 to Michel Lucas as remuneration for his term of office as
Chairman and Chief Executive Officer of CIC. The Board also voted to pay Michel Lucas, in the event his
term of office is terminated, an amount set at one year's remuneration for his service as Chief Executive
Officer of CIC. The termination payment is subject to the achievement of a performance objective, which is
pegged to an increase in the group’s IFRS-compliant overall consolidated equity for the period from January
1, 2011 to the termination date. This agreement regarding the termination indemnity was submitted to CIC's
Shareholders' Meeting on May 24, 2012 for approval, following the special report of the statutory auditors.
Acting on the recommendation of the Remuneration Committee, on July 1, 2011 BFCM’s Board of Directors
decided to pay Michel Lucas the gross annual sum of €250,000 starting in 2011 as remuneration for his term
of office as Chairman and Chief Executive Officer of BFCM, and to give him the use of a company car.
Acting on the recommendation of the Remuneration Committee, on May 11, 2011 BFCM's Board of
Directors decided to set the gross annual fixed remuneration of Alain Fradin at €800,000 and to give him the
use of a company car, benefits under the accidental death and disability plan and, where applicable, variable
remuneration, the amount of which would be determined by a decision of the Board of Directors on the
recommendation of the Remuneration Committee. As an employee, Alain Fradin is subject to the company
supplementary pension rules of January 1, 2008. The Remuneration Committee therefore proposed that these
pension rules be applied to Alain Fradin’s remuneration, in his capacity as Chief Operating Officer of BFCM,
under the same conditions applicable to all group employees. The Board also decided to create a termination
indemnity for Alain Fradin equivalent to one year’s gross salary, calculated on the basis of the 12-month
average over the period prior to the end of his term of office. The termination payment is subject to the
achievement of a performance objective, which is pegged to an increase in the group’s IFRS-compliant
overall consolidated equity for the period from January 1, 2011 to the termination date. With respect to this
term of office, the above-mentioned payment does not come at the expense of the payment that he would
receive as an employee pursuant, in particular, to the industrial agreements applicable at the group. This
agreement regarding the termination indemnity was submitted to BFCM's Shareholders' Meeting on May 10,
2012 for approval, following the special report of the statutory auditors.
The remuneration received by the group’s key executives is presented in the tables below.
During the year, the group’s key executives also benefited from the group accidental death and disability
plans and, in the case of the Chief Operating Officer, the group's supplementary pension plan.
However, the group's key executives did not receive any other specific benefits.
They did not receive any equity securities, warrants or options to purchase BFCM or CIC shares. In addition,
they do not receive directors' fees as a result of the duties they perform, whether at group companies or at
other companies but as a result of their functions at the group.
The group’s key executives may also hold assets with or borrow funds from the group banks under the same
conditions as those offered to all employees. As of December 31, 2013 they did not have any borrowings of
this type.
20
Remuneration paid to the group's key executives from January 1 to December 31, 2013
In-kind
benefits
(c)
Employer
contributions
for
supplementar
y benefits
Total
2013
Amount in € (a)
Origin
Fixed
portion
Variable
portion
(b)
Michel Lucas
BFCM
CIC
250,000
550,000
0
5,187
538
255,187
550,538
Alain Fradin
BFCM
800,000
0
3,725
8,184
812,057
In-kind
benefits
(c)
Employer
contributions
for
supplementary
benefits
Total
2012
Amount in € (a)
Origin
Fixed
portion
Variable
portion
(b)
Michel Lucas
BFCM
CIC
250,000
550,000
0
Alain Fradin
BFCM
800,000
0
5,298
4,346
529
255,298
550,529
8,184
812,530
(a) These amounts are the gross amounts paid out by the company corresponding to payments made during the year.
(b) Any variable portion would be decided by BFCM's Remuneration Committee at a meeting following the
Shareholders' Meeting held to approve the previous year’s financial statements. The variable portion paid out in a given
year therefore relates to the previous year.
(c) Company cars exclusively.
Order 2014-158 of February 20, 2014, which contains various provisions for adapting financial legislation to
EU law and transposes the CRD IV directive, introduced Article L.511-73 into the French Monetary and
Financial Code which stipulates that "The Ordinary Shareholders' Meeting of credit institutions and finance
companies is consulted annually regarding the overall amount of remuneration of any kind paid during the
previous year to the persons mentioned in Article L. 511-71". This includes the accountable managers and
the categories of employees, including risk-takers, persons performing a control function and any employee
who, based on his/her total income, is in the same salary bracket, whose professional activities have a
material impact on the risk profile of the company or group.
For all persons at CM-CIC Group who meet the above criteria, the total amount for 2013 as set out in the
aforementioned Article L.511-73 was €31,411,340.
In addition to the above data, note 37 to the consolidated financial statements of BFCM Group, provided on
pages 123 of this document, respectively, describe the relationships with the group's key executives and
indicate the total amount of the remuneration paid to them.
II.1.2.4 - Independent directors
Although it is unlisted, BFCM is part of a decentralized group whose directors are eligible to be members of
the Board of Directors as a result of their own elected status.
The mechanism works as follows. Each Caisse of Crédit Mutuel elects the members of its Board of Directors
at its Shareholders' Meeting (which includes all stock-owning members). From among these members, the
Caisses elect their representative to the District, a body that jointly represents a group of Crédit Mutuel
Caisses; the Chairman of the District becomes a full member of the Board of Directors of the federation, the
policy-making body for a given group of Crédit Mutuel Caisses. This status enables them to become
members of the Board of Directors of Caisse Fédérale de Crédit Mutuel and its subsidiary, BFCM.
21
This bottom-up election method starting with the local Caisses gives BFCM directors legitimacy and
independence equivalent to that of independent directors at listed companies.
There are no financial ties or conflicts of interest between the unpaid duties performed at the Crédit Mutuel
Caisses, the District and BFCM.
This legitimacy, which results from the internal election processes, is renewed at the time of each District
election (every four years).
Whenever the term of office of a District Chairman ends, this person's term of office at BFCM also ends,
even if it has not expired.
II.1.2.5 - Conflicts of interest at the level of the administrative, management and supervisory
bodies
To BFCM’s knowledge, the members of the Board of Directors and the Chief Executive Officer have no
potential conflicts of interest between their duties towards BFCM and their private interests.
II.2 - Report on the Board of Directors' operation and internal control procedures
The provisions of Article L. 225-37 of the French Commercial Code stipulate that the Chairman of the Board
of Directors must present a separate report, which is submitted along with the annual report, on the
composition of the Board, the conditions under which it prepares and organizes its work and the internal
control and risk management procedures implemented by the company, as well as any limits placed on the
powers of the Chief Executive Officer by the Board of Directors.
II.2.1 - Preparation and organization of the Board's work
II.2.1.1 - Composition of the Board
The Board of Directors of Banque Fédérative du Crédit Mutuel currently consists of 18 members appointed
by the Shareholders' Meeting for 3 years and 14 non-voting directors also appointed for three years by the
Board in accordance with Article 20 of the company’s bylaws.
The law of January 27, 2011 regarding the balanced representation of men and women on Boards will take
effect on January 1, 2017.
The list of directors and a description of their functions at other companies is presented in section II.1.1.
The Board includes representatives of partner Crédit Mutuel groups in the Caisse Fédérale de Crédit Mutuel
organization: Anjou, Centre, Dauphiné-Vivarais, Ile-de-France, Loire-Atlantique et Centre-Ouest,
Méditerranéen, Midi-Atlantique, Normandie, Savoie-Mont Blanc and Sud-Est.
Two employees have seats on the Board of Directors on behalf of the interfederal works council.
There are no directors' fees or stock options.
II.2.1.2 - Operation of the Board. Executive Management operating methods
Pursuant to the provisions of Article L.225-51-1 of the French Commercial Code, the Board opted to
combine the positions of Chairman and Chief Executive Officer at its October 22, 2010 meeting
Michel Lucas, Chairman of the Board, also serves as Chief Executive Officer. In this capacity, he organizes
and directs the Board's work. He represents the company vis-à-vis third parties. To this end, he has the
broadest authority to act on behalf of the company.
There are no internal rules formalizing the rules of operation of the Board, which is subject only to the
applicable legal provisions.
22
Individually, as elected representatives, directors are required to comply with the code of ethics and
compliance rules applicable within the group, in addition to upholding their duty to use discretion and
maintain confidentiality on all matters related to the company’s purpose.
In 2013, the Board met five times. The average attendance rate was 83%.
Prior to each Board meeting, a comprehensive file on the agenda items is mailed to all directors, non-voting
directors and works council representatives.
At each Board meeting, the managers responsible for activities related to one or more agenda items are
invited to present them, offer comments and answer any questions.
The minutes of Board meetings are submitted to the directors for their approval.
All Board meetings are an opportunity to review the results and outlook of our activities.
The February 28, 2013 meeting focused on reviewing and approving the financial statements and preparing
for the Ordinary Shareholders' Meeting held on May 7, 2013. The Board was informed of the February 26,
2013 report of the Group Audit and Financial Statements Committee.
The Board also approved the framework memorandum on the variable remuneration policy for professionals
performing a regulated activity, which includes the regulatory principles adapted to our group.
As it does at each meeting, the Board reviewed the management report on the group’s financial affairs
(refinancing, credits, proprietary trading).
The April 6, 2013 Board meeting focused on preparing for the Extraordinary Shareholders' Meeting for the
purpose of carrying out a capital increase intended for Crédit Mutuel d’Anjou Group and a capital increase in
cash and delegation of authority to the Board.
The May 7, 2013 Board meeting was mainly dedicated to renewing the term of office of the Chairman and
Chief Executive Officer and co-optation of a director.
The July 31, 2013 meeting focused on approving the interim consolidated financial statements at June 30,
2013. The Board was also informed of the report of the Audit and Financial Statements Committee and the
report of the Risk Monitoring Committee. It noted the completion of the capital increase reserved for the
Anjou Group and decided to amend the bylaws accordingly. It decided to declassify the regulated agreements
related to the group's refinancing program. It also appointed/reappointed a non-voting director.
The final meeting of the year was held on November 22, 2013.
The Board was informed of the work of the Group Risk Monitoring Committee of October 30, 2013.
It reviewed the 2013 budget trends and preparation of the 2014 budget. It appointed a non-voting director.
All Board meetings address matters regarding subsidiaries and other long-term investments, intra-group
financial relations, credit decisions made by the Credit Committee and, where applicable, the affiliation of
new local Caisses.
On an exceptional basis, written consultations may be organized in case of emergency. The decisions taken in
such cases are reiterated at the following Board meeting.
II.2.1.3 - Internal committees
Several internal committees carry out regulatory assignments and, through their work, contribute to the
proper operation of the governing body.
-
Remuneration Committee
23
This committee, which consists of at least two members for renewable three-year terms, is mainly
responsible for issuing remuneration recommendations and proposals for the executive body and
capital markets professionals.
-
Group Audit and Financial Statements Committee
The assignments of this committee, created in 2007, are governed by Regulation 97-02 of the French
Banking and Financial Regulations Committee (CRBF) and concern CM11-CIC Group. It reports to
the Board of Directors and comprises 18 people representing the group's components.
-
Group Risk Monitoring Committee
The assignments of this committee, created in 2007, are also governed by CRBF Regulation 97-02
and concern CM11-CIC Group. It has 15 members and reports to the Board of Directors.
-
Group Ethics and Compliance Committee
This committee, created for CM11-CIC Group, helped to draw up the group's code of ethics. Each
year, it prepares a report on the application of and compliance with the ethics and compliance
principles and rules within the group.
II.2.2 - Internal control and risk management system
BFCM’s internal control and risk management are part of the overall internal control system implemented by
CM11-CIC Group, as described below.
The work undertaken in the area of internal control and risk management is aimed at ensuring the application
of all the rules defined by the regulatory authorities for the exercise of the group’s activities, based on the
internal
policies
and
the
tools,
guidelines
and
procedures
implemented for that purpose. This report was therefore drafted with the assistance of the departments
responsible for internal control and risk management by taking all actions required for its preparation and,
where necessary, by referring to the reference framework and the application handbook recommended by the
French Financial Markets Authority.
II.2.2.1 - CM11-CIC Group's overall internal control system
The internal control and risk management system is an integral part of the group’s organization. Its purpose
is to ensure compliance with regulatory requirements, proper risk management, secure transactions and
improved performance.
II.2.2.1.1 - A common, structured and independent system
The group ensures that the system implemented is appropriate to its size, its operations and the scale of its
risk exposure.
By using common methods and tools, the internal control and risk measurement system aims in particular to:
cover all group activities comprehensively,
identify, assess, monitor and aggregate risks in a consistent manner and on a consolidated basis,
ensure compliance with applicable laws and regulations as well as internal policies,
ensure the proper operation of internal processes and the reliability of financial information.
The organization implemented serves mainly to verify the quality and comprehensiveness of the internal
control system. The group ensures, for both itself and the companies it controls, that the system in place is
based on a set of operational procedures and limits consistent with regulatory requirements and the approved
policies. To this end, it relies on the methods and tools defined at the group level and on generally accepted
practices in the area of inspection and control.
24
One constant objective that guides the actions of all the group's internal control departments is to identify the
main risks based on guidelines and risk mapping and to monitor them with appropriate limits, formalized
procedures and dedicated tools. In addition to their efforts to identify and minimize risks, these departments
are involved in the work aimed at enhancing risk management. In parallel to this, the analysis tools and
monitoring reports make it possible to review on a regular basis the group's risk exposure related to its
activities, including counterparty, market, liquidity, ALM and operational risks. In accordance with
regulatory requirements, a risk assessment and monitoring report is prepared annually along with the internal
control report. This report entails an in-depth review of the risk management system.
The group continuously strives to ensure a satisfactory balance between the objectives assigned to internal
control and the corresponding resources provided.
The necessary independence of controls is guaranteed by the fact that the people performing them work in
dedicated control units, have no operational responsibilities and have reporting lines within the organization
that preserve their freedom of judgment and assessment.
II.2.2.1.2 - Organization of controls
CM11-CIC Group's control system satisfies a twofold objective:
break down the various types of control into separate functions (periodic, permanent and
compliance), in accordance with regulatory requirements;
harmonize the control work performed within the group through the establishment of a common
organization based on homogeneous and complementary methods and tools.
Breakdown by type of control
Apart from the controls exercised by management personnel in the course of their day-to-day activities, the
exercise of controls is the responsibility of:
periodic control for in-depth inspection-type audits performed as part of a control cycle over several
years;
permanent controls for all work of a recurring nature performed with remote control tools;
compliance control, in particular for all matters related to the application of regulatory requirements
and internal policies (anti-money laundering, controls of investment services, regulatory watch,
ethics, protection of customers' interests, etc.).
To perform their functions, the heads of the control departments have permanent and unrestricted access to
individuals, premises, hardware, software and information of any kind throughout the group. They may
delegate any or all of their rights to their employees as needed for specific assignments.
Periodic control is responsible for ensuring the overall quality of the entire internal control system, effective
risk management and monitoring, and the efficiency of permanent and compliance controls.
Division between networks and business lines
Controls are divided into two functions, one dealing with the retail banking network (CM regional
federations, BECM, CIC regional banks, Targobank Germany and Spain) and the other with the business
lines (commercial banking, capital markets activities, asset management, financial services, cash
management, etc.), with a manager appointed for each at the CM11-CIC Group level.
A common support division for the various types of control
This division dedicated to control functions is charged with:
developing and upgrading the tools needed for effective control;
ensuring development of the reporting tools needed for monitoring control operations and audits and
for informing the management bodies at the central and local levels (regions and subsidiaries);
ensuring that the control tools among the various control functions complement each other for
optimal coverage of the group's risks.
The support division relies largely on the group's information systems.
25
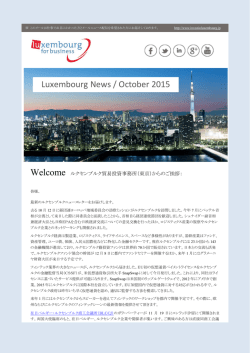
II.2.2.1.3 - Oversight of the system by the group's Control and Compliance Committee
Under the authority of a member of the executive body, the Control and Compliance Committee meets
regularly with the group's heads of control (periodic, permanent and compliance) and risk management. Its
objectives are:
to approve the control plans, examine the results of control audits performed by the periodic control
departments as well as the work carried out by permanent control and the compliance function, and,
if necessary, make recommendations to the executive body on needed improvements,
analyze the findings of external control audits, including those of the regulatory authorities, and
monitor the implementation of recommendations by the group's entities,
ensure that the actions and tasks of the various control and compliance participants complement each
other,
validate all new control procedures or changes affecting the organization of control functions; in
2013 for example, it approved the new methodology for monitoring recommendations made at the
time of inspections at the networks and audits at the other business entities and functions, as well as
the new methodology for certifying the financial statements of the local Crédit Mutuel Caisses. The
document formalizing the organization and relations within the network periodic control department
and between the central function and the regional periodic control departments was also submitted to
the committee.
It met four times in 2013 (March 5, June 17, September 16 and November 25).
Summary chart of the existing organization (January 2014)
DISPOSITIF DE CONTRÔLE CM11-CIC
Comité de contrôle
et de conformité
CONTRÔLE PERIODIQUE
CONTRÔLE PERMANENT
CONFORMITE
RESEAUX
SUPPORTS
POLE EST
CMCEE, CIC Est, BECM
Outils de contrôle
Reporting
POLE IDF
CMIDF, CMN, CMC,
CIC IDF, CIC Iberbanco
POLE SUD-EST
CMSE, CMSMB, CMDV, CMM,
CIC Lyonnaise de Banque
POLE NORD-OUEST
CIC Nord-Ouest
POLE OUEST
CMLACO, CMA, CIC Ouest
POLE SUD-OUEST
CMMA, CIC Sud-Ouest
POLE ETRANGER
TARGOBANK Allemagne et Espagne
METIERS
Filiales - Filières - Outils
BANQUE COMMERCIALE
Grands comptes, Crédits Corporate, Succursales
étrangères
IMMOBILIER
Différentes filiales immobilières
ACTIVITES DE MARCHE
Banque (BFCM, CIC)
Intermédiation boursière (CM-CIC Sec.)
Succursales étrangères
GESTION D’ACTIF
Gestion collective, Gestion privée, Epargne
salariale,
Conservation de titres
SERVICES FINANCIERS ET FLUX
Crédit-bail, Crédits consommation, Cofidis,
Banque Casino, Financts spécialisés, Capital dévt,
Moyens de paiement
ASSURANCE
Groupe des Assurances du Crédit Mutuel
(dont ACM Vie SA, ACM IARD SA, ACM Vie
Mutuelle, Serenis Vie SA, Serenis Assurances SA)
TECHNIQUE ET LOGISTIQUE
Groupe Euro Information
CM-CIC Services
FONCTIONS SUPPORTS
Finances-comptabilité, Juridique, Ressources
humaines, Organisation
26
The Control and Compliance Committee reports to the Group Audit and Financial Statements Committee,
which represents the group's governing bodies.
II.2.2.1.4 - Group Audit and Financial Statements Committee
To satisfy the requirements resulting from the transposition of EU directive 2006/43/EC on statutory audits
of annual financial statements and consolidated financial statements by Order No. 2008-1278 of December 8,
2008, as well as those resulting from the new governance standards, a CM11-CIC Audit and Financial
Statements Committee was formed at the group level.
The Group Audit and Financial Statements Committee consists of directors representing the Crédit Mutuel
federations that are members of Caisse Fédérale de Crédit Mutuel (in principle, one per federation) and two
members of CIC's Board of Directors. The Committee elects a Chairman from among its members for a
three-year period that can be renewed once.
Three of these members have specific skills in accounting and finance.
The independence of the Committee members is ensured by the fact that they all come from the group's
cooperative banking level and are therefore elected by the stock-owning members of their respective local
Caisse. This independence is reinforced by the fact that members of the Audit and Financial Statements
Committee are not paid.
With respect to internal control, the Group Audit and Financial Statements Committee:
reviews the provisional internal control program,
receives the consolidated annual internal control report,
is informed of the findings of the main audits performed by the periodic control department as well
as the results of the permanent control and compliance departments,
is informed of the findings of external controls, including any changes recommended by the
regulatory authorities,
is informed of actions taken to follow up on the main recommendations made in the internal and
external control reports,
assesses the efficiency of the internal control systems.
The Audit and Financial Statements Committee makes recommendations to the various governing bodies on
any improvements it deems necessary based on the findings brought to its attention.
With respect to financial reporting, the Committee:
is responsible for monitoring the financial reporting process,
oversees the statutory audit of the annual financial statements and consolidated financial statements,
participates in the choice of statutory auditors and has unrestricted access to them in order to be
informed of their work plan, ensure that they are capable of conducting their audit and discuss with
them the findings of their audit,
reviews the annual and consolidated financial statements,
assesses the conditions under which they are prepared and ensures the relevance and continuity of
the accounting policies and methods.
The Audit and Financial Statements Committee met four times in 2013 (February 26, May 6, July 30 and
September 23). Its meetings are summarized in reports submitted to the governing bodies of the various
federations and CIC so as to fully inform the directors.
The roles of the various risk management bodies, which include the Group Risk Department, a Group Risk
Committee and a Group Risk Monitoring Committee, are described below.
27
II.2.2.1.5 - The risk management system
Group Risk Department
The role of the Group Risk Department, which regularly analyzes and reviews risks of any type from the
standpoint of the return on allocated regulatory capital, is to contribute to the group's growth and profitability
while ensuring the quality of the risk management systems.
To perform the functions assigned to it (particularly as provided by Articles 11-8 to 11-10 of amended CRBF
Regulation 97-02), the Group Risk Department has formalized its relations with the risk correspondents on
whom it relies and who are present at all the group's entities. These risk correspondents are appointed by
their own departments and can be either the individuals responsible for permanent control at the CM11
federations and CIC banks, the risk managers or directors at the subsidiaries and branches, or the individual
responsible for monitoring commitments.
The Group Risk Department oversees the group's risk function and provides all information related to this
area on a regular basis (general assessment of the risk situation, new prudential requirements and changes,
significant events and changes at the group related to key solvency, liquidity, credit, operational and other
risks, main points of the quarterly management report) to ensure that the regional management bodies
(executive and governing bodies) are properly informed.
Group Risk Committee
This committee meets quarterly with the heads of the main business lines and the members of Executive
Management.
It is responsible for overall ex-post and ex-ante risk monitoring based on a global, prudential, economic and
financial approach.
The Group Risk Monitoring Committee
This committee consists of members of the governing bodies and meets twice a year to review the group's
strategic challenges in terms of risk.
Based on the findings presented, the Committee makes recommendations to the group's governing bodies on
all decisions of a prudential nature applicable to all the group's entities.
The head of the Risk Department chairs the committee meetings and is responsible for presenting the files
prepared for the various risk areas based on the work of the Group Risk Committee. Executive Management
also participates in the meetings of this committee, which may also invite the heads of the business lines with
a stake in the items on the meeting agenda.
II.2.2.2 - Internal control procedures specific to BFCM
As the holding company of the group, which is owned by Caisse Fédérale de Crédit Mutuel, Assurances du
Crédit Mutuel and the Caisses of Crédit Mutuel Centre Est Europe, Sud-Est, Ile-de-France, Savoie-Mont
Blanc, Midi Atlantique, Normandie, Dauphiné-Vivarais, Méditerranée and Loire-Atlantique et Centre-Ouest,
BFCM manages the investments held in the group's specialized subsidiaries, all of which are subject to the
group's overall internal control system.
An integral part of CM11-CIC Group, BFCM has also implemented an internal control system for the
activities it manages at its level, which satisfies the same risk prevention and management objectives.
BFCM manages the cash assets of Crédit Mutuel and CIC and operates in the financial markets. It is engaged
in financial engineering and manages relations with the international partners.
An integral part of BFCM and CIC, CM-CIC Marchés consolidates all of CM11-CIC Group's capital markets
activities on one trading floor in order to refinance the entire CM11-CIC Group through a single cash
management team, develop the group's capacity to sell capital markets products to customers, and strengthen
its proprietary trading activity.
28
The monitoring methods, procedures and limit system are covered by a set of rules.
The Board of Directors of CIC and the Board of Directors of BFCM approve the strategy of each business
line (refinancing, commercial, proprietary trading), capital allocation, limits monitoring and budgets.
In this system, capital markets activities are overseen by several units:
- The CM-CIC Marchés department defines the strategy, analyzes the activity, results, risks and
compliance with limits and coordinates operational aspects (information system, budget, human
resources, procedures),
- The Capital Markets Risk Committee, which meets monthly, monitors compliance with the set of
rules and decisions of the CM-CIC Marchés department and validates the operational limits within
the general limits set by CIC's Executive Board and BFCM's Board of Directors,
- The CM-CIC Marchés Credit Committee, which meets weekly, is responsible for approving credit
line requests under delegations of authority granted by the CM11-CIC Commitments Committee.
The internal control system is supported, on the one hand, by the work of the back office departments, which
are responsible for control of risks and results and for accounting and regulatory control, and, on the other
hand, by a team that monitors capital markets activities, which reports to the head of the business line
permanent control department, and by the compliance function.
Just as they consolidated their capital markets activities under one roof, BFCM and CIC also combined their
large accounts activity within CM-CIC Large Accounts by harmonizing their applications and procedures.
The coordination of control tasks through a single portal is ensured by the head of business line permanent
control, and the results of the controls performed during the year were integrated into the same portal.
BFCM handles the group's depository activity. The depository control plan is based on the definition of a set
of control tasks and is established in concert with the BFCM business line permanent control and compliance
departments. This plan enhances the customer risk and product risk approach by implementing a controlled
new customer relationship process and a controlled analysis process at the time of mutual fund creation. It
makes it possible to perform comprehensive ex-post control and identify all risks related to fund
management.
The ethics rules are integrated into a code of ethics that includes both the general principles and the specific
measures implemented in connection with BFCM's activities. This code also includes the fundamental
principles of putting the customer's interests first and respecting market integrity.
As part of operational risk management, operational risks resulting from capital markets activities were
assessed.
BFCM is involved in updating the mapping of its specific risks and the related valuation models.
With respect to backup measures, a disaster recovery plan was created for all capital markets activities. This
plan addresses the major risks related to the unavailability of offices, technical resources and staff. It is based
on the existence of two multi-purpose sites, each one backing up the other, backup information systems and
work organization in teams of two or even three people. One-fourth of the staff have also been equipped with
laptop computers that allow them to connect remotely. The disaster recovery plan is updated and tested
regularly.
Group Audit performs periodic control on a multi-year basis. The findings of these audits are presented to the
Control and Compliance Committee and the Group Audit and Financial Statements Committee. They are
also provided in the annual report submitted to the Autorité de Contrôle Prudentiel (French banking and
insurance supervisory authority). The audits may be general or specific in nature.
II.2.2.3 — Internal control related to the preparation and processing of accounting and financial
information
II.2.2.3.1 - Role of the governance bodies and the Group Audit and Financial Statements Committee
At the close of each reporting period involving financial statements or financial information to be published,
this information is presented to the Board of Directors by the Finance Department. The determination of
29
income and the presentation of the financial position and activity are part of a report that includes
reconciliations with non-accounting management data (interest rates, average capital, etc.).
The accounting principles applied which have a material impact have been previously reviewed and
approved by the statutory auditors. These auditors are regularly invited to participate in the meetings of the
Board of Directors held to approve the financial statements. They are asked to report on their audit and
present the results of their work to the governing body.
The accounting principles used by the group to consolidate the financial statements are explained in detail in
the notes to the financial statements.
The accounting processes are presented regularly to the Group Audit and Financial Statements Committee,
which is independent from the Finance department and responsible for reviewing the process for preparing
the financial statements and financial information published by the group.
During the year, the information presented to the Group Audit and Financial Statements Committee
concerned:
- the group's exposure in southern Europe given the economic environment (investment in BPE
accounted for using the equity method in the financial statements and goodwill recognized as an
asset for Targobank Spain),
- the impact on the consolidated financial statements of the early application of IAS19-R and its
retroactive effects on the financial statements at June 30, 2012,
- the consolidated results and in-depth analysis of them (analysis of the various items of the
intermediate balances, sector analyses by business line, analysis of general operating expenses,
analysis of actual net provisioning for known risks and collective provisions),
- change in the basis of calculation of the solvency ratio (capital and risks),
- changes in tax and social security regulations and their impact.
II.2.2.3.2 - Specific characteristics of the banking activity
Oversight of the accounting and financial organization is structured in a way that addresses the specific
characteristics of a credit institution's activities:
nearly all the financial transactions carried out by a bank result in a monetary flow or a commitment
that needs to be accounted for;
a significant volume of accounting entries is based on fully automated recording processes for the
completed transactions;
unlike industrial and commercial companies, a credit institution's accounting entries are
decentralized within the entire organization and not within a single accounting department.
The vast majority of accounting entries are therefore completed by the information system based on
predefined procedures. These automated procedures are designed to ensure:
the comprehensiveness, actuality, measurement and proper classification of the accounting depiction
of the completed financial transactions;
prevention of fraud risk by predefining, on a centralized basis, the transactions that each participant
is authorized to complete;
fast, regular accounting centralization, with entries recorded in real time or at least once every
business day in the case of batch processing;
de facto standardization of accounting data among all the group's companies.
II.2.2.3.3 - Accounting system
Accounting architecture
The company shares a common IT platform with 15 Crédit Mutuel federations and the CIC banks, which
includes common accounting and regulatory functionality related in particular to:
the chart of accounts, whose structure is the same for all institutions administered on this platform;
the definition of automated processes and procedures shared by all the banks (means of payment,
deposits and credits, recurring transactions, etc.);
reporting tools (SURFI, transfer of data to the consolidation software applications, etc.) and
management tools (management control).
30
In this context, the administration of the common accounting information system is entrusted to dedicated
divisions, the "Accounting Procedures and Processes" divisions, which are autonomous units within either
the "retail banking/ networks" CM11-CIC Finance Department or the "specialized functions-business lines"
CM11-CIC Finance Department, as the case may be.
These divisions are responsible in particular for:
managing the common chart of accounts (account creation, definition of account characteristics,
etc.);
defining common accounting procedures and processes, in accordance with tax and regulatory
requirements. To this end and where necessary, the company's tax department is consulted and
creation of the processes is subject to a validation procedure involving various operational managers.
The "Accounting Procedures and Processes" divisions are independent, both hierarchically and operationally,
from the accounting departments themselves, which allows a separation between the accounting architecture
design and administration functions and the other operational departments.
Within the company, all accounts must be assigned to an operational department which will be responsible
for their operation and control; in this way, no account can be overlooked or lack a clearly designated
department responsible for monitoring it.
The organization and procedures in place ensure compliance with Article 12 of CRBF Regulation 97-02 and
the existence of an audit trail.
Chart of accounts
The chart of accounts is based on two main types of accounts: third-party accounts, which track deposits and
receivables of individual third parties, and financial accounting accounts.
The use of dedicated accounts for deposits from and loans to third parties makes it possible to monitor them.
With respect to securities custody, CM-CIC Titres uses "substance" accounting, which distinguishes between
third-party and proprietary securities ownership (equity investments), and external segregation when custody
is no longer provided by the group ("refinancing and capital markets" activity).
All the credit institutions administered on the common IT platform use the same chart of accounts (Nouveau
Plan de Comptes Interne – new internal chart of accounts or NPCI), which is administered by the
"Accounting Procedures and Processes" divisions.
This chart of accounts defines the account properties with respect to the following areas in particular:
regulatory attributes (consistency with the chart of accounts of credit institutions – PCEC – related to
prudential regulatory reports, link to the item of the publishable financial statements, etc.),
certain tax characteristics (VAT position, etc.),
management control characteristics (mandatory or non-mandatory presence, link to the consolidation
chart of accounts, retention period for online transactions, presence at headquarters/branch, etc.).
Processing tools
The accounting information processing tools are mainly based on internal applications developed by the
group's IT departments.
There are also several specialized applications, either external or internal, including in particular a
management report production application, a trial balance and financial statements production application, a
utility for processing file queries, a consolidation application, a regulatory financial statements processing
application, an asset management application and tax reporting applications.
Automated controls
Accounting files undergo a series of automated controls prior to final accounting recognition: file balancing,
file validity and updating of the audit trail of accounts affected by the accounting entry.
Internal applications are used to check the day's accounting entries and detect any anomalies.
31
A dedicated application for checking automated accounts has been deployed since 2010 to manage ceiling
limits on accounting entries, which are broken down by account type (third-party/financial accounting),
entry type (debit/credit), IT application code, entity and the entity's business sector.
The application has two levels of control related to:
a limit threshold,
a warning threshold.
The control applies to real-time or batch processing for all applications that do not require validation of
entries on the basis of the "four eyes" principle. If a threshold is exceeded, the accounting entry is blocked
and moved to an accrual account. After analysis, the user may:
in case of a "warning" level, validate the entry after the control,
in case of a "limit" level, complete the transaction only if approved in accordance with the "four
eyes" principle.
In all cases, entries recorded above a warning threshold (automatically for file processing or after an override
in real time) are tracked and stored in event management.
II.2.2.3 - Internal control in the preparation of individual financial statements and the
consolidation process
II.2.2.4.1 - Controls of closings of individual financial statements
At each closing, the accounting results are compared to the forecast management data for validation. The
forecast management data is prepared by divisions that are independent from the accounting production
departments (management control and budget control).
This analytical review focuses mainly on:
the interest margin; for fixed-income instruments (deposits, loans and off-balance sheet items),
management control calculates the expected returns and costs based on average capital observed;
these results are then compared to the interest rates actually recorded and validated for each business
sector;
the level of fees and commissions; based on business indicators, management control estimates the
volume of fees and commissions received and payable, compared to the data recorded;
general operating expenses (employee expenses and other general operating expenses);
net additions to/reversals from provisions for loan losses (provisioning level and recorded losses).
The accounting procedures and processes are formalized. For the branch network, the procedures are posted
on the bank's intranet.
The daily accounting controls are performed by the appropriate employees at each branch.
The accounting control departments also perform a general control task involving in particular regulatory
controls, monitoring of internal account justifications, monitoring of branches, control of the foreign
exchange position, control of NBI by activity, accounting procedures and processes, and the interface
between the back offices and the statutory auditors.
Furthermore, the control departments (periodic, permanent and compliance) also perform accounting work.
Internal control portals are dedicated to the accounting function and adapted to the entities' specific
requirements (type of activity and types of controls deployed).
II.2.2.4.2 - Controls of the consolidated financial statements
The system is periodically adapted to satisfy regulatory changes (IFRS) or improve the reliability of financial
statements production.
The group's entities have applied IFRS accounting principles since January 1, 2005. A summary of IFRS
accounting principles is provided in the consolidated financial statements.
CM11-CIC Group defines the international accounting principles and methods (IFRS) to be applied by all
the group's entities in their individual financial statements. The foreign subsidiaries take these principles and
32
methods into account when converting from their local accounting standards to French and international
standards in the consolidation packages and financial reporting.
For the entities using the common IT system, individual financial statements based on IFRS are prepared in
the central IT system.
The group has a consolidation chart of accounts. In the common IT system, each account in the common
chart of accounts includes a link to the consolidation chart of accounts. This link is therefore unique for the
same account for all companies that share this chart.
The consolidated financial statements are prepared on the basis of a schedule sent to all subsidiaries and the
statutory auditors. This schedule includes, where applicable, changes in procedures or standards to be
integrated. At each consolidated subsidiary, the person responsible for closing the subsidiary's financial
statements and the person responsible for identifying the inter-company accounts between fully consolidated
companies are designated.
The statutory auditors of the consolidated financial statements send simultaneous audit instructions to the
statutory auditors of the consolidated companies to ensure the subsidiary's compliance with the various
standards based on their own professional standards.
The financial statements are consolidated using a dedicated application, one of the leading commercially
available standard applications. The transfer of data into the consolidation application (consolidation
packages) is partly automated based on an interface developed for the accounting IT system. This allows the
trial balances to be retrieved automatically, thereby ensuring consistency between company and consolidated
data.
Moreover, the consolidation package cannot be sent by the companies until a number of consistency checks
programmed directly into the package have been performed. These control rules (currently more than 600)
are developed by the consolidation departments and relate to a number of factors (change in shareholders'
equity, provisions, non-current assets, cash flows, etc.). "Blocking" controls prevent the package from being
sent by the subsidiary unless an exception has been made by the consolidation departments.
The consolidation department also performs consistency checks on the company data upon receipt of the
packages (income level, intermediate balances, etc.).
Finally, systematic reconciliation reports between company data and consolidated data are prepared with
respect to shareholders' equity and income. This process, which ensures a consistent transition between the
company and consolidated data, occurs outside the consolidation application, which therefore enables the
validation of these consolidated items.
In conclusion, BFCM's internal control and risk management system, which is based on common methods
and tools, is in line with the organization of CM11-CIC Group's controls. The group constantly endeavors to
strengthen and improve its efficiency.
II.2.3 - Limits on the powers of the Chairman and Chief Executive Officer
The Board has not set any limits on the powers of the Chairman and Chief Executive Officer, as defined by
law and by our bylaws and internal rules.
II.2.4 - Principles for determining remuneration granted to the directors and corporate
officers
The provisions of Article L. 225-37 of the French Commercial Code specify that, in companies whose
securities are admitted for trading in a regulated market, the Chairman of the Board of Directors must also
provide the rules and principles established by the Board of Directors for determining the remuneration and
benefits of any kind granted to directors and corporate officers.
33
BFCM's Board of Directors has established internal rules for the Remuneration Committee which are
consistent with the provisions of CRBF Regulation 97-02.
The annual notice to the Autorité de Contrôle Prudentiel et de Résolution (French banking and insurance
supervisory authority – ACPR) pursuant to Articles 43-1, 43-2 and 43-3 on the implementation of the
remuneration policy was sent via a "Report to the ACPR on the remuneration policy and remuneration
practices", based in particular on information provided by the HR department regarding the decision-making
process, the main characteristics of the remuneration policy and the quantitative information concerning key
executives and financial market professionals. This report is applicable to both BFCM and CIC.
The Chairman of the Board of Directors
34
II.3 - Statutory auditors' report on the report of the Chairman of the Board of
Directors
KPMG Audit
A department of KPMG S.A.
1, cours Valmy
92923 Paris – La Défense Cedex
Statutory Auditor
Member of the regional association
of accountants of Versailles
ERNST & YOUNG et Autres
1/2, place des Saisons
92400 Courbevoie – Paris-La Défense 1
S.A.S. à capital variable (simplified stock company with
variable capital)
Statutory Auditor
Member of the regional association
of accountants of Versailles
Banque Fédérative du Crédit Mutuel
Year ended December 31, 2013
Report of the statutory auditors, prepared in accordance with Article L.225-235 of the French
Commercial Code, on the report of the Chairman of the Board of Directors of Banque Fédérative du
Crédit Mutuel
To the shareholders,
In our capacity as statutory auditors of Banque Fédérative du Crédit Mutuel and pursuant to the provisions of
Article L. 225-235 of the French Commercial Code, we present to you our report on the report prepared by
your company's Chairman as provided by Article L. 225-37 of the French Commercial Code for the year
ended December 31, 2013.
It is the Chairman's responsibility to prepare and submit to the Board of Directors for approval a report that
describes the internal control and risk management procedures implemented at the company and provides all
other information required by Article L. 225-37 of the French Commercial Code related, in particular, to the
corporate governance scheme.
It is our responsibility:
to give you our observations based on the information contained in the Chairman's report regarding the
internal control and risk management procedures related to the preparation and processing of accounting
and financial information, and
to certify that this report contains the other information required by Article L. 225-37 of the French
Commercial Code, it being noted that it is not our responsibility to verify the accuracy of this information.
We have performed our work in accordance with the professional standards applicable in France.
Information regarding the internal control and risk management procedures related to the
preparation and processing of accounting and financial information
The professional standards require that we follow certain procedures to assess the accuracy of the
information regarding the internal control and risk management procedures related to the preparation and
processing of accounting and financial information contained in the Chairman's report. These procedures
entail:
reviewing the internal control and risk management procedures related to the preparation and processing
of the accounting and financial information that forms the basis of the information provided in the
Chairman's report and the existing documentation;
reviewing the work involved in preparing this information and the existing documentation;
35
determining whether any major weaknesses in internal control related to the preparation and processing of
accounting and financial information identified by us in the course of our audit have been properly
disclosed in the Chairman's report.
Based on this work, we have no observation regarding the information about the company’s internal control
and risk management procedures related to the preparation and processing of accounting and financial
information contained in the Chairman of the Board of Directors' report, which was prepared in accordance
with the provisions of Article L. 225-37 of the French Commercial Code.
Other information
We certify that the Chairman of the Board of Directors’ report contains the other information required by
Article L.225-37 of the French Commercial Code.
Paris-La Défense, April 14, 2013
The Statutory Auditors
KPMG Audit
A department of KPMG S.A.
Arnaud Bourdeille
ERNST & YOUNG et Autres
Olivier Durand
36
II.4 - Report on the anti-money laundering and counter terrorist financing policy
II.4.1 - Organization of the policy and employee training
The group's central compliance function fulfills several roles with respect to the anti-money laundering and
counter terrorist financing (AML/CTF) policy within the group, including coordination, oversight, training,
organization and control. The group's head of compliance (Stéphane Cador, [email protected]) reports
directly to the group's Executive Management. He is assisted by a national anti-money laundering and
counter terrorist financing manager (Raoul d’Estaintot, [email protected]).
To perform the duties assigned to it, the central compliance function has correspondents within the
permanent control and compliance control departments of the various regional divisions, business entities
and foreign-based entities. These correspondents, particularly the TRACFIN correspondents and declarers,
have a functional reporting line to the central compliance function.
The year 2013 was marked by:
- the roll-out of "World-Check" tools and access as a single database for the entire confederal group
for the detection of Politically Exposed Persons, followed by the automation in February of
screening of the third-party database to detect Politically Exposed Persons with the generation of
alerts;
- the recognition of CNIL (French national commission for information technology and civil liberties)
restrictions in sensitive areas (prohibited words);
- the automatic creation in April of an analysis file in case of recurrence of money laundering alerts for
which processing should have resulted in the opening of such a file;
- the roll-out through Euro-Information of TACO, a control panel that provides access to lists of data
and management and summary reports for reporting on AML activities and supporting and justifying
the level-two control summaries posted in the anti-money laundering internal control application;
- the "SafeWatch" project, which entails implementing a screening tool directly on the SWIFTAlliance platforms for faster detection of individuals or legal entities subject to international
sanctions, particularly for market transactions.
AML/CTF training initiatives are included in the group's training plan.
Modules designed for branch managers for keeping their employees informed were updated and restructured
to make them more streamlined for integration into a tracking and reporting tool that will be implemented in
March 2014 through Euro-Information. At the end of 2013, over 94% of employees for whom the risk of
money laundering is a concern participated in a training course.
Lastly, the annual meetings of the AML managers were held on November 21 and 22, 2013. These meetings
focused on the issue of wealth management. Representatives of TRACFIN were also on hand to present an
investigative approach based on an actual case, review recent regulatory changes (admissibility of a
suspicious transaction report, systematic communication of information) and answer a wide range of
questions.
II.4.2 - Risk classification, description of procedures
II.4.2.1 - Classification and duty of vigilance
At the end of December 2013, heightened vigilance measures were taken for 0.24% of customers.
II.4.2.2 - Changes in procedures
With regard to the group, all procedures were updated in 2013 to specify the credentials related to identity
and address and to take into account Law 2012-672 of July 26, 2013 on separation and regulation of banking
activities that codify Systematic Communications of Information (COSI). The lists of sensitive countries
were updated. A section on specialized financing was added to the Large Accounts procedure.
37
II.4.3 - Permanent controls
In 2013, at CM11-CIC2:
- 122,191 alerts were generated by the applications, 91% of which were processed;
- 21,907 transactions required more in-depth review;
The imposition of international financial sanctions (embargo and counter terrorist financing measures) is not
of particular note for 2013.
The level one control plan as reported in a dedicated application is monitored by the permanent control teams
in the regions. With nearly 12,000 controls performed with an average score of 3.7/4, the control plan
showed a significant increase during the year, due mainly to efforts to collect customer credentials. CM11CIC's average completion rate for level two control tasks (CINTMT) was 98%.
With regard to centralized control of cash flows, as required under EC Regulation 1781/2006, 6,755
anomalies were identified, which represents 0.24% to 0.29% of monthly cash flows for a total of 2,553,836
transactions (compared to approximately 2.6 million in 2012). The number of anomalies was slightly more
than 8,400 in 2011 and 2012. Following this annual review, there is no need to submit a report to the General
Secretariat of the ACP for any of the banks, either because of the low volume of transactions with anomalies
or because of the answers provided to our questions.
A monthly "Webcheques validation" control is designed to verify the proper application by the network of
the control procedure for checks issued. The controls and statistics show the proper use of this procedure by
the networks. The number of branches with anomalies is low and follow-up action is always taken.
Finally, the nationwide oversight plan developed by the central Compliance function, which is designed to
ensure that the AML/CTF initiative is consistently applied in the regions, was implemented at the time of
specific on-site visits in nearly all the CM federations and CIC regional banks. Visits will be made to the last
entities in the first quarter of 2014.
The various controls are enabling proper management of AML/CTF risks and proper use of the TRACFIN
vigilance applications; however, better coverage of cash flow oversight and greater awareness of the
importance of collecting a customer's credentials remain necessary. To correct the anomalies identified, the
anti-money laundering departments continue to raise awareness among employees and provide them with
training programs and day-to-day assistance regarding preventive measures.
II.4.4 - Main weaknesses identified by the national and foreign regulatory authorities and
corrective measures approved
In 2013, the recommendations made by the ACPR following its 2011 audit continued to be implemented. At
the end of 2013, 21 recommendations were considered fully implemented, two others were implemented in
January 2014, a third is expected to be implemented in the second quarter of 2014 and the last at the end of
2014. These recommendations were implemented as a result of significant changes to IT applications
(Webcheques, OPFL and Format). Therefore, at the end of 2013 86% of the ACPR's recommendations were
implemented based on the follow-up by compliance.
Credentials collection plan
The ACPR and CNCM's General Inspectorate identified the need to implement a customer credentials
collection plan during two on-site audits in 2010 and 2012. Other observations were also made by the group's
permanent control, compliance and periodic control departments.
The group's Executive Management was the driving force behind these efforts, raising awareness among the
regional departments and the bank and branch managers at the budget meetings in the first quarter.
The compliance plan includes practical measures aimed at informing the customer or customer relationship
manager of missing credentials, monitoring and management tools to verify the effectiveness of the measures
taken (statistical queries) and level one, level two and periodic control tasks. In addition, each region
formalized a credentials collection plan by prioritizing the actions to be taken by type of customer and the
resources to be implemented. One year after the plan was implemented, significant results have been
observed.
2 Including the CIC regional banks, the ACM and Cofidis groups and BFCM, BECM, Credit Mutuel-CIC Home Loan SFH, CM-CIC Factor, CMCIC Epargne Salariale, CM-CIC Securities and CM-CIC Bail.
38
Follow-up on the 2012 SGACPR AML questionnaire
21 regional banks and subsidiaries received a follow-up letter regarding the 2012 anti-money laundering
questionnaire. In each instance, the answers provided did not reveal any weaknesses in the system, but rather
incorrect interpretations of the questions on the questionnaire, inappropriate answers or no substantiation of
the information sent.
FEDR and NYSB on CICNY
The Federal Reserve and the New York State Banking Department conducted an audit on the application of
compliance rules at the New York branch in July 2013. To date, the results of the audit have not been
provided.
39
III. FINANCIAL
INFORMATION ABOUT
BFCM GROUP
40
III.1 - BFCM group management report
III.1.1 – Economic conditions in 2013 - A turning point
Compared with 2012 when the sovereign debt issue monopolized all the attention, 2013 saw a substantial
rebound in confidence among private-sector agents and an upturn for the large developed countries,
particularly within the European Union, where economic conditions finally ceased to deteriorate.
The central banks took active monetary policy measures to support this recovery with ongoing quantitative
easing in the euro zone and monetary shock treatment in Japan. In the United States, confirmation of a robust
trend fuelled by private consumption enabled the central bank to start reducing the scope of its action.
These improvements triggered a significant return of financial flows into Europe and the United States,
thereby severely penalizing the emerging economies, which were the big losers in these international
choices.
Europe: light at the end of the tunnel
The structural changes undertaken by governments and the easing of fiscal austerity measures consented to
by the European Commission boosted investor confidence and contributed to a rebound in activity. The ECB,
which chose to pursue its highly accommodating policy while reassuring the markets as to its capacity to
intervene when necessary, also played a key role. Despite several political crises (Italy, Spain and Portugal)
and great uncertainty linked to the restructuring of Cyprus’s banks in the early part of the year, growth turned
positive in the second quarter and forecasts confirm that the worst is now behind us.
This more positive environment led to lower refinancing costs for the Member States in greatest difficulties,
in particular enabling Ireland to become the first euro zone country to exit the program of financial aid put in
place by the Troika (ECB, European Commission and IMF). At the same time, Europe moved forward with
the project of a single European banking supervision system, the first stages of which are expected to
materialize in 2014. This should break the links between banking risk and sovereign risk by strengthening
the financial sector and stimulating lending, which has become increasing scarce.
Recovery will nonetheless remain modest as the private and public sectors continue to reduce debt over the
coming quarters. Moreover, very disparate situations can be seen: while Germany remains a growth engine
with a continuing positive trend, France is still struggling hard to find new sources of growth. The leading
purchasing managers’ indicator had turned red again at the end of the year while industrial production and
exports remained depressed. Reform has nonetheless continued, with in particular in the middle of the year, a
law on banking regulation designed to ensure stronger consumer protection and the segregation of the most
risky market activities within independent subsidiaries.
United States: the monetary policy saga
Consumption benefited from several positive factors: steady rise in available income, wealth effect linked to
rising real-estate prices and financial markets and a slow improvement in the jobs market.
However, the U.S. economy was forced to absorb a period of unprecedented fiscal austerity and, from mid2013, a drastic rise in sovereign yields. Moreover, a severe political deadlock, resulting in the temporary
closure of some federal agencies, prompted businesses to be cautious in terms of their investment policies.
After blowing hot and cold throughout the second half, the Fed finally decided in December to curb money
creation. The monthly purchasing program was cut back from $85 billion to $75 billion per month and its
termination is now scheduled some time in 2014.
Japan: monetary shock treatment
2013 also marked a radical change in Japan’s strategy with the new Prime Minister Mr. Abe putting in place
an unprecedented three-pronged action plan based on structural reform and fiscal and monetary stimulus.
The program is very ambitious as it relies on a gradual change in the behavior of private-sector agents, in
particular through better integration of women and foreigners within the working population and
redistribution of corporate earnings through wage increases.
However, these changes take time and the first mixed results seem disappointing, which will force the
Japanese central bank to step up the pace of monetary easing in 2014, thereby penalizing the Japanese
currency.
41
Emerging countries: slipping back down the growth ladder
The depressed economic conditions in developed countries and central bank activism had prompted investors
to turn all their attention to emerging countries. However, in 2013, given the uncertainty hanging over future
liquidity conditions in the United States, investors withdrew significantly. These movements resulted in
significant falls for local currencies, forcing the authorities to raise their key rates to halt capital outflows and
combat accelerating inflation. This cycle of monetary tightening has weighed heavily on economic
conditions and will continue to do so over the medium term.
China remains a special case due to the capital controls it imposes at its borders. 2013 was nonetheless a
pivotal year for China too with the arrival of a new government team and a policy of structural change. In
particular, the government has undertaken to regulate financing activities more strictly and improve the
transparency of financial institutions in order to contain the real-estate bubble and have greater control over
shadow banking. Another central goal of the changes is to reduce borrowing by local authorities to finance
large investment projects, whose returns are on the whole diminishing, in order to artificially boost growth.
Combating these imbalances will limit the capacity for a rebound in GDP, whose growth rate is expected to
slow gradually, albeit remaining above 7%.
III.1.2 - Key financial points relating to the consolidated financial statements of Banque
Fédérative du Crédit Mutuel.
Pursuant to regulation (EC) 1606/2002 on the application of international accounting standards and
regulation (EC) 1126/2008 on the adoption of said standards, the consolidated financial statements for the
year ended December 31, 2013 have been drawn up in accordance with IFRS as adopted by the European
Union at December 31, 2013. These standards include IAS 1 to 41, IFRS 1 to 8 and any SIC and IFRIC
interpretations adopted at that date. Standards not adopted by the European Union have not been applied. The
summary statements are presented in accordance with ANC recommendation 2013-R.04.
All IAS and IFRS were updated on November 3, 2008 by regulation 1126/2008 which replaced regulation
1725/2003. The entire framework is available on the European Commission’s website at:
http://ec.europa.eu/internal_market/accounting/ias/index_fr.htm
The information on risk management required by IFRS 7 is shown in a specific chapter of the management
report.
IAS 19R on employee benefits has been applied early as from January 1, 2012.
Note: The table of new accounting standards applied as from January 1, 2013 is presented in Note 1.1 to the
consolidated financial statements.
III.1.2.1 - Consolidation scope
The general principles for the inclusion of an entity in the consolidation scope are defined in IAS 27, IAS 28
and IAS 31. The consolidation scope comprises entities under exclusive control, entities under joint control
and entities over which the Group exercises significant influence.
Note: definitions of the various types of control and influence are presented in Note 1.2 to the consolidated
financial statements.
Shareholdings owned by private equity companies over which joint control or significant influence is
exercised are excluded from the scope of consolidation and their value is accounted for under the fair value
option.
42
III.1.2.2 - Changes in the scope of consolidation
The changes in the consolidation in the year ended December 31, 2013 were as follows:
Additions to the scope of consolidation:
CM-CIC Proximité (private equity); SCI Eurosic Cotentin (other activities).
Mergers/acquisitions:
TUP France EST with BFCM; TUP Promopresse with Le Dauphiné Libéré.
Removals from the scope of consolidation:
Est Imprimerie, Inter’Print, Imprimerie Michel, SCI Gutenberg, SDV Plurimédia and Alternative Gestion
SA.
Change of name:
Dubly-Douilhet changed its name to Dubly-Douilhet Gestion.
III.1.3 - BFCM Group activity and results
III.1.3.1 - Analysis of the consolidated statement of financial position
The total IFRS consolidated statement of financial position of BFCM Group was €399.7 billion at end-2013
compared with €397.2 billion at end-2012 (+0.6%).
Financial liabilities measured at fair value through profit or loss amounted to €30.0 billion compared with
€30.9 billion the previous year. These financial liabilities were mainly derivatives and other trading financial
liabilities, as well as amounts due to credit institutions and measured at fair value through profit or loss.
The other liabilities due to credit institutions came to €19.9 billion compared with €34.5 billion in 2012
(-42.3%).
Issues of securities other than those measured at fair value through profit or loss totaled €97.9 billion versus
€93.5 billion in 2012 (+4.7%). Interbank securities and negotiable debt securities accounted for the bulk of
these, with an outstanding amount of €47.9 billion, followed by bond loans (€48.5 billion). The balance
comprised short-term notes and various other securities.
The item “Due to customers” on the liabilities side of the statement of financial position is made up of
customer savings deposits, including accrued interest. These deposits increased by 7.9% to €142 billion in
20133, confirming the significant recovery of savings-related inflows. The contribution of CIC entities alone
represented 79% of this total, i.e. €112.6 billion, whereas Targobank Germany contributed 7.9% (€11.2
billion), Cofidis Group €0.6 billion and Targobank Spain €0.8 billion.
Technical reserves of insurance companies, representing liabilities to policyholders, came to €66.2 billion
(+6.7%), of which €58.6 billion comprised customer savings entrusted to the life insurance companies of
Groupe Assurances du Crédit Mutuel (GACM).
The non-controlling interests shown as liabilities (€3.5 billion at the end of 2013) mainly related to other
Crédit Mutuel companies’ shareholdings in Groupe des Assurances du Crédit Mutuel (GACM, of which they
own 27% of the capital), external shareholders within CIC (7% of capital) and the outside shareholders of the
Cofidis Group (45% of the capital).
On the assets side, interbank investments increased by 22.0% between 2012 and 2013 to €55.3 billion.
Total loans and receivables due from customers rose from €165.8 billion to €169.6 billion (+2.3%) in 2013.
Nearly 80% of all loans are granted through CIC entities (€136.7 billion). The loan portfolio of BECM
represents 6% of total loans outstanding (€10.1 billion), followed by Targobank Germany (€10.6 billion),
Cofidis Group (€8.9 billion), Targobank Spain (nearly €1.1 billion) and Banque Casino (€0.3 billion).
Financial instruments measured at fair value through profit or loss came to €41.3 billion compared to €43.1
billion in 2012.
Goodwill on the assets side (totaling €4.2 billion) resulted mainly from the acquisition of Targobank
Germany securities in December 2008 (€2.8 billion), the acquisition of a €0.4 billion stake in the Cofidis
Group at the beginning of March 2009, CIC securities (residual goodwill of €506 million) and Targobank
Spain securities for €183 million.
3Customer deposits excluding SFEF (2.8 billion).
43
III.1.3.2 - Analysis of the consolidated income statement
Net banking income rose from €8,159 million in 2012 to €8,445 million in 2013.
General operating expenses increased to €5.2 billion from €5.1 billion at December 31, 2012 (+0.2%).
Net additions to provisions for loan losses were on a par with those in 2012 (€965 million; +0.3%). The net
provisioning for known risks (excluding collective provisions) in relation to outstanding loans fell from
0.50% to 0.51% and the overall non-performing loans provisioning ratio was 69.8% at December 31, 2013.
Net income amounted to €1,484 million, up from €1,200 million in 2012.
III.1.3.3 - Breakdown by activity:
BFCM Group’s business segments reflect its organizational structure, which is presented in detail in this
document. The reader may also refer to Note 2 to the financial statements “Analysis of statement of financial
position and income statement items by activity and geographic region”, as well as Note 3 “Scope of
consolidation”, which presents the selected groupings.
III.1.3.3.1 - Retail banking
Retail banking is the BFCM Group’s core business. It comprises the Banque Européenne du Crédit Mutuel,
the CIC network, CIC Iberbanco, the Targobank branches in Germany and Spain, the Cofidis Group, Banque
Casino and all specialized activities for which the networks handle product marketing, such as equipment
leasing and leasing with purchase option, real estate leasing, vendor credit, factoring, fund management and
employee savings.
All of these businesses performed well in 2013. Deposit taking increased by 6.7%. Outstanding loans also
increased, but at a slower pace (+2.9%).
(€ millions)
2013
2012
Net change
Net banking income
6,210
5,854
+6.1%
Operating expenses
(3,754)
(3,748)
+0.1%
Operating income before
provisions
2,457
2,106
+16.7%
Income before taxes
1,621
1,243
+30.4%
Net income/(loss)
1,089
787
+38.5%
Net banking income from retail banking totaled €6,210 million, compared with €5,854 million in 2012. The
largest contributions came from the CIC banking networks (€3,111 million), Targobank Germany (€1,361
million) and Cofidis (€1,137 million).
This growth was attributable to an increase in the interest margin and growth in net fee income.
General expenses remained stable on the whole at €3,754 million.
Net additions to provisions for loan losses totaled €884 million, compared with €774 million in 2012.
Net income therefore amounted to €1,089 million versus €787 million in 2012.
III.1.3.3.2 - Insurance
BFCM Group expanded its insurance activities through the subsidiaries of the Groupe des Assurances du
Crédit Mutuel (GACM) holding company, including in particular ACM VIE SA, SERENIS VIE, ACM
IARD, SERENIS ASSURANCES, PARTNERS ASSURANCES in Belgium and ICM LIFE in Luxembourg.
The GACM companies do business in life and non-life insurance, insurance brokerage and reinsurance. The
products are marketed through the CM-CIC networks.
44
2013 marked the first year in which the Spanish subsidiary Agrupacio was consolidated.
2013
(€ millions)
2012
Change
Change
gross
constant scope
Net banking income/(expense)
1,338
1,318
+1.5%
-2.7%
Operating expenses
(391)
(335)
+17.0%
+2.4%
946
983
-3.8%
-4.4%
Income before taxes
918
942
-2.6%
-3.3%
Net income/(loss)
575
568
+1.1%
+0.4%
Operating
provisions
income
before
Consolidated insurance revenue increased by 21% to €9.6 billion compared to 2012: +29.3% for life
insurance, +3.5% for personal insurance, +5.7% for automobile insurance and +8.8% for home insurance.
Net premium income totaled €1,338 million in the year ended December 31, 2013 compared to €1,318
million in 2012, after remittances to the retail networks totaling €1,074 million. The Group reported net
income of €575 million, compared with €568 million in 2012.
III.1.3.3.3 - Corporate banking
Corporate banking includes the financing of large corporates and institutional clients, value-added financing
(project and asset financing, export financing, etc.), international activities and financing carried out by
foreign branches.
In 2013, it managed €12 billion in loans (-8%) and €8.7 billion in deposits (+56%).
2013
(€ millions)
2012
Movements
Net banking income/(expense)
314
324
-3.2%
Operating expenses
(89)
(92)
-3.4%
225
232
-3.1%
Income before taxes
187
171
+9.6%
Net income/(loss)
124
131
-5.5%
Operating
provisions
income
before
Net banking income totaled €314 million (€324 million in 2012), with the decline due to lower margins
following efforts to win new customers. General operating expenses and overall net additions to provisions
for loan losses fell by 3.4% and 38%, respectively. Net income was therefore €124 million, compared with
€131 million at end-2012.
III.1.3.3.4 - Capital markets activities
BFCM and CIC have consolidated their capital markets activities under one roof, CM-CIC Marchés, which
carries out the CM11-CIC Group refinancing and commercial and proprietary trading activities from offices
in Paris and Strasbourg, and through branches in New York, London, Frankfurt and Singapore.
These transactions are recognized on two balance sheets:
- that of BFCM for the refinancing business line,
- and that of CIC for the commercial and investment activities in fixed income products, equities and
credit.
The bank has continued to secure and diversify its sources of funding and to assist many customers with their
bond issues. It has also successfully extended its investment skills to customers for placements and hedging
of financial risks.
The capital markets activities also include stock market intermediation, which is provided by CM-CIC
Securities.
45
(€ millions)
Net banking income/(expense)
2013
2012
Movements
513
603
-15.0%
(184)
(196)
-6.3%
329
407
-19.2%
Income before taxes
322
383
-15.9%
Net income/(loss)
204
230
-11.3%
Operating expenses
Operating
provisions
income
before
For the year ended December 31, 2013, net banking income totaled more than €513 million (€603 million in
2012). General operating expenses and net additions to provisions for loan losses contracted by 6.3% and
71%, respectively. Net income totaled €204 million, compared with €230 million at end-2012.
III.1.3.3.5 - Private banking
The private banking segment develops know-how in financial and wealth management, which is offered to
the families of business owners and private investors worldwide, and more particularly in Europe and Asia.
In France, it operates through two major players:
- CIC Banque Privée, which is part of the CIC network and mainly targets senior executives;
- CIC Banque Transatlantique, whose tailor-made services, aimed largely at French nationals living
abroad, include private banking and stock options.
Internationally, the group has operations, some of them long-established, in countries and areas where private
banking offers growth potential: Luxembourg, Switzerland, Belgium, and Asia.
Its brands offer nearly 180,000 customers a wide range of high value added services.
It has €103 billion of assets under management, €14 billion in commitments and employs 1,900 people.
2013
(€ millions)
Net banking income/(expense)
Operating expenses
Operating
provisions
income
Income before taxes
Net income/(loss)
before
2012
Movements
444
463
-4.0%
(329)
(334)
-1.4%
115
129
-10.8%
108
106
+1.5%
70
79
-11.3%
Net banking income came to €444 million, down from €463 million in 2012, mainly as a result of the drop in
the interest margin. Net additions to provisions for loan losses fell sharply to €8 million (a €22 million
decline), bearing in mind that the 2012 result was still affected by a residual overhang of Greek sovereign
debt. Nevertheless, net income fell by 11% to €70 million.
III.1.3.3.6 - Private equity
Private equity is a key pillar of our commercial strategy, enabling us to support efforts to bolster
shareholders’ equity on behalf of corporate clients of the Crédit Mutuel and CIC networks over medium- and
long-term periods (seven to eight years). This business line is operated by CM-CIC Capital Finance, which,
with €2.5 billion in assets under management and nearly 550 companies in its portfolio, is the leading French
private equity player with bank capital.
46
(€ millions)
Net banking income/(expense)
2013
2012
Movements
119
100
+19.0%
(34)
(34)
-1.2%
85
66
+29.5%
Income before taxes
85
66
+29.3%
Net income/(loss)
86
67
+26.9%
Operating expenses
Operating
provisions
income
before
CM-CIC Capital Finance and its subsidiaries generated €119 million in net banking income in 2013
compared with €100 million in 2012. Net income was up by nearly 27% to €86 million
III.1.3.3.7 - Logistics
The “Logistics” division includes purely logistics entities: intermediary holding companies, operating real
estate housed within specific companies, the group IT companies, EI Telecom, Euro protection Surveillance
and the press division.
(€ millions)
Net banking income/(expense)
2013
2012
Movements
301
314
-3.9%
(333)
(342)
-2.5%
(32)
(28)
ns
Income before taxes
(5)
(3)
ns
Net income/(loss)
(9)
(5)
ns
Operating expenses
Operating
provisions
income
before
The net banking income of this activity amounted to €301 million (compared to 314 million at the end of
2012) and includes the net banking income of the Targobank Germany and Cofidis logistics subsidiaries, as
well as the trading margin of the press division.
The Logistics activity posted a net loss of €9 million in 2013 compared with a net loss of €5 million in 2012.
III.1.3.3.8 - Holding
The Holding company, which has no operational activities, oversees and coordinates the activities of the
subsidiaries.
In 2013, this activity reported negative net banking income of €750 million and a net loss of €655 million.
These figures include the cost of refinancing Targobank Germany, the shortfall in working capital at BFCM,
Targobank and Cofidis goodwill amortization, the CIC business development plans and the impairment of
the equity interest in BPM.
III.2 - Recent developments and outlook
The economic situation is uncertain. In France and elsewhere in Europe, structural reforms may take a back
seat due to the lack of room to maneuver. Our business will be very sensitive to the uncertainty governing the
economic outlook.
47
III.3 - Risk Report
This section sets out the information required by IFRS 7 regarding risk exposures arising from financial instruments.
The figures provided in this section have been audited, except for those specifically marked with an asterisk(*), which have been
checked for accuracy and consistency as stipulated in Article L.823-10 of the French Commercial Code, as has the rest of the board
of directors’ report.
The periodic and permanent control functions and the compliance function provide strict oversight of processes across all business
activities.
The risk management department consolidates overall risk control and optimizes risk management as regards the regulatory capital
allocated to each business and return on equity.
III.3.1 - Credit risk
III.3.1.1 - Organization of the lending unit
In accordance with applicable regulations, the lending unit is organized mainly around the two following
mechanisms:
- loan origination procedures; and;
- risk assessment, the monitoring of commitments and management of at-risk items.
The lending unit and exposure management are organized based on a single set of guidelines that prescribes
the rules and practices applicable within the Group.
III.3.1.1.1 - Loan origination procedures
Credit approval draws on know-your-customer, risk assessment and commitment decision procedures.
Know-your-customer
The Group relies on the close ties it has established in the communities in which it operates as the basis for
obtaining information about existing and prospective customers, which the Group places into several riskbased categories that help determine the targeting of marketing efforts. A loan file is prepared to support the
loan origination process.
Risk assessment
Risk assessment draws on various analyses performed at different stages in the lending cycle including, in
particular:
- customer ratings;
- risk groups; and
- the weighting of products according to the type of risk involved and the collateral and guarantees
pledged.
The relevant Group employees receive periodic training on risk management and assessment.
Customer ratings: a single system for the entire Group
In accordance with the applicable regulations, the Group’s internal customer rating system is at the core of
the Group’s credit risk procedures and used in determining approval, payment, pricing and monitoring. All
loan origination decisions are based on the counterparty’s rating. The lending unit approves the internal
ratings of all loan files for which it is responsible.
The Group has developed rating algorithms and expert models to improve its credit risk assessment and to
comply with the regulatory requirements concerning internal rating approaches.
This rating system is common to the entire Crédit Mutuel Group.
Confédération Nationale du Crédit Mutuel (CNCM) is responsible for defining the rating methodologies for
all portfolios. Nevertheless, the regional entities are directly involved in carrying out and approving working
parties’ assignments on specific subjects and the work related to data quality and applications acceptance
tests.
The group’s counterparties that are eligible for internal approaches are rated by a single system.
Models (algorithms or grids) are used to differentiate and correctly classify risk. The assessment scale
reflects the manner in which the risk changes and is broken down into nine non-default positions (A+, A-,
B+, B-, C+, C-, D+, D- and E+) and three default positions (E-, E= and F).
48
Monitoring of the rating models focuses on three aspects: stability assessment, performance and additional
analyses. CNCM is responsible for this monitoring, which covers each rating model.
Risk groups (counterparties)
Individuals or legal entities that are related in such a way that if one of them encounters financial problems it
is likely that the others will follow, are considered as a single beneficiary.
The risk groups are established based on a procedure that incorporates the provisions of Article 3 of CRBF
regulation 93-05.
Product and guarantee weightings
When assessing the counterparty risk, the Group may apply a weighting of the nominal commitment, based
on a combination of the loan type and the nature of the guarantee.
Loan origination process
The loan origination process is essentially based on:
- a formalized risk analysis of the counterparty;
- the internal rating applied to the counterparty or group of counterparties;
- approval levels;
- review of the loan file by a separate team under the group’s dual review principle;
- whether the loan falls within maximum discretionary lending limits that have been determined in
proportion to the local lending bank’s equity;
- whether the interest rate and other fees are adapted to the loan’s risk profile and capital consumption.
The group uses a real-time automated decision-making circuit. As soon as a loan application has been
completed, the electronic loan file is automatically transmitted to the relevant decision maker at the
appropriate level.
Approval levels
The customer relationship manager is responsible for ensuring the completeness, quality and reliability of the
information collected. In accordance with Article 19 of CRBF regulation 97-02, the manager compiles loan
files intended to formalize all qualitative and quantitative information on each counterparty. The manager
checks the reliability of the information gathered either with customers or using any external means (sector
studies, annual reports, legal information and rating agencies) or internal means at his disposal. Customer
relationship managers are each responsible for any decisions they take or cause to be taken and are endowed
with personal approval powers.
For loan files whose amount exceeds the personal approval powers, the decision falls to a Loan Origination
Committee whose operating rules are set by procedures.
Approval powers reflect a range of commitment caps based on:
- the rating;
- the total amount of commitments for a given counterparty or risk group, weighted where relevant
depending on the type of loan concerned or the eligible guarantees;
- any specific exclusions.
Role of the lending unit
The lending unit is present at various operational levels. Coordination of the unit and involvement in the key
tasks and files are carried out from Strasbourg (CM) and Paris (CIC). Specialized teams also provide a
regional presence wherever the Group operates.
It has two key roles and is therefore split into two independent teams, whose responsibilities are as follows:
- one team is responsible for checking that the loan origination decisions are appropriate based on the
dual review principle while verifying that the expected return is commensurate with the risk taken;
- the other team is responsible for prudential oversight and credit risk assessment arrangements, and also
performs permanent controls.
49
III.3.1.1.2 - Risk assessment, commitment monitoring procedures and management of at-risk items
In accordance with the prevailing regulations, commitments are monitored by national and regional entities.
Risk assessment
To assess risk, BFCM Group uses an array of tools that provide an aggregated, static and dynamic view of:
- the exposure to a given counterparty or group of counterparties;
- new and existing loans, based on elements adapted to suit the business lines concerned (rating, market,
lending products, business segments, remuneration, etc.).
Each commercial entity uses information systems to check compliance with the limits assigned to each of its
counterparties on a daily basis.
Commitment monitoring
Together with other interested parties, the lending unit contributes to the quarterly, formalized monitoring of
the quality of the credit risk of each business line.
This monitoring is conducted independently from the loan origination process and is in addition to and in
coordination with the actions taken mainly by first-level control in the lending units, permanent control and
the Risk Department. The objective is to identify as early as possible at-risk situations using specific criteria
for each customer segment, either through software applications or through the relevant operations and
commitments managers.
The group also conducts internal reviews of counterparties to set “major risks” limits, determined based on
either the bank’s equity under CRBF regulation 93-05 in the case of regulatory limits, or equity and internal
counterparty ratings in the case of corporate limits, using the methods (including those covering frequency)
defined in the procedures specific to this area.
Advanced risk detection tools (management of debtors/sensitive risks/automatic transfer to the out-of-court
collections unit) are also used to monitor account functioning anomalies and overruns, on the basis of both
external and internal criteria, in an automated, systematic and comprehensive manner. These criteria are used
to identify loans for special handling as early as possible.
Permanent controls on commitments
The network permanent control function, which is independent of the lending function, performs second
level controls on credit risk. Counterparties exhibiting warning signs are reviewed, and entities with multiple
negative indicators are identified. The aim of the control is to ensure that appropriate “risk” strategies are
applied and suitable remedial action implemented.
This adds an additional layer of security to the credit risk management mechanism.
Management of at-risk items
A unified definition of default based on Basel and accounting requirements
The entire Credit Mutuel group uses a unified definition of default, which draws a correlation between the
Basel concept of default and the accounting notion of non-performing loans and loans in litigation as a result
of an alignment of prudential rules to accounting regulations (CRC 2002-03). The computer applications take
contagion into account, which also allows related loans to be downgraded.
Identification of at-risk items
The objective of the process is to identify all loans to be placed on credit watch and allocate them to the
applicable category: sensitive(not downgraded), non-performing or in litigation. All loans are subject to an
automatic monthly identification process using internal and external indicators that have been parameterized
in the information system. Downgrading, in accordance with the prevailing regulatory criteria, is carried out
automatically.
Transfer to non-performing, provisioning and reclassification as performing
Adjustments associated with the transfer to non-performing, provisioning and the reclassification as
performing comply with the prevailing prudential rules and are processed automatically monthly, which
ensures the process is exhaustive.
50
Management of customers downgraded to non-performing or in litigation
The counterparties concerned are managed differently according to the severity of the situation: at the branch
level by the customer relationship manager or dedicated teams specialized by market, type of counterparty or
collection method.
Reporting
Risk Committee
In accordance with the provisions of CRBF regulation 97-02, the various bodies concerned, notably the Risk
Committee, are informed of changes in lending commitments at least once every quarter. In addition, they
are informed of and participate in decisions on revisions to the various credit management measures.
Information provided to management
Detailed information on credit risks and related procedures is provided to the general management. This
information is also presented to a Risk Monitoring Committee in charge of examining the strategic
challenges faced by the BFCM Group in terms of risks, in accordance with applicable regulations.
III.3.1.2 - Quantified data
III.3.1.2.1 - Summary credit-risk data (balance sheet and off-balance sheet).
2013 was characterized by growth in lending to customers and stable provisioning for loan losses, with net
additions to provisions at a similar level to 2012.
Exposure
Total gross exposure came to €229.3 billion, down by 4.8% compared with the end of 2012. Loans to
customers totaled €176.7 billion, up by 3.2% relative to 2012, while loans to credit institutions were down by
24.3%.
(in € millions, year-end principal balances)
Loans & receivables
Credit institutions
Customers
Gross exposure
Impairment provisions
Credit institutions
Customers
Net exposure
Dec. 31,
2013
Dec. 31,
2012
52,689
176,655
229,344
69,580
171,256
240,837
-4
-7,545
221,796
-280
-6,275
234,281
Dec. 31,
2013
Dec. 31,
2012
3,776
39,510
3,815
37,090
1,999
14,779
116
1,317
13,309
111
Source: Accounting - excluding repurchase agreements.
Exposure on commitments given
(in € millions, year-end principal balances)
Financing commitments given
Credit institutions
Customers
Guarantee commitments given
Credit institutions
Customers
Provision for risks on commitments given
Source: Accounting - excluding repurchase agreements.
51
Customer loans
Loans to customers totaled €176.7 billion, up by 3.2% relative to 2012. On-balance sheet medium and longterm loans increased by 4.8%, while short-term loans were down by 2.9%.
(in € millions, year-end principal balances)
Short-term loans
Overdrawn current accounts
Commercial loans
Short-term credit facilities
Export credits
Medium- and long-term loans
Equipment loans
Housing loans
Finance leases
Other loans
Total gross customer loans, excluding non-performing
loans and accrued interest
Non-performing loans
Accrued interest
Total gross customer loans
Dec. 31,
2013
Dec. 31,
2012
49,936
6,876
4,877
37,690
494
115,608
32,735
66,238
8,890
7,746
51,403
7,252
4,722
38,964
465
110,268
31,199
63,746
8,436
6,887
165,545
10,804
307
176,655
161,671
9,270
315
171,257
Source: Accounting - excluding repurchase agreements.
Unless otherwise specified, the comments, outstanding loans and analyses set out below (except for the “Housing loans”
and “Geographical risk” sections) do not include Targobank Germany, the Cofidis Group, Targobank Spain and Banque
Casino.
Quality of the portfolio
The loan portfolio is of high quality. On the internal rating scale, which has nine non-default levels,
customers in the best eight categories accounted for 97.2% of the outstanding loans.
Performing loans to customers by internal rating
A+ and AB+ and BC+ and CD+ and DE+
Dec. 31,
2013
in %
30.4%
29.7%
27.0%
10.1%
2.8%
Dec. 31,
2012
in %
27.4%
33.0%
25.7%
11.3%
2.5%
Source: Risk Management.
CM-CIC
Rating
A+
AB+
Bc
CD+
DE+
Correspondence
Moody’s
AAA to Aa1
Aa2 to Aa3
A1 to A2
A3 to Baa1
Baa2
Baa3
Ba1 to Ba2
Ba3 to B1
B2 and lower
Correspondence
Standard & Poors
AAA to AA+
AA to AAA+ to A
A- to BBB+
BBB
BBBBB+ to BB
BB- to B+
B and lower
Focus on Housing loans
Outstanding home loans increased by 3.9% in 2013 and accounted for 40% of total gross customer loans.
Home loans are divided among a very large number of customers and are backed by real property sureties or
first-rate guarantees.
52
Dec. 31,
2013
66,238
24,759
33,943
7,536
(in € millions, year-end principal balances)
Housing loans
Secured by Crédit Logement or Cautionnement Mutuel Habitat
Secured by mortgage or equivalent, low-risk guarantee
Other guarantees (1)
Dec. 31,
2012
63,746
22,281
34,221
7,244
Source: Accounting. (1) Other risk-level mortgages, pledges, etc.
Breakdown of loans by customer type
The breakdown of loans by customer type takes into account all the BFCM Group entities.
Dec. 31,
2013
in %
66%
29%
3%
2%
Retail
Corporates
Large corporates
Specialized financing and other
Dec. 31,
2012
in %
65%
29%
3%
2%
Source: Risk Management.
Geographical breakdown of customer risk
98% of the identified country risk is in Europe. With marginal exceptions, the country risk exposure of the
portfolio is centered on France and the OECD countries.
Dec. 31,
2013
in %
84%
14%
2%
France
Europe, excluding France
Rest of the world
Dec. 31,
2012
in %
85%
13%
2%
Source: Accounting.
Concentration risk/Exposure by segment
The tables shown below derive from the Basel II calculator for the CM11-CIC Group.
In accordance with Article 4.1 of CRBF regulation 2000-03, the following subsidiaries are exempt from
monitoring on an individual or sub-consolidated basis: BFCM, CMCIC Home Loan SFH and CIC Iberbanco.
The other regulated entities are subject to monitoring on an individual or sub-consolidated basis.
Exposure of the CM11-CIC Group by category*
(in € billions)
Governments and central banks
Institutions
Corporate
Retail customers
Stock
Securitization
Other non-credit obligation assets
TOTAL
Exposure as of Dec. 31, 2013
Exposure as of Dec. 31, 2012
IRB
IRB
29
98
205
3
4
5
344
Standard
66
8
11
38
0
0
1
125
Total
66
37
110
243
3
4
5
469
33
90
199
3
4
5
333
Standard
63
9
10
36
0
0
1
119
Total
63
42
100
235
3
4
5
453
Average
exposure
2013
60
40
104
241
3
4
5
458
Source : Basel II calculator - CM11-CIC Group consolidation scope.
Historically, Crédit Mutuel’s priority has been to develop a customer base of private individuals. CIC, which
was originally geared more toward the corporates market, has gradually gained strength in the personal
banking segment. However, it continues to serve corporates.
The composition of the Group’s portfolio clearly reflects these principles, as evidenced by the fact that the
share of retail customers held steady at 52% in 2013.
Exposure by country of residence of the CM11-CIC Group’s counterparty
53
Category of exposure as of Dec. 31, 2012
France
Germany
Governments and central banks
Credit institutions
Corporate
Retail customers
TOTAL
11.5%
5.4%
18.7%
48.4%
83.9%
0.6%
0.4%
0.8%
3.5%
5.3%
Category of exposure as of Dec. 31, 2012
France
Germany
Governments and central banks
Credit institutions
Corporate
Retail customers
TOTAL
11.4%
5.9%
18.3%
48.7%
84.2%
0.5%
0.3%
0.7%
3.2%
4.8%
Other EEA
Rest of the
member
world
countries
1.6%
1.2%
1.1%
0.8%
1.9%
1.6%
1.5%
1.1%
6.1%
4.8%
Total
14.9%
7.7%
23.0%
54.5%
100%
Source : Basel II calculator - CM11-CIC Group consolidation scope.
Other EEA
Rest of the
member
world
countries
1.2%
1.6%
0.7%
1.0%
2.0%
1.8%
1.5%
1.1%
5.5%
5.5%
Total
14.7%
7.9%
22.8%
54.6%
100%
Source : Basel II calculator - CM11-CIC Group consolidation scope.
The Group is primarily a French and European player. The geographic breakdown of gross exposures at
Tuesday, December 31, 2013 reflects this as 95.3% of its commitments are in the European Economic Area.
Exposure of the CM11-CIC Group by sector
The sector breakdown reflects loans to governments and central banks, institutions, corporates and retail
customers.
Sector
Governments and central banks
Individuals
Banks and financial institutions
Individual entrepreneurs
Agriculture
Non-profit
Travel and leisure
Chemicals
Retail
Automotive
Building and construction materials
Industrial goods and services
Healthcare
Other financial sector
Industrial transportation
Household goods
Real estate
Utilities
Agri-food and drink
Media
Holding companies, conglomerates
Cutting-edge technologies
Oil and gas, commodities
Telecommunications
Other
Total
Dec. 31,
2013
in %
15.60%
45.97%
7.13%
3.19%
1.49%
0.54%
1.17%
0.25%
3.74%
0.78%
2.61%
2.32%
0.61%
1.83%
1.34%
0.59%
3.57%
0.49%
1.42%
0.43%
2.08%
0.90%
1.25%
0.36%
0.34%
100.00%
Dec. 31,
2012
in %
15.51%
45.20%
8.39%
3.23%
1.38%
0.47%
1.06%
0.26%
3.61%
0.77%
2.50%
2.24%
0.55%
1.90%
1.39%
0.60%
3.48%
0.56%
1.35%
0.44%
2.24%
0.77%
1.37%
0.34%
0.38%
100.00%
Source : Basel II calculator - CM11-CIC Group consolidation scope.
54
Major risks
Corporate
Dec. 31,
2013
Dec. 31,
2012
36
23,840
8,066
28
20,269
7,726
15,773
12,543
129
38,891
15,983
133
38,624
16,340
22,908
22,284
Dec. 31,
2013
Dec. 31,
2012
Gross commitments in excess of €300m
Number of counterparty groups
Total commitments (€m)
of which total statement of financial position (€m)
of which total off-statement of financial position
guarantee and financing commitments (€m)
10
6,913
4,496
12
8,884
7,039
2,416
1,845
Gross commitments in excess of €100m
Number of counterparty groups
Total commitments (€m)
of which total statement of financial position (€m)
of which total off-statement of financial position
guarantee and financing commitments (€m)
29
10,671
7,286
29
12,062
9,714
3,384
2,348
Concentration of customer credit risk
Gross commitments in excess of €300m
Number of counterparty groups
Total commitments (€m)
of which total statement of financial position (€m)
of which total off-statement of financial position
guarantee and financing commitments (€m)
Gross commitments in excess of €100m
Number of counterparty groups
Total commitments (€m)
of which total statement of financial position (€m)
of which total off-statement of financial position
guarantee and financing commitments (€m)
Source : DGR 4003.
Gross commitments: weighted uses statement of financial position + off-statement of
financial position guarantee and financing commitments.
Banks
Concentration of customer credit risk
Source : DGR 4003.
Gross commitments: weighted uses statement of financial position + off-statement of
financial position guarantee and financing commitments.
At-risk items and net additions to/reversals of provisions for loan losses
Non-performing loans and loans in litigation totaled €10,804 million at December 31, 2013 compared with
an adjusted total of €10,432 million at the end of 2012. These loans accounted for 6.1% of total customer
loans in 2013 versus 6.0%4 in 2012.
At the end of 2013, actual net provisioning for known risks represented 0.506% of gross outstanding
customer loans, compared with 0.491%5 at December 31, 2012. The cost of total customer risk, which
includes provisions for collectively impaired receivables, amounted to 0.527% of the gross outstanding
customer loans, compared with 0.522%4 at December 31, 2012. The table below summarizes the main
components.
4 Figures restated following reconstitution of €1,163 million of loans fully amortized since over 5 years on TARGOBANK Germany
55
Net additions to/reversals from provisions for loan losses
Dec. 31,
2013
Cost of total customer risk
Banking networks
0.527%
a
Dec. 31,
2012
(1)
0.522%
Dec. 31,
2012
0.526%
0.29%
0.20%
0.20%
Individuals
0.09%
0.08%
0.08%
Housing loans
0.07%
0.07%
0.07%
1.25%
3.49%
0.20%
0.10%
1.43%
3.92%
0.48%
0.31%
1.57%
3.92%
0.48%
0.31%
Consumer credit - Targobank Germany
Consumer credit - Cofidis
Financingb
Private banking
Source: DGR and Accounting
CIC, BECM, CIC Iberbanco, Targobank Spain (excluding Targobank Germany, Cofidis
and support subsidiaries in the network ).
b. Large corporates, International (incl. foreign branches), Specialized financing.
Quality of customer risks
Dec. 31,
2013
(in € millions, year-end principal balances)
Individually impaired receivables
Individual impairment
Collective impairment
Coverage ratio
Coverage ratio (individual impairment only)
10,804
6,959
586
69.8%
64.4%
Dec. 31,
2012
(1)
10,432
6,949
490
71.3%
66.6%
Dec. 31,
2012
9,269
5,785
490
67.7%
62.4%
Source: Accounting.
Outstanding loans to customers that are overdue but not impaired
Dec. 31, 2013 (in € millions)
Debt instruments (1)
Loans & receivables
Governments
Credit institutions
Non-financial institutions
Large corporates
Retail customers
Total
< 3 months
0
1,771
0
1
6
394
1,370
1,771
> 3 months > 6 months
< 6 months
< 1 year
0
0
18
22
0
0
0
0
0
0
2
18
16
3
18
22
> 1 year
0
12
0
0
0
9
3
12
TOTAL
0
1,822
0
1
6
422
1,394
1,822
(1) Available-for-sale or held-to-maturity debt securities.
Dec. 31, 2012 (in € millions)
Debt instruments (1)
Loans & receivables
Governments
Credit institutions
Non-financial institutions
Large corporates
Retail customers
Total
< 3 months
0
2,055
1
10
0
421
1,624
2,055
> 3 months > 6 months
< 6 months
< 1 year
0
0
17
11
0
0
0
0
0
0
1
5
16
5
17
11
> 1 year
0
16
0
0
0
10
5
16
TOTAL
0
2,099
1
10
0
437
1,651
2,099
(1) Available-for-sale or held-to-maturity debt securities.
56
III.3.1.2.3 - Interbank loans*
Interbank loans by geographic region
France
Europe, excluding France
Rest of the world
Dec. 31,
2013
in %
33.3%
38.8%
27.9%
Dec. 31,
2012
in %
43.1%
34.2%
22.7%
Source: Counterparty Financial Information Department.
Banks only (excluding Targobank Germany, Targobank Spain and Cofidis).
The breakdown of interbank loans is based on the country of the parent company.
At the end of 2013, exposures related mainly to European and North American banks.
The weight of interbank loans located in France decreased, while the weight of loans in the other regions
increased overall.
Structure of interbank exposure by internal rating
A+
AB+
BC and below
Not rated
Equivalent
external
rating
AAA/AA+
AA/AAA+/A
ABBB+ and
below
Dec. 31,
2013
in %
Dec. 31,
2012
in %
0.1%
24.1%
51.4%
8.5%
0.1%
32.5%
43.3%
10.3%
15.9%
0.0%
13.5%
0.3%
Source: Counterparty Financial Information Department.
Banks only (excluding Targobank Germany, Targobank Spain and Cofidis).
In 2013, the change in the structure of BFCM’s interbank exposure based on the internal rating was marked
by: i)a decrease in the weight of loans rated A- (external equivalent AA/AA-) and ii)an increase in the weight
of loans rated B+ (external equivalent A+/A) and a slight increase in the weight of loans rated C+ or lower
(external equivalent BBB+).
All in all, 84% of outstanding loans are rated B or A, i.e. at least A- in equivalent external ratings, compared
to 86% the previous year.
III.3.1.2.4 - Sovereign risk
Sovereign risk is presented in Note 7b to the consolidated financial statements of BFCM Group.
III.3.1.2.5 - Debt securities, derivative instruments and repurchase agreements
The securities portfolios are mainly held by the capital markets activity and, to a lesser extent, the assetliability management unit.
Debt securities
(in € millions, year-end principal balances)
Government securities
Bonds
Derivative instruments
Repurchase agreements & securities lending
Gross exposure
Provisions for impairment of securities
Net exposure
Carrying
Carrying
amount as of amount as of
Dec. 31,
Dec. 31,
2013
2012
22,755
13,589
71,763
72,424
9,947
5,461
13,643
12,508
118,108
103,983
-97
-102
118,011
103,881
Source: Accounting.
57
III.3.2 - Asset-liability management (ALM) risk
III.3.2.1 - Organization
The CM11-CIC group’s asset-liability management functions are centralized and include the BFCM group.
The CM11-CIC Group’s decision-making committees for matters concerning liquidity and interest-rate risk
management are as follows:
- The ALM Technical Committee manages liquidity and interest rate risk in accordance with the risk
limits applied within the CM11-CIC group. The committee is composed of the heads of the relevant
business lines (finance department, asset-liability management, refinancing and treasury, marketing and
risk) and meets at least on a quarterly basis. The indicators compiled at consolidated level and by entity
are static and dynamic liquidity gaps, Basel III stress scenario liquidity gaps, static interest-rate gaps and
sensitivity of net banking income and net asset value.
- The ALM Monitoring Committee, composed of the CM11-CIC group’s senior executives, examines
changes in asset-liability management risk and approves the risk limits.
Hedging decisions are aimed at maintaining the risk indicators within the limits set for CM11-CIC as a
whole and for each of the entities comprising the Group. The hedges are assigned to the entities concerned,
in accordance with their needs.
The various asset-liability management risk indicators are also presented each quarter to the CM11-CIC
Group’s Risk Committee.
The role and principles governing asset-liability management are defined as follows:
-
Asset-liability management is a distinct function from the dealing room, with its own resources.
-
The key objective of asset-liability management is to shelter lending margins from the effects of interest and
exchange rate fluctuations and to ensure that the bank has sufficient liquidity to meet its obligations and protect it
from a liquidity crisis.
-
Asset-liability management does not operate as a profit center but as a function that serves the bank’s profitability
and development strategy, as well as the management of liquidity risk and interest-rate risk arising from the
activity of the network.
Asset-liability management helps to define the bank’s sales and marketing policy in terms of lending criteria
and rules governing internal transfer rates and is in constant contact with the sales teams throughout the
network.
III.3.2.2 - Interest-rate risk management*
Interest rate risk arising on the Group’s commercial operations stems from interest rate differentials and
differences in benchmark lending and borrowing rates. Analysis of this risk also takes into account the
volatility of outstanding on products with no contractual maturity date and embedded options (early
repayment and roll-over options for loans and confirmed credit line drawdowns, etc.).
The group uses a combination of macro hedging and specific hedging to manage interest-rate risk arising
from all operations connected with the banking network’s business, as well as customer loans involving a
material amount or an unusual structure. Risk limits are set in relation to the annual net banking income of
each bank and each group. The technical committee decides which hedges to put in place and allocates them
pro rata to the needs of each entity.
Interest rate risk is analyzed based on the main indicators below, which are updated on a quarterly basis.
1 - The static fixed-rate gap, corresponding to items in the balance sheet, assets and liabilities, whose
cash flows are considered to be certain over a one to ten year horizon, governed by limits from three to
seven years, measured by a net banking income ratio.
2 - The static “inflation” gap over a one to ten year horizon.
3 - The sensitivity of the net interest margin, calculated based on national scenarios and subject to
limits. It is measured in annual steps, over a two-year horizon and is expressed as a percentage of each
entity’s net banking income.
The group calculates four scenarios:
scenario 1 (core scenario): a 1% increase in market interest rates and a 0.33% increase in inflation;
58
scenario 2: a 1% increase in market interest rates and stable inflation;
scenario 3: a 2% increase in market interest rates and a 0.66% increase in inflation;
scenario 4 (stress scenario): a 3% increase in short interest rates, a 1% decline in long rates and
stable inflation.
At, December 31, 2013, the net interest income of BFCM Group and the CM11-CIC Group, under the
core scenario, was exposed to a drop in interest rates. For these two scopes of consolidation, interest
sensitivities were similar:
- For the BFCM Group scope of consolidation (excluding the refinancing activity), the sensitivity was
-€136.9 million in year 1 and -€130.0 million in year 2, equivalent to 3.0% and 2.7% of forecast net
banking income for each year, respectively.
- For the scope of consolidation of the CM11-CIC Group commercial banking (excluding the holding
company), the interest sensitivity was -€112.4 million in year 1 and -€208.8 million in year 2,
equivalent to 1.6% and 2.8% of forecast net banking income for each year, respectively. The risk
limits (3% of net banking income in one year and 4% in two years) applying to the commercial bank
were complied with.
Indicators in case of a rise in interest rates in CM11-CIC commercial banking (excluding the holding
company) were as follows:
Sensitivity as a % of NBI
1 year
2 years
Scenario 1
1.6%
2.8%
Scenario 2
2.6%
4.4%
Scenario 3
1.8%
4.0%
Scenario 4
-0.2%
-2.0%
4 - Sensitivity of Net Asset Value (NAV) arising from the application of the Basel II indicator:
By applying a uniform 200 bp increase or decrease to the whole balance sheet(with a floor of 0% for
market rates), it is possible to measure, as a percentage of equity, the change in the net discounted value
of the main balance sheet items based on various scenarios.
Sensitivity of net asset value As a percentage of total equity
Sensitivity + 200 bp
-2.8%
Sensitivity - 200 bp
+4.6%
BFCM Group: Interest rate risk - static fixed rate gap (in €m*)
Groupe BFCM : Echéancier statique à taux fixe en millions d'euros *
Encours
MACRO-AGREGAT
1 an
31/12/2013
INTERBANCAIRE ACTIF
87 393
3 699
CREDITS
153 027
89 468
TITRES
24 677
3 231
VALEURS IMMOBILISEES
26 937
24 817
AUTRES ACTIFS
13 364
10
Total Actif
305 398
121 226
INTERBANCAIRE PASSIF
-103 665
-8 893
DEPOTS
-120 074
-53 465
TITRES
-33 718
-24 790
FONDS PROPRES
-19 463
-19 083
AUTRES PASSIFS
-15 240
-21
Total Passif
-292 160
-106 252
Total Bilan
13 239
14 974
HB ACTIF FINANCIER
68 499
19 898
HB PASSIF FINANCIER
-70 674
-25 130
Total Hors bilan
-2 175
-5 231
Total Général
11 063
9 742
2 ans
3 357
71 535
2 339
24 766
10
102 008
-7 464
-42 373
-20 691
-19 083
-21
-89 631
12 376
16 562
-19 420
-2 857
9 519
5 ans
1 734
37 054
610
24 020
10
63 428
-3 270
-23 765
-11 279
-19 083
-21
-57 419
6 009
9 506
-10 071
-565
5 444
10 ans
1 380
12 117
140
23 989
10
37 637
-1 491
-10 602
-1 341
-19 083
-21
-32 538
5 099
1 353
-181
1 172
6 270
59
III.3.2.3 - Liquidity risk management
The CM11-CIC Group attaches great importance to the management of liquidity risk.
The CM11-CIC Group’s liquidity risk management mechanism is based on the following procedures:
- compliance with the 1-month liquidity ratio, which is representative of the Group’s short-term liquidity
situation;
- calculating the static liquidity gap, based on contractual and agreed maturities and incorporating offbalance sheet commitments; transformation ratios (sources/applications of funds) are calculated at
maturities ranging from three months to five years and are subject to alert thresholds.
- calculating the liquidity gap in a Basel III stress scenario, whose estimated future cash flows are based
on NSFR weightings. Transformation ratios (sources/applications of funds) are calculated at maturities
ranging from three months to seven years with alert thresholds in order to secure and optimize the
refinancing policy.
- calculating the dynamic liquidity gap over five years, incorporating new loans granted, thereby
facilitating measurement of future financing needs associated with the development of commercial
activity;
- the ALM Technical Committee decides on the liquidity hedges to be put in place in light of all these
indicators. These hedges are allocated pro rata to the cumulative needs.
Breakdown of the statement of financial position by residual maturity of future contractual cash flows
(principal)
2013
Residual contractual maturities
(in € millions)
≤ 1 month > 1 month > 3 months > 1 year
(a)
≤ 3 months ≤ 1 year ≤ 2 years
Assets
Trading financial assets
1,862
954
2,892
3,104
Financial assets at fair value through profit or loss
6,656
2,626
1,624
0
Derivative instruments used for hedging purposes - assets
2
0
3,712
1
Available-for-sale financial assets
2,415
2,677
10,549
2,295
Loans and receivables (incl. finance leases)
36,259
12,362
21,702
24,457
Held-to-maturity investments
43
53
1
0
Other assets
1,001
4,143
1,261
20
Liabilities
Central bank deposits
15
34
120
50
Trading financial liabilities
911
191
1,507
1,040
Financial liabilities at fair value through profit or loss
7,827
4,585
4,098
0
Derivative instruments used for hedging purposes - liabilities
7
0
2,442
54
Financial liabilities carried at amortized cost
119,814
23,140
36,335
21,272
Excluding insurance activities
(a) Includes accrued interest income and expense and securities given and received under repurchase agreements.
(b) Includes undated debt securities, equities, non-performing loans, loans in litigation and impairment provisions.
For marked-to-market financial instruments, also includes differences between fair value and redemption value.
2012
> 2 years
≤ 5 years
> 5 years
No fixed
maturity
(b)
Total
6,369
1,646
3
7,103
48,903
641
17
1,855
0
43
4,794
79,387
0
39
16
0
9
1,053
1,363
0
126
17,054
12,552
3,770
30,887
224,432
739
6,607
115
5,782
0
1,219
38,839
127
1,215
0
78
26,742
0
43
0
14
9,858
460
10,690
16,510
3,814
275,999
> 2 years
≤ 5 years
> 5 years
No fixed
maturity
(b)
Total
4,815
1,838
95
8,142
53,360
641
45
3,179
18
5
4,071
77,527
0
48
9
20
2
867
2,439
0
375
17,951
12,470
2,614
19,859
236,012
905
17,276
125
3,099
0
222
48,452
87
1,678
0
1,931
25,296
0
8
0
10
8,863
343
7,551
18,992
2,763
276,562
Residual contractual maturities
(in € millions)
≤ 1 month > 1 month > 3 months > 1 year
(a)
≤ 3 months ≤ 1 year ≤ 2 years
Assets
Trading financial assets
1,823
1,091
5,312
1,722
Financial assets at fair value through profit or loss
5,296
2,439
2,742
116
Derivative instruments used for hedging purposes - assets
3
0
2,500
9
Available-for-sale financial assets
427
369
2,190
3,793
Loans and receivables (incl. finance leases)
48,852
10,782
18,484
24,569
Held-to-maturity investments
3
77
68
116
Other assets
731
15,110
958
9
Liabilities
Central bank deposits
9
45
24
52
Trading financial liabilities
639
158
1,200
770
Financial liabilities at fair value through profit or loss
7,666
6,179
5,147
0
Derivative instruments used for hedging purposes - liabilities 12
9
500
79
Financial liabilities carried at amortized cost
104,297
31,838
38,962
18,855
Excluding insurance activities
(a) Includes accrued interest income and expense and securities given and received under repurchase agreements.
(b) Includes undated debt securities, equities, non-performing loans, loans in litigation and impairment provisions.
For marked-to-market financial instruments, also includes differences between fair value and redemption value.
60
III.3.2.4 - Exchange rate risk
The Group automatically centralizes the foreign currency positions of each group entity in the CIC holding
company and in BFCM on a daily basis for commercial transfers and cash flows, both income and expenses,
denominated in foreign currencies. Any unrealized foreign currency gains and losses are translated into euro
at the end of each month and the resulting foreign currency position is also centralized.
As the result, no Group entity bears any currency risk at its own level. The holding company is responsible
for clearing foreign currency positions daily and monthly via the market.
A specific foreign currency position limit is assigned only to CM-CIC Marchés’ capital markets business.
The structural foreign currency positions resulting from foreign currency allowances to foreign branches are
not hedged.
Foreign exchange gains or losses are recognized in the asset or liability translation accounts and do not pass
through the income statement.
The profits or losses of the foreign branches are retained in the foreign branches and thus add to the
structural foreign currency position.
III.3.2.5 - Equity risk
BFCM Group has exposure to various types of equity risks.
III.3.2.5.1 - Assets measured at fair value through profit or loss
Financial assets held in the trading portfolio amounted to €537 million as at December 31, 2013 compared
with €317 million at December 31, 2012 and solely concerned CIC’s capital markets business (see Note 5a to
the consolidated financial statements).
Financial assets accounted for using the fair value option through profit or loss totaled:
- €1,897 million under the fair value option, of which €1,698 million represented the private equity
business line (see Note 5a to the consolidated financial statements);
- €8,877 million in equities held by the GACM insurance activity (see Note 1.3.4. to the consolidated
financial statements) within the framework of unit-linked policies in the insurance business, to ensure
consistency with the treatment of liabilities.
III.3.2.5.2 - Available-for-sale financial assets
Financial assets classified as available-for-sale and various long-term investments amounted to €6,282
million and €1,742 million respectively (see Note 7 to the consolidated financial statements).
Long-term investments included:
- investments in non-consolidated subsidiaries totaling €1,274 million and in associates totaling €335
million: the main holdings concern Club Sagem (€210 million), Desjardins (€46 million), Foncières des
Régions (€300 million) and CRH (Caisse de Refinancement de l’Habitat) for €72 million;
- other long-term securities (€133 million).
III.3.2.5.3 - Diminution in value of shares
The group reviews its equity investments periodically to identify any impairment to be recognized for listed
securities in the event of a significant or prolonged drop in their price below the acquisition cost.
Net reversals of impairment charges through profit or loss totaled €49 million in 2013 compared to €31
million in 2012.
At December 31, 2013, the acquisition value of impaired stocks was €3,280 million and the corresponding
impairment provision was €1,814 million. Their market value was €1,466 million.
III.3.2.6 - Private equity
The private equity business comprises dedicated private equity entities whose portfolios are all accounted for
under the fair value option. The portfolios comprise around 500 investment lines, relating mainly to smalland medium-sized enterprises.
61
Risks related to the private equity business
Number of listed investment lines
Number of unlisted, active investment lines
Revalued proprietary portfolio (€m)
Managed funds (€m)
Number of managed funds
Dec. 31,
2013
35
387
1,894
363
47
Dec. 31,
2012
33
416
1,769
676
48
III.3.3 - Market risk
III.3.3.1 - General structure
CM-CIC Marchés combines all the capital markets activities of BFCM and CIC in France and those of the
branches in Frankfurt (BFCM), London, New York and Singapore (CIC).
These entities are organized around three business lines: refinancing (transactions which are mainly
recognized on BFCM’s balance sheet), commercial, and fixed income, equity and credit products
(recognized on CIC’s balance sheet).
III.3.3.1.1 - Refinancing:
A dedicated treasury management team is responsible for refinancing all the activities of the CM11-CIC
group. It seeks to diversify its investor base in Paris, Frankfurt and London and its refinancing tools,
including Crédit Mutuel-CIC Home Loan SFH.
The products concerned consist mainly of monetary or bond instruments and futures used to hedge interest
rates and exchange rates.
In addition to the pure refinancing positions, this business line also has a portfolio of securities classified as
AFS (available-for-sale), which are held mainly for use in the event of a liquidity crisis.
III.3.3.1.2 - Commercial
The sales teams working out of Paris or within the regional banks use a wide range of standardized tools and
products. A dedicated technical desk responsible for designing, match funding and reversing positions
(“CAR”) aims to optimize prices, preserve commercial margins and reverse positions on exchange rate and
interest rate instruments.
The business also involves the sale of investment products such as Libre Arbitre and Stork (resulting directly
from the expertise of the Fixed Income, Equity and Credit products business line), which are aimed at
institutional, corporate and retail customers of CM-CIC’s various networks.
III.3.3.1.3 - Fixed Income, Equity and Credit
This business line is organized around desks specialized in investments in equities, hybrid instruments,
spreads and fixed income products. These activities mainly involve purchases and sales of financial
securities acquired with the intention of holding them for a long period of time, as well as trading in related
financial instruments. These activities are called upon to create value in a disciplined risk environment, to
drive commercial development and to provide expertise or services to other Group entities.
III.3.3.2 - Internal control structures
In 2013, the internal control function continued to improve its organization and monitoring methodologies. It
continued to refine its procedures to take into account a unified system of limits incorporating the market
activities of the branches and to present the CRD3 regulatory changes, in particular stressed VaR and IRC as
well as risk measurement in VaR/stress-tests, as part of the “market risk internal model” project, and
regulatory risk measurement (CAD and European Capital Adequacy under Basel 2.5 standards).
2013 featured a follow-up of the recommendations issued by the French Prudential Supervision and
Resolution Authority (L’Autorité de Contrôle Prudentiel et de Résolution – ACPR) following its general
review of the Fixed Income-Equity-Credit business line.
62
All methodologies are formalized in a “body of rules”. Regular updates throughout the year include the
introduction of new products and the improvement of the monitoring of risk measurement, with a complete
formal validation at least once a year.
Capital markets activities are organized as follows:
- they are under the responsibility of a member of Executive Management;
- the front-office units that execute transactions are segregated from those responsible for monitoring
risks and results (control function) and from those in charge of transaction validation, settlement and
recording (back-office function);
- internal control teams operate under the responsibility of the Group’s risk division, which compiles
management reports summarizing risk exposures and has the Boards of Directors of CIC and BFCM
validate the level of capital allocated/consumed;
- the permanent controls system is based on first-level controls performed by three control teams:
the risks and results team validates production, monitors results on a daily basis and ensures
compliance with limits,
a team in charge of accounting and regulatory issues is responsible for reconciling accounting
and economic results, for providing oversight on regulatory matters, and the control of
operational risks,
a CM-CIC Marchés team covering legal compliance is responsible for first-level legal issues;
- second-level controls organized around:
capital markets business lines’ permanent controls function (CPMM), which reports to the
permanent control department, supervises first-level permanent controls carried out by CM-CIC
Marchés and conducts its own direct controls on activities,
CIC’s lending department, which monitors at-risk outstanding for each counterparty group,
CIC’s legal and tax department, which works with the CM-CIC Marchés legal team,
CIC’s finance department, which supervises accounting procedures and templates and is
responsible for accounting and regulatory controls;
- the CM11-CIC Group’s periodic controls team, which uses a team of specialist auditors to carry out
periodic controls and compliance checks in respect of capital markets activities.
A Market Risk Committee that meets monthly is responsible for monitoring the strategy, results and risks of
CMCIC Marchés (in France and in the branches) in relation to the limits prescribed by the Boards of
Directors of CIC and BFCM. It is chaired by the member of Executive Management in charge of CM-CIC
Marchés and comprises the Chief Operating Officer of CIC and BFCM, the front office, post-market, back
office and accounting and regulatory control managers, and the manager of the risk department and the
Group permanent control department. It approves the operational limits established in connection with the
general limits set by the Boards of Directors of CIC and BFCM, which are regularly informed of the risks
and results of these activities. The Market Risk Committee also approves the general principles of the
“market risk internal model”.
III.3.3.3 - Risk management*
The system used to set exposure limits for market risk is based on:
- an overall limit for regulatory capital (CAD/European capital adequacy), broken down by desk, and for
VaR;
- internal rules and scenarios (CAD risks, historical VaR and stress tests), which convert exposures into
potential losses.
The limits system covers various types of market risk (interest rate, currency, equity and counterparty risks).
The aggregate limit is broken down into sub-limits for each type of risk for each activity.
If the overall limit and/or the limit assigned to each business line is exceeded, the Group risk department is
responsible for monitoring and managing the excess exposure.
Risks are monitored based on first-tier indicators such as sensitivity to various market risk factors (mainly
for traders), and second-tier indicators such as potential losses, to provide decision-makers with an accessible
overview of capital markets exposures.
63
The capital allocated for the Fixed Income, Equity and Credit and commercial business lines, which had
remained stable from 2010 to 2012, was reduced in 2013. VaR amounted to €4.1 million at the end of 2013.
For 2014, the limits set for these activities have been kept at the same levels as in 2013. In addition, the
group has put in place the calculation of a capital allocation for the credit valuation adjustment (CVA)
charge.
The capital consumed by the RMBS business conducted in the New York branch continued to fall in line
with the amortization and sale of the portfolio securities managed on a run-off basis. Trading activities are
maintained within reduced limits under the supervision of CM-CIC Marchés.
CM-CIC Marchés’ overnight treasury position must not exceed a certain limit with an intermediate warning
limit, the two limits being set by the department and approved by the Boards of Directors of CIC and BFCM.
The refinancing period for portfolio assets is also subject to monitoring and limits.
The principal trading desk risks are as follows:
1 - Refinancing:
BFCM’s market risks mainly relate to the liquidity portfolio. They are calculated based on the CAD and
European Capital Adequacy requirement. In 2013, the overall consumption of risk capital rose from €80
million to €87 million with a peak of €104 million. This change was attributable to an increase in CAD in
respect of General Interest Rate Risk, partly offset by a drop in European Capital Adequacy requirements
(as a result of the maturing of banking portfolio transactions).
2 - Hybrid instruments:
Consumption of risk capital, which remained stable throughout the year, averaged €58 million in 2013.
The stock of convertible bonds amounted to €1.7 billion at the end of the year, down from €2.1 billion at
the end of 2012.
3 - Credit:
These positions correspond to either securities/CDS arbitrage or to credit correlation positions
(Itraxx/CDX tranches) or asset-backed securities. On the credit arbitrage portfolio, consumption of risk
capital averaged around €29 million and ended the year at €34.6 million following the liquidation of
CDS/Itraxx. On the ABS portfolio, consumption of risk capital started the year at €107.3 million before
falling to €44 million in June and ending the year at €46.4 million. This decrease reflected careful
management of risks on peripheral countries throughout the year and a reduction in positions on these
countries. With respect to the credit correlation business, based exclusively on iTraxx/CDX tranches,
consumption of risk capital stayed at around €10 million throughout the year before rising to €16.3
million at the end of the year.
4 - Mergers and Acquisitions (M&A) and other:
Consumption of risk capital was €25 million on average in 2013 and ended the year at €17.9 million. This
fall followed the trend in outstandings and the removal of corporate actions from M&A. Outstandings in
respect of this activity therefore totaled €155 million in December 2013 compared with €166 million at
the end of 2012.
5 - Fixed income:
The positions relate to directional and yield-curve arbitrage, typically with underlying government
securities, mostly European. Positions on peripheral countries are very limited. The position on Italy was
reduced by 35% to around €2 billion in 2012 and remained at this level in 2013, with the bulk of this
outstanding amount maturing in September 2014. The total amount of government securities was down
from €5.8 billion at the end of 2012 to €4.5 billion at the end of 2013, of which €2.1 billion related to
France.
III.3.3.4 - Credit derivatives
These products are used by CM-CIC Marchés and are recognized in its trading portfolio.
Trading desks are subject to exposure limits by issuer or counterparty for all types of products. Outstanding
amounts are monitored on a daily basis and exposure limits are reviewed periodically by the Lending
Committees and Capital Markets Risk Committees.
64
III.3.4 - Capital adequacy ratio*
Under Article 4.1 of CRBF regulation 2000-03, the following subsidiaries are exempt from monitoring on an
individual or sub-consolidated basis: BFCM, Crédit Mutuel - CIC Home Loan SFH and CIC Iberbanco. The
other regulated entities are subject to monitoring on an individual or sub-consolidated basis.
The information on the CM11-CIC group’s solvency ratio risks is presented in the chapter “Information on
Basel II pillar 3”.
III.3.5 - Operational risk*
In the context of the Basel II capital adequacy regulations, the Crédit Mutuel-CIC Group has implemented a
comprehensive operational risk management system under the responsibility of senior management. Groupwide guidelines describe the risks concerned and the quantitative evaluation methods to be used.
The Group has an overall operational risk management function that is clearly identified and split in practice
between the national function and the regional functions. This function covers operational risk, disaster
recovery plans and insurance taken out to cover these risks.
The system used to measure and monitor operational risk is based on a common platform applied throughout
the Crédit Mutuel-CIC Group using an approach for identifying and modeling risks so as to calculate the
level of capital required to be held in respect of operational risk.
Since January 1, 2010, Crédit Mutuel-CIC has been authorized to use its advanced measurement approach to
calculate its capital adequacy requirements in respect of operational risk. This authorization has been
extended to Banque de Luxembourg with effect from September 30, 2013.
Since June 30, 2012, the Group has also had authorization to deduct expected losses from its capital
adequacy requirement and to take into account insurance, for the consolidated group excluding the foreign
subsidiaries, Cofidis and Banque Casino.
III.3.5.1 - Main objectives
The operational risk management policy set up by the Group is designed:
- to contribute to the group’s effective management by controlling risks and the associated costs;
- from a human perspective, to protect staff, develop responsibility, autonomy and control, and capitalize
on expertise group-wide;
- from an economic standpoint, to protect margins by effectively managing risk across all activities,
ensure returns on the investments made to achieve compliance with banking regulations, optimize
capital allocated in respect of risk and adapt insurance policies to the risks identified;
- from a regulatory standpoint, to respond effectively to Basel II capital requirements and supervisory
authorities, develop a reliable system of internal control (CRBF 97.02), optimize disaster recovery plans
for mission-critical operations and adapt financial reporting (Third Pillar of Basel II).
III.3.5.2 - Role and position of the management function
The national operational risk management function coordinates and consolidates the entire procedure
through deploying a dedicated team and also assists the operational risk managers in the regional groups.
The regional operational risk management function implements the risk management procedure and verifies
that it is consistent with the national risk management policy. It is coordinated by the regional operational
risk manager.
III.3.5.3 - Measurement and control procedure
For modeling purposes, the Group relies mainly on the national database of internal losses, based on an
external database and on scenarios developed within the context of mappings and statistical work, performed
in accordance with common procedures and regulatory requirements.
Risk maps broken down by business line and by risk type and objects have been drawn up for all activities,
with probability-based models culled from the work of outside experts. These are validated by the
Operational Risk Technical Committee. Capital adequacy requirements are calculated at national level and
are then split at regional level.
Operational risk mitigation techniques include:
65
- preventive actions identified during the mapping process and implemented directly by operational or
permanent control staff;
- safeguard initiatives, which focus on the widespread implementation of disaster recovery plans, logistics
and IT solutions for all mission-critical operations in order to limit the severity of any incident in the
event of a crisis.
A consistent crisis management process, linked to the system for interbank operations, covers crisis
communication and the three phases of disaster recovery plans: emergency, business continuity and back-ontrack plans.
III.3.5.4 - Reporting and general oversight
The Group monitors the application of the operational risk management policy and risk profile using key
indicators, thresholds and warnings covering the assessment of potential risks, changes in loss experience
and the effectiveness of risk-reduction and financing measures. The Group’s executive and governance
bodies are regularly provided with information on this risk data, including the requirements of CRBF 97-02.
III.3.5.5 - Documentation and procedures
The Group consistently applies a set of procedures that are approved by the managing bodies and are
regularly updated, covering:
- governance: procedures dealing with the roles and responsibilities of the various managing, decisionmaking and supervisory bodies, and of the national function, the frequency and recipients of reports, the
scope for the monitoring of Group entities, and the methodology for the consolidation of subsidiaries;
- collection of loss data: procedures laying down the rules for collecting information and controlling
internal losses;
- measurement system: procedures concerning, in particular, probabilistic modeling and modeling based
on the work of experts, the rules for gathering Key Risk Indicators (KRI), the basis for the allocation of
capital adequacy requirements and COREP reports.
III.3.5.6 - Disaster recovery plans
Disaster recovery plans are part of the back-up measures put in place by the Group to limit any losses
resulting from operational risk.
“Disaster recovery plan guidelines”, which are the Crédit Mutuel-CIC Group reference document in this
field, may be consulted by all teams concerned and are applied at the level of the regional groups.
Plans are classified into two categories:
- business-specific disaster recovery plans relate to a given banking function that is associated with one of
the business lines identified in accordance with Basel II;
- cross-functional disaster recovery plans relate to activities that constitute business support services
(logistics, HR and IT issues).
Plans can be split into three components:
- emergency plan: this is triggered immediately and involves measures designed to handle emergencies
and institute solutions for operating in a weakened environment;
- business continuity plan: this involves resuming business under adverse conditions in accordance with
predefined procedures;
- back-on-track plan: this is prepared shortly after the business continuity plan kicks in.
III.3.5.7 - Crisis management and its organization
Crisis management procedures at Group level and at regional level cover the most efficient organization and
communications systems for handling these three phases: emergency, business continuity and back-on-track.
These procedures are based on:
66
- a Crisis Committee, chaired by the CEO of the bank at regional level or by the Group CEO at national
level, that takes the key decisions, prioritizes action plans and handles the internal and external reporting
of events; a crisis unit that pools information, implements the decisions and provides follow-up;
- a crisis liaison team for each business line, responsible for coordinating operations on the ground
together with the crisis unit.
- the main focus of the team’s work is implementing a disaster recovery plan until the situation returns to
normal.
III.3.5.8 - Insurance deducted from equity
Operational risk financing programs are reviewed as and when the results of the assessments of net risks are
available, after the application of risk-mitigation techniques, and are based on the following principles:
- insuring severe or major risks that can be insured, and developing self-insurance for the Group for
amounts lower than deductibles and for intra-group risks;
- insuring frequency risks when justified or self-insuring them through provisions in the operating
account;
- severe non-insurable risks and the non-insured balance are covered by prudential equity reserves;
- major risks arising from interbank exchange and payment systems are covered by liquidity reserves set
up and allocated on an individual system basis.
The Group is insured against damage to property and has overall insurance for banking risks, fraud, and
professional third-party liability, which it intends to use in order to reduce consumption of regulatory equity
for operational risks.
III.3.5.9 - Training
Each year, the Group provides operational risk training for the network managers, internal auditors and the
operational staff responsible for monitoring these risks.
III.3.5.10 - BFCM Group’s operational risk loss experience
In 2013, total operational losses amounted to €80.8 million, including €67.2 million of actual losses and
€43.9 million of net reversals of provisions in respect of prior-year losses.
This total breaks down as follows:
- fraud: €41.6 million;
- industrial relations: €2.2 million.
- human/procedural error: €11.9 million;
- legal risk: €22.1 million.
- natural disasters and system malfunctions: €3 million.
III.3.6 - Other risks
III.3.6.1 - Legal risks
Legal risks are incorporated into operational risks and concern, among other things, exposure to fines,
penalties and damages attributable to faults by the business in respect of its operations.
III.3.6.2 - Industrial and environmental risks
Industrial and environmental risks are included in operational risks and are analyzed from the perspective of
system malfunctions and the occurrence of natural disasters (100-year events, floods, earthquakes, pollution,
etc.), their impact on the business and means of prevention and protection to be put in place, notably crisis
management and disaster recovery plans.
67
III.4 - Risks related to the group and to the banking activity
The Group is subject to several categories of risks inherent in banking activities.
There are four main categories of risks inherent in the Group's activities, which are summarized below. The
risk factors that follow elaborate on or give specific examples of these different types of risks, and describe
certain additional risks faced by the Group.
■ Credit risk
Credit risk is the risk of financial loss relating to the failure of a counterparty to honor its contractual
obligations. The counterparty may be a bank, a financial institution, an industrial or commercial enterprise, a
government and its various entities, an investment fund, or a natural person. Credit risk arises in lending
activities and also in various other activities where the Group is exposed to the risk of counterparty default,
such as its trading, capital markets, derivatives and settlement activities. With respect to home loans, the
degree of credit risk also depends on the value of the home that secures the relevant loan. Credit risk also
arises in connection with the factoring businesses of the Group, although the risk relates to the credit of the
counterparty's customers, rather than the counterparty itself.
■ Market and liquidity risk
Market risk is the risk to earnings that arises primarily from adverse movements of market parameters. These
parameters include, but are not limited to, foreign exchange rates, bond prices and interest rates, securities
and commodities prices, derivatives prices, credit spreads on financial instruments and prices of other assets
such as real estate.
Liquidity is also an important component of market risk. In instances of little or no liquidity, a market
instrument or transferable asset may not be negotiable at its estimated value (as has been the case for some
categories of assets in the recent disrupted market environment). A lack of liquidity can arise due to
diminished access to capital markets, unforeseen cash or capital requirements or legal restrictions.
Market risk arises on the Group’s trading portfolios and non-trading portfolios. In non-trading portfolios, it
encompasses:
-
the risk associated with asset and liability management, which is the risk to earnings arising from
asset and liability mismatches in the banking book or in the insurance business. This risk arises
mainly from interest rate risk;
-
the risk associated with investment activities, which is directly connected to changes in the value of
invested assets within securities portfolios, which can be recorded either in the income statement or
directly in shareholders' equity; and
-
the risk associated with certain other activities, such as real estate, which is indirectly affected by
changes in the value of negotiable assets held in the normal course of business.
■ Operational risk
Operational risk is the risk of losses due to inadequate or failed internal processes, or due to external events,
whether deliberate, accidental or natural occurrences. Internal processes include, but are not limited to,
human resources, information systems, risk management and internal controls (including fraud prevention).
External events include, for example, floods, fires, storms, earthquakes and terrorist attacks.
■ Insurance risk
Insurance risk is the risk to earnings due to mismatches between expected and actual claims. Depending on
the insurance product, this risk is influenced by macroeconomic changes, changes in customer behavior,
changes in public health policies, pandemics, accidents and catastrophic events (such as earthquakes, storms,
industrial disasters, or acts of terrorism or war).
Difficult market and economic conditions could have a material adverse effect on the operating
environment for financial institutions and accordingly, on the Group’s financial situation and earnings.
The Group’s businesses are sensitive to changes in financial markets and economic conditions generally in
France, Europe and elsewhere around the world. The Group could be confronted with a significant
deterioration of market and economic conditions resulting from, among other things, crises affecting
sovereign debt, capital, credit or liquidity markets, regional or global recessions, sharp fluctuations in
commodity prices, currency exchange rates or interest rates, inflation or deflation, or adverse geopolitical
68
events (such as natural disasters, acts of terrorism or military conflicts). Market disruptions and sharp
economic downturns, which may develop quickly and whose impact may therefore not be fully hedged,
could affect the operating environment for financial institutions for short or extended periods and have a
material adverse effect on the Group’s financial position, earnings and cost of risk.
The European markets have recently experienced significant disruptions as a result of concerns regarding the
ability of certain countries in the eurozone to refinance their debt obligations and the extent to which
European Union member states will be willing or able to provide financial support to the affected sovereign
debtors. These disruptions have contributed to increased volatility in the exchange rate of the euro against
other major currencies, affected the levels of stock market indices and created uncertainty regarding the nearterm economic prospects of certain countries in the European Union as well as the quality of debt obligations
of sovereign debtors in the European Union. The financial markets have recently been and could continue to
be highly volatile.
The Group holds sovereign debt issued by some of the countries that have been most severely affected by the
current crisis, and it has recorded significant impairment charges in respect of its holdings of Greek
sovereign debt. See “Management Report – European Sovereign Debt Exposure” for more detail on the
Group’s exposure to European sovereign debt. The Group is also active in the interbank financial market and
as a result, is indirectly exposed to risks relating to the sovereign debt held by the financial institutions with
which it does business. In addition, the current uncertainty regarding sovereign obligations of some
European countries has had, and may continue to have, an indirect impact on financial markets in Europe and
worldwide, and therefore on the environment in which the Group operates.
Besides these direct impacts, the Group has been indirectly affected by the spread of the euro-zone crisis,
which has affected most countries in the euro zone, including France, the Group’s home market. The credit
ratings of French sovereign debts were downgraded in 2011, resulting mechanically in a rating downgrade of
French commercial banks, including BFCM.
In addition, market perception of the impact of the European crisis on French banks has made certain
participants, such as U.S. money market funds, less willing to finance French banks than they were in the
past, affecting the access of French banks, including that of the Group, to liquidity, particularly in U.S.
dollars. This situation has eased somewhat as the European Central Bank has provided significant amounts of
liquidity to the market, but there can be no assurance that the adverse market environment will not return.
If economic or market conditions in France or elsewhere in Europe were to deteriorate further, particularly in
the context of an exacerbation of the sovereign debt crisis (such as a sovereign default or the impression that
a member state might withdraw from the euro), the markets in which the Group operates could be more
significantly disrupted, and the Group’s business, results and financial position could be adversely affected.
Legislative action and regulatory measures in response to the global financial crisis may materially
impact the Group and the financial and economic environments in which it operates.
Legislation and regulations have recently been enacted or proposed to introduce a number of changes, some
permanent, in the global financial environment. While the aim of these new measures is to avoid a recurrence
of the financial crisis, their impact could be to change substantially the environment in which the Group and
other financial institutions operate.
The new measures that have been or may be adopted include more stringent capital and liquidity
requirements, taxes on financial transactions, limits and rules for employee compensation over specified
levels, limits on the types of activities that commercial banks can undertake (particularly proprietary trading
and investment and ownership in private equity funds and hedge funds) or new ring-fencing requirements
relating to certain activities, restrictions on certain types of financial activities or products such as
derivatives, mandatory writedown or conversion into equity of certain debt instruments, enhanced recovery
and resolution regimes, and the creation of new and strengthened regulatory bodies. Some of the new
measures are proposals that are under discussion and that are subject to revision and interpretation, and need
adapting to each country’s framework by the national regulators.
As the result of some of these measures, the Group has had to significantly adjust, and may have to continue
to adjust, some of its activities to enable the Group to comply with the new requirements. Moreover, the
general political environment has evolved unfavorably for banks and the financial industry, resulting in
greater pressure from legislative and regulatory bodies to adopt more stringent regulatory measures, even
69
though these measures could have adverse consequences on lending and other financial activities, and on the
economy. Given the continuing uncertainty regarding the new legislative and regulatory measures, it is not
possible to foresee their impact on the Group.
The Group’s activities are highly concentrated in France, exposing the Group to risks linked to a potential
downturn in French economic conditions.
The French market represents the largest share of the Group’s net banking income and assets. In 2012,
France accounted for approximately 83% of the Group’s net banking income and approximately 84.2% of its
customer credit risk (including loans to customers and off-balance sheet liabilities such as credit lines and
guarantees).
Because of the concentration of the Group’s business in France, a significant deterioration in French
economic conditions would have a greater impact on the Group’s results of operations and financial
condition than would be the case for a Group with more internationally diversified activities. An economic
downturn in France could impact the credit quality of the Group’s individual and business customers, make it
more difficult for the Group to identify customers for new business that meet its credit criteria, and affect fee
income by reducing life insurance policy sales, assets under management or brokerage activities. In addition,
if house prices in France were to be significantly affected by adverse economic conditions, the Group’s home
loan activities and portfolio (which represented approximately 53% of the Group’s total portfolio of
performing loans, excluding accrued interest, at December 31, 2012) could be significantly and adversely
affected.
BFCM must maintain high credit ratings, or the Group’s business and profitability could be adversely
affected.
Credit ratings are important to BFCM’s liquidity, and therefore that of the Group. A rating downgrade could
have a negative impact on BFCM’s liquidity and competitive position, increase borrowing costs, limit access
to the capital markets or trigger obligations under certain bilateral provisions in some derivatives contracts of
the Group’s financing and market segment (CM-CIC Marchés). On July 18, 2013, Fitch Ratings confirmed
BFCM’s A+ rating and, on July 24, 2013, Moody’s Investors Service confirmed BFCM’s Aa3 rating.
The cost of BFCM’s long-term unsecured funding is directly related to its credit spread (the difference in the
interest paid on its bonds and that paid on government bonds with the same maturity), which in turn depends
in large part on its credit rating, which is itself correlated to the sovereign risk rating. Increases in credit
spreads can significantly increase BFCM’s cost of funding. Changes in credit spreads are continuous,
market-driven, and subject at times to unpredictable and highly volatile movements. Credit spreads are also
influenced by market perception of the issuer’s solvency. Credit spreads may also be influenced by
movements in the cost to purchasers of credit default swaps referenced to BFCM’s debt obligations, which is
influenced both by the credit quality of those obligations, and by a number of market factors that are beyond
the control of BFCM and the Group.
Despite the risk management policies, procedures and methods implemented, the Group may be exposed
to unidentified or unforeseen risks that could lead to material losses.
The Group has devoted significant resources to developing its risk management policies, procedures and
measurement methods and intends to continue to do so in the future. Nonetheless, the Group's risk
management techniques and strategies may not be fully effective in limiting its risk exposure in all economic
market environments or against all types of risk, including risks that the Group fails to identify or foresee.
Some of the Group's qualitative tools and metrics for managing risk are based on use of observed historical
market behavior. The Group then analyses the observed data, using statistical methods, to quantify its risk
exposure. The Group uses complex and subjective analysis based on projected economic conditions and their
impact on borrowers’ capacity to repay and the value of the assets to measure the losses linked to credit risk
exposure and to assess the value of certain assets. During periods of market turbulence, such analysis could
result in inaccurate estimates and call into question the reliability of these evaluation procedures.
These tools and metrics may fail to predict future risk exposures. These risk exposures could, for example,
arise from factors the Group did not anticipate or correctly evaluate in its statistical models. This would limit
the Group's ability to manage its risks and could affect its results.
Like all financial institutions, the Group is subject to the risk of non-compliance with its risk management
policies and procedures, either through human error or malicious intent. In recent years, several financial
70
institutions have suffered significant losses from unauthorized market activities conducted by employees.
While the Group makes every effort to monitor compliance with its risk management policies and
procedures, it is impossible to be certain that its monitoring will be effective in avoiding losses from
unauthorized activities.
Given the international scope of its activities, the Group may be vulnerable to specific political,
macroeconomic and financial environments or specific situations in the countries where it operates.
The Group is subject to country risk, meaning the risk that economic, financial, political or social conditions
in a foreign country will affect the Group's financial interests.
The Group’s country risk measurement and monitoring system is based on a proprietary scoring method. The
internal score assigned to countries is based on the structural solidity of their economies, their repayment
capacity, governance and political stability.
While the Group’s relatively limited international activities reduce its exposure to country risk compared
with financial institutions that are more active internationally, the Group nonetheless has substantial business
activities and affiliates in Spain, Italy, Eastern Europe and North Africa that could expose it to significant
risks. The Group monitors country risk and takes it into account in the provisions recorded in its financial
statements. However, a significant change in a country’s political or macroeconomic environments may
require the Group to record additional provisions or lead it to incur losses in amounts that exceed the current
provisions.
The Group is subject to numerous supervisory and regulatory regimes, which may change.
Several regulatory and supervisory regimes apply to the Group and its subsidiaries in France and in each of
the other countries in which it operates. See “Government Supervision and Regulation in France” for a
detailed description of some of the aspects of the French regulatory system applicable to the Group. Noncompliance could lead to significant intervention by regulatory authorities as well as fines, public reprimand,
enforced suspension of operations or, in extreme cases, withdrawal of authorization to operate. The financial
services industry has come under increased scrutiny from a variety of regulators in recent years, with
increases in the penalties and fines sought by regulatory authorities, a trend that may accelerate in the current
financial environment.
In addition, the policies and actions of regulatory authorities in France, other European Union or foreign
governments and international agencies could have a very adverse impact on the businesses and earnings of
Group entities. Such constraints could limit the ability of Group entities to expand their businesses or to
pursue certain activities. The nature and impact of future changes in such policies and regulatory actions are
unpredictable and beyond the Group’s control. Such changes could concern, among others, the following:
- the monetary, interest rate and other policies of central banks and regulators;
- general changes in government or regulatory policy that may significantly influence investor
decisions, particularly in the markets in which the Group operates;
- general changes in regulatory requirements, for example, prudential rules relating to capital
adequacy, such as the regulations implementing Basel III/CRD IV requirements;
- implementation of the bail-in directive, during safeguard or resolution procedures;
- changes in rules and procedures relating to internal controls;
- changes in financial reporting rules;
- changes in tax law or its application;
- changes in accounting standards;
- limitations on employee compensation;
- expropriation, nationalization, price controls, exchange controls, confiscation of assets and changes
in legislation relating to foreign ownership; and
- any adverse change in political, military or diplomatic conditions creating social instability or an
uncertain legal situation capable of affecting demand for the products and services offered by the
Group;
- the measures that were recently adopted and have or are likely to have an impact on the Group,
include in particular (i) the French ordinance of 27 June 2013 relating to credit institutions and
financing companies (Sociétés de financement) which came into force on 1 January 2014 and the
French banking law of 26 July 2013 on the separation and regulation of banking activities,
introducing a separation of proprietary trading transactions from the wholesale business of the credit
71
-
institutions which is useful to finance the economy, which also creates a waterfall to allocate by
priority losses to stakeholders and senior creditors, and which empowers the ACPR with wide
powers of intervention, such as removing the management or transfering all or part of the business or
assets, (ii) the ordinance of 20 February 2014 adapting French law to European Union law with
respect to financials matters, the EU Directive and Regulation on prudential requirements, together
the ‘’CRD IV’’ package of 26 June 2013 and many of whose provisions are applicable since 1
January 2014, the proposal of technical regulatory and execution rules pertaining to CRD IV
package developed by the EBA, (iii) consultation on structural reform in banking sector in the
European Union in 2013 and the proposal from the European Commission structural reform of the
European banking sector of 29 January 2014, (iv) the European Single Supervisory Mechanism, the
European Single Resolution Mechanism and the EU Bank Recovery and Resolution Directive;
the European Central Bank (“ECB”) is in the process of performing a comprehensive assessment of
the Group and other European banks, the outcome of which is uncertain.
The ECB announced in October 2013 that it would commence a comprehensive assessment,
including stress tests and an asset quality review, of certain large European banks, including the
Group. The findings from this assessment, expected to be published in November 2014, may result
in recommendations for additional supervisory measures and corrective actions affecting the Group
and the banking environment generally. It is not yet possible to assess the impact of such measures,
if any, on the Group or on the treatment of capital instruments. Furthermore, the disclosure of the
ECB’s findings or the implementation of additional supervisory measures that are viewed by the
market as unfavourable to the Group could adversely affect the trading price of the securities issued
by the Group.
BFCM and the Group are governed by a substantial and fluctuating body of regulations in the countries and
regions where it operates, thereby exposing it to a risk of regulatory non-compliance. The risk of noncompliance relates to inability to comply fully with all the rules governing financial and banking activities,
whether legislative or regulatory, professional standards and ethics, instructions or rules of professional
conduct. This risk is exacerbated by the adoption by different countries of multiple and sometimes
contradictory legal and regulatory requirements.
The Group has a dedicated system for measuring these risks and their potential impact (financial losses and
legal, administrative or disciplinary penalties) with the aim of safeguarding the Group’s reputation.
The Group faces significant competition.
The Group faces intense competition in all its main businesses. The French and European financial services
markets are relatively mature, and demand for financial services is, to some extent, linked to overall
economic development. Competition in this environment is based on many factors, particularly the products
and services offered, pricing, distribution systems, customer service, brand recognition, perceived financial
strength and the willingness to use capital to serve client needs. Some of the Group’s competitors in France
are larger and have greater resources than the Group, and they may have a stronger name in some areas of
France. The Group’s international subsidiaries also face significant competition from banks and financial
institutions that have their head offices in the countries where they operate, as well as other international
financial institutions that are active in those countries. If the Group is unable to respond to the competitive
environment in France or in its other markets with attractive and profitable product and service offerings, it
may lose market share in important areas of its business or incur losses on some or all of its activities. In
addition, downturns in the global economy or in the economy of the Group’s major markets could add to the
competitive pressure, through, for example, increased price pressure and lower business volumes for the
Group and its competitors.
Market downturns may lead to lower revenues from life insurance, brokerage, asset management and
other commission- and fee-based businesses.
The recent market slowdown led to a decline in transaction volumes and slower growth of mutual funds, life
insurance and similar products. These transactions and products generate commission income for the Group,
which was adversely affected by the slowdown in these areas during the financial crisis. In addition, because
the fees that the Group charges for the management of its customers’ portfolios are in many cases based on
the value or performance of those portfolios, the market downturn reduced the value of the managed
72
portfolios, and accordingly, the revenues generated by the Group’s asset management and private banking
businesses. Future downturns could have similar effects on the Group's results and financial position.
Even in the absence of a market downturn, any underperformance by the Group’s mutual funds and life
insurance products may result in increased withdrawals and reduced inflows, which would reduce the
revenues the Group receives from its asset management and insurance businesses.
The financial weakness and conduct of other financial institutions and market participants could
adversely affect the Group.
The Group’s ability to engage in funding, investment and derivative transactions could be adversely affected
by the weakness of other financial institutions or market participants. Financial services institutions are
interrelated as a result of trading, clearing, counterparty, funding or other relationships. As a result, default
by, or even rumors or questions about the solvency of one or more financial services institutions, or a loss of
confidence in the financial services industry generally, may lead to market-wide liquidity problems and could
lead to further losses or defaults. The Group has exposure to many counterparties in the financial industry,
directly and indirectly, including brokers and dealers, commercial banks, investment banks, mutual and
hedge funds, and other institutional clients with which it regularly executes transactions. Many of these
transactions expose the Group to credit risk in the event of default. In addition, this risk could be exacerbated
if the collateral it holds cannot be realized or is liquidated at prices that are not sufficient to cover the full
amount of the loan or derivative exposure.
Protracted market declines can reduce liquidity in the markets, making it harder to sell assets and possibly
leading to material losses.
In some of the Group's businesses, prolonged market movements, particularly price falls, may reduce activity
in the market or reduce its liquidity. These developments can lead to material losses if the Group cannot
close out deteriorating positions in a timely way. This may be the case in particular for assets the Group
holds for which there are not very liquid markets to begin with. Assets that are not traded on stock exchanges
or other public markets, such as derivatives contracts between banks, may have values that the Group
calculates using internal models rather than market prices. Monitoring the deterioration in the price of assets
like these is difficult and could lead to losses that the Group did not anticipate.
For investment purposes, the Group takes positions in the debt, foreign exchange and equity markets as well
as in unlisted equities, real-estate assets and other types of assets. Price volatility, i.e. the breadth of price
swings over a given period or in a given market, independently of the level of the market, could have a
negative impact on these positions. If the volatility proved lower or higher than expected by the Group, this
could result in losses on many other products used by the Group, such as derivatives.
Any significant interest rate change could have a negative impact on the Group's net banking income or
profitability.
The amount of net interest income earned by the Group during any given period significantly affects its
overall net banking income and profitability for that period. Interest rates are highly sensitive to many factors
beyond the Group's control. Changes in market interest rates could affect the interest rates charged on
interest-earning assets and the interest rates paid on interest-bearing liabilities differently. Any adverse
change in the yield curve could cause a decline in the Group's net interest income from its lending activities.
In addition, increases in the interest rates at which short-term funding is available and maturity mismatches
may have a negative impact on the Group's profitability.
A substantial increase in net additions to impairment provisions or a shortfall in the level of previously
recorded impairment provisions could adversely affect the Group's results and financial position.
In the context of its lending activities, the Group periodically allocates amounts to provisions for nonperforming loans, which are recorded in its income statement under net additions to provisions for loan
losses. The Group's overall level of provisioning is based upon its assessment of prior loss experience, the
volume and type of lending, industry standards, past due loans, economic conditions and other factors
reflecting the recovery rates for the various loans.
Although the Group seeks to establish an appropriate level of provisions, its lending businesses may have to
increase their provisions for loan losses in the future as a result of increases in non-performing loans or for
73
other reasons, such as deteriorating market conditions such as occurred in 2008 and 2009 or factors affecting
specific countries, such as Greece. Any significant increase in provisioning charges for loan losses or a
significant change in the Group's estimate of the risk of loss inherent in its portfolio of non-impaired loans,
as well as the occurrence of loan losses in excess of the provisions set aside, could have an adverse effect on
the Group's earnings and financial position.
The Group's hedging strategies do not rule out the risk of loss.
If any of the variety of instruments and strategies that the Group uses to hedge its exposure to various types
of risk in its businesses is not effective, the Group may incur losses. Many of its strategies are based on
historical trading patterns and correlations. For example, if the Group holds a long position in an asset, it
may hedge that position by taking a short position in an asset where the short position has historically moved
in a direction that would offset a change in the value of the long position. However, the Group may only be
partially hedged, or these strategies may not be fully effective in mitigating the Group's risk exposure in all
market environments or against all types of risk in the future. Unexpected market developments may also
affect the Group's hedging strategies. In addition, the manner in which gains and losses resulting from certain
ineffective hedges are recorded may result in additional volatility in the Group's reported earnings.
The Group's ability to attract and retain qualified employees is critical to the success of its business and
failure to do so may materially affect its performance.
The Group's employees are one of its most essential resources and, in many areas of the financial services
industry, competition for qualified personnel is intense. The results of the Group depend on its ability to
attract new employees and to retain and motivate its existing employees. The Group's ability to attract and
retain qualified employees could potentially be impaired by enacted or proposed legislative and regulatory
restrictions on employee compensation in the financial services industry. Changes in the business
environment may lead the Group to move employees from one business to another or to reduce the number
of employees in certain of its businesses. This may cause temporary disruptions as employees adapt to new
roles and may reduce the Group's ability to take advantage of improvements in the business environment. In
addition, current and future laws (including laws relating to immigration and outsourcing) may restrict the
Group's ability to move responsibilities or personnel from one jurisdiction to another. This may impact the
Group's ability to take advantage of business opportunities or potential efficiencies.
Future events may be different from those reflected in the management assumptions and estimates used in
the preparation of the Group's financial statements, which may cause unexpected losses in the future.
Pursuant to IFRS rules and interpretations in effect at the date of this report, the Group is required to use
certain estimates in preparing its financial statements, including accounting estimates to determine loan loss
provisions, provisions for future litigation, and the fair value of certain assets and liabilities, among other
items. Should the Group's estimates prove substantially inaccurate, or if the methods by which such values
were determined are revised in future IFRS rules or interpretations, the Group may experience unexpected
losses.
An interruption in or breach of the Group's information systems may result in lost business and other
losses.
Like most other banks, the Group relies heavily on communications and information systems to conduct its
business. Any failure or interruption or breach in security of these systems could result in failures or
interruptions in the Group's customer relationship management, general ledger, deposit, servicing and/or loan
organization systems. If the Group's information systems were to fail, even for a short period of time, it
would be unable to serve some customers' needs in a timely manner and could lose their business. Likewise,
a temporary shutdown of the Group's information systems, even though it has back-up recovery systems and
contingency plans, could result in considerable costs for information retrieval and verification. The Group
cannot provide assurances that such failures or interruptions will not occur or, if they do occur, that they will
be adequately addressed. Any such failure or interruption could have a material adverse effect on the Group's
financial position and results.
Unforeseen events could interrupt the Group’s operations and cause substantial losses and additional
costs.
74
Unforeseen events such as severe natural disasters, pandemics, terrorist attacks or other states of emergency
could lead to an abrupt interruption of operations of entities in the Group, and, to the extent not partially or
entirely covered by insurance, may cause substantial losses. Such losses can relate to property, financial
assets, trading positions and key employees. Such unforeseen events may also disrupt the Group’s
infrastructure, or that of third parties with which it conducts business, and lead to additional costs (such as
employee relocation costs) and push up existing costs (such as insurance premiums). Such events may also
make insurance cover for certain risks unavailable and thus increase the Group’s global risk.
Reputational and legal risk could have a negative impact on the Group’s profitability and business
outlook.
Various issues may give rise to reputational risk and damage the Group and its business prospects. These
issues include inappropriately dealing with potential conflicts of interest, legal and regulatory requirements,
competition issues, ethical issues, money laundering laws, information security policies and sales and trading
practices. The Group’s reputation could also be damaged by an employee’s misconduct, or fraud or
embezzlement by financial operates to which the Group is exposed, any downward revision, restatement or
correction of its reported results and any legal or regulatory proceeding whose outcome may be negative.
Any damage to the Group’s reputation might lead to a loss of business that could impact its earnings and
financial position. Failure to address these issues adequately could also give rise to additional legal risk,
which might increase the number of litigation claims and the amount of damages asserted against Group
entities, or subject Group entities to regulatory sanctions.
Risks relating to the Group's organizational structure
BFCM does not hold any ownership or financial interest in the Local Banks.
BFCM does not own any interest in the Local Banks. BFCM does not share in the profits and losses of the
Local Banks. Its economic interest in the results of the Local Banks’ operations is limited to the financing it
provides in its capacity as the Group’s central funding body. Moreover, BFCM has no voting rights or other
rights to influence the management, strategy or policies of the Local Banks. While BFCM’s management
participates actively in the determination of the Group’s overall strategy and policies, and its activities are
significantly integrated with those of the Group, this does not provide BFCM with the same legal rights that
it would have if it held an ownership interest in the Local Banks.
The Local Banks control BFCM and their interests may differ from those of investors in BFCM’s
securities.
Substantially all of BFCM’s shares are held by the Local Banks, including 93% through Caisse Fédérale de
Crédit Mutuel, or CF de CM. As a result, CF de CM and the Local Banks have the power to control the
outcome of all votes at meetings of BFCM’s shareholders, including votes on decisions such as the
appointment or approval of members of its board of directors and the distribution of dividends. The Local
Banks may have interests that are different from those of BFCM, the holders of BFCM’s debt securities and
the holders of covered bonds backed by loans to BFCM.
BFCM does not have any entitlement to financial support from the Local Banks.
The Local Banks are not under any obligation to support BFCM’s liquidity or solvency in the event such
support were needed. While BFCM’s credit ratings are based in part on the rating agencies’ assumption that
such support would be available if needed due to the central role played by BFCM in the Group’s financial
structure, this assumption is based solely on the views of the rating agencies regarding the economic interest
of the Local Banks, and not on any legal obligation. If BFCM’s financial condition were to deteriorate, there
can be no assurance that the Local Banks or CF de CM would recapitalize or otherwise provide support to
BFCM.
Banks that are not part of the Group operate under the Crédit Mutuel name in some French regions.
Of the 18 Crédit Mutuel federations operating in France, only 11 are part of the CM11-CIC Group. Banks in
the other seven federations use the Crédit Mutuel name and logo, but they operate outside the Group. Three
of these federations operate together and compete with the Group in many of its activities throughout France.
If one or more of the Crédit Mutuel federations that are outside the Group were to experience difficulties,
such as a business downturn, a deterioration in asset quality or a rating downgrade, it is possible that the
75
market would fail to understand that the federation in difficulty is not part of the Group. In such event,
difficulties experienced by a federation outside of the Group could adversely affect the reputation of the
Group and/or have an impact on the Group’s financial position and earnings
The Group’s Local Banks are part of a mutual financial support mechanism that includes all eighteen
Crédit Mutuel federations, including those that are outside the Group.
The eighteen Crédit Mutuel federations have a mutual financial support mechanism that could require the
Local Banks in the Group to provide support to local banks in federations that are outside the Group. While
the support system for a local bank would initially be implemented at the regional level, within such local
bank’s federation, if the resources available at the regional level were insufficient, then the national support
mechanism could be called upon, requiring support from other federations. While the Local Banks in the
Group also benefit from the support of the federations that are outside the Group, they remain exposed to
risks relating to local banks that are not part of the Group. (See “History and Structure of the CM11-CIC
Group – The CM11-CIC Group and the Eighteen Crédit Mutuel Federations – The Financial Solidarity
Mechanism” for a more detailed description of this mutual support mechanism).
Certain aspects of the Group’s governance are subject to decisions made by the Confédération Nationale
de Crédit Mutuel, which represents the Group as well as local banks that are not part of the Group.
Under French law, certain matters relating to the governance of the eighteen Crédit Mutuel federations
(including 11 in the Group and seven outside the Group) are determined by a central body known as the
Confédération Nationale du Crédit Mutuel (“CNCM”). The CNCM represents all local banks in the eighteen
federations in dealings with French bank regulatory and supervisory authorities. In addition, the CNCM has
the power to exercise financial, technical and administrative oversight functions relating to the organization
of the Crédit Mutuel banks, and to take steps to ensure their proper functioning, including striking a bank
from the list of banks authorized to operate as part of the Crédit Mutuel system.
76
III.5 - Consolidated financial statements of BFCM Group
Consolidated statement of financial position (IFRS) - Assets
In € millions
Dec. 31, 2013
Dec. 31, 2012
Notes
Cash and amounts due from central banks
14,778
9,429
4a
Financial assets at fair value through profit or loss
41,303
43,091
5a, 5c
Hedging derivative instruments
3,770
2,614
6a, 5c, 6c
Available-for-sale financial assets
79,133
63,570
7a, 5c
Loans and receivables due from credit institutions
55,300
70,703
4a
169,568
165,775
8a
562
852
6b
10,159
11,593
710
701
13a
Loans and receivables due from customers
Remeasurement adjustment on interest-rate risk hedged investments
Held-to-maturity financial assets
Current tax assets
Deferred tax assets
Accruals and other assets
Non-current assets held for sale
Deferred profit sharing
9
770
873
13b
12,892
17,727
14a
4
1
0
0
Investments in associates
2,196
2,079
Investment property
1,587
1,167
16
Property and equipment
1,869
1,928
17a
17b
Intangible assets
Goodwill
Total assets
941
938
4,182
4,164
399,725
397,205
15
18
Consolidated statement of financial position (IFRS) - Liabilities and
shareholders' equity
In € millions
Due to central banks
Financial liabilities at fair value through profit or loss
Hedging derivative instruments
Dec. 31, 2013
Dec. 31, 2012
Notes
460
343
30,408
30,970
5b, 5c
4b
3,814
2,763
6a, 5c, 6c
19,880
34,477
4b
145,217
134,864
8b
Debt securities
97,957
93,543
19
Remeasurement adjustment on interest-risk hedged investments
-1,252
-1,947
336
446
13a
Due to credit institutions
Due to customers
Current tax liabilities
Deferred tax liabilities
Accruals and other liabilities
Liabilities associated with non-current assets held for sale
Technical reserves of insurance companies
6b
851
805
13b
9,554
13,430
14b
0
0
66,256
62,115
20
Provisions
1,547
1,512
21
Subordinated debt
6,911
7,836
22
Shareholders' equity
17,785
16,047
Shareholders’ equity attributable to the Group
14,300
12,709
2,088
2,063
23a
10,462
9,625
23a
538
91
23c
1,211
930
3,486
3,338
399,725
397,205
- Subscribed capital and issue premiums
- Consolidated reserves
- Gains and losses recognized directly in equity
- Net income for the year
Shareholders' equity attributable to minority interests
Total liabilities and shareholders' equity
77
CONSOLIDATED INCOME STATEMENT (IFRS)
In € millions
Dec. 31, 2013
Dec. 31, 2012
Notes
Interest income
13,501
15,229
25
Interest expense
-9,261
-12,073
25
Fee and commission income
2,865
2,696
26
Fee and commission expense
-780
-753
26
Net gain (loss) on financial instruments at fair value through profit or loss
-145
886
27
342
243
28
Income from other activities
12,581
10,762
29
Expenses on other activities
-10,656
-8,831
29
Net banking income
8,445
8,159
Operating expenses
-4,918
-4,851
-280
-289
3,247
3,019
-965
-962
2,282
2,057
Net gain (loss) on available-for-sale financial assets
Depreciation, amortization and impairment of non-current assets
Gross operating income
Net additions to/reversals from provisions for loan losses
Operating income
Share of net income (loss) of associates
30a, 30b
30c
31
13
-131
15
Gains (losses) on other assets
5
12
32
Change in value of goodwill
0
-27
33
2,300
1,910
-816
-711
1,484
1,200
273
270
1,211
930
Net income before tax
Corporate income tax
Net income
Net income attributable to minority interests
Net income attributable to the Group
Earnings per share (in €)*
45.61
35.07
34
35
* Basic and diluted earnings per share were identical
Net income and gains and losses recognized directly in shareholders' equity
In € millions
Dec. 31, 2013
Net income
1,484
Dec. 31, 2012
1,200
Translation adjustments
-10
2
Remeasurement of available-for-sale financial assets
401
1,428
Remeasurement of hedging derivative instruments
75
6
Share of unrealized or deferred gains and losses of associates
19
-19
484
1,417
Total gains and losses recognized directly in equity that may be recycled to profit or loss
Remeasurement of non-current assets
Actuarial gains and losses on defined benefit plans
Notes
0
0
9
-75
9
-75
Total gains and losses recognized directly in equity that may not be recycled to profit or
loss
Net income and gains and losses recognized directly in shareholders' equity
1,976
2,541
attributable to the Group
1,658
2,099
attributable to minority interests
318
442
23c, 23d
The items relating to gains and losses recognized directly in shareholders' equity are presented net of tax effects.
78
79
0
0
0
0
0
1,329
759
10,462
-31
722
0
404
404
317
1,236
1,236
-919
-25
16
39
39
-80
2
2
-82
23
-105
0
-72
-72
-63
-63
-127
8
8
-135
and losses
Actuarial gains
Net income
1,211
1,211
1,211
-930
-930
930
930
930
-852
-852
852
35
817
the Group
attributable to
(3) Other movements include, notably, -€27 million related to correction of an error on the opening statement of financial position concerning the amortization method used to recognize discounts on RMBS debt securities (see note 7a).
(2) Adjusted to include the impact of IAS19-R
(1) Reserves at December 31, 2013 include the legal reserve of €133 million, regulatory reserves for a total of €2,056 million and other reserves amounting to €8,273 million.
Shareholders’ equity at December 31, 2013
-11
Other movements(3)
-20
-1
Sub-total
Impact of acquisitions and disposals on minority interests
-20
-11
Translation adjustments
Change in actuarial gains and losses
Change in fair value of available-for-sale financial assets
Consolidated net income for the year
-10
849
23
Sub-total: movements arising from shareholder relations
2
Change in investments in subsidiaries not resulting in loss of control
23
930
9,625
-70
2
736
Distribution of dividends
Capital increase
Appropriation of earnings from previous year
Shareholders’ equity at December 31, 2012
Other movements
1,327
3
Sub-total
Impact of acquisitions and disposals on minority interests
3
-14
54
-973
assets
-14
derivative
instruments
sale financial
adjustments
Hedging
Available-for-
Translation
- Gains and losses recognized directly in equity
Translation adjustments
Change in actuarial gains and losses
Change in fair value of available-for-sale financial assets
Consolidated net income for the year
-71
729
Sub-total: movements arising from shareholder relations
852
8,896
73
8,823
reserves (1)
Consolidated
Change in investments in subsidiaries not resulting in loss of control
2
736
736
Issue premiums
-52
2
1,325
1,325
Capital stock
Distribution of dividends
Capital increase
Appropriation of earnings from previous year
Shareholders’ equity at December 31, 2011, restated (2)
Restatements related to change in accounting method
Shareholders’ equity at December 31, 2011, as published
In € millions
CONSOLIDATED STATEMENT OF CHANGES IN SHAREHOLDERS' EQUITY
14,300
5
-1
1,642
-20
8
443
1,211
-56
-10
-70
25
12,709
0
2,099
3
-72
1,238
930
-121
-71
-52
2
10,731
108
10,623
the Group
attributable to
equity
Shareholders’
3,486
-25
305
32
273
-132
9
-141
3,338
-1
443
-1
-3
177
270
-174
-42
-132
3,070
-2
3,072
interests
Minority
Total
17,785
-20
-1
1,947
-20
8
475
1,484
-188
-1
-212
25
16,047
-1
2,542
2
-75
1,415
1,200
-295
-113
-184
2
13,801
106
13,695
equity
shareholders'
consolidated
CONSOLIDATED STATEMENT OF CASH FLOWS
Dec. 31, 2013
Net income
Corporate income tax
Income before corporate income tax
+/- Net depreciation/amortization expense on property, equipment and intangible assets
- Impairment of goodwill and other non-current assets
+/- Net additions to/reversals from provisions and impairment losses
1,484
Dec. 31, 2012
1,200
816
711
2,300
1,910
282
301
24
18
4,127
-407
+/- Share of net income/loss of associates
-70
71
+/- Net loss/gain from investing activities
0
266
+/- Income/expense from financing activities
+/- Other movements
0
0
-2,228
-1,116
= Total non-monetary items included in income before tax and other adjustments
2,135
-867
+/- Cash flows relating to interbank transactions
-5,011
2,398
+/- Cash flows relating to customer transactions
+/- Cash flows relating to other transactions affecting financial assets and liabilities
+/- Cash flows relating to other transactions affecting non-financial assets and liabilities
- Corporate income tax paid
= Net decrease/increase in assets and liabilities from operating activities
NET CASH FLOWS FROM (USED IN) OPERATING ACTIVITIES
+/- Cash flows relating to financial assets and investments in non-consolidated companies
5,279
8,232
-10,582
1,334
628
3,944
-885
-478
-10,571
15,430
-6,136
16,474
-29
4,649
+/- Cash flows relating to investment property
-450
-321
+/- Cash flows relating to property, equipment and intangible assets
-252
-193
NET CASH FLOWS FROM (USED IN) INVESTING ACTIVITIES
-731
4,135
+/- Cash flows relating to transactions with shareholders
-191
-182
+/- Other cash flows relating to financing activities
5,573
4,564
NET CASH FLOWS FROM (USED IN) FINANCING ACTIVITIES
5,382
4,381
-146
-7
Net increase (decrease) in cash and cash equivalents
-1,631
24,983
Net cash flows from (used in) operating activities
-6,136
16,474
Net cash flows from (used in) investing activities
-731
4,135
Net cash flows from (used in) financing activities
5,382
4,381
-146
-7
14,597
-10,387
IMPACT OF MOVEMENTS IN EXCHANGE RATES ON CASH AND CASH EQUIVALENTS
Impact of movements in exchange rates on cash and cash equivalents
Cash and cash equivalents at beginning of year
Cash accounts and accounts with central banks and post office banks
9,086
5,147
Demand loans and deposits - credit institutions
5,511
-15,534
Cash and cash equivalents at end of year
12,966
14,597
Cash accounts and accounts with central banks and post office banks
14,318
9,086
Demand loans and deposits - credit institutions
-1,352
5,511
CHANGE IN CASH AND CASH EQUIVALENTS
-1,631
24,983
80
Notes to the consolidated financial statements
NOTE 1: Accounting principles and methods
1.1 Accounting reference framework
Pursuant to regulation (EC) 1606/2002 on the application of international accounting standards and
regulation (EC) 1126/2008 on the adoption of said standards, the consolidated financial statements for the
year ended December 31, 2013 have been drawn up in accordance with IFRS as adopted by the European
Union at December 31, 2013. These standards include IAS 1 to 41, IFRS 1 to 8 and any SIC and IFRIC
interpretations adopted at that date. Standards not adopted by the European Union have not been applied. The
summary statements are presented in accordance with ANC recommendation 2013-R.04.
All IAS and IFRS were updated on November 3, 2008 by regulation 1126/2008 which replaced regulation
1725/2003. These standards are available on the European Commission’s website at:
http://ec.europa.eu/internal_market/accounting/ias/index_fr.htm
The information on risk management required by IFRS 7 is shown in a specific section of the management
report.
IAS 19R on employee benefits has been applied early as from January 1, 2012.
New standards applied since January 1, 2013:
Mandatory
application date
(years beginning
from)
Consequences of
application
Amendment IAS 1 - Presentation of items of other comprehensive
income
1/1/2013
Limited
Amendment IFRS 7 - Offsetting of financial assets and liabilities
1/1/2013
Limited
Annual Improvements to International Financial Reporting Standards
(IFRS)
1/1/2013
Limited
Amendment to IAS 12 (May 2012) – Income Taxes – Deferred Tax:
Recovery of Underlying Assets
1/1/2013
Limited
IFRS 13 – Fair value measurement, in particular relating to the
valuation of derivatives taking into account counterparty’s credit risk
and own credit risk (CVA and DVA)
1/1/2013
Limited
Standards and interpretations adopted by the European Union and not yet applied:
Mandatory
application date
(years beginning
from)
Consequences of
application
Amendment IAS 32 - Offsetting of financial assets and liabilities
1/1/2014
Limited
IFRS 10-11-12 - IAS 28 - Standards related to the consolidation and
financial information of non-consolidated entities
1/1/2014
Limited
81
1.2 Scope and basis of consolidation
Scope of consolidation
The general principles for the inclusion of an entity in the consolidation scope are defined in IAS 27, IAS 28
and IAS 31. The consolidation scope comprises:
- Entities under exclusive control: exclusive control is considered as being exercised in cases where the
Group holds a majority of the shares, directly or indirectly, and either the majority of the voting rights or the
power to appoint the majority of members of the board of directors, executive board or supervisory board, or
when the Group exercises a dominant influence. Entities that are controlled exclusively by the Group are
fully consolidated.
- Entities under joint control: joint control is exercised by virtue of a contractual agreement, and is the
shared control of an economic activity, irrespective of the structure or form under which that activity is
conducted. Jointly controlled companies are consolidated using the proportional method.
- Entities over which the Group exercises significant influence: these are the entities that are not controlled
by the consolidating entity, but in which the Group has the power to participate in determining their financial
and operating policies. The share capital of the entities in which the Group exercises a significant influence is
consolidated using the equity method.
Entities controlled by the Group or over which it exercises significant influence and which are not material in
relation to the consolidated financial statements are not consolidated. This situation is presumed if the total
statement of financial position or the income statement of an entity represents less than 1% of the related
consolidated or sub-consolidated (if applicable) totals. This is a purely relative criterion: an entity may be
included in the consolidated group regardless of the 1% threshold if it is regarded as a strategic investment
given its activity or its development.
Special purpose entities (SPE) are consolidated if they meet the conditions for consolidation set out in SIC
12 (where the activities are conducted exclusively on behalf of the Group; the Group has the decisionmaking or management powers to obtain the majority of the benefits of the ongoing operations of the SPE;
the Group has the capacity to benefit from the SPE; the Group retains the majority of the risks related to the
SPE).
Shareholdings owned by private equity companies over which joint control or significant influence is
exercised are excluded from the scope of consolidation and their value is accounted for under the fair value
option.
Changes in the consolidation scope
The changes in the consolidation scope as at December 31, 2013 were as follows:
- Additions:
CM-CIC Proximité (private equity); SCI Eurosic Cotentin (other activities).
- Merger/absorption:
TUP France EST with BFCM; TUP Promopresse with Le Dauphiné Libéré.
- Removals:
Est Imprimerie, Inter’Print, Imprimerie Michel, SCI Gutenberg, SDV Plurimédia and Alternative Gestion
SA.
- Change of name:
Dubly-Douilhet changed its name to Dubly-Douilhet Gestion.
Consolidation methods
The consolidation methods used are as follows:
82
Full consolidation
This method involves substituting for the value of the shares each of the assets and liabilities of each
subsidiary and recognizing the interests of non-controlling shareholders in shareholders’ equity and in the
income statement. This method is applicable to all entities under exclusive control, including those that do
not share the same accounting structures, whether or not the business of the consolidated party is an
extension of the business of the consolidating part.
Proportionate consolidation
This method involves the consolidation by the consolidating entity of the representative share of its interests
in the accounts of the consolidated entity, after restatements if necessary, so that no allowance is made for
non-controlling interests. This method is applicable to all entities under joint control, including entities that
do not share the same accounting structures, whether or not the business of the consolidated party is an
extension of the business of the consolidating party.
Consolidation using the equity method
This involves substituting for the value of the shares the Group’s interest in the equity and in the earnings of
the relevant entities. This method applies to entities over which the Group exercises significant influence.
Closing date
All Group companies falling within the scope of consolidation have a December 31 closing date.
Elimination of intercompany transactions
Intercompany transactions and the profits arising from transfers between Group entities that have a
significant effect on the consolidated financial statements are eliminated.
Receivables, payables, reciprocal commitments, internal expenses and income are eliminated for entities
subject to full and proportionate consolidation.
Translation of financial statements expressed in foreign currencies
The statements of financial position of foreign entities are translated into euro at the official year-end
exchange rate. Differences arising from the retranslation at the year-end rate of the opening capital stock,
reserves and retained earnings are recorded as a separate component of equity, under “Translation
adjustments”. Their income statements are translated into euros at the average exchange rate for the year (the
Group considers that any differences between the average rate for the year and the rates applicable on each
transaction date are immaterial), and the resulting differences are recorded under “Translation adjustments”.
On liquidation or disposal of some or all of the interests held in a foreign entity, these amounts are
recognized through the income statement.
As allowed by IFRS 1, the balance of cumulative translation adjustments was reset to zero in the opening
statement of financial position as of January 1, 2004.
Goodwill
Measurement differences
On taking control of a new entity, its assets, liabilities and any operating contingent liabilities are measured
at fair value. Any difference between carrying amounts and fair value is recognized as goodwill.
Acquisition goodwill
In accordance with IFRS 3R, when the Bank acquires a controlling interest in a new entity, said entity’s
identifiable assets, liabilities and contingent liabilities that meet the criteria for recognition under IFRS are
measured at fair value at the acquisition date, with the exception of non-current assets classified as assets
held for sale, which are recognized at the lesser of fair value net of selling costs and carrying amount. IFRS
3R permits the recognition of full goodwill or partial goodwill and the choice of method is made separately
for each business combination. In the case of full goodwill, non-controlling interests are measured at fair
value, whereas in the case of partial goodwill, they are measured based on their share of the values attributed
83
to the assets and liabilities of the acquired entity. If goodwill is positive, it is recognized as an asset and, if
negative, it is recognized immediately in the income statement under “Positive net effect of business
combinations”.
If the Group’s stake in an entity it already controls increases/decreases, the difference between the
acquisition cost/selling price of the shares and the portion of consolidated equity that said shares represent on
the acquisition/sale date is recognized within equity.
Goodwill is presented on a separate line of the statement of financial position when it relates to fullyconsolidated companies and under the heading “Investments in associates” when it relates to equityaccounted companies.
Goodwill does not include direct expenses associated with acquisitions, which are required to be expensed
under IFRS 3R.
Goodwill is tested for impairment regularly and at least once a year. The tests are designed to identify
whether goodwill has suffered a prolonged decline in value. If the recoverable amount of the cash-generating
unit (CGU) to which goodwill has been allocated is less than its carrying amount, an impairment loss is
recognized for the amount of the difference. These impairment losses on goodwill – which are recognized
through the income statement – cannot be reversed. In practice, cash-generating units are defined on the
basis of the Group’s business lines.
Non-controlling interests
These correspond to interests that do not provide control, as defined in IAS 27, and incorporate those
instruments representing current ownership interests that entitle the owner to a pro rata share of the net assets
of the entity in the event of liquidation, and other equity instruments issued by the subsidiary and not owned
by the Group.
1.3 Accounting principles and methods
IFRS offer a choice of accounting methods for certain items. The main options adopted by the Group relate
to the following:
The valuation at fair value of certain liabilities issued by the company and not included in the trading
book.
The Group has opted for the principle of eligibility for fair value hedge accounting for macro-hedges
established within the framework of asset-liability management concerning fixed income positions
(including in particular customer sight deposits) as authorized by regulation no. 2086/2004 of the
European Commission.
The Group used the October 2008 amendment to IAS39 to reclassify certain financial instruments
recognized at fair value as loans and receivables or as assets held-to-maturity. Reclassifications to
available-for-sale assets are also possible.
1.3.1 Loans & receivables
Loans and receivables are financial assets with fixed or determinable payments that are not quoted in an
active market and which are not intended for sale at the time of their acquisition or grant. They include loans
granted directly by the Group or its share in syndicated loans, purchased loans and debt securities that are not
listed on an active market. Loans and receivables are measured at fair value, which is usually the net amount
disbursed at inception.
The interest rates applied to loans granted are deemed to represent market rates, since they are constantly
adjusted in line with the interest rates applied by the vast majority of competitor banks. They are
subsequently carried at amortized cost using the effective interest rate method (other than for loans and
receivables carried at fair value by option). A loan restructured due to financial difficulties encountered by
the debtor is considered a new contract.
Commissions received or paid that are directly related to setting up the loan and are treated as an additional
component of interest are recognized over the life of the loan using the effective interest rate method and are
shown under interest items in the income statement.
84
The fair value of loans and receivables is disclosed in the notes to the financial statements at the end of each
reporting period and corresponds to the net present value of future cash flows estimated using a zero-coupon
yield curve that includes an issuer cost inherent to the debtor.
1.3.2 Impairment of loans and receivables, financing commitments and financial guarantees given, and
available-for-sale or held-to-maturity instruments
Individual impairment of loans
Impairment is recognized when there is objective evidence of a measurable decrease in value as a result of an
event occurring after inception of a loan or group of loans, and which may lead to a loss. Loans are tested for
impairment on an individual basis at each balance sheet date. The amount of impairment is equal to the
difference between the carrying amount and the present value of the estimated future cash flows associated
with the loan, taking into account any guarantees, discounted at the original effective interest rate. For
variable-rate loans, the last known contractual interest rate is used.
Loans on which one or more installments are more than three months past due (six months in the case of real
estate loans and nine months for local authority loans) are deemed to represent objective evidence of
impairment. Likewise, an impairment loss is recognized when it is probable that the borrower will not be
able to repay the full amount due, when an event of default has occurred, or where the borrower is subject to
court-ordered liquidation.
Impairment charges and provisions are recorded in net additions to provisions for loan losses. Reversals of
impairment charges and provisions are recorded in net reversals from provisions for loan losses for the
portion relating to the change in risk and in net interest for the portion relating to the passage of time.
Impairment provisions are deducted from the asset in the case of loans and receivables and the provision is
recorded under “provisions” in liabilities for financing and guarantee commitments.
Loan losses are recorded in losses and the corresponding impairments and provisions are written back.
Collective impairment of loans
Customer loans that are not individually impaired are risk-assessed on the basis of loans with similar
characteristics. This assessment draws upon internal and external rating systems, the estimated probability of
default, the estimated loss rate, and the amount of loans outstanding. Portfolio-based impairment is deducted
from the carrying amount of the assets concerned, while any movements in impairment are included in “Net
additions to/reversals from provisions for loan losses” in the income statement.
1.3.3 Leases
A lease is an agreement whereby the lessor conveys to the lessee in return for a payment or a series of
payments the right to use an asset for an agreed period of time.
A finance lease is a lease that transfers substantially all the risks and rewards incidental to ownership of an
asset. Title may or may not eventually be transferred.
An operating lease is a lease other than a finance lease.
Finance leases - lessor accounting
In accordance with IAS 17, finance lease transactions with non-Group companies are included in the
consolidated statement of financial position in an amount corresponding to the net investment in the lease.
In the lessor’s financial statements, the analysis of the economic substance of the transaction results in:
the recognition of a financial receivable due from the customer, reduced in line with the lease
payments received;
the breakdown of lease payments between principal repayments and interest, known as financial
amortization;
the recognition of an unrealized reserve, equal to the difference between:
- the net financial outstanding amount, being the debt of the lessee in the form of the
outstanding principal and the interest accrued at the end of the financial year;
- the net carrying amount of the leased non-current assets;
- the deferred tax provision.
85
Finance leases - lessee accounting
In accordance with IAS 17, assets acquired under finance leases are included in property and equipment and
an amount due to credit institutions is recorded as a liability. Lease payments are broken down between
principal repayments and interest.
1.3.4 Acquired securities
The securities held are classified into the three categories defined in IAS 39, namely financial instruments at
fair value through profit or loss, financial assets held to maturity, and financial assets available for sale.
Financial assets and liabilities at fair value through profit or loss
Classification
Financial instruments at fair value through profit or loss comprise:
a) financial instruments held for trading purposes, consisting mainly of instruments that:
a. were acquired or incurred principally for the purpose of selling or repurchasing them in the
near term; or
b. are part of a portfolio of financial instruments that are managed together and for which
there is evidence of a recent actual pattern of short-term profit-taking; or
c. represent derivatives not classified as hedges.
b) financial instruments designated at inception as at fair value through profit or loss in accordance with the
option provided by IAS 39. This option is designed to help entities produce more relevant information,
by enabling:
a. certain hybrid instruments to be measured at fair value without separating the embedded
derivatives, providing the embedded derivative has a material impact on the value of the
instrument;
b. a significant reduction in accounting mismatches between certain assets and liabilities,
which arise in particular when a hedging relationship (interest rate, credit) cannot be
established;
c. the management or monitoring of the performance of a group of financial assets and/or
liabilities in accordance with a documented risk management or investment strategy on a
fair value basis.
This Group used this option mainly in connection with insurance business units of account contracts in line
with the treatment for liabilities, as well as the securities held in the private equity portfolio and certain debt
securities with embedded derivatives.
Basis for recognition and measurement of related income and expenses
Financial instruments included in this category are recognized in the statement of financial position at fair
value up to the date of their disposal. Changes in fair value and in interest received or accrued on fixedincome securities are taken to the income statement under “Net gain/(loss) on financial instruments at fair
value through profit or loss”.
Purchases and sales of securities at fair value through profit or loss are recognized on the settlement date.
Any changes in fair value between the transaction date and settlement date are taken to income. Fair value
also incorporates an assessment of counterparty risk on these securities.
Fair value or market value
Fair value is the price that would be received for the sale of an asset or paid for the transfer of a liability in
an arm’s length transaction between market operators as at the valuation date. The fair value of an
instrument upon initial recognition is generally its transaction price.
If the instrument is traded on an active market, the best estimate of fair value is the quoted price.
86
The appropriate quoted market price for an asset held or liability to be issued is usually the current bid
price, and for an asset to be acquired or liability held, the ask price.
When the bank has assets and liabilities with offsetting market risks, the net position is valued at the bid
price for a net asset held or a net liability to be issued and at the ask price for a net asset to be acquired or
liability held.
A market is deemed to be active if quoted prices are readily and regularly available and represent actual and
regularly occurring market transactions in very similar instruments carried out on an arm’s length basis.
If the market for a financial instrument is not active, fair value is established using a valuation technique.
Derivatives are revalued based on available observable market data such as yield curves to which the
bid/ask price is then applied.
When no observable data is available or when adjustments in market prices require the use of nonobservable data, the entity may use internal assumptions relating to future cash flows and discount rates,
including the adjustments linked to risks that would be integrated by the market. In particular, these
valuation adjustments enable the integration of risks that are not captured by the model: liquidity risks
associated with the instrument or parameter in question; specific risk premiums intended to compensate for
additional costs that an active management strategy associated with the model would involve under certain
market conditions; and counterparty risk present in the positive fair value of OTC derivatives.
As regards derivatives that constitute a receivable, their valuation also incorporates the risk of the
counterparty defaulting.
A multi-criteria approach is adopted to determine the value of securities held in the private equity portfolio,
backed by historical experience of valuing unlisted companies.
Criteria for classification and rules of transfer
Market conditions may cause the Crédit Mutuel Group to review its investment and management strategy of
these securities. Thus, when it appears inappropriate to sell securities initially acquired for the purpose of
selling them in the near term, these securities may be reclassified under the specific provisions provided for
by the October 2008 amendment to IAS 39.
Fixed income securities or debt instruments valued at fair value through profit or loss can be reclassified
into the following categories:
a- “Financial assets held to maturity”, only in rare cases, if management’s intention has
changed, and provided that they fulfill the eligibility conditions of this category;
b- “Loans and receivables” in the event of a change in management’s intention or
ability to hold the securities in the foreseeable future or until maturity, and provided
that they fulfill the eligibility conditions of this category;
c- “available for sale” only in rare cases.
The purpose of these portfolio transfers is to better reflect the new intention to manage these instruments,
and to give a more faithful picture of their impact on the Group profit or loss.
Available-for-sale financial assets
Classification
Available-for-sale financial assets are financial assets that have not been classified as “loans and
receivables”, “held-to maturity financial assets” or “financial assets at fair value through profit or loss”.
Basis for recognition and measurement of related income and expenses
Available-for-sale financial assets are carried at fair value until disposal. Changes in fair value are shown on
the “Unrealized or deferred gains and losses” line within a specific equity account, excluding accrued
income. These unrealized or deferred gains or losses recognized in equity are only transferred to the income
statement in the event of disposal or a lasting impairment in value. On disposal or recognition of a lasting
impairment in value, the unrealized gains and losses recorded in equity are transferred to the income
statement under “Net gain/(loss) on available-for-sale financial assets”. Purchases and sales are recognized
at the settlement date.
Income received or accrued from fixed-income available-for-sale securities is recognized in the income
statement under “Interest income”. Dividend income relating to variable-income available-for-sale
securities is taken to income under “Net gain/(loss) on available-for-sale financial assets”.
87
Impairment of available-for-sale debt instruments
Impairment is calculated based on the fair value and recognized in “Net additions to provisions for loan
losses” and are reversible. In the event of impairment, any unrealized or deferred gains or losses are written
back to the income statement.
Impairment of available-for-sale equity instruments
An equity instrument is impaired when there is objective evidence of impairment, either in the event of a) a
significant or lasting decline in the fair value to below cost; or b) information regarding significant changes
that have a negative impact and have arisen in the technological environment prevailing in the economic or
legal market in which the issuer operates and which indicates that the cost of the investment may not be
recovered.
In the case of an equity instrument, the loss of at least 50% of its value compared with its acquisition cost or
a loss of value lasting more than 36 consecutive months implies an impairment. Such instruments are
analyzed on a line-by-line basis. Judgment must also be exercised for securities that do not meet the above
criteria but for which it is considered that recovery of the amount invested in the near future cannot
reasonably be expected.
Impairment is recognized under “Net gain/(loss) on available-for-sale financial assets” and is irreversible so
long as the instrument is carried in the statement of financial position. Any subsequent impairment is also
recognized in the income statement. In the event of impairment, any unrealized or deferred gains or losses
are written back to the income statement.
Criteria for classification and rules of transfer
Fixed income securities or debt instruments available for sale may be reclassified into the following
categories:
- Into “Held-to-maturity financial assets” in the event of a change in the management intention, and
provided that they fulfill the eligibility conditions of this category;
- Into “Loans and receivables” in the event of a change in the management intention, the ability to
hold the securities in the foreseeable future or until maturity, and provided that they fulfill the
eligibility conditions of this category;
In the event of transfer, the fair value of the financial asset at the date of reclassification becomes its new
cost or amortized cost. No gain or loss recognized before the date of transfer can be written back.
In the event of a transfer of instruments with a fixed maturity from “Available-for-sale financial assets” to
the “Held-to-maturity financial assets” or “Loans and receivables” categories, the unrealized gains and
losses previously deferred in equity are amortized over the remaining life of the asset.
Held-to-maturity financial assets
Classification
Held-to-maturity financial assets are financial assets listed on an active market, with fixed or determinable
payments that the Group has the positive intention and ability to hold to maturity, other than those that the
Group has designated at fair value through profit or loss or as available for sale. The positive intention and
ability to hold to maturity are assessed at the end of each reporting period.
Basis for recognition and measurement of related income and expenses
Held-to-maturity investments are recognized at fair value upon acquisition. Transaction costs are deferred
and included in the calculation of the effective interest rate, unless they are not material in which case they
are recognized immediately through profit or loss. Held-to-maturity investments are subsequently measured
at amortized cost using the effective interest rate method, which builds in the actuarial amortization of
premiums and discounts corresponding to the difference between the purchase price and redemption value
of the asset.
Income earned from this category of investments is included in “Interest income” in the income statement.
Impairment
Should a credit risk arise, impairment on held-to-maturity financial assets is calculated in the same way as
for loans and receivables.
88
Criteria for classification and rules of transfer
This category includes fixed or determinable income securities, with a fixed maturity date, and which the
Crédit Mutuel Group has the intention and ability to hold until maturity.
Any interest-rate risk hedges applicable to this category do not qualify for hedge accounting as defined in
IAS 39.
Furthermore, disposals or transfers of securities in this portfolio are very restricted, due to the provisions laid
down in IAS 39; breaching this rule would entail the declassification of the whole portfolio at the Group
level, and forbid access to this category for two years.
Fair value hierarchy of financial instruments
There are three levels of fair value of financial instruments, as defined by IFRS 13:
- Level 1: prices quoted on active markets for identical assets or liabilities; For capital markets
activities, this concerns debt securities that are quoted by at least four contributors and derivatives
quoted on an organized market.
- Level 2: data other than the level 1 quoted prices, which are observable for the asset or liability
concerned, either directly (i.e. prices) or indirectly (i.e. data derived from prices).Level 2 concerns
in particular interest rate swaps whose fair value is generally calculated using yield curves based on
the market interest rates observed at the accounting date;
- Level 3: data relating to the asset or liability that are not based on observable market data (nonobservable data). Given the diversity and volume of the instruments, the sensitivity of the fair value
to changes in parameters would not be material. This category comprises mainly investments in
non-consolidated companies and the private equity business line.
Derivatives and hedge accounting
Financial instruments at fair value through profit or loss - derivatives
A derivative is a financial instrument:
- whose fair value changes in response to the change in a specified interest rate, financial instrument
price, commodity price, foreign exchange rate, credit rating or credit index, or other variable –
sometimes called the “underlying”;
- which requires no initial net investment or an initial net investment that is smaller than would be
required for other types of contracts exhibiting a similar response to changes in market factors;
- which is settled at a future date.
Derivatives are classified as financial instruments held for trading except when they are part of a designated
hedging relationship.
Derivatives are recorded in the statement of financial position under financial instruments at fair value
through profit or loss. Changes in fair value and interest accrued or payable are recognized in “Net
gain/(loss) on financial instruments at fair value through profit or loss”.
Derivatives qualifying for hedge accounting in accordance with IAS 39 are classified as “fair value hedges”
or “cash flow hedges”, as appropriate. All other derivatives are classified as trading assets or liabilities, even
if they were contracted for the purpose of hedging one or more risks.
Embedded derivatives
An embedded derivative is a component of a hybrid instrument that, when separated from its host contract,
corresponds to the definition of a derivative. In particular, it has the effect of inducing changes in some of the
cash flows of the combined instrument in a way similar to that of a standalone derivative.
Embedded derivatives are separated from the host contract and accounted for as a derivative at fair value
through profit or loss provided that they meet the following three conditions:
- it corresponds to the definition of a derivative
- the hybrid instrument is not measured at fair value through profit or loss;
- the economic characteristics and risks of the embedded derivative are not closely related to the
economic characteristics and risks of the host contract;
89
Financial instruments at fair value through profit or loss - derivatives - structured products
Structured products are products created by bundling basic instruments – generally options – to exactly meet
client needs. There are various categories of structured products based on plain vanilla options, binary
options, barrier options, Asian options, lookback options, options on several assets and index swaps.
There are three main methods of valuing these products: methods consisting of solving a partial differential
equation, discrete time tree methods and Monte Carlo methods. The first and third methods are used. The
analytical methods used are those applied by the market to model the underlyings.
The valuation parameters applied correspond to observed values or values determined using a standard
observed values model at the balance sheet date. If the instruments are not traded on an organized market, the
valuation parameters are determined by reference to the values quoted by the most active dealers in the
corresponding products and/or by extrapolating quoted values. All these parameters are based on historical
data. The parameters applied to measure the value of unquoted forward financial instruments are determined
using a system that provides a snapshot of market prices. Every day, at a fixed time, the bid and ask prices
quoted by several market players, as displayed on the market screens, are recorded in the system. A single
price is used for each market parameter concerned.
Certain complex financial instruments – mainly customized equity barrier options with single or multiple
underlyings presenting low levels of liquidity and long maturities – are measured using internal models and
valuation inputs such as long volatilities, correlations, and expected dividend flows where no observable data
can be obtained from active markets. Upon initial recognition, these complex financial instruments are
recorded in the statement of financial position at their transaction price, which is deemed to be the best
indication of fair value even though the result of the model-based valuation may differ. The difference
between the price at which a complex instrument is traded and the value obtained from internal models,
which generally represents a gain, is known as “day one profit”. IFRS prohibit the recognition of a margin on
products valued using models and parameters that are not observable on active markets. The margin is
therefore deferred. The margin realized on options with a single underlying and no barrier is recognized over
the life of the instrument. The margin on products with barrier options is recognized upon maturity of the
structured product, due to the specific risks associated with the management of these barriers.
Hedge accounting
IAS 39 permits three types of hedging relationship. The hedging relationship is selected on the basis of the
type of risk being hedged. A fair value hedge is a hedge of the exposure to changes in fair value of a financial
asset or liability and is mainly used to hedge the interest rate risk on fixed-rate assets and liabilities and on
demand deposits, as permitted by the European Union. A cash flow hedge is a hedge of the exposure to
variability in cash flows relating to a financial asset or liability, firm commitment or highly probable forecast
transaction. Cash flow hedges are used in particular for interest rate risk on variable-rate assets and
liabilities, including rollovers, and for foreign exchange risk on highly probable foreign currency revenues.
At the inception of the hedge, the Group documents the hedging relationship, i.e. that between the item being
hedged and the hedging instrument. This documentation describes the management objectives of the hedging
relationship, as well as the type of risk covered, the hedged item and hedging instrument, and the methods
used to assess the effectiveness of the hedging relationship.
Hedge effectiveness is assessed at the inception of the hedge and subsequently at least at the end of each
reporting period.
The ineffective portion of the hedge is recognized in the income statement under “Net gain/(loss) on
financial instruments at fair value through profit or loss”.
Interest rate risk is the only risk covered by a fair value hedging relationship.
Fair value hedging instruments
The portion corresponding to the rediscounting of a derivative financial instrument is recorded in the income
statement under the line item “Interest income, interest expense and equivalent - Hedging derivative
instruments”, symmetrically to the interest income or expenses relating to the hedged item.
In a fair value hedging relationship, the derivative instrument is measured at fair value through profit or loss,
under the line item “Net gain (loss) on financial instruments at fair value through profit or loss”
symmetrically to the remeasurement of the hedged item to reflect the hedged risk through profit or loss. This
rule also applies if the hedged item is accounted for at amortized cost or if it is a financial asset classified as
available for sale. If the hedging relationship is perfectly effective, the fair value change in the hedging
instrument offsets the change in fair value of the hedged item.
90
The hedge must be considered as “highly effective” to qualify for hedge accounting. The change in fair value
or cash flows attributable to the hedging instrument must practically offset the change in the hedged item’s
fair value or cash flows. The ratio between those two changes must lie within the range of 80% and 125%.
If the hedging relationship is broken or no longer fulfills the hedge effectiveness criteria, hedge accounting is
discontinued on a prospective basis. Hedge derivatives are reclassified as trading instruments and are
recognized as per the principles applied to that category. The value of the hedged element in the statement of
financial position is subsequently not adjusted to reflect changes in fair value, and the cumulative
adjustments related to the hedge are amortized over the remaining life of the hedged item. If the hedged item
no longer appears in the statement of financial position, in particular due to early repayments, the cumulative
adjustment is immediately recognized in income.
Fair value hedging instruments - interest rate risk
The amendments introduced by the European Union to IAS 39 in October 2004 make it possible to include
customer demand deposits in fixed rate liability portfolios. This method is applied by the group. This method
is applied by the group for the majority of interest-rate hedges put in place by the asset/liability management
department.
For each portfolio of assets or liabilities, the bank checks, by pillar and at each reporting date, that there is no
excess hedging.
The liability portfolio is scheduled over time, under the estimates for future cash flows defined by the ALM
unit.
Changes in fair value of the interest rate risk on the hedged instrument portfolios are recorded in a special
line item of the statement of financial position called “Remeasurement adjustment on investments hedged
against interest rate risk”, the counterpart being an income statement line item.
Cash flow hedging instruments
In the case of a cash flow hedge relationship, the gains or losses on effective hedging instruments are
recognized in shareholders’ equity under the line item “Unrealized or deferred gains and losses relating to
cash flow hedging derivatives”, while the ineffective portion is recognized in the income statement under the
“Net gains and losses on financial instruments at fair value through profit or loss” heading.
The amounts recognized in shareholders’ equity are carried to the income statement under the “Interest
income, interest expense and equivalent” heading, at the same rate as the cash flows of the hedged item
affect the income statement. The hedged items remain recognized in accordance with the specific provisions
for their accounting category.
If the hedging relationship is broken or no longer fulfills the hedge effectiveness criteria, hedge accounting is
discontinued. Cumulative amounts recognized in shareholders’ equity as a result of the remeasurement of a
hedging derivative remain recognized in equity until the hedged transaction affects earnings or when it
becomes apparent that the transaction will not take place. These amounts are subsequently carried to the
profit and loss account.
1.3.5 Debt represented by a security
Debts evidenced by certificates (certificates of deposit, interbank market securities, bonds, etc.), not
classified under the fair value option, are accounted for at their issue value, in most cases minus the
transaction costs.
These debt securities are subsequently measured at amortized cost using the effective interest method.
Some “structured” debt instruments may include embedded derivatives. These embedded derivatives are
separated from the host contracts if the separation criteria are satisfied and they can be valued reliably.
The host contract is recognized at amortized cost at a later stage. Its fair value is determined based on quoted
market prices or valuation models.
1.3.6 Subordinated debt
Term or perpetual subordinated debt is separated from debt securities, because their redemption, should the
debtor enter liquidation, is only possible after all the other creditors have been paid. Such debt is valued at
amortized cost.
91
1.3.7 Distinction between Debt and Shareholders’ equity
According to the IFRIC 2 interpretation, shares owned by member-shareholders are equity if the entity has
an unconditional right to refuse redemption, or if there are legal or statutory provisions prohibiting or
seriously restricting redemption. In view of the existing legal or statutory provisions, the shares issued by the
structures making up the consolidating entity of the Crédit Mutuel Group are recognized in equity.
The other financial instruments issued by the Group qualify as debt instruments for accounting purposes,
where there is a contractual obligation for the Group to provide cash to the security holders. This is in
particular the case for all the subordinated securities issued by the Group.
1.3.8 Other provisions
Additions to and reversals from provisions are classified according to the nature of the corresponding income
and expense items. The provision is shown within liabilities on the statement of financial position.
A provision is recognized when it is likely that an outflow of resources embodying economic benefits will be
required to settle an obligation arising from a past event, and a reliable estimate can be made of the amount
of the obligation. The amount of this obligation is discounted, where appropriate, to determine the amount of
the provision.
The provisions made by the Group cover in particular:
Legal risk;
Social commitments;
Execution risk on off-statement of the financial position commitments;
Litigation risk and guarantee commitments given;
Tax risks;
Risks related to home savings accounts and plans.
1.3.9 Amounts due to customers and credit institutions
Debt securities include fixed-or determinable income financial liabilities. They are recognized at their market
value when they are posted to the statement of financial position, and are subsequently valued at reporting
date at amortized cost using the effective interest method, except for those that have been recognized under
the fair value option.
Regulated savings contracts
The “comptes épargne logement” (CEL - home savings accounts) and “plans épargne logement” (PEL home savings plans) are products regulated by French law, which are available to customers (natural
persons). These products combine a stage of interest-bearing savings, which give right to a preferential
housing loan in a second stage. They generate two types of commitments for the distributing institution:
A commitment to pay future interest on the amounts deposited as savings at a fixed rate for the PEL
and variable-rate equivalent for the CEL (periodically revised on the basis of an indexation formula);
A commitment to grant a loan to the customers who request it at predetermined conditions (both for
the PEL and the CEL).
These commitments have been estimated on the basis of customer behavior statistics and market inputs. A
provision has been made on the liabilities side of the statement of financial position to cover future charges
related to the potentially unfavorable conditions of such products, compared to the interest rates offered to
individual customers for similar products, but not regulated in terms of their interest rate. This approach
results in the generation of homogeneous regulated terms for the PEL and the CEL. The impact on the
income statement is recognized as “Interest paid to customers”.
1.3.10 Cash and cash equivalents
Cash and cash equivalents consolidate the cash accounts, deposits and demand loans and borrowings relating
to central banks and credit institutions.
In the statement of cash flows, UCITS are classified as an “operational activity” and therefore do not need to
be reclassified.
92
1.3.11 Employee benefits
Employee benefits are accounted for in accordance with IAS 19R, which has been applied early. The new
provisions result in the following:
- for defined benefit post-employment benefits, the immediate recognition of actuarial variances as
unrealized or deferred gains or losses in equity and the immediate recognition of plan changes
through profit or loss, the application to the plan’s assets of the discount rate used for the debt and
more detailed information provided in the notes;
- for short-term benefits, a new definition for benefits expected to be paid in full within the 12
months following the end of the year in which the related services were rendered (and no longer
“payable within the 12 months…”).
Social obligations are subject, where relevant, to a provision reported under the line item “Provisions”. A
change in this item is recognized in the income statement under the “Employee expense” heading, except for
the portion resulting from actuarial variances, which is recognized as unrealized or deferred gains or losses in
equity.
Defined benefit post-employment benefits
These benefits include retirement plans, early retirement pensions, and additional retirement plans, under
which the Group has a formal or implicit liability to provide benefits promised to employees.
These obligations are calculated using the projected unit credit method, which involves awarding benefits to
periods of service under the contractual formula for calculating the retirement plan benefits, subsequently
discounted on the basis of demographic and financial assumptions, including:
- The discount rate, determined by reference to the long-term interest rates of high-quality corporate
bonds, at year-end;
- The rate of wage increase, assessed according to the age group, the management/non-management
category, and regional features;
- The rate of inflation, estimated on the basis of a comparison between the OAT (French government
bond) yields and OAT yields inflated for different maturities;
- Rates of employee turnover determined by age group on the basis of an average ratio over three
years of the number of resignations and dismissals over the total number of employees working in
the company under permanent contracts at the financial year-end;
- The age of retirement: an estimate is made by individual on the basis of real or estimated date of
entry in the working life and assumptions related to the retirement reform legislation (Fillon law),
with a maximum ceiling at age 67;
- The mortality according to INSEE (the French National Institute for Statistics and Economic
Studies) TF 00-02 table.
The differences arising from changes in these assumptions and from the differences between previous
assumptions and actual results represent actuarial variances. If the retirement plan has assets, these are
valued at their fair value, and affect the income statement for the expected yield. The difference between the
real and expected yield is also an actuarial variance.
Actuarial variances are recognized as unrealized or deferred gains or losses in equity. Any reductions in
terms or liquidation of the plan generate changes in the obligation, which are recognized in income for the
year.
Supplementary benefits provided by pension funds
The AFB stepping stone agreement of September 13, 1993 modified the pension plans of credit institutions.
Since January 1, 1994, all banks are members of the French pension plans of Arrco and Agirc. The four
pension funds of which the Group’s banks are members have been merged. They provide for the payment of
the various charges required by stepping stone agreement, drawing on their reserves completed if necessary
by additional annual contributions paid in by the member banks concerned and whose average rate over the
next ten years is capped at 4% of the payroll expense. After the merger, the pension fund was transformed
into an IGRS (public institution to manage additional retirement benefits) in 2009. It has no asset shortfall.
93
Other post-employment defined benefits
A provision is recognized for long service awards and supplementary retirement benefits, including special
plans. They are valued on the basis of entitlements acquired by all the staff in active service, notably on the
basis of staff turnover in the consolidated entities and the estimated future salaries and wages to be paid to
the beneficiaries at the time of their retirement, increased where appropriate by social security contributions.
The long service awards of the Group’s banks in France are covered up to at least 60% by an insurance
contract taken out with ACM Vie, an insurance company of the Crédit Mutuel Group, which is fully
consolidated.
Post-employment benefits covered by defined contribution plans
The Group’s entities contribute to a number of pension plans managed by organizations that are independent
from the Group, for which the entities have no additional formal or implicit payment obligation, in particular
if the assets in the pension plans are not sufficient to meet liabilities.
As these plans do not represent obligations of the Group, they are not subject to a provision. The related
expenses are recognized in the financial year in which the contributions must be paid.
Long-term benefits
These are benefits to be paid, other than post-employment benefits and termination benefits, which are
expected to be paid more than 12 months after the end of the period during which the employee rendered
the related service, for example long service awards, time savings accounts, etc.
The Group’s obligation in respect of other long-term benefits is quantified using the projected unit credit
method. However, actuarial losses are taken to the income statement as and when they arise.
Obligations in respect of long service awards are sometimes covered by insurance policies. A provision is
established only for the uncovered part of these obligations.
Employee supplementary retirement plans
Employees of the Crédit Mutuel CM11 and CIC Groups benefit from, as a complement to the mandatory
retirement plans, a supplementary retirement plan offered by ACM Vie SA.
Employees of the CM11 Group benefit from two supplementary retirement plans, one with defined
contributions and the other with defined benefits. The rights under the defined contributions plan are vested
even if the employee leaves the company, unlike the rights under the defined benefits plan which, in
accordance with the new regulation, only vest definitively when the employee leaves the company to retire.
The total amount of the obligation was €915 million at December 31, 2013, covered by special technical
reserves amounting to €808 million, additional special technical reserves amounting to €54 million and €53
million of mathematical reserves for defined benefit plans recognized on the liabilities side of the ACM VIE
SA statement of financial position for all the beneficiaries.
In addition to the mandatory retirement plans, CIC Group’s employees benefit from a supplementary defined
contribution plan from ACM Vie SA. The total amount of the obligation at December 31, 2013 was €406
million, covered by technical reserves of €378 million and additional special technical reserves of €28
million for defined benefit plans recognized on the liabilities side of the ACM VIE SA statement of financial
position.
Termination benefits
These benefits are granted by the Group on termination of the contract before the normal retirement date, or
following the employee’s decision to accept voluntary termination in exchange for an indemnity. The related
provisions are updated if their payment is to occur more than 12 months after the reporting date.
Short-term benefits
These are benefits which are expected to be paid within the 12 months following the end of the financial
year, other than termination benefits, such as salaries and wages, social security contributions and a number
of bonuses.
An expense is recognized relating to these short-term benefits for the financial year during which the service
rendered to the Company has given rise to such entitlement.
94
1.3.12 Insurance
The accounting principles and valuation rules applied for the assets and liabilities generated by the issuance
of insurance policies have been drawn up in accordance with IFRS 4. This also applies to reinsurance
policies, whether issued or subscribed, and to financial contracts including a discretionary profit-sharing
clause.
The other assets held and liabilities issued by insurance companies follow the rules common to all of the
Group’s assets and liabilities.
Assets
Financial assets, investment properties and fixed assets follow the accounting methods described elsewhere.
However, financial assets representing technical provisions related to unit-linked contracts are shown under
the line item “Financial assets at fair value through profit or loss”.
Liabilities
Insurance liabilities, which represent liabilities to policyholders and beneficiaries, are shown under the line
item “Technical reserves of insurance policies”. They are measured, accounted for and consolidated
according to French GAAP.
Technical reserves of life insurance policies consist mainly of mathematical reserves, which generally
correspond to the surrender value of the policies. The risks covered mainly include death, disability and
incapacity for work (for borrower’s insurance).
Technical reserves of unit-linked contracts are measured, on the reporting date, based on the realizable value
of the assets underlying these contracts.
Reserves of non-life insurance policies correspond to unearned premiums (portion of premiums issued
related to subsequent years) and claims payable.
Insurance policies that have a discretionary profit-sharing clause are subject to “shadow accounting”. The
resulting provision for deferred profit-sharing represents the share of capital gains and losses accruing to
policyholders. These provisions for deferred profit-sharing are recognized on the assets or liabilities side, by
legal entity and without compensation between entities in the scope of consolidation. On the assets side,
these are recorded under a separate heading.
On the reporting date, the liabilities carried for these policies (net of other related asset or liability items such
as deferred acquisition expenses and the value of the portfolios acquired) are tested to check that they are
sufficient to cover the future cash flows estimated at this date. Any shortfall in technical provisions is
recognized in income for the period (and may be reversed at a later stage).
Income statement
Income and expenses recognized for the insurance policies issued by the Group are shown under the
“Income from other activities” and “Expenses on other activities” line items.
Income and expenses pertaining to the proprietary trading activities of the insurance entities are recognized
under the line items related to them.
1.3.13 Property and equipment and intangible assets
Property and equipment and intangible assets shown in the statement of financial position comprise assets
used in operations and investment property. Assets used in operations are those used in the provision of
services or for administrative purposes. Investment property comprises assets held to earn rentals or for
capital appreciation, or both. Investment property is accounted for at cost, in the same way as assets used in
operations.
Property and equipment and intangible assets are recognized at acquisition cost plus any costs directly
attributable to bringing the asset to the location and condition necessary for it to be capable of operating in
the manner intended by management. Borrowing costs incurred in the construction or adaptation of property
assets are not capitalized.
95
Subsequent to initial recognition, property and equipment are measured using the historical cost method,
which represents cost less accumulated depreciation, amortization and any accumulated impairment losses.
Where an asset consists of a number of components that may require replacement at regular intervals, or that
have different uses or different patterns of consumption of economic benefits, each component is recognized
separately and depreciated using a depreciation method appropriate to that component. BFCM has adopted
the components approach for property used in operations and investment property.
The depreciable amount is cost less residual value, net of costs to sell. Property and equipment and intangible
assets are presumed not to have a residual value as their useful lives are generally the same as their economic
lives.
Depreciation and amortization is calculated over the estimated useful life of the assets, based on the manner
in which the economic benefits embodied in the assets are expected to be consumed by the entity. Intangible
assets that have an indefinite useful life are not amortized.
Depreciation and amortization of assets used in operations is recognized in “Allowance/write-back of
amortization and provisions for fixed operating assets” in the income statement.
Depreciation and amortization relating to investment properties is recognized in “Expenses of the other
activities” in the income statement.
The depreciation and amortization periods are:
Property and equipment:
- Land, fixtures, utility services
- Buildings – structural work
- Construction – equipment
- Fixtures and installations
- Office equipment and furniture
- Safety equipment
- Rolling stock
- Computer equipment
:15-30 years
:20-80 years (depending on the type of building in question)
: 10-40 years
: 5-15 years
: 5-10 years
: 3-10 years
:3-5 years
:3-5 years
Intangible fixed assets:
- Software bought or developed in-house :1-10 years
- Businesses acquired
:9-10 years (if acquisition of customer contract portfolio)
Depreciable and amortizable assets are tested for impairment when there is evidence at the end of the
reporting period that the items may be impaired. Non-depreciable and non-amortizable non-current assets
(such as leasehold rights) are tested for impairment at least annually.
If there is an indication of impairment, the recoverable amount of the asset is compared with its carrying
amount. If the asset is found to be impaired, an impairment loss is recognized in income, and the depreciable
amount is adjusted prospectively. The impairment loss is reversed in the event of a change in the estimated
recoverable amount or if there is no longer an indication of impairment. The carrying amount after reversal
of the impairment loss cannot exceed the carrying amount which would have been calculated if no
impairment had been recognized.
Impairment losses relating to operating assets are recognized in the income statement in “Depreciation,
amortization and impairment of non-current assets”.
Impairment losses relating to investment properties are recognized in “Expenses on other activities” (for
additional impairment losses) and “Income from other activities” (for reversals) in the income statement.
Gains and losses on disposals of non-current assets used in operations are recognized in the income
statement in “Net gain/(loss) on disposals of other assets”.
Gains and losses on disposals of investment property are shown in the income statement under “Income from
other activities” or “Expense on other activities”.
96
The fair value of investment property is disclosed in the notes to the financial statements. It is based on a
valuation of the buildings by reference to market prices, performed by independent experts - (Level 2).
1.3.14 Corporate income tax
This item includes all current or deferred income taxes.
Current income tax is calculated based on applicable tax regulations.
Deferred tax
In accordance with IAS 12, deferred taxes are recognized for temporary differences between the carrying
amount of assets and liabilities and their tax basis, except for goodwill.
Deferred taxes are calculated using the liability method, based on the latest enacted tax rate applicable to
future periods.
Net deferred tax assets are recognized only in cases where their recovery is considered highly probable.
Current and deferred taxes are recognized as tax income or expense, except deferred taxes relating to
unrealized or deferred gains and losses recognized in equity, for which the deferred tax is taken directly to
equity.
Deferred tax assets and liabilities are offset when they arise within a single tax entity or tax group, are
subject to the tax laws of the same country, and there is a legal right of offset.
They are not discounted.
1.3.15 Interest paid by the French Government on some loans
Within the framework of aid to the rural and agricultural sector, as well as the purchase of residential
property, some Group entities provide loans at low interest rates, set by the Government. Consequently, these
entities receive from the government a contribution equal to the rate differential between the interest rate
offered to customers and the predefined benchmark rate. Therefore, no discount is recognized in respect of
the loans benefiting from these subsidies.
The structure of the offset mechanism is reviewed by the government on a periodic basis.
The contribution received from the government is recorded in the “Interest and similar income” line and
spread over the life of the corresponding loans, pursuant to IAS 20.
1.3.16 Financial guarantees and financing commitments given
Financial guarantees are treated like an insurance policy when they provide for specified payments to be
made to reimburse the holder for a loss incurred because a specified debtor fails to make payment on a debt
instrument on the due date.
In accordance with IFRS 4, these financial guarantees are still measured using French GAAP (i.e. as offbalance sheet items), pending an addition to the standards to enhance the current mechanism. Consequently,
these guarantees are subject to a provision in liabilities in the event of a likely outflow of resources.
By contrast, financial guarantees that provide for payments in response to changes in a financial variable
(price, credit rating or index, etc.) or a non-financial variable, provided that in this event the variable is not
specific to one of the parties to the agreement, fall within the scope of application of IAS 39. These
guarantees are thus treated as derivatives.
Financing commitments that are not regarded as derivatives within the meaning of IAS 39 are not shown in
the statement of financial position. However, a provision is made in accordance with IAS 37.
1.3.17 Foreign exchange transactions
Assets and liabilities denominated in a currency other than the local currency are translated at the year-end
exchange rate.
97
Monetary financial assets and liabilities
Foreign currency gains and losses on the translation of such items are recognized in the income statement
under “Net gain/(loss) on financial instruments at fair value through profit or loss”.
Non-monetary financial assets and liabilities
Foreign currency gains and losses on the translation of such items are recognized in the income statement if
the items are classified at fair value through profit or loss under “Net gain/(loss) on financial instruments at
fair value through profit or loss”, or under “Unrealized or deferred gains and losses” if they are classified as
available-for-sale.
When consolidated investments denominated in a foreign currency are financed by a loan taken out in the
same currency, the loan concerned is covered by a cash flow hedge.
Differences arising from the retranslation at the year-end rate of the opening capital stock, reserves and
retained earnings are recorded as a separate component of shareholders’ equity, under “Translation
adjustment”. The income statements of foreign subsidiaries are translated into euro at the average exchange
rate for the year, and the resulting translation differences are recorded under “Translation adjustment”. On
liquidation or disposal of some or all of the interests held in a foreign entity, the corresponding portion of this
cumulative translation adjustment is recognized through the income statement.
1.3.18 Non-current assets held for sale and discontinued operations
A non-current asset (or group of assets) is classified in this category if it is held for sale and it is highly
probable that the sale will occur within 12 months of the end of the reporting period.
The related assets and liabilities are shown separately in the statement of financial position, on the lines
“Noncurrent assets held for sale” and “Liabilities associated with non-current assets held for sale”. Items in
this category are measured at the lower of their carrying amount and fair value less costs to sell, and are no
longer depreciated/amortized.
When assets held for sale or the associated liabilities become impaired, an impairment loss is recognized in
the income statement.
Discontinued operations include operations that are held for sale or which have been shut down, and
subsidiaries acquired exclusively with a view to resale. All gains and losses related to discontinued
operations are shown separately in the income statement, on the line “Net gain/(loss) on discontinued
operations and assets held for sale”.
1.3.19 Judgments made and estimates used in the preparation of the financial statements
The preparation of the financial statements may require the use of assumptions and estimates that have a
material impact on income and expenses and of assets and liabilities in the statement of financial position
and notes to the financial statements.
In that case, management uses its judgment and experience to apply readily available information at the time
of preparation of the financial statements in order to arrive at the necessary estimates. This applies in
particular to:
- the impairment of debt and equity instruments;
- the use of calculation models when valuing financial instruments that are not listed on an active market
and are classified in “Available-for-sale financial assets”, “Financial assets at fair value through profit or
loss” or “Financial liabilities at fair value through profit or loss”;
- calculation of the fair value of financial instruments that are not listed on an active market and are
classified in “Loans and receivables” or “Held-to-maturity financial assets” for which this information
must be provided in the notes to the financial statements;
- impairment tests performed on intangible fixed assets;
- measurement of provisions, including retirement obligations and other employee benefits.
98
Notes to the consolidated financial statements
The notes to the financial statements are presented in millions of euros.
NOTE 2 - Analysis of statement of financial position and income statement items by business segment and geographic area
The Group's activities are as follows:
• Retail banking bri ngs together CIC's regional banks, Targobank Germany, Targobank Spain, Cofidis, Banco Popular Espanol, Banque Marocaine du Commerce Exterieur, Banque de Tunisie and all
specialist activities the products of which are sold by the network: equipment and real estate leasing, factoring, collective investment, employee savings plans and real estate.
• The Insurance business line comprises the Assurances du Crédit Mutuel Group.
• Financing and capital markets covers:
a) financing for major corporations and institutional clients, specialized lending, international operations and foreign branches;
b) capital markets activities in general, spanning customer and own account transactions involving interest rate instruments, fo reign exchange and equities, including brokerage services.
• Private banking encompasses all companies specializing in this area, both in France and internationally.
• Private equity, conducted for the Group’s own account, and financial engineering make up a business unit.
• Logistics and holding company services include all activities that cannot be attributed to another business line (holding) and units that provide solely logistical support: intermediate holding
companies, as well as specific entities holding real estate used for operations and IT entities.
Each consolidated company is included in only one business line, corresponding to its core business, on the basis of the contribution to the Group's results. The only exceptions are CIC and BFCM
because of their presence across several business lines. As such, their income, expenses and statement of financial position items are subject to an analytical distribution. The breakdown of the
statement of financial position items is done in the same way.
2a - Breakdown of the statement of financial position items by business line
Dec. 31, 2013
Retail
Insurance
banking
Financing and
Private
Private
Logistics and
capital markets
banking
equity
holding company
Total
ASSETS
Cash, central banks, post office banks
1,973
0
4,121
1,325
0
7,359
14,778
420
11,308
27,515
97
1,903
60
41,303
1,516
0
909
4
0
1,342
3,770
907
47,146
27,794
2,772
12
502
79,133
Financial assets at fair value through profit or loss
Hedging derivative instruments
Available-for-sale financial assets
Loans and receivables due from credit institutions
Loans and receivables due from customers
5,323
153
39,114
1,439
6
9,265
55,300
147,966
291
12,672
8,554
1
83
169,568
55
9,420
76
20
0
588
10,159
1,182
240
0
0
0
774
2,196
Held-to-maturity financial assets
Investments in associates
LIABILITIES
Cash, central banks, post office banks
0
0
0
460
0
0
460
316
3,051
26,921
121
0
0
30,408
Hedging derivative instruments
1,227
0
2,293
241
0
53
3,814
Due to credit institutions
9,629
0
10,250
0
0
0
19,880
112,167
91
12,104
15,756
2
5,097
145,217
31,547
0
66,390
19
0
0
97,957
Financial liabilities at fair value through profit or lossFinancial liabilities held for trading
Due to customers
Debt securities
Dec. 31, 2012
Retail
Insurance
banking
Financing and
Private
Private
Logistics and
capital markets
banking
equity
holding company
Total
ASSETS
Cash, central banks, post office banks
1,980
0
5,593
750
0
1,106
9,429
Financial assets at fair value through profit or loss
528
12,638
27,750
142
1,784
249
43,091
Hedging derivative instruments
740
0
157
4
0
1,713
2,614
Available-for-sale financial assets
738
42,051
16,955
3,385
19
422
63,570
Loans and receivables due from credit institutions
Loans and receivables due from customers
5,655
230
52,517
2,573
6
9,722
70,703
143,721
262
14,196
7,529
0
67
165,775
64
10,688
251
2
0
588
11,593
1,061
308
0
0
0
710
2,079
Held-to-maturity financial assets
Investments in associates
LIABILITIES
Cash, central banks, post office banks
Financial liabilities at fair value through profit or loss
Hedging derivative instruments
Due to credit institutions
Due to customers
Debt securities
0
0
0
343
0
0
343
529
4,359
25,886
196
0
0
30,970
287
0
1,977
399
0
100
2,763
7,260
0
27,217
0
0
0
34,477
105,168
85
7,216
15,758
1
6,636
134,864
32,586
0
60,936
21
0
0
93,543
2b - Breakdown of the income statement items by business line
Dec. 31, 2013
Retail
Insurance
banking
Financing and
Private
Private
Logistics and
Inter-
capital markets
banking
equity
holding company
businesses
Total
Net banking income (expense)
6,210
1,338
826
444
119
-449
-43
8,445
General operating expenses
-3,754
-391
-273
-329
-34
-461
43
-5,198
Gross operating income
2,457
946
554
115
85
-910
0
3,247
Net additions to/reversals from provisions for loan losses
-884
-44
-8
0
-29
0
-965
0
2,300
0
1,484
Net gain (loss) on disposal of other assets
Net income before tax
Corporate income tax
Net income (loss)
Net income attributable to minority interests
Net income attributable to the Group
48
-28
0
-2
1,621
918
509
108
-532
-343
-182
-38
0
278
1,090
575
328
70
86
-664
85
-942
18
-816
273
1,211
99
Dec. 31, 2012
Retail
Insurance
banking
Financing and
Private
Private
Logistics and
Inter-
capital markets
banking
equity
holding company
businesses
Total
Net banking income (expense)
5,854
1,318
927
464
100
-446
-58
8,159
General operating expenses
-3,748
-335
-288
-334
-34
-458
58
-5,140
983
639
129
66
-904
0
3,019
-85
-29
-75
-22
Gross operating income
2,106
Net additions to/reversals from provisions for loan losses*
-774
Net gain (loss) on disposal of other assets
-89
-41
-1
6
Net income before tax
1,243
942
554
107
Corporate income tax
-457
-374
-193
-27
2
338
Net income (loss)
787
568
361
79
67
-663
66
-962
-146
-1,001
0
1,910
0
1,200
-711
Net income attributable to minority interests
270
Net income attributable to the Group
930
* The disposal in the first half of 2012 of securities received in exchange for securities issued by the Greek government, contributed to the bond swap under the PSI (private sector involvement) plan, generated a negative impact of €30 million
on this item, including -€34 million for the logistics and holding company business and +€4 million for the capital markets business.
2c - Breakdown of the statement of financial position items by geographic region
Dec. 31, 2012
Dec. 31, 2013
France
Europe,
Rest of
Total
excluding France
the world*
France
Europe,
Rest of
excluding France
the world*
Total
ASSETS
Cash, central banks, post office banks
Financial assets at fair value through profit or loss
Hedging derivative instruments
2,951
4,122
14,778
1,429
2,407
5,593
9,429
522
1,260
41,303
41,138
941
1,011
43,091
3,761
4
5
3,770
2,601
4
9
2,614
73,741
4,880
512
79,133
57,985
4,905
680
63,570
51,849
2,238
1,212
55,300
66,137
3,191
1,375
70,703
142,570
23,824
3,174
169,568
140,300
22,290
3,186
165,775
Available-for-sale financial assets
Loans and receivables due from credit institutions
Loans and receivables due from customers
7,705
39,520
Held-to-maturity financial assets
10,139
20
0
10,159
11,591
2
0
11,593
878
759
559
2,196
824
705
550
2,079
0
460
0
460
0
343
0
343
29,722
554
133
30,408
30,562
224
184
30,970
Investments in associates
LIABILITIES
Cash, central banks, post office banks
Financial liabilities at fair value through profit or loss
Hedging derivative instruments
3,546
242
27
3,814
2,316
401
45
2,763
Due to credit institutions
9,818
5,362
4,700
19,880
20,146
7,639
6,691
34,477
118,204
26,327
686
145,217
109,246
24,915
703
134,864
91,909
1,638
4,410
97,957
89,097
510
3,937
93,543
Due to customers
Debt securities
* USA , Singapore, Tunisia and Morocco
2d - Breakdown of the income statement items by geographic region
Dec. 31, 2012
Dec. 31, 2013
France
Europe,
Rest of
Total
excluding France
the world*
France
Europe,
Rest of
excluding France
the world*
Total
Net banking income (expense)
6,298
1,966
181
8,445
6,193
1,793
173
8,159
General operating expenses
-3,774
-1,346
-79
-5,198
-3,802
-1,266
-72
-5,140
Gross operating income
2,524
621
102
3,247
2,391
526
101
3,019
Net additions to/reversals from provisions for loan losses
-673
-290
-2
-965
-556
-360
-46
-962
4
5
9
18
-10
-106
-30
-146
1,855
336
109
2,300
1,825
60
25
1,910
1,141
266
77
1,484
1,190
17
-8
1,200
913
216
83
1,211
961
-37
5
930
Net gain (loss) on disposal of other assets**
Net income before tax
Net income
Net income attributable to the Group
* USA , Singapore, Tunisia and Morocco.
In 2013, 28% of net banking income (excluding the logistics and holding business line) came from foreign operations.
** Including net income of associates and impairment losses on goodwill.
NOTE 3 - Scope of consolidation
The Group's parent company is Banque Federative du Credit Mutuel.
Dec. 31, 2013
Country
Dec. 31, 2012
Percent
Percent
Method
Percent
Percent
Method
control
interest
*
control
interest
*
A. Banking network
Banque du Crédit Mutuel Ile-de-France (BCMI)
France
100
100
FC
100
100
FC
Banque Européenne du Crédit Mutuel (BECM)
France
96
96
FC
96
96
FC
CIC Est
France
100
93
FC
100
93
FC
CIC Iberbanco
France
100
100
FC
100
100
FC
CIC Lyonnaise de Banque (LB)
France
100
93
FC
100
93
FC
CIC Nord Ouest
France
100
93
FC
100
93
FC
CIC Ouest
France
100
93
FC
100
93
FC
CIC Sud Ouest
France
100
93
FC
100
93
FC
Crédit Industriel et Commercial (CIC)
France
93
93
FC
93
93
FC
Germany
100
100
FC
100
100
FC
Spain
50
50
PC
50
50
PC
Targobank AG & Co. KgaA
Targobank Spain
100
Dec. 31, 2013
Country
Dec. 31, 2012
Percent
Percent
Method
Percent
Percent
Method
control
interest
*
control
interest
*
EM
B. Banking network - subsidiaries
Banca Popolare di Milano
Italy
7
6
EM
7
6
Bancas
France
50
50
PC
50
50
PC
Banco Popular Español
Spain
4
4
EM
4
4
EM
Banque de Tunisie
Tunisia
34
34
EM
20
20
EM
Banque du Groupe Casino
France
50
50
PC
50
50
PC
Banque Européenne du Crédit Mutuel Monaco
Monaco
100
96
FC
100
96
FC
Banque Marocaine du Commerce Extérieur (BMCE)
Morocco
26
26
EM
26
26
EM
Cartes et crédits à la consommation
France
100
100
FC
100
100
FC
CM-CIC Asset Management
France
74
73
FC
74
73
FC
CM-CIC Bail
France
99
92
FC
99
92
FC
CM-CIC Epargne salariale
France
100
93
FC
100
93
FC
CM-CIC Factor
France
96
89
FC
96
88
FC
CM-CIC Gestion
France
100
73
FC
100
93
FC
CM-CIC Home Loan SFH
France
100
100
FC
100
100
FC
CM-CIC Lease
France
100
96
FC
100
96
FC
CM-CIC Leasing Benelux
Belgium
100
92
FC
100
92
FC
CM-CIC Leasing GmbH
Germany
100
92
FC
100
92
FC
Cofidis Argentina
Argentina
66
36
FC
66
28
FC
Cofidis Belgium
Belgium
100
55
FC
100
43
FC
Cofidis France
France
100
55
FC
100
43
FC
Italy
100
55
FC
100
43
FC
Czech Republic
100
55
FC
100
43
FC
Slovakia
100
55
FC
100
43
FC
Creatis
France
100
55
FC
100
43
FC
FCT CMCIC Home loans
France
100
100
FC
100
100
FC
Monabanq
France
100
55
FC
100
43
FC
Saint-Pierre SNC
France
100
93
FC
100
93
FC
SCI La Tréflière
France
46
46
EM
46
46
EM
SOFEMO - Société Fédérative Europ.de Monétique et de Financement
France
100
55
FC
100
98
FC
Sofim
France
100
93
FC
100
93
FC
Targo Dienstleistungs GmbH
Germany
100
100
FC
100
100
FC
Targo Finanzberatung GmbH
Germany
100
100
FC
100
100
FC
Luxembourg
100
96
FC
100
96
FC
France
100
93
FC
100
93
FC
Diversified Debt Securities
Luxembourg
100
93
FC
100
93
FC
Divhold
Luxembourg
100
93
FC
100
93
FC
Cayman Islands
100
93
FC
100
93
FC
France
100
100
FC
100
100
FC
Agefor SA Genève
Switzerland
70
65
Alternative gestion SA Genève
Switzerland
Banque de Luxembourg
Luxembourg
100
Banque Pasche
Switzerland
100
Liechtenstein
Banque Pasche Monaco SAM
Cofidis Italy
Cofidis Czech Republic
Cofidis Slovakia
C. Financing and capital markets
Cigogne Management
CM-CIC Securities
Lafayette CLO 1 LtD
Ventadour Investissement
D. Private banking
FC
70
65
FC
NC
45
57
EM
93
FC
100
93
FC
93
FC
100
93
FC
53
49
FC
53
49
FC
Monaco
100
93
FC
100
93
FC
Banque Transatlantique
France
100
93
FC
100
93
FC
Banque Transatlantique Belgium
Belgium
100
93
FC
100
92
FC
Luxembourg
100
93
FC
100
93
FC
Singapore
100
93
FC
100
93
FC
Cayman Islands
70
65
FC
70
65
FC
Switzerland
100
93
FC
100
93
FC
France
100
93
FC
63
58
FC
LRM Advisory SA
Bahamas
70
65
FC
70
65
FC
Pasche Bank & Trust Ltd Nassau
Bahamas
100
93
FC
100
93
FC
Switzerland
100
93
FC
100
93
FC
Serficom Brasil Gestao de Recursos Ltda
Brazil
100
93
FC
50
46
FC
Serficom Family Office Brasil Gestao de Recursos Ltda
Brazil
97
90
FC
52
48
FC
Serficom Family Office Inc
Bahamas
100
93
FC
100
93
FC
Serficom Family Office SA
Switzerland
100
93
FC
100
93
FC
France
100
93
FC
100
93
FC
NC
100
93
FC
Banque Pasche (Liechtenstein) AG
Banque Transatlantique Luxembourg
Banque Transatlantique Singapore
Calypso Management Company
CIC Switzerland
Dubly-Douilhet Gestion
Pasche Finance SA Fribourg
Transatlantique Gestion
Valeroso Management Ltd
E. Private equity
CM-CIC Capital Finance
France
100
93
FC
100
93
FC
CM-CIC Capital Innovation
France
100
93
FC
100
92
FC
CM-CIC Conseil
France
100
93
FC
100
93
FC
CM-CIC Investissement
France
100
93
FC
100
92
FC
CM-CIC Proximité
France
100
93
FC
Sudinnova
France
66
61
FC
66
61
NC
FC
101
Dec. 31, 2013
Country
Dec. 31, 2012
Percent
Percent
Method
Percent
Percent
Method
control
interest
*
control
interest
*
F. Logistics and holding company services
Adepi
France
100
93
FC
100
93
FC
Carmen Holding Investissement
France
100
100
FC
84
84
FC
CIC Migrations
France
100
93
FC
100
93
FC
CIC Participations
France
100
93
FC
100
93
FC
Cicor
France
100
93
FC
100
93
FC
Cicoval
France
100
93
FC
100
93
FC
Germany
100
100
FC
100
100
FC
CMCP - Crédit Mutuel Cartes de Paiement
France
45
46
EM
45
46
EM
Cofidis Participations
France
55
55
FC
51
43
FC
Efsa
France
100
93
FC
100
93
FC
Est Bourgogne Rhone Alpes (EBRA)
France
100
100
FC
100
100
FC
Euro-Information
France
26
25
EM
26
25
EM
Euro Protection Surveillance
France
25
25
France Est
France
Gesteurop
France
100
Gestunion 2
France
Gestunion 3
CM Akquisitions
EM
25
25
EM
MER
100
98
FC
93
FC
100
93
FC
100
93
FC
100
93
FC
France
100
93
FC
100
93
FC
Gestunion 4
France
100
93
FC
100
93
FC
Groupe Républicain Lorrain Communication (GRLC)
France
100
100
FC
100
100
FC
Impex Finance
France
100
93
FC
100
93
FC
L'Est Républicain
France
92
92
FC
92
91
FC
Marsovalor
France
100
93
FC
100
93
FC
Pargestion 2
France
100
93
FC
100
93
FC
Pargestion 4
France
100
93
FC
100
93
FC
Placinvest
France
100
93
FC
100
93
FC
Société Civile de Gestion des Parts dans l'Alsace (SCGPA)
France
50
50
FC
50
50
FC
Société de Presse Investissement (SPI)
France
100
100
FC
100
90
FC
Société Française d'Edition de Journaux et d'Imprimés Commerciaux (SFEJIC)
France
99
97
FC
99
97
FC
Sofiholding 2
France
100
93
FC
100
93
FC
Sofiholding 3
France
100
93
FC
100
93
FC
Sofiholding 4
France
100
93
FC
100
93
FC
Sofinaction
France
100
93
FC
100
93
FC
Targo Akademie GmbH
Germany
100
100
FC
100
100
FC
Targo Deutschland GmbH
Germany
100
100
FC
100
100
FC
Targo IT Consulting GmbH
Germany
100
100
FC
100
100
FC
Targo Management AG
Germany
100
100
FC
100
100
FC
Targo Realty Services GmbH
Germany
100
100
FC
100
100
FC
Ufigestion 2
France
100
93
FC
100
93
FC
Ugépar Service
France
100
93
FC
100
93
FC
Valimar 2
France
100
93
FC
100
93
FC
Valimar 4
France
100
93
FC
100
93
FC
VTP 1
France
100
93
FC
100
93
FC
VTP 5
France
100
93
FC
100
93
FC
ACM GIE
France
100
72
FC
100
72
FC
ACM IARD
France
96
69
FC
96
69
FC
ACM Nord IARD
France
49
35
EM
49
35
EM
G. Insurance companies
ACM RE
Luxembourg
100
72
FC
100
72
FC
ACM Services
France
100
72
FC
100
72
FC
ACM Vie
France
100
72
FC
100
72
FC
Agrupació AMCI d'Assegurances i Reassegurances S.A.
Spain
73
59
FC
60
50
FC
Agrupació Bankpyme Pensiones
Spain
73
59
FC
60
50
FC
Agrupació Serveis Administratius
Spain
73
59
FC
60
50
FC
AMDIF
Spain
73
59
FC
60
50
FC
AMSYR
Spain
73
59
FC
60
50
FC
Assistencia Avançada Barcelona
Spain
73
59
FC
60
50
FC
Tunisia
30
22
EM
30
22
EM
Astree
Groupe des Assurances du Crédit Mutuel (GACM)
France
73
72
FC
73
72
FC
Luxembourg
100
72
FC
100
72
FC
Immobilière ACM
France
100
72
FC
100
72
FC
Partners
Belgium
100
72
FC
100
72
FC
Procourtage
France
100
72
FC
100
72
FC
RMA Watanya
Morocco
22
16
EM
22
16
EM
ICM Life
Royal Automobile Club de Catalogne
Spain
49
35
EM
49
35
EM
Serenis Assurances
France
100
72
FC
100
71
FC
Serenis Vie
France
100
72
FC
100
72
FC
Voy Mediación
Spain
90
63
FC
90
63
FC
102
Dec. 31, 2013
Country
Percent
Dec. 31, 2012
Method
Percent
Method
control
interest
*
control
interest
*
H. Other companies
Affiches D'Alsace Lorraine
France
100
98
FC
100
89
FC
Agence Générale d'informations régionales
France
100
98
FC
100
98
FC
Alsace Média Participation
France
100
98
FC
100
89
FC
Alsacienne de Portage des DNA
France
100
98
FC
100
89
FC
CM-CIC Immobilier
France
100
100
FC
100
100
FC
Distripub
France
100
97
FC
100
97
FC
Documents AP
France
100
100
FC
100
100
FC
Est Bourgogne Médias
France
100
100
FC
100
100
FC
Est Imprimerie
France
NC
100
100
FC
Foncière Massena
France
100
72
FC
100
72
FC
France Régie
France
100
98
FC
100
89
FC
GEIE Synergie
France
100
55
FC
100
43
FC
Groupe Progrès
France
100
100
FC
100
100
FC
Groupe Républicain Lorrain Imprimeries (GRLI)
France
100
100
FC
100
100
FC
Immocity
France
100
100
FC
100
100
FC
Imprimerie Michel
France
NC
100
100
FC
Interprint
France
NC
100
100
FC
Jean Bozzi Communication
France
100
100
FC
100
100
FC
Journal de la Haute Marne
France
50
46
EM
50
46
EM
La Liberté de l'Est
France
97
89
FC
97
89
FC
La Tribune
France
100
100
FC
100
100
FC
L'Alsace
France
100
97
FC
100
97
FC
Le Dauphiné Libéré
France
100
100
FC
100
100
FC
Le Républicain Lorrain
France
100
100
FC
100
100
FC
Les Dernières Nouvelles d'Alsace
France
100
98
FC
99
89
FC
Les Dernières Nouvelles de Colmar
France
100
98
FC
100
89
FC
Les Editions de l'Echiquier
France
100
97
FC
100
97
FC
Luxembourg
50
50
PC
50
50
PC
Massena Property
France
100
72
FC
100
72
FC
Massimob
France
100
69
FC
100
69
FC
Mediaportage
France
100
97
FC
100
97
FC
Presse Diffusion
France
100
100
FC
100
100
FC
Promopresse
France
MER
100
100
FC
Publiprint Dauphiné
France
100
100
FC
100
100
FC
Publiprint province n°1
France
100
100
FC
100
100
FC
Républicain Lorrain Communication
France
100
100
FC
100
100
FC
Républicain Lorrain Tv News
France
100
100
FC
100
100
FC
Roto Offset
France
100
97
FC
100
97
FC
SCI ACM
France
87
62
FC
83
60
FC
SCI Alsace
France
90
87
FC
90
87
FC
SCI Gutenberg
France
NC
100
100
FC
SCI Le Progrès Confluence
France
FC
100
100
FC
SDV Plurimédia
France
NC
20
18
EM
Société d'Edition de l'Hebdomadaire du Louhannais et du Jura
France
FC
100
100
FC
Lumedia
100
100
100
100
* Method:
FC = full consolidation
PC = proportional consolidation
EM = equity method
NC = not consolidated
MER = merged
Information on geographic locations included in the consolidation scope
Country
Germany
Net banking
Average number of
income
employees
1,006
6,735
Netherlands Antilles
2
6
Bahamas
3
10
125
527
269
1,575
Belgium
Brazil
Spain
United States
2
129
83
6,296
28,577
Hungary
16
138
Cayman Islands
-2
Italy
23
France
Liechtenstein
Luxembourg
Monaco
133
5
22
274
751
3
22
118
394
Czech Republic
10
108
UK
40
51
Singapore
53
195
Portugal
Slovakia
Switzerland
Total
0
2
74
355
8,445
39,686
The group has no sites meeting the criteria stipulated in the decree of October 6, 2009 in the non-cooperative states or territories included in the list established by the order of August 21, 2013.
103
NOTE 4 - Cash and amounts due from central banks
4a - Loans and receivables due from credit institutions
Dec. 31, 2013
Dec. 31, 2012
Cash and amounts due from central banks
Due from central banks
including reserve requirements
Cash
14,133
8,879
1,396
1,335
646
550
14,778
9,429
Crédit Mutuel network accounts (1)
4,831
5,425
Other current accounts
3,783
2,426
41,258
57,460
Total
Loans and receivables due from credit institutions
Loans
Other receivables
668
633
Securities not listed in an active market
1,812
2,344
Resale agreements
2,615
1,403
8
925
Individually impaired receivables
Accrued interest
Impairment provisions
Total
329
367
-4
-280
55,300
70,703
(1) mainly outstanding CDC (Caisse des Dépôts et Consignations) repayments relating to LEP, LDD and Livret bleu passbook savings accounts.
4b - Amounts due to credit institutions
Dec. 31, 2013
Due to central banks
Dec. 31, 2012
460
343
Due to credit institutions
Other current accounts
4,024
8,741
Borrowings
14,646
24,634
Other debt
161
298
Resale agreements
992
656
Accrued interest
Total
57
147
20,340
34,820
NOTE 5 - Financial assets and liabilities at fair value through profit or loss
5a - Financial assets at fair value through profit or loss
Dec. 31, 2013
Dec. 31, 2012
Held for trading Fair value option
. Securities
Total
Held for trading Fair value option
Total
10,986
13,570
24,555
15,148
14,784
- Government securities
1,764
1
1,765
1,644
1
1,645
- Bonds and other fixed-income securities
8,685
2,795
11,480
13,186
2,765
15,952
8,685
2,476
11,160
13,186
2,716
15,902
0
319
319
0
50
50
537
10,774
11,311
317
12,019
12,336
537
9,038
9,575
317
10,259
10,577
0
1,736
1,736
0
1,759
1,759
6,176
0
6,176
2,848
0
2,848
10,571
10,571
10,311
10,311
. Quoted
. Not quoted
- Equities and other variable-income securities
. Quoted
. Not quoted
. Trading derivative instruments
. Other financial assets
including resale agreements
TOTAL
17,162
10,571
10,571
24,141
41,303
17,996
29,932
10,311
10,311
25,096
43,091
5b - Financial liabilities at fair value through profit or loss
Dec. 31, 2013
Dec. 31, 2012
Financial liabilities held for trading
10,850
7,619
Financial liabilities at fair value by option through profit or loss
19,559
23,351
30,408
30,970
TOTAL
Financial liabilities held for trading
Dec. 31, 2013
. Short selling of securities
- Bonds and other fixed-income securities
- Equities and other variable-income securities
. Trading derivative instruments
. Other financial liabilities held for trading
TOTAL
Dec. 31, 2012
1,810
1,507
1,192
1,048
617
458
8,204
5,603
836
509
10,850
7,619
104
Financial liabilities at fair value by option through profit or loss
Dec. 31, 2013
. Securities issued
. Interbank liabilities
. Due to customers
Total
Carrying
Maturity
amount
amount
Dec. 31, 2012
Variance
Carrying
Maturity
amount
amount
Variance
184
184
0
24
24
0
17,088
17,088
0
22,723
22,720
3
2,287
2,287
0
604
604
19,559
19,559
23,351
23,348
-0
0
3
Own credit risk is deemed immaterial.
5c - Fair value hierarchy
Level 1
Dec. 31, 2013
Level 2
Level 3
Total
Financial assets
Available-for-sale (AFS)
76,838
929
1,366
79,133
- Government and similar securities - AFS
20,937
53
0
20,990
- Bonds and other fixed-income securities - AFS
48,867
831
410
50,108
6,166
5
111
6,282
858
22
527
1,407
10
18
318
346
20,509
18,361
2,433
41,303
100
165
1,764
- Equities and other variable-income securities - AFS
- Investments in non-consolidated companies and other LT investments - AFS
- Investments in associates - AFS
Held for trading / Fair value option (FVO)
- Government and similar securities - Held for trading
1,499
- Government and similar securities - FVO
1
0
0
1
- Bonds and other fixed-income securities - Held for trading
7,207
1,224
254
8,685
- Bonds and other fixed-income securities - FVO
2,294
132
369
2,795
- Equities and other variable-income securities - Held for trading
- Equities and other variable-income securities - FVO
531
0
6
537
8,924
374
1,476
10,774
0
5,505
- Loans and receivables due from credit institutions - FVO
0
5,505
0
5,066
0
5,066
53
5,965
158
6,176
0
3,767
3
3,770
97,347
23,062
3,797
124,206
- Loans and receivables due from customers - FVO
- Derivative instruments and other financial assets - Held for trading
Hedging derivative instruments
Total
Level 1
Level 2
Level 3
Total
Financial liabilities
Held for trading / Fair value option (FVO)
2,689
27,566
154
30,409
- Due to credit institutions - FVO
0
17,088
0
17,088
- Due to customers - FVO
0
2,287
0
2,287
- Debt securities - FVO
0
184
0
- Subordinated debt - FVO
0
0
0
0
2,689
8,018
143
10,850
- Derivative instruments and other financial liabilities - Held for trading
Hedging derivative instruments
Total
0
3,806
8
3,814
2,689
31,383
151
34,223
Level 1
Dec. 31, 2012
184
Level 2
Level 3
Total
Financial assets
Available-for-sale (AFS)
1,346
63,569
- Government and similar securities - AFS
11,912
32
0
11,944
- Bonds and other fixed-income securities - AFS
61,765
44,003
399
464
44,866
5,007
0
100
5,107
836
9
469
- Equities and other variable-income securities - AFS
- Investments in non-consolidated companies and other LT investments - AFS
- Investments in associates - AFS
Held for trading / Fair value option (FVO)
1,314
7
18
313
338
24,726
16,161
2,205
43,092
1,558
86
0
1,644
- Government and similar securities - Held for trading
- Government and similar securities - FVO
- Bonds and other fixed-income securities - Held for trading
458
1
0
0
1
10,124
2,670
392
13,186
- Bonds and other fixed-income securities - FVO
2,711
- Equities and other variable-income securities - Held for trading
50
4
2,765
307
0
10
317
9,976
349
1,694
12,019
- Loans and receivables due from credit institutions - FVO
0
5,802
0
5,802
- Loans and receivables due from customers - FVO
0
4,510
0
4,510
49
2,694
105
- Equities and other variable-income securities - FVO
- Derivative instruments and other financial assets - Held for trading
Hedging derivative instruments
Total
2,848
0
2,610
4
2,614
86,491
19,229
3,555
109,275
Level 1
Level 2
Level 3
Total
Financial liabilities
Held for trading / Fair value option (FVO)
2,082
28,790
98
30,970
- Due to credit institutions - FVO
0
22,723
0
22,723
- Due to customers - FVO
0
604
0
604
- Debt securities - FVO
0
24
0
24
- Subordinated debt - FVO
0
0
0
0
2,082
5,439
98
7,619
0
2,726
37
2,763
2,082
31,516
135
33,733
- Derivative instruments and other financial liabilities - Held for trading
Hedging derivative instruments
Total
There are three levels of fair value of financial instruments, as defined by IFRS 7:
- Level 1 instruments: valued using stock market prices. In the case of capital markets activities, these include debt securities with prices quoted by at least four contributors and derivative instruments quoted on a regulated market.
- Level 2 instruments: measured using valuation techniques based primarily on observable inputs. In the case of capital markets activities, these comprise debt securities with prices quoted by two to three contributors and derivative instruments
traded over the counter, which are not included in Level 3.
- Level 3 instruments: measured using valuation techniques based primarily on unobservable inputs. These involve unquoted equit ies, and, in the case of capital markets activities, debt securities quoted by a single contributor and derivative
instruments valued using primarily unobservable parameters.
Level 2 and 3 instruments held in the trading portfolio mainly comprise securities deemed to have poor liquidity and derivati ves for which at least one of the underlyings is deemed to have poor liquidity.
The uncertainties inherent in measuring all of these instruments result in measurement adjustments reflecting the risk premi um taken into account by market operators when setting the price.
These measurement adjustments enable the inclusion, in particular, of risks that would not be built into the model, liquidit y risks associated with the instrument or parameter in question, specific risk premiums intended to offset certain additional c osts inherent in the
dynamic management strategy associated with the model in certain market conditions, and the counterparty risk associated with positive fair values for over-the-counter derivatives. The methods used may change over time. The latter includes proprietary counterparty risk
associated with negative fair values for over-the-counter derivatives.
In determining measurement adjustments, each risk factor is considered individually; the diversification effect between diffe rent risks, parameters and models is not taken into account. In general, a portfolio approach is used for any given risk factor.
Gains and losses
Level 3 details
Jan. 1, 2013
Purchases
Sales
recognized in
profit
- Equities and other variable-income securities - FVO
1,694
193
-181
45
Other
movements
-275
Dec. 31, 2013
1,476
105
5d - Offsetting financial assets and financial liabilities
Associated amounts not offset
Dec. 31, 2013
Gross amount of
financial assets
Gross amount of
Financial
Effect of offset
financial liabilities
Net amount shown
offset
framework
agreements
instruments
Cash collateral
received in
received
Net amount
guarantee
Financial assets
Derivatives
Resale agreements
Total
9,947
0
9,947
-4,979
0
-1,440
13,644
0
13,644
0
-13,519
-34
3,527
91
23,591
0
23,591
-4,979
-13,519
-1,475
3,618
Associated amounts not offset
Dec. 31, 2013
Gross amount of
financial assets
Gross amount of
Effect of offset
financial liabilities
Net amount shown
offset
Financial
framework
instruments given Cash collateral paid
agreements
Net amount
in guarantee
Financial liabilities
Derivatives
12,015
0
12,015
-4,922
0
-5,570
Resale agreements
20,340
0
20,340
0
-19,542
-787
12
32,356
0
32,356
-4,922
-19,542
-6,357
1,535
Total
1,523
Associated amounts not offset
Dec. 31, 2012
Gross amount of
financial assets
Gross amount of
Financial
Effect of offset
financial liabilities
Net amount shown
offset
framework
agreements
instruments
Cash collateral
received in
received
Net amount
guarantee
Financial assets
Derivatives
Resale agreements
Total
5,461
0
5,461
-1,236
0
-524
12,509
0
12,509
0
-12,160
-153
3,701
195
17,970
0
17,970
-1,236
-12,160
-677
3,896
Associated amounts not offset
Dec. 31, 2012
Gross amount of
financial assets
Gross amount of
Effect of offset
financial liabilities
Net amount shown
offset
Financial
framework
instruments given Cash collateral paid
agreements
Net amount
in guarantee
Financial liabilities
Derivatives
Resale agreements
Total
8,363
0
8,363
-1,192
0
-5,954
24,184
0
24,184
0
-23,401
-679
1,218
104
32,547
0
32,547
-1,192
-23,401
-6,633
1,322
This information, required pursuant to an amendment to IFRS 7 applicable since January 1, 2013, is intended to improve comparability with disclosures under generally accepted accounting principles in the United States (US GAAP), which are less
restrictive than IFRS.
Pursuant to IAS 32, the Group does not offset carrying amounts, hence the absence of any figures in the second column. The "Effect of offset framework agreements" column shows outstanding amounts on transactions under binding agreements that
have not been offset in the financial statements.
The "Financial instruments received/given in guarantee" column comprises the market value of securities exchanged as collater al.
The "Cash collateral received/paid" column includes guarantee deposits received or given in respect of positive or negative market values of financial instruments. They are recognised as "Other assets or liabilities" in the statement of financial position
.
NOTE 6 - Hedging
6a - Hedging derivative instruments
Dec. 31, 2013
Assets
. Cash flow hedges
Dec. 31, 2012
Assets
Liabilities
Liabilities
4
11
4
46
. Fair value hedges (change in value recognized through profit or loss)
3,766
3,803
2,610
2,717
TOTAL
3,770
3,814
2,614
2,763
Fair value hedging is the hedging of exposure against a change in the fair value of a financial instrument attributable to a specific risk. The portion attributable to the hedged risk of changes in the fair value of the hedge and of the hedged
items is recognized through profit or loss.
6b - Remeasurement adjustment on interest-rate risk hedged investments
Fair value
Fair value
Change in fair
Dec. 31, 2013
Dec. 31, 2012
value
Fair value of interest-rate risk by investment category
. financial assets
. financial liabilities
562
852
-290
-1,252
-1,947
695
106
6c - Analysis of derivative instruments
Dec. 31, 2013
Notional
Assets
Dec. 31, 2012
Notional
Liabilities
Assets
Liabilities
Trading derivative instruments
Interest-rate derivative instruments
Swaps
230,854
4,748
6,570
290,445
2,045
Other forward contracts
13,022
5
1
14,796
4
4,522
2
Options and conditional transactions
24,940
112
238
23,447
92
265
Foreign exchange derivative instruments
Swaps
75,932
21
42
81,679
20
71
71
341
325
10,871
401
391
22,393
54
54
16,193
53
52
13,276
109
180
13,553
74
138
1,572
0
0
1,744
0
0
27,183
785
795
4,550
158
162
409,242
6,176
8,204
457,278
2,848
5,603
76,215
3,766
3,803
74,463
2,609
2,717
1
0
0
1
0
0
217
4
8
165
4
41
0
0
3
0
0
5
76,433
3,770
3,814
74,630
2,614
2,763
485,676
9,947
12,018
531,907
5,461
8,366
Other forward contracts
Options and conditional transactions
Derivative instruments other than interest-rate and foreign exchange
Swaps
Other forward contracts
Options and conditional transactions
Sub-total
Hedging derivative instruments
Fair value hedges
Swaps
Options and conditional transactions
Cash flow hedges
Swaps
Other forward contracts
Sub-total
Total
Note 7 - Available-for-sale financial assets
7a - Available-for-sale financial assets
Dec. 31, 2013
Dec. 31, 2012
. Government securities
20,856
11,809
. Bonds and other fixed-income securities
50,000
44,766
- Listed(1)
49,781
44,149
- Unlisted
219
617
6,282
5,119
6,145
4,966
. Equities and other variable-income securities
- Listed
- Unlisted
. Long-term investments
- Investments in non-consolidated companies
137
153
1,742
1,625
1,274
1,177
- Other long-term investments
133
133
- Investments in associates
335
311
- Securities lent
1
4
. Accrued interest
254
251
79,133
63,570
TOTAL
Including unrealized gains (losses) on bonds, other fixed-income securities and government securities recognized directly in equity
Including unrealized gains (losses) on equities, other variable-income securities and long-term investments recognized directly in equity
Including impairment of bonds and other fixed-income securities
Including impairment of equities and other variable-income securities and long-term investments
99
-80
761
545
-80
-88
-1,814
-1,986
(1) The amortization method used for RMBS discounts has been corrected for an error: the carrying amount of RMBS at January 1, 2013 has accordingly been reduced by €50 million, with corresponding reductions of €27 million in equity and
€23 million in deferred taxes.
7b - List of main investments in non-consolidated companies
Shareholders'
% held
equity
Total assets
NBI or revenue
Net income
Crédit logement
Unlisted
< 10%
1,488
9,921
255
CRH (Caisse de refinancement de l'habitat)
Unlisted
< 40%
313
55,338
5
104
2
Foncière des Régions
Veolia Environnement
Quoted
Quoted
< 10%
< 5%
6,062
9,126
14,117
44,612
713
29,439
59
530
The figures above (excluding the percentage of interest) relate to 2012.
7c - Exposure to sovereign risk
Countries benefiting from aid packages
Net exposure*
Dec. 31, 2013
Portugal
Financial assets at fair value through profit or loss
Available-for-sale financial assets
Dec. 31, 2012
Ireland
Portugal
Ireland
7
63
102
63
100
70
102
63
100
Held-to-maturity financial assets
TOTAL
* Net exposure amounts are shown net of any insurance policyholder profit-sharing portion.
107
Residual contractual maturity
Portugal
< 1 year
Ireland
Portugal
Ireland
13
1 to 3 years
13
3 to 5 years
50
5 to 10 years
2
94
> 10 years
5
8
70
102
Total
50
93
63
100
7
Other sovereign risk exposures in the banking portfolio
Net exposure
Dec. 31, 2013
Spain
Dec. 31, 2012
Italy
Spain
Italy
Financial assets at fair value through profit or loss
248
14
204
39
Available-for-sale financial assets
100
3,370
54
3,472
348
3,384
258
3,511
Held-to-maturity financial assets
TOTAL
Capital markets activities are shown at market value and other businesses at par value. Outstandings are shown net of credit default swaps.
Residual contractual maturity
Spain
Italy
Spain
Italy
< 1 year
181
2,225
81
30
1 to 3 years
138
379
118
2,645
3 to 5 years
20
349
29
206
5 to 10 years
0
198
13
382
> 10 years
8
233
16
248
348
3,384
258
3,511
Total
NOTE 8 - Customers
Loans and receivables due from customers
Dec. 31, 2013
Performing loans
Dec. 31, 2012
157,221
. Commercial loans
154,164
4,877
4,722
151,462
148,881
- Home loans
66,238
63,746
- Other loans and receivables, including repurchase agreements
85,224
85,135
. Accrued interest
307
316
. Securities not listed in an active market
576
245
Insurance and reinsurance receivables
198
180
10,456
8,897
. Other customer loans
Individually impaired receivables
Gross receivables
167,875
163,241
Individual impairment
-6,822
-5,656
Collective impairment
-586
-490
160,467
157,096
Finance leases (net investment)
9,238
8,809
. Furniture and movable equipment
5,421
5,293
. Real estate
3,469
3,144
SUB-TOTAL I
. Individually impaired receivables
Impairment provisions
SUB-TOTAL II
348
373
-137
-130
9,101
8,680
169,568
165,775
of which non-voting loan stock
12
11
of which subordinated notes
18
13
TOTAL
Finance leases with customers
Dec. 31, 2012
Gross carrying amount
Impairment of irrecoverable rent
Net carrying amount
Acquisition
Sale
Dec. 31, 2013
Other
8,809
1,679
-1,256
6
-130
-34
27
0
9,238
-137
8,680
1,645
-1,229
6
9,101
Maturity analysis of minimum future lease payments receivable under finance leases
> 1 year and <
< 1 year
5 years
> 5 years
Total
Minimum future lease payments receivable
2,659
4,862
2,012
9,533
Present value of future lease payments
2,505
4,681
2,003
9,189
154
181
9
344
Unearned finance income
108
8b - Amounts due to customers
Dec. 31, 2013
. Regulated savings accounts
- demand
- term
Dec. 31, 2012
39,661
39,098
30,065
30,071
9,597
9,027
. Accrued interest
1
3
39,662
39,101
. Current accounts
55,045
47,682
. Term deposits and borrowings
49,741
47,293
. Resale agreements
166
202
. Accrued interest
512
501
Sub-total
. Insurance and reinsurance payables
91
85
Sub-total
105,555
95,762
TOTAL
145,217
134,864
NOTE 9 - Held-to-maturity financial assets
Dec. 31, 2013
. Securities
Dec. 31, 2012
10,174
- Government securities
- Bonds and other fixed-income securities
. Quoted
11,605
0
0
10,174
11,605
10,148
11,560
. Not quoted
26
45
. Accrued interest
1
1
10,175
11,606
GROSS TOTAL
of which impaired assets
25
25
Impairment provisions
-16
-14
10,159
11,593
NET TOTAL
NOTE 10 - Movements in impairment provisions
Dec. 31, 2012
Loans and receivables due from credit institutions
Additions
Other(1)
Reversals
Dec. 31, 2013
-280
0
2
275
-4
Loans and receivables due from customers
-6,275
-1,370
1,273
-1,173
-7,545
Available-for-sale securities
-2,074
-20
203
-4
-1,895
-14
-3
0
0
-16
-8,643
-1,393
1,479
-902
-9,460
Held-to-maturity securities
Total
(1) Includes - €1,163 million following the reconstitution of provisions fully amortized over more than 5 years in Targobank Germany. The restated total at end-2012 of these provisions was - €11, 240 million as opposed to - €10,077 million.
At December 31, 2013, provisions on loans and receivables due from customers totalled €7,545 million (€7,438 million restated at end-2012), of which €586 million in collective provisions. Individual provisions relate mainly to ordinary accounts in
debit for €673 million (€707 million at end-2012) and to provisions on commercial receivables and other receivables (including home loans) for €6,148 million (€6,112 million restated at end- 2012).
NOTE 11 - Reclassifications of financial instruments
Pursuant to the revised accounting regulations and in the rare situation of a market that was in total disarray, on July 1, 2008, CIC transferred €18.8 billion of assets from the trading portfolio into the
available-for-sale portfolio (€16.1 billion) and into the loans and receivables portfolio (€2.7 billion), and €6.5 billion from the available-for-sale portfolio into the loans and receivables portfolio (€5.9
billion) and the held-to-maturity portfolio (€0.6 billion). No further transfers have been made since that date .
Dec. 31, 2013
Carrying amount
Dec. 31, 2012
Fair value
Carrying amount
Fair value
Loans and receivables portfolio
2,109
2,193
2,929
2,910
AFS portfolio
4,685
4,684
5,489
5,492
Dec. 31, 2013
Dec. 31, 2012
Gains/(losses) that would have been recognized in the income statement at fair value if the assets had not been reclassified
-97
635
Unrealized gains/(losses) that would have been recognized in equity if the assets had not been reclassified
154
-498
19
92
Gains/(losses) recognized in income (net banking income and net additions to/reversals from provisions for loan losses) relating to reclassified assets
NOTE 12 - Exposures affected by the financial crisis
The exposures affected by the financial crisis are presented below.
The portfolios are carried at market value established on the basis of external inputs obtained from regulated markets, major brokers or, where no price was available, on the basis of comparable
listed securities.
Summary
Carrying amount Carrying amount
Dec. 31, 2013
Dec. 31, 2012
RMBS
1,919
2,391
CMBS
558
333
1,462
943
Other ABS
734
731
CLO hedged by CDS
476
833
CLO
Other ABS hedged by CDS
Liquidity facilities for ABCP programs
TOTAL
22
25
303
351
5,474
5,606
Unless otherwise stated, securities are not covered by CDS.
109
Exposures at 12/31/2013
RMBS
CMBS
CLO
Other ABS
Total
Trading
700
498
133
294
1,625
AFS
Loans
450
60
520
295
1,325
809
145
1,723
1,462
734
4,672
TOTAL
769
1,919
558
France
376
379
Spain
106
22
128
United Kingdom
259
55
314
Europe excluding France, Spain and United Kingdom
806
75
1,008
266
2,155
USA
Rest of the world
696
481
123
14
1,313
TOTAL
2
52
331
1,919
383
558
1,462
734
4,672
472
971
492
2,553
US Agencies
243
AAA
619
AA
208
413
65
687
A
203
19
41
124
387
BBB
89
67
12
27
195
BB
72
25
510
1,462
734
4,672
707
B or below
Not rated
TOTAL
243
17
89
485
0
8
8
1,919
558
Originating 2005 or before
315
362
18
12
Originating 2006
303
113
204
10
630
Originating 2007
Originating since 2008
593
708
74
10
409
830
53
658
1,129
2,206
1,919
558
1,462
734
4,672
TOTAL
Exposures at December 31, 2012
RMBS
CMBS
CLO
Other ABS
Total
Trading
921
269
15
505
AFS
Loans
478
64
29
75
646
899
151
2,042
943
731
4,398
519
522
173
992
TOTAL
2,391
333
France
1
2
1,710
Spain
105
68
United Kingdom
244
47
291
Europe excluding France, Spain and United Kingdom
706
64
664
72
1,506
USA
Rest of the world
1,232
267
279
25
1,803
TOTAL
2,391
333
943
731
4,398
259
383
462
1,650
103
103
US Agencies
447
AAA
546
AA
239
488
53
780
A
188
10
47
150
395
BBB
66
64
12
19
161
BB
101
B or below
Not rated
804
TOTAL
447
14
114
47
851
731
4,398
28
526
0
2,391
333
Originating 2005 or before
400
98
Originating 2006
508
60
180
45
793
Originating 2007
Originating since 2008
746
736
175
0
418
346
60
598
1,399
1,680
2,391
333
943
731
4,398
TOTAL
943
NOTE 13 - Corporate income tax
13a - Current income tax
Dec. 31, 2013
Asset (through income statement)
Liability (through income statement)
Dec. 31, 2012
710
701
336
446
13b - Deferred income tax
Dec. 31, 2013
Dec. 31, 2012
Asset (through income statement)
648
625
Asset (through shareholders' equity)
121
249
Liability (through income statement)
Liability (through shareholders' equity)
490
486
361
320
110
Breakdown of deferred income tax by major categories
Dec. 31, 2013
Assets
Liabilities
Dec. 31, 2012
Assets
Liabilities
. Temporary differences on:
- Deferred gains (losses) on available-for-sale securities
121
- Impairment provisions
381
361
249
320
375
- Unrealized finance lease reserve
207
- Earnings of fiscally transparent (pass-through) companies
144
0
- Remeasurement of financial instruments
1
643
610
734
104
- Accrued expenses and accrued income
97
22
94
752
- Tax losses (1)(2)
49
- Insurance activities
63
30
- Other timing differences
. Netting
173
28
174
30
60
98
78
-582
-582
-767
-767
770
851
873
805
Total deferred tax assets and liabilities
Deferred taxes are calculated using the liability method. For the French entities, the deferred tax rate corresponds to the usual tax rate applicable to each entity concerned (38% or 34.43%) for timing differences reversing in 2014 and 34.43% for
subsequent years.
(1) Of which, in respect of the United States: €25 million at December 31, 2013 and €50 million at December 31, 2012.
(2) Tax losses are a source of deferred tax assets to the extent that they have a high probability of recovery.
NOTE 14 - Accruals, other assets and other liabilities
14a - Accruals and other assets
Dec. 31, 2013
Dec. 31, 2012
Accruals - assets
Collection accounts
239
Currency adjustment accounts
188
4
Accrued income
404
2,744
2,296
3,417
2,972
Other accruals
Sub-total
83
430
Other assets
Securities settlement accounts
107
79
Guarantee deposits paid
6,002
8,069
Miscellaneous receivables
2,947
6,191
Inventories
13
Other
52
49
9,122
14,402
Sub-total
13
Other insurance assets
Technical reserves - reinsurers' share
265
Other expenses
Total
269
88
83
353
353
12,892
17,727
Sub-total
14b - Accruals and other liabilities
Dec. 31, 2013
Dec. 31, 2012
Accruals - liabilities
Accounts unavailable due to collection procedures
129
Currency adjustment accounts
188
6
Accrued expenses
705
643
Deferred income
651
639
4,695
7,435
6,369
8,877
114
123
Other accruals
Sub-total
153
Other liabilities
Securities settlement accounts
Outstanding amounts payable on securities
74
100
2,815
4,163
3,003
4,386
Other payables
Sub-total
Other insurance liabilities
Deposits and guarantees received
182
167
Sub-total
182
167
9,554
13,430
Total
NOTE 15 - Investments in associates
Equity value and share of net income (loss)
Dec. 31, 2013
Dec. 31, 2012
Percent
Investment
Share of
Percent
Investment
Share of
interest
value
net income (loss)
interest
value
net income (loss)
ACM Nord
Unlisted
Unlisted
49.00%
28
6
49.00%
22
ASTREE Assurance
Listed
Listed
30.00%
16
2
30.00%
17
1
Banca Popolare di Milano(1)
Listed
Listed
6.87%
103
-47
6.87%
142
-58
Banco Popular Español
Listed
Listed
4.41%
484
16
4.37%
410
-105
Banque de Tunisie
Listed
Listed
33.52%
159
12
20.00%
52
6
Banque Marocaine du Commerce Extérieur
Listed
Listed
26.21%
940
35
26.21%
923
16
CMCP
Unlisted
Unlisted
5
0
5
0
Euro Information
Unlisted
Unlisted
26.36%
245
21
26.36%
222
20
Euro Protection Surveillance
Unlisted
Unlisted
25.00%
7
4
25.00%
3
3
RMA Watanya (2)
Unlisted
Unlisted
22.02%
151
-39
22.02%
209
-25
Royal Automobile Club de Catalogne
Unlisted
Unlisted
48.99%
45
4
48.99%
59
4
SCI Treflière
Unlisted
Unlisted
46.09%
11
0
46.09%
12
1
Other
Unlisted
Unlisted
2
1
3
1
2,196
13
2,079
-131
TOTAL
6
(1) The share of the loss of Banca Popolare di Milano amounting to €47 million includes a €34 million impairment loss on this investment.
(2) Goodwill relating to RMA of €87 million was written down in the amount of €15 million in 2013.
111
Financial data published by the major associates
Total assets
NBI or revenue
Net income (loss)
ACM Nord
165
142
ASTREE Insurance(1)(2)
388
109
11
52,475
1,550
-435
Banco Popular Español
147,852
3,707
325
Banque de Tunisie(1)(2)
3,745
161
63
230,889
9,017
1,579
932
919
76
95
118
15
261,296
4,670
-1,205
192
123
8
Banca Popolare di Milano(1)
Banque Marocaine du Commerce Extérieur(1)(3)
Euro Information
Euro Protection Surveillance
RMA Watanya(1)(3)
Royal Automobile Club de Catalogne
(1) 2012 amounts
(2) in millions of Tunisian Dinars
12
(3) in millions of Moroccan Dirhams
Banc a Popolare di Milano S.C.a.r.l. (BPM):
Additional impairment of €34 million was recognized in 2013, resulting in an investment value at December 31, 2013 of €103 million on the statement of financial positionn.
The Group's share of BPM's net loss (excluding the impairment loss) for the period was €13 million.
As a reminder, the BPM closing share price on the Milan Stock Exchange was 45 euro cents per share at December 31, 2013, representing a stock market value of the Group's investment of €100 million.
Banc o Popular Español (BPE)
BPE is consolidated as an associate in light of the significant influence relationship between it and the Group: Crédit Mutuel - CIC is represented on the BPE board of directors, the two groups have a banking joint ventureand there are numerous
cross-commercial agreements on the Franco-Spanish retail and corporate markets.
The investment's carrying amount reflects the Group's share of BPE's net assets (IFRS) up to its recoverable value, based on its value in use. This is calculated using projected future discounted cash flows distributable to shareholders, taking into
account regulatory requirements relating to credit institutions' equity levels. The cash flow discount rate was determined using the long-term interest rate on Spanish government debt, plus a BPE risk premium taking into account the sensitivity of
its share price to market risk, calculated by reference to the Ibex 35 index on the Madrid Stock Exchange.
The resulting value in use was €6.2 per BPE share, higher than the total investment value of €484 million recognized in the consolidated financial statements at December 31. Analysis of the sensitivity to the main parameters used in the model,
and to the discount rate in particular, indicated that a 50 basis point increase in the rate would result in an 4.5% decrease in the value in use. Similarly, a 1% decrease in the projected results in BPE's business plan would reduce the value in use by
1%. These two sensitivity analyses do not, however, call into question the equity-accounted value recognized in the Group's consolidated financial statements.
NOTE 16 - Investment property
Dec. 31, 2012
Historical cost
Accumulated depreciation and impairment provisions
Net amount
Additions
Other
Disposals
Dec. 31, 2013
movements
1,368
450
0
3
-201
-30
0
-3
1,821
-233
1,167
421
0
0
1,587
The fair value of investment property recognized at amortized costs was €2,236 million at December 31, 2013.
NOTE 17 - Property, equipment and intangible assets
17a - Property and equipment
Dec. 31, 2012
Additions
Other
Disposals
Dec. 31, 2013
movements
Historical cost
Land used in operations
Buildings used in operations
Other property and equipment
Total
392
7
-1
0
397
2,748
97
-21
0
2,825
1,268
73
-97
0
1,244
4,408
177
-119
0
4,466
Accumulated depreciation and impairment provisions
Land used in operations
Buildings used in operations
Other property and equipment
Total
Net amount
-2
0
0
0
-2
-1,538
-124
17
36
-1,608
-941
-64
57
-39
-987
-2,481
-188
74
-3
-2,597
1,928
-11
-44
-3
1,869
17b - Intangible assets
Dec. 31, 2012
Additions
Other
Disposals
Dec. 31, 2013
movements
Historical cost
. Internally developed intangible assets
. Purchased intangible assets
15
1
0
0
16
1,460
129
-18
-15
1,557
- software
472
11
-8
1
476
- other
988
118
-9
-16
1,081
1,475
130
-18
-15
1,572
Total
Accumulated amortization and impairment provisions
. Purchased intangible assets
-537
-117
14
9
-631
- software
-296
-62
7
-1
-352
- other
-241
-55
7
10
-279
-537
-117
14
9
-631
938
13
-3
-6
941
Total
Net amount
112
NOTE 18 - Goodwill
Dec. 31, 2012
Goodwill, gross
Impairment provisions
Goodwill, net
Goodwill as of
Subsidiaries
Other
Disposals
Dec. 31, 2013
movements
4,346
20
-1
-1
-182
0
0
0
-182
4,164
20
-1
-1
4,182
Additions
Dec. 31, 2012
Targobank Germany
Additions
Disposals
2763
4,364
Impairment
Other
Goodwill as of
losses/reversals
movements
Dec. 31, 2013
20
2,783
Crédit Industriel et Commercial (CIC)
506
506
Cofidis Participations
378
378
Targobank Spain (formerly Banco Popular Hipotecario)
183
183
CIC Private Banking - Banque Pasche
55
Banque Casino
26
26
CM-CIC Investissement
21
21
Monabanq
17
17
CIC Iberbanco
15
15
Banque de Luxembourg
13
13
Banque Transatlantique
6
6
Transatlantique Gestion
5
5
175
175
Other expenses
TOTAL
-1
4,164
20
-1
-1
0
-1
53
4,182
The cash generating units to which goodwill is assigned are tested annually to ascertain their recoverable value. A goodwill impairment loss is recognized if the recoverable amount is less than the carrying amount.
Recoverable value is calculated using two methods:
· Fair value minus selling costs, which is based on observing valuation multiples on comparable transactions or market parameters used by analysts on similar entities or activities;
. Value in use, which is determined by discounting expected future cash flows.
To calculate value in use, cash flows are based on business plans established by management for a maximum period of five years, then on projected cash flows to infinity based on a long-term growth rate. The long-term growth rate is set at
2% for all European entities, an assumption determined in comparison to the observed very-long-term inflation rate.
The cash flow discount rate is the cost of capital, which is calculated on the basis of a risk-free long-term rate, plus a risk premium determined from observation of the price sensitivity relative to the market for listed assets or by analysis
for unlisted assets.
The key sensitivity factors in the recoverable value test based on value in use are the discount rate and anticipated future flow levels. When value in use has been used for impairment testing purposes, the parameters and their sensitivity is
as follows:
Targobank
Germany
Network bank
Capital cost
Effect of 50 basis point increase in capital cost
Effect of 1% decrease in future cash flows
Targobank Spain
Cofidis
RMA W atanya
Network bank
Consumer credit
Insurance
(Morocco)
9.00%
10.50%
9.30%
12.25%
-353
-12
-132
-1
-52
-2
-20
-1
Goodwill relating to RMA Watanya was written down in the amount of €15 million in 2013; other goodwill amounts would not be affected in the worst-case scenarios considered.
NOTE 19 - Debt securities
Dec. 31, 2013
Retail certificates of deposit
Dec. 31, 2012
199
176
Interbank instruments and money market securities
47,965
49,526
Bonds
48,521
42,630
Accrued interest
TOTAL
1,272
1,211
97,957
93,543
NOTE 20 - Technical reserves of insurance companies
Dec. 31, 2013
Life
Dec. 31, 2012
57,808
53,772
Non-life
2,284
2,141
Unit of account
5,952
5,995
Other expenses
211
207
66,256
62,115
5,480
4,906
TOTAL
Of which deferred profit-sharing - liability
Reinsurers’ share of technical reserves
TOTAL - Net technical reserves
265
269
65,991
61,846
113
NOTE 21 - Provisions
Dec. 31, 2012
Provisions for risks
Reversals -
Reversals -
Additions
Other
provisions not
provisions used
Dec. 31, 2013
movements
used
298
93
-29
-82
-10
268
111
54
0
-50
1
116
0
1
0
0
0
1
On country risks
16
0
0
0
0
16
Provision for taxes
50
6
-8
-10
1
39
Provisions for claims and litigation
98
23
-19
-19
-12
71
Provision for risks on miscellaneous receivables
23
9
-2
-3
0
25
637
123
-22
-51
2
689
20
5
0
0
-1
24
Provisions for miscellaneous contingencies
322
50
-10
-36
8
334
Other provisions (1)
295
68
-12
-15
-5
331
577
43
-8
-9
-14
589
432
28
-2
-1
5
461
76
5
-5
-6
-5
65
43
4
0
-1
0
45
551
37
-8
-9
0
571
Provision for pension fund shortfalls (2)
26
5
0
0
-14
18
Sub-total recognized
26
5
0
0
-14
18
1,512
258
-59
-142
-23
1,547
Signature commitments
Financing and guarantee commitments
Other provisions
Provisions for home savings accounts and plans
Provision for retirement benefits
Retirement benefits - defined benefit and equivalent, excluding pension funds
Retirement bonuses
Supplementary retirement benefits
Long service awards (other long-term benefits)
Sub-total recognized
Supplementary retirement benefit - defined benefit, provided by Group's pension funds
Total
(1) Other provisions include provisions set aside in respect of economic interest groupings (EIG) totaling €273 million.
(2) The provision for pension fund shortfalls only covers foreign entities.
Assumptions used
2013
Discount rate(1)
3.0%
Annual increase in salaries (2)
2012
2.9%
Minimum 1.4%
Minimum 1.5%
(1) The discount rate used is the yield on long-term bonds issued by leading companies, estimated based on the Iboxx index.
(2) The annual increase in salaries is the estimated cumulative future salary inflation rate. It is also based on the age of employees.
Movements in provision for retirement bonuses
Dec. 31, 2012
Discounted
Financial
amount
income
Cost of
Other costs,
services
incl. past
performed
service
Actuarial gains (losses) relating
to changes in assumptions
demographic
financial
Payment to
Contributions
Mobility
beneficiaries
to the plan
transfer
Dec. 31, 2013
Other
Commitments
761
24
0
28
-2
9
-1
-35
0
1
21
Non-Group insurance contract and externally managed assets
329
0
11
0
0
0
3
0
4
0
0
346
Provisions
432
24
-11
28
-2
9
-4
-34
-4
1
21
461
Dec. 31, 2011
Commitments
626
Non-Group insurance contract and externally managed assets
312
Provisions
314
Discounted
Financial
amount
income
Cost of
Other costs,
services
incl. past
performed
service
28
23
Actuarial gains (losses)
21
110
0
8
21
102
14
28
-14
23
Payment to
Contributions
Mobility
beneficiaries
to the plan
transfer
-23
0
Other
0
Dec. 31, 2012
-24
-5
-23
5
806
0
761
0
329
-24
432
A change of plus or minus 50 basis points in the discount rate would result in, respectively, a fall of €48 million / an increase of €56 million in the commitment. The term of the commitments (excluding foreign
entities) is 17 years.
Change in the fair value of plan assets
Fair value of
in € thousands
assets
Dec. 31, 2012
Fair value of plan assets
assets
Dec. 31, 2011
Fair value of plan assets
Actuarial
Yield of plan
amount
gains (losses)
assets
458,600
Fair value of
in € thousands
Discounted
3,887
1,957
Actuarial
Yield of plan
amount
gains (losses)
assets
4,538
by plan
participants
15,853
Discounted
419,612
Contributions
6,889
Employer
Payment to
contributions
beneficiaries
3,044
Contributions
by plan
participants
15,947
23,156
Employer
Payment to
beneficiaries
23,350
Fair value of
Other
assets
effect
-20,533
contributions
-4,417
Foreign
exchange
Dec. 31, 2013
0
0
Foreign
Fair value of
exchange
Other
assets
effect
-7,319
485,963
Dec. 31, 2012
0
0
458,600
Details of the fair value of plan assets
Dec. 31, 2013
Debt
Equity
securities
instruments
Assets listed on an active market
75%
Assets not listed on an active market
0%
Total
75%
Dec. 31, 2012
Debt
Equity
securities
instruments
4%
77%
0%
0%
4%
77%
Real estate
Other
19%
0%
0%
1%
19%
1%
Real estate
Other
19%
0%
4%
0%
0%
0%
19%
1%
4%
114
Provisions for signature risk on home savings accounts and plans
Dec. 31, 2013
Dec. 31, 2012
Home savings plans
Contracted less than 10 years ago
3,421
Contracted more than 10 years ago
3,111
3,470
6,532
6,176
618
620
7,150
6,795
Total
Amounts outstanding under home savings accounts
Total
Home savings loans
Dec. 31, 2013
Balance of home savings loans giving rise to provisions for risks reported in assets
2,706
Dec. 31, 2012
146
Provisions for home savings accounts and plans
Jan. 1, 2013
On home savings accounts
7
On home savings plans
On home savings loans
Total
Net additions/
Other
reversals
movements
186
Dec. 31, 2012
3
10
8
2
10
5
(1)
4
20
4
24
Maturity analysis
Contracted less than 10 years ago
Contracted more than 10 years ago
0
8
2
10
0
Total
8
2
10
Home savings accounts (comptes épargne logement, CEL) and home savings plans (plans épargne logement, PEL) are French regulated savings products, allowing individual customers to invest over time in an
interest bearing account giving subsequent entitlement to a home loan. These products place a twofold commitment on the distributor:
– a commitment to provide a future return to depositors on amounts invested: fixed-rate for PEL and variable-rate (periodically reviewed based on benchmark indexes) for CEL.
– a commitment to lend to those customers on demand, on predetermined terms (for both CEL and PEL).
The commitments have been estimated on the basis of customer statistical behavior and market inputs.
A provision is established in the liabilities section of the statement of financial position to cover potential future costs arising from unfavorable conditions relating to these products, on the basis of interest rates
offered to individual customers on similar, non-regulated products. This approach is based on homogeneous generations of regulated terms for PEL. The impact on income is recognized as “interest due to
customers”.
The increase in provisions for risks during the fiscal year is mainly due to:
- A change to the behavioral law used for PEL deposits, which now reflects the correlation between PEL account closures (with no loan having been arranged) and interest rates: thus, when market rates are low, PEL
account holders are more inclined to maintain their best-remunerated deposits; this would result in an increase in the provision.
- An increase in the CEL provision due to a reduction in CEL loan interest rates resulting from a lower inflation rate: a higher provision is required when the spread widens between CEL loan rates and more
traditional housing loan rates.
NOTE 22 - Subordinated debt
Dec. 31, 2013
Subordinated debt
Dec. 31, 2012
3,971
Non-voting loan stock
Perpetual subordinated loan stock
Other debt
29
2,862
2,861
1
1
49
92
6,911
7,836
Accrued interest
TOTAL
4,853
28
Main subordinated debt issues
(in € millions)
Type
Issue
Amount
Amount as of
issued
date
Dec. 31, 2013 (1)
Rate
Maturity
Banque Fédérative du Crédit Mutuel
Subordinated note
Sep. 30, 2003
€800m
€791m
5.00
Sep. 30, 2015
Banque Fédérative du Crédit Mutuel
Subordinated note
Dec. 18, 2007
€300m
€300m
5.10
Dec. 18, 2015
Banque Fédérative du Crédit Mutuel
Subordinated note
June 16, 2008
€300m
€300m
5.50
June 16, 2016
Banque Fédérative du Crédit Mutuel
Subordinated note
Dec. 16, 2008
€500m
€500m
6.10
Dec. 16, 2016
Banque Fédérative du Crédit Mutuel
Subordinated note
Dec. 6, 2011
€1,000m
€1,000m
5.30
Dec. 6, 2018
Banque Fédérative du Crédit Mutuel
Subordinated note
Oct. 22, 2010
€1,000m
€916m
4.00
Oct. 22, 2020
CIC
Non-voting loan stock
May 28, 1985
€137m
€13m
(2)
(3)
Perpetual
CIC
June 30, 2013
€200m
€200m
(4)
No fixed maturity
CIC
subordinated note
subordinated note
June 30, 2013
€550m
€550m
(5)
No fixed maturity
Banque Fédérative du Crédit Mutuel
Loan
Dec. 28, 2005
€500m
€500m
(6)
No fixed maturity
Dec. 15, 2004
€750m
€750m
(7)
No fixed maturity
Perpetual
Deeply subordinated
Banque Fédérative du Crédit Mutuel
note
Deeply subordinated
Banque Fédérative du Crédit Mutuel
Feb. 25, 2005
€250m
€250m
(8)
No fixed maturity
Banque Fédérative du Crédit Mutuel
note
note
Deeply subordinated
April 28, 2005
€404m
€393m
(9)
No fixed maturity
Banque Fédérative du Crédit Mutuel
note
Oct. 17, 2008
€147m
€147m
(10)
No fixed maturity
Deeply subordinated
(1) Amounts net of intra-Group balances.
(2) Minimum 85% (TAM+TMO)/2 Maximum 130% (TAM+TMO)/2
(3) Non amortizable, but redeemable at borrower's discretion with effect from May 28, 1997 at 130% of par revalued by 1.5% annually for subsequent years.
(4) 6-month Euribor + 167 basis points.
(5) 6-month Euribor + 107 basis points for the first 10 years and + 207 basis points for subsequent years, unless redeemed.
(6) 1-year Euribor + 0.3 basis points.
(7) 10-year CMS ISDA CIC + 10 basis points.
(8) 10-year CMS ISDA + 10 basis points.
(9) Fixed-rate 4.471 until October 28, 2015 and thereafter 3-month Euribor + 185 basis points.
(10) 3-month Euribor + 665 basis points.
115
NOTE 23 - Shareholders' equity
23a - Shareholders' equity (excluding unrealized or deferred gains and losses) attributable to the Group
Dec. 31, 2013
. Capital stock and issue premiums
- Capital stock
- Issue premiums
Dec. 31, 2012
2,088
2,063
1,329
1,327
759
736
10,462
9,625
- Regulated reserves
7
7
- Translation reserve
0
0
10,459
9,621
. Consolidated reserves
- Other reserves (including effects related to first-time application of standards)
- Retained earnings
-4
-3
1,211
930
13,761
12,618
. Net income for the year
TOTAL
23b - Unrealized or deferred gains and losses
Dec. 31, 2013
Dec. 31, 2012
Unrealized or deferred gains and losses* relating to:
. Available-for-sale financial assets
- equities
803
582
99
-80
- bonds
. Hedging derivative instruments (cash flow hedges)
. Actuarial gains and losses
-24
-99
-132
-140
. Translation adjustments
13
23
-38
-56
722
230
. Share of unrealized or deferred gains and losses of associates
TOTAL
A ttributable to the Group
538
91
A ttributable to minority interests
184
138
* Net of tax.
23c - Recycling of gains and losses recognized directly in equity
Movements
Movements
2013
2012
Translation adjustments
- Reclassification in income
0
- Other movements
Translation adjustment
0
-10
2
-10
2
Remeasurement of available-for-sale financial assets
- Reclassification in income
- Other movements
Remeasurement of available-for-sale financial assets
38
8
363
1,420
401
1,428
0
0
Remeasurement of hedging derivative instruments
Reclassification in income
- Other movements
Remeasurement of hedging derivatives
- Share of unrealized or deferred gains and losses of associates
6
75
6
19
-19
19
-19
484
1,417
Share of unrealized or deferred gains and losses of associates
TOTAL - Recyclable gains and losses
75
- Remeasurement of non-current assets
0
0
- Actuarial gains and losses on defined benefit plans
9
-75
9
-75
493
1,341
TOTAL - Non-recyclable gains and losses
Total gains and losses recognized directly in shareholders'
equity
23d - Tax on components of gains and losses recognized directly in equity
Changes 2013
Changes 2012
Gross
Corporate
Net
Gross
Corporate
Net
amount
income tax
amount
amount
income tax
amount
Translation adjustments
-10
-10
2
Remeasurement of available-for-sale financial assets
505
-104
401
1,308
Remeasurement of hedging derivative instruments
77
-3
75
0
6
6
Actuarial gains and losses on defined benefit plans
12
-3
9
-99
23
-76
19
-19
-110
493
1192
149
1341
Share of unrealized or deferred gains and losses of associates
19
2
120
1428
-19
Total gains and losses recognized directly in shareholders'
equity
602
116
NOTE 24 - Commitments given and received
Commitments and guarantees given
Dec. 31, 2013
Dec. 31, 2012
Financing commitments
Commitments given to credit institutions
Commitments given to customers
3,776
3,815
39,510
37,090
Guarantee commitments
Guarantees given on behalf of credit institutions
1,999
1,317
14,779
13,309
Other commitments given
298
242
Commitments given by the Insurance business line
465
193
Guarantees given on behalf of customers
Commitments on securities
Commitments and guarantees received
Dec. 31, 2013
Dec. 31, 2012
Financing commitments
Commitments received from credit institutions
11,702
24,313
28,642
26,755
6,174
5,349
105
102
3,794
5,595
Guarantee commitments
Commitments received from credit institutions
From customers
Commitments on securities
Other commitments received
Commitments received by the Insurance business line
Securities sold under repurchase agreements
Dec. 31, 2013
Dec. 31, 2012
Amounts received under resale agreements
20,231
23,761
Related liabilities
20,326
24,165
Assets given as collateral for liabilities
Dec. 31, 2013
Loaned securities
Security deposits on market transactions
Dec. 31, 2012
1
Total
4
6,002
8,069
6,003
8,074
For the purposes of its refinancing activities, the group enters into repurchase agreements in respect of debt securities and/or equity securities. These agreements result in the transfer of the ownership of securities that the transferee may in turn
lend. Coupons and dividends are the property of the borrower. These transactions are subject to margin calls and the Group is exposed to the non-return of securities.
NOTE 25 - Interest income, interest expense and equivalent
Dec. 31, 2013
Income
Dec. 31, 2012
Expense
Income
Expense
. Credit institutions and central banks
1,210
-669
1,486
-1,486
. Customers
9,278
-4,471
9,405
-4,848
2,677
-2,375
2,681
-2,360
2,261
-2,082
3,215
-3,561
- of which finance leases and operating leases
. Hedging derivative instruments
. Available-for-sale financial assets
417
. Held-to-maturity financial assets
334
734
389
. Debt securities
-1,958
. Subordinated debt
TOTAL
-2,084
-81
13,501
-9,261
-94
15,229
-12,073
NOTE 26 - Fees and commissions
Dec. 31, 2013
Income
Credit institutions
Dec. 31, 2012
Expense
Income
Expense
9
-3
7
-3
952
-13
832
-10
Securities
685
-67
650
-69
of which funds managed for third parties
467
Customers
Derivative instruments
459
2
-4
3
-5
Foreign exchange
18
-2
15
-2
Financing and guarantee commitments
29
-26
27
-4
1,169
-666
1,162
-660
2,865
-780
2,696
-753
Services provided
TOTAL
NOTE 27 - Net gain (loss) on financial instruments at fair value through profit or loss
Dec. 31, 2013
Trading derivative instruments
Dec. 31, 2012
-316
665
132
181
Ineffective portion of hedging instruments
2
7
. Cash flow hedges
0
0
. Fair value hedges
3
7
. Change in fair value of hedged items
-298
-1,198
. Change in fair value of hedging items
301
1,205
Instruments designated under the fair value option (1)
Foreign exchange gains (losses)
Total changes in fair value
37
33
-145
886
(1) of which €105 million relating to the Private equity business line
117
NOTE 28 - Net gain (loss) on available-for-sale financial assets
Dec. 31, 2013
Dividends
Realized gains
Impairment
(losses)
losses
. Government securities, bonds and other fixed-income securities
Total
231
0
231
. Equities and other variable-income securities
15
19
33
67
. Long-term investments
31
-5
16
42
0
2
0
2
46
247
49
342
. Other
Total
Dec. 31, 2012
Dividends
. Government securities, bonds and other fixed-income securities
. Equities and other variable-income securities
. Long-term investments
. Other expenses
Total
Realized gains
Impairment
(losses)
losses
Total
89
0
7
15
20
89
41
64
41
11
116
0
-3
0
-4
71
141
31
243
NOTE 29 - Other income and expense
Dec. 31, 2013
Dec. 31, 2012
Income from other activities
. Insurance contracts
11,725
. Investment property
. Rebilled expenses
. Other income
Sub-total
9,822
2
1
67
63
788
876
12,581
10,762
-10,107
-8,246
-29
-22
-28
-22
Expenses on other activities
. Insurance contracts
. Investment property
- depreciation, amortization and impairment charges (based on the accounting method selected)
- losses on disposals
. Other expenses
Sub-total
Other income and expense, net
0
-1
-521
-563
-10,656
-8,831
1,925
1,930
Net income from the Insurance business line
Dec. 31, 2013
Earned premiums
Dec. 31, 2012
9,414
7,695
Claims and benefits expenses
-6,075
-5,591
Movements in provisions
-4,041
-2,657
Other technical and non-technical income and expense
Net investment income
Total
77
55
2,243
2,074
1,618
1,576
NOTE 30 - General operating expenses
Dec. 31, 2013
Dec. 31, 2012
Payroll costs
-2,829
Other operating expenses
-2,369
-2,321
-5,198
-5,140
TOTAL
-2,819
30a - Payroll costs
Dec. 31, 2013
Salaries and wages
Social security contributions (1)
Employee benefits - short-term
Dec. 31, 2012
-1,847
-1,824
-681
-711
-4
-4
Incentive bonuses and profit-sharing
-117
-113
Payroll taxes
-177
-161
Other expenses
TOTAL
-3
-6
-2,829
-2,819
(1) The CICE tax credit for competitiveness and employment is recognized as a credit to payroll costs and amounted to €23 million for fiscal year 2013.
The CICE enabled, in particular, the maintenance of or even an increase in financing for employee training at a level well above the regulatory levels and enhancement of the Group's overall competitiveness, particularly through:
- investment in new technologies such as digital applications (tablets) and videoconferencing systems on portable computers, enabling customers and shareholders to not only remain in closer contact with their account officers but also to
achieve energy savings
- IT developments concerning new telephone-based means of payment,
- research into new services benefiting our merchant customers,
- reductions in the cost of providing services to customers and shareholders in connection with prospecting in new national and international markets.
118
Number of employees
Average number of employees
Dec. 31, 2013
Banking staff
Management
Dec. 31, 2012
25,228
Total
14,458
25,858
14,400
39,686
40,258
28,577
11,109
29,271
10,987
39,686
40,258
Analysis by country
France
Rest of the world
Total
Includes 294 employees of Targobank Spain and 85 employees of Banque Casino, consolidated using the proportionate method.
Dec. 31, 2013
Number of employees at end of year*
Dec. 31, 2012
42,569
43,034
* The number of employees at the end of year corresponds to the total number of employees in all entities controlled by the Group as of December 31. In contrast, the consolidated average number of employees (full-time equivalent, or FTE) is
limited to the scope of financial consolidation (full or proportionate consolidation).
30b - Other operating expenses
Dec. 31, 2013
Dec. 31, 2012
Taxes and duties
-216
-221
External services
-1,888
-1,831
Other miscellaneous expenses (transportation, travel, etc.)
Total
15
20
-2,088
-2,032
30c - Depreciation, amortization and impairment of property, equipment and intangible assets
Dec. 31, 2013
Dec. 31, 2012
Depreciation and amortization
-278
-288
- property and equipment
-187
-199
- intangible assets
-91
-89
Impairment losses
-2
-1
- property and equipment
-3
0
1
-1
-280
-289
- intangible assets
Total
NOTE 31 - Net additions to/reversals from provisions for loan losses
Dec. 31, 2013
Additions
Credit institutions
Customers
. Finance leases
. Other customer items
Sub-total
Reversals
Loan losses
Loan losses not
Recoveries on
covered by
covered by
loans written off
provisions
provisions
in previous years
TOTAL
0
30
-1
0
0
29
-1,245
1,247
-717
-324
106
-933
-5
6
-4
-3
1
-6
-1,239
1,241
-712
-322
105
-927
-904
-1,245
1,277
-718
-324
106
Held-to-maturity financial assets
-3
0
0
0
0
-3
Available-for-sale financial assets
-14
3
-12
-39
15
-46
Other
-63
56
-2
-2
0
-12
Total
-1,325
1,336
-732
-365
121
-965
Dec. 31, 2012
Credit institutions
Customers
. Finance leases
. Other customer items
Sub-total
Held-to-maturity financial assets
Available-for-sale financial assets (1)
Additions
Reversals
Loan losses
Loan losses not
covered by
covered by
loans written off
provisions
provisions
in previous years
Recoveries on
TOTAL
-15
38
-3
0
0
20
-1,220
1,187
-618
-381
126
-905
-5
8
-5
-3
1
-4
-1,215
1,180
-613
-378
125
-900
-1,235
1,225
-620
-381
126
-885
0
0
0
0
0
0
-10
408
-473
-44
31
-89
Other
-46
60
0
-2
0
12
Total
-1,291
1,693
-1,094
-427
156
-962
(1) Including - €30 million arising from the sale of the Greek sovereign securities.
NOTE 32 - Gains (losses) on other assets
Dec. 31, 2013
Property, equipment and intangible assets
Dec. 31, 2012
5
12
. Losses on disposals
-5
-12
. Gains on disposals
10
24
Gain (loss) on consolidated securities sold
0
0
TOTAL
5
12
119
NOTE 33 - Change in value of goodwill
Dec. 31, 2013
Dec. 31, 2012
Impairment of goodwill
0
-27
TOTAL
0
-27
NOTE 34 - Corporate income tax
Breakdown of income tax expense
Dec. 31, 2013
Current taxes
Dec. 31, 2012
-828
-713
Deferred taxes
15
2
Adjustments in respect of prior years
-2
0
-816
-711
TOTAL
Reconciliation between the corporate income tax expense recognized and the theoretical tax expense
Dec. 31, 2013
Taxable income
Theoretical tax rate
Dec. 31, 2012
2,287
2,041
38.00%
36.10%
-869
-737
32
25
0
43
Theoretical tax expense
Impact of preferential “SCR” and “SICOMI” rates
Impact of the reduced rate on long-term capital gains
Impact of different tax rates paid by foreign subsidiaries
30
1
Permanent differences and other
-9
-43
Tax expense
Effective tax rate
-816
-711
35.69%
34.81%
NOTE 35 - Earnings per share
Dec. 31, 2013
Net income attributable to the Group
Dec. 31, 2012
1,211
930
Number of stock units at beginning of year
26,532,613
26,496,265
Number of stock units at end of year
26,585,134
26,532,613
Weighted average number of stock units
26,558,874
26,514,439
45.61
35.07
Basic earnings per share
Additional weighted average number of stock units assuming full dilution
Diluted earnings per share
0
0
45.61
35.07
NOTE 36 - Fair value hierarchy of financial instruments recognized at amortized cost or carrying amount
The estimated fair values presented are calculated based on observable parameters at December 31, 2013 and are obtained by co mputing estimated discounted future cash flows using a yield curve that
includes the signature risk inherent to the debtor.
The financial instruments discussed in this note relate to loans and borrowings. They do not include non-monetary elements (equities), trade payables, other assets, other liabilities and accruals. Nonfinancial instruments are not discussed in this section.
The fair value of financial instruments payable on demand and of regulated customer savings accounts corresponds to the value due to the customer, i.e. the carrying amount.
Certain group entities may also apply assumptions whereby fair value is deemed to equal the carrying amount for those contracts indexed to a floating rate, or whose residual life is one year or less.
We draw attention to the fact that, with the exception of financial assets held to maturity, financial instruments carried at amortized cost are not transferable or are not in practice traded before
maturity. Accordingly, gains and losses are not recognized.
However, should financial instruments carried at amortized cost be transferred, the selling price may be significantly different from the fair value calculated at December 31, 2013.
Dec. 31, 2013
Market value
Assets
Loans and receivables due from credit institutions
- Debt securities
- Loans and advances
Loans and receivables due from customers
- Debt securities
- Loans and advances
Held-to-maturity financial assets
Liabilities
Due to credit institutions
Carrying amount
Unrealized gains
or losses
Level 1
Level 2
Level 3
241,071
235,026
6,044
11,462
63,871
165,737
55,407
55,300
107
1,011
54,395
0
1,815
1,812
3
1,011
804
0
53,592
53,488
104
0
53,592
0
174,398
169,568
4,830
243
8,418
165,737
555
576
-21
243
119
193
173,843
168,992
4,851
0
8,299
165,544
11,267
10,159
1,108
10,208
1,059
0
273,810
269,965
3,845
709
185,660
87,442
19,951
19,880
71
0
19,951
0
Due to customers
144,868
145,217
-350
0
57,426
87,442
Debt securities
101,233
97,957
3,277
672
100,561
0
7,758
6,911
847
37
7,722
0
Subordinated debt
120
Dec. 31, 2012
Market value
Assets
Loans and receivables due from credit institutions
Loans and receivables due from customers
Held-to-maturity financial assets
Liabilities
Due to credit institutions
Due to customers
Debt securities
Carrying amount
Unrealized gains
or losses
252,275
248,071
70,666
70,703
4,204
-37
169,312
165,775
3,537
12,297
11,593
704
272,895
270,720
2,174
34,615
34,477
139
133,509
134,864
-1,355
96,643
93,543
3,099
8,128
7,836
291
Subordinated debt
NOTE 37 - Related party transactions
Statement of financial position items concerning related party transactions
Dec. 31, 2013
Companies
Companies
consolidated
consolidated using
using the equity the proportionate
method
Dec. 31, 2012
Other entities in the
Parent
Confédération
companies -
Nationale
CM11 Group
method
Companies
Companies
Other entities in
consolidated
consolidated
using the equity
method
using the
proportionate
the
Parent companies -
Confédération
CM11 Group
Nationale
method
Assets
Loans, advances and securities
Loans and receivables due from credit institutions
27
280
2,588
36,688
0
271
3,152
Loans and receivables due from customers
29
3
32
0
32
0
36
0
0
0
389
1,281
0
0
360
1597
Securities
Other assets
Total
38,328
2
2
150
0
1
2
36
0
58
285
3,159
37,969
32
272
3,585
39,925
Liabilities
Deposits
Due to credit institutions
2
2
4,782
2,822
0
3
3,443
7,766
250
7
2,059
27
154
4
2,053
26
Debt securities
0
0
1,429
0
0
0
1,217
0
Other liabilities
43
0
87
1,250
39
0
207
1,250
295
9
8,356
4,099
194
6
6,921
9,041
Financing commitments given
9
162
11
2,200
0
76
0
2,200
Guarantee commitments given
0
14
409
0
0
21
0
0
Guarantee commitments received
0
0
380
950
0
0
282
748
Due to customers
Total
Financing and guarantee commitments
Income statement items concerning related party transactions
Dec. 31, 2013
Companies
Companies
consolidated
consolidated using
using the equity the proportionate
method
Interest received
Interest paid
Fees and commissions received
Dec. 31, 2012
Companies
Other entities in the
Parent
Confédération
companies -
Nationale
CM11 Group
method
Companies
Other entities in
consolidated
consolidated
using the equity
method
using the
proportionate
the
Parent companies -
Confédération
CM11 Group
Nationale
method
7
4
50
985
9
1
51
1,220
-4
0
-77
-95
-2
0
-87
-160
12
1
0
12
11
0
0
22
-18
0
-5
-203
-15
0
-6
-199
2
-2
0
54
10
0
1
10
General operating expenses
-339
5
0
-39
-311
7
0
-38
Total
-339
9
-32
714
-298
8
-41
856
Fees and commissions paid
Other income (expense)
Other entities in the Confédération Nationale comprise Caisse Centrale de Crédit Mutuel and Crédit Mutuel's regional federations not associated with the CM11-CIC Group.
The relationships with the parent companies mainly consist of loans and borrowings relating to cash management activities.
In the case of companies consolidated using the proportionate method (Banque Casino, Bancas and Targobank Spain) the amounts comprise the portion of intercompany transactions not eliminated on consolidation.
121
Relationships with the Group's key management
In the context of regulatory changes (CRBF regulation 97-02) and to comply with professional recommendations, the Group's deliberative bodies and, more particularly, the Banque Fédérative board of directors
have entered into commitments concerning the compensation of market professionals and of its officers and directors.
These commitments have been disclosed to the AMF and on the institution's website. Compensation received by BFCM group officers and directors in 2013 includes a portion related to their activities at Crédit
Mutuel and CIC. It may include a fixed and a variable portion. This compensation is set by the deliberative bodies of BFCM and CIC based on proposals from compensation committees of the respective boards of
directors. No variable compensation has been paid in the last two years.
The Group’s officers and directors may also benefit from the accidental death and disability and supplementary retirement benefit plans made available to all Group employees.
However, the Group’s officers and directors did not receive any other specific benefits. They did not receive any equity securities, warrants or options to purchase BFCM or CIC shares. In addition, they do not
receive any attendance fees in consideration of their board terms of office, whether the boards are of Group companies or companies outside the Group but on whose board they sit as a result of their functions
within the Group. The group’s key executives may also hold assets with, and receive loans from, the group banks on the same terms as those offered to employees in general.
Dec. 31, 2013
Total compensation paid to key management*
Amounts in € thousands
Dec. 31, 2012
Total
Total
compensation
compensation
Corporate officers - Management Committee - Board members who receive compensation
5,514
5,267
* See also the section on corporate governance.
At its meeting of May 19, 2011, the Board of Directors of CIC approved a severance payment in case of termination of Mr. Lucas' term of office as CEO, subject to a performance-related condition and representing
one year of his compensation as a corporate officer, i.e., a commitment currently estimated at €770,000 (including social contributions).
At its meeting of May 8, 2011, the Board of Directors of BCFM approved a severance payment in case of termination of Mr. Fradin's term of office as COO, subject to a performance-related condition and
representing one year of his compensation as a corporate officer, i.e., a commitment currently estimated at €1,120,000 (including social contributions). Mr. Fradin is also covered by a supplementary pension plan
within the framework of his corporate office, the conditions of which are the same as those that apply to the other employees of BFCM and for which the contributions paid to the insurance company covering this
entire commitment amounted to €17,923 in 2013.
NOTE 38 - Events after the reporting period and other information
The consolidated financial statements of the BFCM group at December 31, 2013 were approved by the Board of Directors at its meeting of February 27, 2014.
NOTE 39 - Exposure to risk
The risk exposure information required by IFRS 7 is included in Section 4 of the management report.
NOTE 40 - Statutory auditors' fees
(in € thousands, excluding VAT)
ERNST & YOUNG
Amount
2013
KPMG AUDIT
%
2012
2013
Amount
2012
2013
%
2012
2013
2012
Audit
Statutory audit and contractual audits
- BFCM
171
174
5%
5%
128
173
3%
4%
2,553
2,557
75%
80%
3,963
3,650
78%
76%
- BFCM
302
237
9%
7%
95
249
2%
5%
- Fully consolidated subsidiaries
343
152
10%
5%
282
149
6%
3%
3,369
3,120
98%
98%
4,468
4,221
87%
88%
- Fully consolidated subsidiaries
Other assignments and services directly related to the
statutory audit(1)
Sub-total
Other services provided by the networks to fully
consolidated subsidiaries
- Legal, tax and corporate advisory services
32
0
1%
0%
85
19
2%
0%
- Other
22
73
1%
2%
556
553
11%
12%
Sub-total
Total
55
73
2%
2%
641
572
13%
12%
3,424
3,193
100%
100%
5,109
4,793
100%
100%
(1) Other assignments and services directly related to the statutory audit essentially consisted of assignments undertaken at the request of the supervisory authority to ensure compliance of the organization and its processes with regulatory
requirements.
The total audit fees paid to auditors which are not members of the network of one of the auditors certifying the consolidated and individual financial statements of BFCM, mentioned in the table above, amounted to €6,787 thousand for the fiscal
year 2013.
122
III.6 - Report of the Statutory Auditors on the consolidated financial statements of
BFCM Group
KPMG Audit
A unit of KPMG S.A.
1, cours Valmy
92923 Paris – La Défense Cedex
Statutory Auditors
Member of the Versailles
regional institute of accountants
ERNST & YOUNG et Autres
1/2, place des Saisons
92400 Courbevoie – Paris-La Défense 1
S.A.S. à capital variable (Simplified stock company with
variable capital)
Statutory Auditors
Member of the Versailles
regional institute of accountants
Banque Fédérative du Crédit Mutuel
Year ended Tuesday, December 31, 2013
Report of the Statutory Auditors on the Consolidated Financial Statements
To the Shareholders,
In compliance with the assignment entrusted to us by your general meeting of shareholders, we hereby report
to you for the year ended December 31, 2013 on:
the audit of the accompanying consolidated financial statements of Banque Fédérative du Crédit
Mutuel;
the justification of our assessments;
the specific verification required by law.
The consolidated financial statements have been approved by the Board of Directors. Our role is to express
an opinion on these financial statements based on our audit.
I.
Opinion on the consolidated financial statements
We conducted our audit in accordance with professional standards applicable in France; those standards
require that we plan and perform the audit to obtain reasonable assurance about whether the consolidated
financial statements are free of material misstatement. An audit involves performing procedures, using
sampling techniques or other methods of selection, to obtain audit evidence about the amounts and
disclosures in the consolidated financial statements. An audit also includes evaluating the appropriateness of
accounting policies used and the reasonableness of accounting estimates made, as well as the overall
presentation of the financial statements. We believe that the audit evidence we have obtained is sufficient and
appropriate to provide a basis for our audit opinion.
In our opinion, the consolidated financial statements give a true and fair view of the assets and liabilities and
of the financial position of the Group as at December 31, 2013 and of the results of its operations for the year
then ended in accordance with International Financial Reporting Standards as adopted by the European
Union.
II.
Justification of our assessments
In accordance with the provisions of Article L. 823-9 of the French Commercial Code (Code de commerce)
relating to the justification of our assessments, we draw your attention to the following points:
123
The Group uses internal models and methods to value positions in financial instruments that are not
listed on active markets, as well as to recognize certain provisions, as described in Notes 1.3 and 12
to the consolidated financial statements. We examined the control systems applied to these models
and methods, the parameters used and the identification of the financial instruments to which they
apply.
The Group recognizes impairment losses on assets available for sale when there is an objective
indication of a prolonged or significant reduction in the value of these assets (Notes 1.3 and 7 to the
consolidated financial statements). We examined the control systems applicable to the identification
of loss of value indices, the valuation of the most significant items, and the estimates which led, if
applicable, to the recognition of impairment provisions to cover losses in value.
The Group carried out impairment tests on goodwill and investments held, which resulted, where
relevant, in the recognition of impairment provisions in respect of this financial year (Notes 1.3 and
18 to the consolidated financial statements). We examined the methods used to implement these
tests, the main assumptions and parameters used and the resulting estimates that led, where
applicable, to impairment losses.
The Group records impairment losses to cover the credit and counterparty risks inherent to its
business (Notes 1.3, 8a, 10, 21 and 31 to the consolidated financial statements). We examined the
control systems applicable to the monitoring of credit and counterparty risk, the impairment
methodologies and the coverage of losses in value by individual and collective impairment
provisions.
The Group records provisions for employee benefit obligations (Notes 1.3 and 21 to the consolidated
financial statements). We examined the method used to assess these obligations, as well as the main
assumptions and calculation methods used.
These assessments were made as part of our audit of the consolidated financial statements taken as a whole,
and therefore contributed to the opinion we formed which is expressed in the first part of this report.
III. Specific verification
As required by law, we have also verified in accordance with professional standards applicable in France the
information presented in the Group’s management report.
We have no matters to report as to the fair presentation of this information and its consistency with the
consolidated financial statements.
Paris-La Défense, April 14, 2014.
The Statutory Auditors
KPMG Audit
A unit of KPMG S.A.
Arnaud Bourdeille
ERNST & YOUNG et Autres
Olivier Durand
124
IV. KEY FINANCIAL
POINTS RELATING
TO BFCM'S ANNUAL
FINANCIAL
STATEMENTS
125
IV.1 - Management report on BFCM's annual financial statements
IV.1.1 - Statement of Financial Position
The statement of financial position at December 31, 2013 showed total assets of €168.5 billion, up by 3.8%
compared with the previous year.
On the liabilities side, amounts due to credit institutions totaled €55 billion and consisted mainly of longterm borrowings from the Group’s subsidiaries (€43.9 billion), the majority of which came from CIC and its
regional banks (€13.4 billion) and CM-CIC Home Loan SFH (€25.2 billion).
Amounts due to customers totaled €31.8 billion. This item consists essentially of demand deposits (€5.6
billion) and term accounts and loans of the financial clientele (€25.7 billion).
Total securities liabilities amounted to €66.1 billion and included interbank market securities (€9.5 billion),
debt securities (€23.8 billion) along with bond debt (€32.8 billion).
The Fund for General Banking Risks amounting to €61.6 million and the deeply subordinated notes totaling
€2.1 billion remained unchanged. After a capital increase in July 2013 of €2.6 million, reserved to Caisse
Régionale de Crédit Mutuel Anjou, total shareholders’ equity and similar items amounted to €6.8 billion.
On the assets side, the CM11-CIC Group’s central treasury function is reflected mainly by loans and
receivables from credit institutions in the amount of €99.1 billion. The refinancing provided to Caisse
Fédérale de Crédit Mutuel to back the loans distributed by the Caisses de Crédit Mutuel and ensure the
liquidity of Caisse Fédérale de Crédit Mutuel amounted to €36 billion. BFCM’s term refinancing activity
also extends to Banque Européenne de Crédit Mutuel (€3.4 billion), Sofemo (€1 billion), the CIC Group (€45
billion), the Cofidis Group (€6.1 billion), the Casino Group (€0.5 billion) and other federal Caisses (€2.6
billion).
Loans and receivables due from customers totaled €6.8 billion. This amount corresponds to credit facilities,
mainly targeting large corporates, as well as the refinancing of special purpose acquisition entities for
BFCM’s long-term equity investments.
Trading, available-for-sale and held-to-maturity securities constitute the other uses of treasury funds and
totaled €43 billion.
Investments in subsidiaries and associates, which totaled €7.1 billion, consist mainly of investments in CIC
(€2.9 billion), Groupe des Assurances du Crédit Mutuel (€1 billion) and Cofidis Group (€1 billion). Other
equity investments stood at €2 billion. This item is made up primarily of interests in Banque Marocaine du
Commerce Extérieur, Banque de Tunisie and Banco Popular Español.
Articles L 441-6-1 and D 441-4 of the French Commercial Code require companies to provide specific
information on the maturity dates of the amounts due to suppliers. In the case of our company, the amounts
are negligible.
IV.1.2 - Notes to the income statement
Interest and similar income totaled €8.7 billion, including €7.8 billion from transactions with credit
institutions.
Interest expense was €8.9 billion, of which the bulk related to interest payable to credit institutions
(€6.7 billion) and interest on securities issued (€1.6 billion).
Income from variable-income securities (equities) was mainly comprised of dividends received from BFCM
subsidiaries.
The positive impact of €45.5 million on trading securities is primarily due to reversals of provisions for the
bond portfolio hedged by swaps, which were set aside for prudential reasons in 2012.
Similarly, gains on available-for-sale securities (€97.3 million) consisted mainly of reversals of provisions
for impairment losses (€43.6 million) and gains on disposals of securities (€54.2 million).
After taking commissions and other operating items into account, net banking income stood at
€383.4 million in 2012.
Operating expenses totaled €53.2 million in 2013, compared with €55.9 million in the previous year.
126
Net additions to provisions for loan losses amounted to €10.4 million in 2013 and related mainly to
provisions for loan losses on loans distributed abroad by one o the Group’s subsidiaries.
The balance of gains and losses on non-current assets mainly corresponds to losses on disposals of securities
for €20.2 million and additions to provisions for €27.3 million.
In addition, €15,296 corresponding to non-deductible rents and depreciation on company vehicles was
reintegrated into taxable income at the standard rate under ordinary French law.
Tax liability of the companies included in the consolidated tax group was attributed to BFCM’s tax liability,
which resulted in a €35 million income tax benefit.
Lastly, net income for the year came to €311.5 million in 2013.
IV.1.3 - Proposals of the Board of Directors to the Shareholders’ General Meeting
The appropriation of income proposed to the Shareholders’ General Meeting concerned the following
amounts:
2013 net income:
Retained earnings:
€311,481,573.22
+€ 653,565.20
Total:
€312,135,138.42
We propose to:
- pay out a dividend of €4.90 per each of the 26,532,613 shares carrying dividend rights for the
full year and a dividend of €2.04 per each of the 52,521 new shares entitled to dividends from
July 29, 2013, for a total amount of €130,116,946.54. These dividends are eligible for deduction
under Article 158 of the French General Tax Code (Code général des impôts - CGI);
- allocate to the legal reserve the amount of €262,605.00, bringing this reserve to 10% of BFCM’s
share capital;
- transfer €181 million to the optional reserve;
- carry forward the balance of €755,586.88.
In accordance with applicable legal provisions, we remind you that the dividends per share paid out during
the past three years were as follows:
Exercice
Montant en €
Dividende éligible à l'abattement
prévu par l'article 158 du CGI
2010
2011
2012
-
2,00 €
2,65 €
-
oui
oui
127
IV.2 - BFCM’s financial statements
IV.2.1 - Annual financial statements
ASSETS
Dec. 31, 2013
Dec. 31, 2012
(in €)
CASH, CENTRAL BANKS, POST OFFICE BANKS
2,676,235,098.96
218,659,164.54
GOVERNMENT SECURITIES AND EQUIVALENT
13,762,127,916.91
2,476,328,859.97
LOANS AND RECEIVABLES DUE FROM CREDIT INSTITUTIONS
99,132,405,498.18
107,915,494,372.03
6,832,584,448.42
7,194,632,314.70
30,948,687,408.53
32,546,760,340.37
287,173,401.97
285,359,413.32
LONG-TERM EQUITY INVESTMENTS AND SECURITIES
1,987,086,810.25
1,847,513,671.13
INVESTMENTS IN SUBSIDIARIES AND ASSOCIATES
7,054,999,107.67
6,915,970,538.76
FINANCE LEASES AND LEASES WITH PURCHASE OPTION
0.00
0.00
OPERATING LEASES
0.00
0.00
INTANGIBLE ASSETS
3,000,141.00
3,000,141.00
PROPERTY AND EQUIPMENT
6,850,317.44
6,898,833.02
SUBSCRIBED CAPITAL UNPAID
0.00
0.00
TREASURY STOCK
0.00
0.00
OTHER ASSETS
3,924,507,803.65
976,661,317.90
ACCRUALS
1,922,761,484.13
1,994,919,807.36
168,538,419,437.11
162,382,198,774.10
LOANS AND RECEIVABLES DUE FROM CUSTOMERS
BONDS AND OTHER FIXED-INCOME SECURITIES
EQUITIES AND OTHER VARIABLE-INCOME SECURITIES
TOTAL ASSETS
OFF-STATEMENT OF FINANCIAL POSITION
Dec. 31, 2013
Dec. 31, 2012
14,582,590,597.26
14,101,538,786.67
3,929,917,749.97
3,303,992,934.95
0.00
0.00
COMMITMENTS GIVEN
FINANCING COMMITMENTS
GUARANTEE COMMITMENTS
SECURITIES COMMITMENTS
128
LIABILITIES AND SHAREHOLDERS' EQUITY
Dec. 31, 2013
Dec. 31, 2012
(in €)
CENTRAL BANKS, POST OFFICE BANKS
0.00
0.00
DUE TO CREDIT INSTITUTIONS
54,985,771,888.10
56,469,898,662.74
DUE TO CUSTOMERS
31,769,452,871.82
27,697,119,663.47
DEBT SECURITIES
67,051,353,138.75
62,275,855,453.68
OTHER LIABILITIES
1,066,142,602.97
2,013,195,417.07
ACCRUALS
1,643,516,747.17
1,433,818,796.38
55,737,572.14
71,624,596.66
7,305,998,611.62
8,026,435,217.69
61,552,244.43
61,552,244.43
4,598,893,760.11
4,332,698,721.98
1,329,256,700.00
1,326,630,650.00
758,683,732.87
736,309,782.87
2,198,623,778.82
1,619,442,038.82
0.00
0.00
REGUL. PROVISIONS AND INVESTMENT SUBSIDIES
194,410.00
217,500.00
UNAPPROPRIATED RETAINED EARNINGS
653,565.20
702,260.27
311,481,573.22
649,396,490.02
168,538,419,437.11
162,382,198,774.10
PROVISIONS FOR RISKS AND CHARGES
SUBORDINATED DEBT
FUND FOR GENERAL BANKING RISK (FGBR)
SHAREHOLDERS' EQUITY EXCLUDING FGBR
SUBSCRIBED CAPITAL
ISSUE PREMIUMS
RESERVES
REVALUATION RESERVES
NET INCOME FOR THE YEAR
TOTAL LIABILITIES AND SHAREHOLDERS' EQUITY
OFF-STATEMENT OF FINANCIAL POSITION
Dec. 31, 2013
Dec. 31, 2012
11,159,398,029.40
24,046,932,141.65
GUARANTEE COMMITMENTS
8,115,644.05
16,429,928.04
SECURITIES COMMITMENTS
40,454,644.34
125,592,056.68
COMMITMENTS RECEIVED
FINANCING COMMITMENTS
129
INCOME STATEMENT
Dec. 31, 2013
Dec. 31, 2012
(in €)
+ INTERES T INCOME
8,724,028,263.43
9,441,383,580.81
- INTERES T EXPENS E
-8,887,846,697.41
-9,674,941,445.01
+ INCOME FROM LEAS E AND S ALE AND LEAS EBACK TRANS ACTIONS
0.00
0.00
- EXPENS ES ON LEAS E AND S ALE AND LEAS EBACK TRANS ACTIONS
0.00
0.00
+ INCOME FROM OPERATING LEAS E TRANS ACTIONS
0.00
0.00
- EXPENS ES ON OPERATING LEAS E TRANS ACTIONS
0.00
0.00
398,767,359.18
412,798,979.99
+ FEE AND COMMIS S ION INCOME
52,654,384.62
32,074,069.97
- FEE AND COMMIS S ION EXPENS E
-40,322,184.51
-28,969,038.61
+/- GAINS (LOS S ES ) ON TRADING S ECURITIES TRANS ACTIONS
45,522,675.70
149,917,416.44
+/- GAINS (LOS S ES ) ON AVAILABLE-FOR-S ALE S ECURITIES TRANS ACTIONS
97,298,237.81
290,279,090.26
+ OTHER OPERATING INCOME
2,080,330.81
742,991.21
- OTHER OPERATING EXPENS ES
-8,821,768.84
-9,338,499.10
+ INCOME FROM VARIABLE-INCOME S ECURITIES
NET BANKING INCOME
- OPERATING EXPENS ES
- DEPRECIATION, AMORTIZATION AND IMPAIRMENT
OF NON-CURRENT AS S ETS
GROSS OPERATING INCOME
+/- NET ADDITIONS TO/REVERS ALS FROM PROVIS IONS FOR LOAN LOS S ES
OPERATING INCOME
+/- GAINS (LOS S ES ) ON NON-CURRENT AS S ETS
NET INCOME BEFORE TAX
+/- NON-RECURRING INCOME (LOS S )
- CORPORATE INCOME TAX
+/- NET ALLOCATIONS TO/RELEAS ES FROM FGBR AND REGULATED PROV.
NET INCOME
383,360,600.79
613,947,145.96
-53,093,131.54
-55,827,501.94
-49,384.74
-55,397.26
330,218,084.51
-10,460,216.52
319,757,867.99
-47,464,947.98
272,292,920.01
558,064,246.76
2,837,232.29
560,901,479.05
75,482,588.18
636,384,067.23
4,136,240.58
-1,375,489.15
35,029,322.63
14,371,909.94
23,090.00
16,002.00
311,481,573.22
649,396,490.02
130
IV.2.2 - Notes to the BFCM’s financial statements
Note 1 Accounting policies and methods
The financial statements of Banque Fédérative du Crédit Mutuel (BFCM) are prepared in accordance
with the general accounting principles and rules promulgated by the Accounting Standards Authority
(Autorité des Normes Comptables - ANC) approved by ministerial decree.
They are prepared on the basis of the prudence principle and the following fundamental principles:
- going concern,
- consistency,
- accruals.
Note 1.1. Measurement of receivables and payables and use of estimates for the preparation of the
financial statements
Receivables and payables pertaining to customers and credit institutions are recognized on the statement
of financial position at fair value or cost, if it is different from fair value.
Related accruals (accrued or outstanding interest due or payable) are combined with the corresponding
asset and liability items.
The preparation of the financial statements may require the use of assumptions and estimates that have a
material impact on income and expenses and of assets and liabilities in the statement of financial
position and notes to the financial statements. In that case, management uses its judgment and
experience to apply readily available information at the time of preparation of the financial statements in
order to arrive at the necessary estimates.
Such is the case in particular for:
- the fair value of financial instruments not quoted on an active market;
- pension plans and other future employee benefits;
- the measurement of equity interests;
- provisions for risks and charges.
Note 1.2 Non-performing loans
All types of receivables are downgraded to non-performing status in the following situations:
payment arrears of more than nine months for loans to local authorities, more than six months for
home loans, and more than three months for other loans;
- when the receivable is subject to a legal dispute (notification procedures, adjustment, court-order
liquidation, etc.);
- when the receivable presents other risks of total or partial non-recovery.
When a loan to an individual or legal entity is classified as non-performing, all commitments to that
person or legal entity are reclassified as non-performing.
-
Impairment charges are recorded on non-performing receivables on an individual basis for each
receivable.
Interest on unsettled, non-performing receivables and recognized on the income statement is covered by
impairment charges for the full amount recognized. Impairment charges and releases of impairment,
losses on non-recoverable receivables and recoveries on impaired receivables related to interest on nonperforming receivables are recognized under “Interest income” on the income statement.
Provisions are recognized on the principal of the receivable based on the most likely estimate of
impairment, in accordance with general prudential principles. The impairment calculation takes into
account the net realizable value of personal or real guarantees related to the receivable.
The established provision covers the estimated loss, discounted using the original interest rate of the
credit. Estimated losses are equivalent to the difference between the initial contractual cash flows and
estimated recovery cash flows. The determination of the recovery cash flows is based in particular on
131
statistics that make it possible to estimate average recovery rates over time starting from the time when
the credit was downgraded to non-performing. A net release of provision following the passage of time
is recognized in net banking income.
In accordance with CRC Regulation No. 2002/03 as amended, non-performing loans that have been
declared past due or classified as non-performing for more than one year are specifically identified as
“irrecoverable non-performing loans.” The bank has defined internal rules for automatic downgrades,
which presume the irrecoverable nature of the receivable once it has been classified as non-performing
for more than one year, unless the existence and validity of guarantees covering all the risks can be
formally demonstrated. The recognition of interest on the receivable ceases once the loan has been
classified as an “irrecoverable non-performing loan.”
CRC Regulation 2002/03 as amended calls for special treatment of some restructured loans. If the
amount involved is significant, the restructured loans are isolated in a special category. In that case, the
waiver of claims to the principal or interest, outstanding or accrued, as well as future interest
differences, are immediately recognized through loss, then gradually reintegrated as the loan is paid
down. The number of loans involved and amounts at stake are limited, and the calculation of a discount
would not have a material impact on the financial statements for the year.
Note 1.3 Securities transactions
Statement of financial position items:
- Government securities and similar instruments
- Bonds and other fixed-income securities
- Equities and other variable-income securities
include trading, available-for-sale and held-to-maturity securities, depending on their nature.
This classification results from the application of CRBF Regulation 90/01 as amended, which establishes
guidelines for the classification of securities depending on their use.
Trading securities
This portfolio includes securities purchased or sold with the intention of a resale or repurchase within a short
time period (typically less than six months) and that are negotiable on a market whose liquidity is assured.
They are initially recognized at cost plus any acquisition costs and accrued interest. At the reporting date,
trading securities are measured at fair value. The net gains and losses from changes in their value are shown
through profit and loss.
Available-for-sale securities
Available-for-sale securities are acquired with the intention of being held for more than six months in order
to derive direct income or a capital gain. This holding period does not imply, for fixed-income securities, that
they be held until maturity. Premiums or discounts recognized at the time fixed-income securities are
acquired are spread over the life of the corresponding instrument, in accordance with the option offered by
CRBF Regulation 90/01. at the end of the reporting period, an individual provision is recognized for
unrealized capital losses on available-for-sale securities, adjusted for any impairment charges and net
releases of differences described above. Unrealized gains are not recognized.
Held-to-maturity securities
This portfolio includes fixed-income securities acquired with the intention of being held for the long term,
typically until maturity, and for which either matching long-term financing resources or a permanent interest
rate hedge exist. The difference recorded between the acquisition cost and the redemption value is spread
over the life of the security. No impairment losses are recognized for unrealized capital losses.
Treasury bills, marketable debt securities and interbank market instruments classified in the available-forsale and held-to-maturity portfolios are recognized at cost, including accrued interest at the time of purchase.
Interest income is calculated at the negotiated rate, while the amount of the premium or discount is amortized
using the actuarial method.
132
Bonds included in the available-for-sale and held-to-maturity portfolios are recognized excluding accrued
interest. Interest income is calculated at the nominal rate of the securities. When the acquisition price differs
from the redemption value, this difference is amortized using the straight-line method and shown through
profit or loss.
Securities denominated in foreign currencies are measured using the exchange rate on the reporting date or
the most recent date. Measurement differences are shown through profit and loss on financial transactions.
Reclassification of financial assets
In order to ensure greater harmonization and consistency with IFRS, the French National Accounting
Council (CNC) published regulation 2008-17 of December 10, 2008 amending regulation 90-01 of the
French Banking Regulatory Committee (CRB) related to the recognition of securities transactions. This
regulation repeats the provisions of Opinion 2008-19 of December 8, 2008 relative to the reclassification of
securities from the “trading securities” and “available-for-sale” categories.
The reclassification from the trading securities category to the held-to-maturity or available-for-sale
categories is now possible in the following two cases:
a) in extraordinary market situations that require a change in strategy
b) when, following their acquisition, fixed-income securities are no longer traded on an active
market, and if the institution intends and has the capacity to hold them for the foreseeable future or
until maturity.
The effective date of the reclassification from the above-mentioned “trading securities” and “available-forsale” categories may not be before July 1, 2008 and must be the same as that used for the institution in the
consolidated financial statements.
At the close of the accounting period during which the reclassification from the “trading securities” and
“available-for-sale” categories occurred, and at the end of each reporting period thereafter until such time as
the securities are de-recognized from the statement of financial position through a sale, full redemption or
impairment, the unrealized gain or loss that would have been shown through profit or loss if the trading
security had not been reclassified or the unrealized loss that would have been shown through loss if the
available-for-sale security had not been reclassified, as well as the profit, loss, income and expense shown
through profit and loss are presented in the notes to the financial statements.
The impact of reclassifications made in 2013 is presented in note 2.9.
Temporary sales of securities
Temporary sales of securities are designed to guarantee loans and treasury borrowings through securities.
They generally take two distinct forms, depending on the legal mechanism used, namely:
- sale and repurchase agreements; and
- securities lending and borrowing.
Sale and repurchase agreements consist legally of selling full ownership of the securities, with the buyer
making an irrevocable commitment to retrocede them and the seller to repurchase them, at an agreed-upon
price and date at the time the agreement is entered into. From an accounting standpoint, the securities given
through a repurchase agreement continue to be recognized on their original line item and measured based on
the rules of the portfolio in which they are classified. Meanwhile, the liability representing the amount
deposited is recorded under liabilities. The receivable representing a repurchase agreement on securities
received is recognized under assets.
Securities loans are consumer loans subject to the provisions of the French Civil Code, under which the
borrower irrevocably commits to returning the borrowed securities at the end of the loan period. These loans
are generally secured through a cash payment, which is held by the lender in the event of a default by the
borrower. In that case, the transaction is likened to a sale and repurchase agreement and recorded as such for
accounting purposes.
133
Note 1.4 Fees and commissions
Premiums paid or received are recognized on the statement of financial position upon payment or deposit. At
the time of settlement, they are immediately shown through profit or loss if they involve speculative
transactions.
Premiums on unsettled options are measured at the reporting date when they are traded on an organized
market. The difference is shown through profit and loss.
Note 1.5 Investments in equity interests
Investments in subsidiaries and other equity interests are measured at cost. Individual impairment is
recognized when their fair value, measured in relation to the net financial position and/or future outlook, falls
below the acquisition price.
Note 1.6 Non-current assets
In accordance with CRC Regulation 2002-10, property and equipment is depreciated over the useful life
corresponding to the asset’s actual period of use and taking into account, where applicable, any residual
value. In the event that components of an asset have different useful lives, each is recognized separately and
depreciated accordingly. Unscheduled depreciation may be applied in cases authorized by regulations if the
allowed useful life for tax purposes is shorter than the useful life of the asset or component.
When indications of impairment arise, such as a loss in market value, an asset’s obsolescence or physical
deterioration, changes in the asset’s utilization methods, etc., an impairment test designed to compare the
carrying value of the asset relative to its current value is performed. If an impairment charge is recorded, the
depreciable basis of the asset is adjusted in advance.
Note 1.7 Foreign currency translation
Receivables and payables as well as forward foreign exchange agreements recognized under off-statement of
financial position commitments are converted using the market rate at the reporting date, with the exception
of items denominated in currencies participating in the single European currency, for which the official
conversion rates were retained.
Property and equipment are recognized at cost. Financial assets are translated using the rate at the end of the
reporting period (see comments in the previous notes).
Income and expenses denominated in foreign currencies are recognized on the income statement using the
exchange rate on the last day of the month in which they were received or paid; accrued expenses and
income not yet paid on the reporting date are translated using the exchange rate on the closing date.
Unrealized and definitive gains and losses through currency translation are recognized at the end of each
reporting period.
Note 1.8 Swaps
Pursuant to Article 2 of CRBF regulation 90/15, the bank may need to create three separate swaps portfolios
depending on whether they have as their purpose (a) to maintain open and separate positions, (b) to hedge
interest rate risk for a separate element or a set of similar elements, or (d) to enable the specialized
management of a trading portfolio. The bank has no category (c) swaps portfolio, i.e. for the purpose of
hedging overall interest rate risk.
In these conditions, transfers from one portfolio to the other are possible only as follows:
Portfolio (a) to portfolio (b)
Portfolio (b) to portfolio (a) or (d)
Portfolio (d) to portfolio (b).
The fair value used to measure swaps for trading is based on the application of the discounted cash flow
(DCF) method with a zero coupon yield curve. The fixed-rate branch is measured using the various
maturities discounted on the basis of the yield curve, while the present value of the variable rate branch is
measured on the basis of the current coupon applied to the notional value of the principal. The fair value is
derived from the comparison of these two discounted values, after taking into account counterparty risk and
134
future management fees. The counterparty risk is calculated in accordance with the provisions of Appendix 3
of CRBF regulation 91-05 related to the solvency ratio, to which an 8% equity ratio is applied. The
management fees are then determined by adding a 10% ratio to this equity amount.
Any compensatory payments received or paid at the end of the swap are shown through profit and loss on a
pro rata temporis basis over the life of the swap. In the event of an early cancelation of the swap, the
compensatory payment received or paid is immediately recognized in income, unless the swap was initiated
as a hedging transaction. In that case, the compensatory payment is shown through profit or loss based on the
life of the initially hedged item.
In order to measure and monitor risk exposure from these transactions, overall sensitivity limits including
interest rate and currency swaps are set by activity. These positions are regularly disclosed to the bank’s
executive body, as defined by Article L 511-13 of the French Monetary and Financial Code.
Note 1.9 Commitments for retirement, departure and long-service awards
The recognition and measurement of retirement and similar commitments are consistent with
Recommendation 2003-R01 of the French National Accounting Council. The discount rate used is based on
long-term government securities.
Employee retirement plans
Retirement plans are administered by various institutions to which the bank and its employees make periodic
contributions.
These contributions are recognized as expenses during the year in which they are due.
In addition, employees of Caisse Fédérale du Crédit Mutuel Centre Est Europe receive a supplementary
retirement benefit plan financed by the employer through two insurance contracts. The first contract,
authorized under Article 83 of the French General Tax Code (CGI), is for a defined contribution points-based
capitalization plan. The second, authorized under Article 39 of the French General Tax Code (CGI), is a
supplementary defined benefit plan on the B and C tranches. The commitments related to these plans are
fully covered by established reserves. As a result, the employer has no residual commitment.
Departure and long-service awards
Future departure and long-service awards are fully covered by insurance policies subscribed with the
“Assurances du Crédit Mutuel” insurance company. The annual premiums take into account vested rights as
of December 31 of each year, weighted by employee turnover and life expectancy ratios.
The commitments are calculated using the projected unit credit method in accordance with IFRS. The factors
taken into account include the INSEE TF 00-02 actuarial tables, employee turnover, future salary increases,
social security rates and the discount rate.
Commitments related to vested rights acquired by employees as of December 31 are fully covered by
reserves established with the insurance company. Departure and long-service awards that have reached
maturity and are paid out to the employees during the year are reimbursed by the insurance company.
Departure commitments are determined on the basis of a standard award to employees who take retirement
on their own initiative upon reaching age 62.
Note 1.10 Fund for general banking risks
Created by CRBF regulation 90/02 related to shareholders’ equity, this fund is the amount that the bank
decides to allocate to general banking risks, which include its global interest rate and counterparty risk
exposure.
The amounts allocated to this fund total €61.6 million, with no changes to this item recorded during the year.
135
Note 1.11 Provisions
Provisions allocated to asset items are deducted from the corresponding assets, which are therefore
recognized at their net amount. Provisions related to off-statement of financial position commitments are
recorded under risk provisions.
BFCM may be involved in a number of legal disputes; their ultimate outcome and financial consequences are
regularly reviewed and, where necessary, allocations are made to provisions deemed necessary.
NOTE 1.12 Corporate income tax
BFCM is the lead company of a consolidated tax group established with some of its subsidiaries. It is solely
responsible for paying the tax liability of these companies, additional company tax contributions and
withholding tax for the tax group. The subsidiaries contribute to the tax payment as though no tax
consolidation existed. In the event a company leaves the tax group, it would benefit statutorily from an
indemnity corresponding to all tax surcharges resulting from its membership in the tax group if the exiting
company has incurred surcharges because of its membership of the group and if this situation justifies its
compensation by BFCM and for what amount.
The “Corporate income tax” item includes:
- corporate income tax due for the year and gains related to the tax consolidation, to which
additional contributions are added;
- net additions to/releases from provisions related to the above-mentioned items.
The corporate income tax due for the year and additional contributions are determined in accordance with
applicable tax regulations. Tax credits attached to income from securities are not recognized separately, but
are deducted directly from the tax expense.
Tax provisions are calculated using the liability method, and take into account additional contributions
depending on the respective maturities. They are not offset against any amounts due from the French
Treasury.
Note 1.13 Competitiveness and Employment Tax Credit (Crédit d’Impôt pour la Compétitivité et
l’Emploi – CICE)
The competitiveness and employment tax credit was recorded in accordance with the information note issued
by the French accounting standards board’s college on February 28, 2013.
The amount of the tax credit, not taxable, is credited to a sub-account in personnel expenses.
Note 1.14 Consolidation
The company is fully integrated within the consolidation scope of the CM11-CIC Group.
Note 1.15 Operations in non-cooperative countries and territories in the fight against tax fraud
and evasion
The bank has no directly or indirectly owned operations in countries or territories subject to Article L 511-45
of the French Monetary and Financial Code.
136
Notes to the statement of financial position
The figures included in the following tables are expressed in thousands of euros.
Note 2.0 Changes in non-current assets
Gross amount
as of Dec. 31, 2012
FINANCIAL ASSETS
PROPERTY AND EQUIPM ENT
INTANGIBLE ASSETS
TOTAL
Additions
Disposals
Transfers or
Gross amount
repayments as of Dec. 31, 2013
33,942,186
8,483
3,000
510,769
2
117,527
67
(421,241)
33,914,187
8,418
3,000
33,953,669
510,771
117,594
(421,241)
33,925,605
Note 2.1 Depreciation, amortization and impairment of non-current assets
DEPRECIATION AND AMORTIZATION
Accum. deprec.
& amortiz. as of
Dec. 31, 2012
FINANCIAL ASSETS
PROPERTY AND EQUIPM ENT
INTANGIBLE ASSETS
TOTAL
Expense
Reversals
Accum. deprec.
& amortiz. as of
Dec. 31, 2013
0
1,583
0
50
67
1,566
1,583
50
67
1,566
IMPAIRMENT
Impairment
provisions as of
Dec. 31, 2012
FINANCIAL ASSETS
PROPERTY AND EQUIPM ENT
INTANGIBLE ASSETS
TOTAL
Losses
156,228
0
0
13,254
156,228
13,254
Reversals
Impairment
provisions as of
Dec. 31, 2013
169,482
0
0
0
169,482
137
Note 2.2 Analysis of receivables and liabilities by residual maturity
ASSETS
Between
Three
Between
three mont
months or
one and
hs and
less
five years
one year
LOANS AND RECEIVABLES DUE FROM CREDIT INSTITUTIONS
Demand
2,850,767
Term
17,221,362 16,983,876 41,532,553
LOANS AND RECEIVABLES DUE FROM CUSTOM ERS
Commercial loans
305,148
Other customer loans
667,733 1,130,709 2,465,243
Overdrawn current accounts
88,448
BONDS AND OTHER FIXED-INCOM E SECURITIES
of which trading securities
TOTAL
M ore than
five years
and
perpetual
20,149,788
2,135,549
Accrued
interest
and
interest
TOTAL
2,850,767
394,059 96,281,638
39,754
305,148
6,438,988
88,448
776,833 4,808,000 16,382,388
98,988
8,873,661
107,806 30,948,688
98,988
21,910,291 22,922,585 60,380,184
31,158,998
541,619 136,913,677
The maturity of non-performing loans is considered to be over five years.
LIABILITIES
DUE TO CREDIT INSTITUTIONS
Demand
Term
DUE TO CUSTOM ERS
Regulated savings accounts
Demand
Term
Other liabilities
Demand
Term
DEBT SECURITIES
Retail certificates of deposit
Interbank instruments
and trading instruments
Bonds
SUBORDINATED DEBT
TOTAL
Between
Three
Between
three mont
months or
one and
hs and
less
five years
one year
M ore than
five years
and
perpetual
15,807,516
10,266,926 3,919,100 12,229,786
12,290,140
Accrued
interest
and
interest
due
TOTAL
90 15,807,606
472,214 39,178,166
0
0
8,620,156 6,089,063 10,500,000
6,501,289
0
58,945 31,769,453
0
12,078,712 11,539,554 4,548,193
2,928,000 2,618,090 18,149,166
5,214,121
9,127,040
2,900,000
4,353,896
49,701,310 24,165,807 48,327,145
219,503 33,600,083
628,974 33,451,270
52,103
7,305,999
37,486,486 1,431,829 161,112,577
138
Note 2.3 Allocation of loans and receivables due from credit institutions
LOANS AND RECEIVABLES DUE FROM CREDIT INSTITUTIONS
2013
Net change
2012
2,850,767
(8,531,771)
11,382,538
96,281,639
0
(0)
(251,317)
0
0
96,532,956
0
(0)
Gross
amount
2013
of which
non-performing
losses
Impairment
provisions
. Companies
. Sole traders
. Individuals
. Governments
. Non-profit institutions
6,792,920
136
136
Total
6,792,967
136
136
136
136
Demand
Term
of which irrecoverable loans
(Impairment provisions)
Note 2.4 Allocation of loans and receivables due from customers
Excluding accrued interest of €39,754 thousand from gross receivables
By major types of counterparties
8
39
By business sector
. Farming and mining
. Retail and wholesale
. Industries
. Business services and holding companies
. Services to individuals
. Financial services
. Real estate services
. Transportation and communication
. Unallocated and other
205,400
375
424,588
7,222
5,770,464
83,725
290,086
11,107
Total
6,792,967
136
136
2,085,100
4,707,867
136
136
6,792,967
136
136
By geographic region
. France
. Europe, excluding France
. Rest of the world
Total
None of the non-performing loans is considered irrecoverable.
139
Note 2.5 Amount of commitments in respect of fully consolidated subsidiaries and other long-term equity investments
ASSETS
Amount as of Amount as of
Dec. 31, 2013 Dec. 31, 2012
LOANS AND RECEIVABLES DUE FROM CREDIT INSTITUTIONS
Demand
Term
402,463
56,256,733
4,597,968
54,002,980
5,068,207
5,017,032
24,622,759
25,375,568
SUBORDINATED RECEIVABLES
1,750,158
2,335,949
TOTAL
88,100,320
91,329,497
LOANS AND RECEIVABLES DUE FROM CUSTOM ERS
Commercial loans
Other customer loans
Overdrawn current accounts
BONDS AND OTHER FIXED-INCOM E SECURITIES
LIABILITIES
Amount as of Amount as of
Dec. 31, 2013 Dec. 31, 2012
DUE TO CREDIT INSTITUTIONS
Demand
Term
12,544,617
32,402,127
4,587,689
29,748,487
DUE TO CUSTOM ERS
Regulated savings accounts
Demand
Term
Other liabilities
Demand
Term
151,205
19,257,985
160,448
19,000,000
726,320
4,254,079
1,046,590
3,072,169
1,618,743
1,740,949
70,955,076
59,356,332
DEBT SECURITIES
Retail certificates of deposit
Interbank instruments
and trading instruments
Bonds
Other debt securities
SUBORDINATED DEBT
TOTAL
This table includes the commitments given to and received from fully consolidated subsidiaries and other long-term equity
investments, which are included in the consolidation scope of the Crédit M utuel Centre Est Europe Group.
140
Note 2.6 Allocation of subordinated assets
Amount
as of Dec. 31, 2013
Subordinated
of which
amount
non-voting
loan stock
Amount
as of Dec. 31, 2012
Subordinated
of which
amount
non-voting
loan stock
LOANS AND RECEIVABLES DUE FROM CREDIT INSTITUTIONS
Term
Perpetual
781,540
291,000
37,751
1,360,934
291,000
33,662
LOANS AND RECEIVABLES DUE FROM CUSTOM ERS
Other customer loans
700,000
700,000
700,000
700,000
BONDS AND OTHER FIXED-INCOM E SECURITIES
959,212
115,021
1,472,192
105,988
2,731,752
852,772
3,824,126
839,650
TOTAL
Note 2.7 S ubordinated debt
Amount
M aturity
Subordinated
Note 3
Subordinated
Note 4
Subordinated
Note 5
Subordinated
Note 6
800,000
300,000
300,000
500,000
Sept. 30, 2015
Amount
M aturity
Dec. 18, 2015 June 16, 2016 Dec. 16, 2016
Subordinated
Note 7
Subordinated
Note 8
Subordinated
Note 9
Deeply
subord. Note
1,000,000
1,000,000
1,250,000
2,103,896
Dec. 6, 2018 Oct. 22, 2020
Perpetual
Perpetual
Terms
Subordinated loans and notes have a lower priority than all other debts as regards repayment,
with the exception of non-voting loan stock.
The deeply subordinated notes have the lowest priority because they are expressly subordinated
to all other debts of the company, whether unsecured or subordinated.
Early repayment option
Not permitted during the first five years unless accompanied by an increase in capital.
Not permitted for subordinated notes, except in case of redemption in the market or a takeover
bid (cash or share exchange). Restricted with regard to deeply subordinated notes because
they are similar to Tier 1 capital.
Subordinated debt amounted to €7,305,999 thousand (including accrued interest).
Note 2.8 S ecurities investments: breakdown between trading, available-for-sale and held-to-maturity
Trading
Available
for sale
Held to
maturity
TOTAL
GOVERNM ENT SECURITIES AND EQUIVALENT
BONDS AND OTHER FIXED-INCOM E SECURITIES
EQUITIES AND OTHER VARIABLE-INCOM E SECURITIES
99,988
13,661,625
6,217,888
287,173
515
24,730,800
13,762,128
30,948,688
287,173
TOTAL
99,988
20,166,686
24,731,315
44,997,989
141
Note 2.9 S ecurities investments: reclassifications
Held-to-maturity
Amount
securities
due
reclassified
as of
in 2008
Dec. 31, 2012
AVAILABLE-FOR-SALE SECURITIES
TOTAL
Amount
Unrealized loss
Amount
outstanding
(impairment)
of recovery
as of
if there was no if there was no
Dec. 31, 2013 reclassification reclassification
1,318,640
1,141,040
177,600
797
9,880
1,318,640
1,141,040
177,600
797
9,880
In accordance with CRB (Comité de la Réglementation Bancaire, the French Banking Regulations Committee) Regulation 90-01 on accounting
for security transactions, as introduced by CRC (Comité de la Réglementation Comptable, the French Accounting Regulations Committee)
Regulation 2008-17 of December 10, 2008 with regard to reclassifications of securities from “trading securities” and from “available-for-sale
securities” categories, BFCM did not make any such reclassification at December 31, 2013.
Note 2.10 S ecurities investments: differences between the acquisition price and the selling price
of available-for-sale securities and held-to-maturity securities
S ECURITY TYPE
AVAILABLE-FOR-SALE SECURITIES
Bond market
M oney market
HELD-TO-M ATURITY SECURITIES
Bond market
M oney market
UNAMORTIZED NET
DIS COUNTS /PREMIUMS
Discount
37,548
5,289
Premium
111,619
4,588
4,625
19
7
Note 2.11 S ecurities investments: unrealized gains and losses
Amount of unrealized gains on available-for-sale securities:
695,321
Amount of unrealized losses on impaired available-for-sale securities:
77,256
Amount of unrealized losses on held-to-maturity securities:
6,111
Amount of unrealized gains on held-to-maturity securities:
120,569
Note 2.12 S ecurities investments: amount of receivables related to loaned securities
Amount as of Amount as of
Dec. 31, 2013 Dec. 31, 2012
GOVERNM ENT SECURITIES AND EQUIVALENT
BONDS AND OTHER FIXED-INCOM E SECURITIES
EQUITIES AND OTHER VARIABLE-INCOM E SECURITIES
0
0
0
0
0
0
142
Note 2.13 S ecurities investments: amount of assets and liabilities related to securities given under
repurchase agreements
Assets
Liabilities
LOANS AND RECEIVABLES DUE FROM CREDIT INSTITUTIONS
Demand
Term
LOANS AND RECEIVABLES DUE FROM CUSTOM ERS
Other customer loans
DUE TO CREDIT INSTITUTIONS
Demand
Term
DUE TO CUSTOM ERS
Other liabilities
Demand
Term
TOTAL
0
0
Note 2.14 S ecurities investments: allocation of bonds and other fixed-income securities by issuer
Issuer
Government
agencies
GOVERNM ENT SECURITIES, BONDS
AND OTHER FIXED-INCOM E SECURITIES
14,552,817
Other
30,000,203
Accrued
interest
157,796
TOTAL
44,710,816
Note 2.15 S ecurities investments: breakdown between listed and unlisted
Amount
of listed
securities
Amount
of unlisted
securities
Accrued
interest
TOTAL
GOVERNM ENT SECURITIES AND EQUIVALENT
BONDS AND OTHER FIXED-INCOM E SECURITIES
EQUITIES AND OTHER VARIABLE-INCOM E SECURITIES
3,419,799
29,854,172
266,418
10,292,339
986,710
20,755
49,990
107,806
13,762,128
30,948,688
287,173
TOTAL
33,540,389
11,299,804
157,796
44,997,989
143
Note 2.16 S ecurities investments: information on UCITS
French
UCITS
VARIABLE INCOM E SECURITIES - UCITS
2,669
Accumulation
UCITS
VARIABLE-INCOM E SECURITIES - UCITS
Foreign
UCITS
TOTAL
14,020
Distribution
UCITS
16,689
16,689
TOTAL
0
16,689
Note 2.17 S ecurities investments: investments in subsidiaries, associates, and other long-term
equity investments in credit institutions
Amount invested
in credit institutions
as of Dec. 31, 2013
AVAILABLE-FOR-SALE AND OTHER LONG-TERM EQUITY
INVESTM ENTS
INVESTM ENTS IN SUBSIDIARIES AND ASSOCIATES
TOTAL
Amount invested
in credit institutions
as of Dec. 31, 2012
1,863,871
3,743,359
1,753,032
3,722,708
5,607,230
5,475,740
Note 2.18 S ecurities investments: information on available-for-sale securities
No available-for-sale securities were held as of December 31, 2013.
Note 2.19 Associates that are unlimited liability corporations
Business name
REM A
CM -CIC FONCIERE
STE CIVILE GESTION DES PARTS DANS L'ALSACE
Registered office
Legal form
STRASBOURG
STRASBOURG
STRASBOURG
French general partnership (SNC)
French general partnership (SNC)
French investment trust (SCP)
Note 2.20 Reserves
Amount as of Amount as of
Dec. 31, 2013 Dec. 31, 2012
LEGAL RESERVE
REGULATORY AND CONTRACTUAL RESERVES
REGULATED RESERVES
OTHER RESERVES
TOTAL
132,663
2,056,466
132,481
1,477,466
9,495
9,495
2,198,624
1,619,442
144
Note 2.21 S et-up costs, research and development costs and business goodwill
Amount as of Amount as of
Dec. 31, 2013 Dec. 31, 2012
SET-UP COSTS
Organization costs
Start-up costs
Capital increase and other costs
RESEARCH AND DEVELOPM ENT COSTS
BUSINESS GOODWILL
OTHER INTANGIBLE ASSETS
TOTAL
3,000
3,000
3,000
3,000
Note 2.22 Receivables eligible for refinancing with a central bank
No receivables eligible for refinancing with a central bank were held as of December 31, 2013.
Note 2.23 Accrued interest receivable or payable
Accrued
interest
receivable
Accrued
interest
payable
ASSETS
CASH, CENTRAL BANKS, POST OFFICE BANKS
GOVERNM ENT SECURITIES AND EQUIVALENT
LOANS AND RECEIVABLES DUE FROM CREDIT INSTITUTIONS
Demand
Term
LOANS AND RECEIVABLES DUE FROM CUSTOM ERS
Commercial loans
Other customer loans
Overdrawn current accounts
BONDS AND OTHER FIXED-INCOM E SECURITIES
49,990
394,059
39,754
107,806
EQUITIES AND OTHER VARIABLE-INCOM E SECURITIES
AVAILABLE-FOR-SALE AND OTHER LONG-TERM EQUITY INVESTM ENTS
INVESTM ENTS IN SUBSIDIARIES AND ASSOCIATES
145
LIABILITIES
CENTRAL BANKS, POST OFFICE BANKS
DUE TO CREDIT INSTITUTIONS
Demand
Term
90
472,214
DUE TO CUSTOM ERS
Regulated savings accounts
Demand
Term
Other liabilities
Demand
Term
58,945
DEBT SECURITIES
Retail certificates of deposit
Interbank instruments and trading instruments
Bonds
Other debt securities
219,503
628,974
SUBORDINATED DEBT
52,103
TOTAL
591,609
1,431,829
Note 2.24 Other assets and other liabilities
OTHER ASSETS
Amount as of Amount as of
Dec. 31, 2013 Dec. 31, 2012
CONDITIONAL INSTRUM ENTS PURCHASED
SETTLEM ENT ACCOUNTS ON SECURITIES TRANSACTIONS
SUNDRY DEBTORS
CARRY BACK RECEIVABLES
OTHER STOCK AND EQUIVALENT
OTHER USES OF FUNDS
TOTAL
435
46,860
3,877,213
1,468
17,487
957,706
3,924,508
976,661
OTHER LIABILITIES
Amount as of Amount as of
Dec. 31, 2013 Dec. 31, 2012
OTHER DEBTS ON SECURITIES
CONDITIONAL INSTRUM ENTS SOLD
DEBTS ON TRADING SECURITIES
of which debts on securities borrowed
SETTLEM ENT ACCOUNTS ON SECURITIES TRANSACTIONS
PAYM ENTS OUTSTANDING ON SECURITIES NOT FULLY PAID UP
SUNDRY CREDITORS
TOTAL
435
1,468
23,156
50,913
1,042,552
1,960,814
1,066,143
2,013,195
146
Note 2.25 Accruals
ASSETS
Amount as of Amount as of
Dec. 31, 2013 Dec. 31, 2012
HEADQUARTERS AND BRANCH - NETWORK
COLLECTIONS
OTHER ADJUSTM ENTS
SUSPENSE ACCOUNTS
POTENTIAL LOSSES ON HEDGING CONTRACTS FORWARD FINANCIAL INSTRUM ENTS NOT YET SETTLED
DEFERRED LOSSES ON HEDGING CONTRACTS FORWARD FINANCIAL INSTRUM ENTS SETTLED
DEFERRED EXPENSES
PREPAID EXPENSES
ACCRUED INCOM E
OTHER ACCRUALS
TOTAL
3,758
287
58,620
79,379
138,964
11,269
1,637,530
51,861
52,308
155,229
11,312
1,668,909
48,255
1,922,761
1,994,920
LIABILITIES
Amount as of Amount as of
Dec. 31, 2013 Dec. 31, 2012
HEADQUARTERS AND BRANCH - NETWORK
ACCOUNTS UNAVAILABLE DUE TO COLLECTION PROCEDURES
OTHER ADJUSTM ENTS
SUSPENSE ACCOUNTS
POTENTIAL GAINS ON HEDGING CONTRACTS FORWARD FINANCIAL INSTRUM ENTS NOT YET SETTLED
DEFERRED GAINS ON HEDGING CONTRACTS FORWARD FINANCIAL INSTRUM ENTS SETTLED
DEFERRED INCOM E
ACCRUED EXPENSES
OTHER ACCRUALS
TOTAL
332
176,315
5,993
255,921
19,053
1,074,056
117,840
194,074
11,576
1,130,519
91,657
1,643,517
1,433,819
Articles L 441-6-1 and D 441-4 of the French Commercial Code require companies to provide specific
information on the maturity of amounts due to suppliers. In the case of our company, the amounts are negligible.
Note 2.26 Unamortized balance of the difference between the purchase price and the redemption
price of debt securities
Amount as of Amount as of
Dec. 31, 2013 Dec. 31, 2012
ISSUANCE PREM IUM ON FIXED-INCOM E SECURITIES
REDEM PTION PREM IUM S ON FIXED-INCOM E SECURITIES
TOTAL
170,724
25,704
167,625
32,866
196,428
200,491
147
Note 2.27 Provisions
Amount as of
Dec. 31, 2013
PROVISION FOR ASSOCIATE-RELATED
RISKS
PROVISION FOR RETIREM ENT BENEFITS
PROVISION FOR SWAPS
PROVISION FOR TAXES
PROVISION FOR GUARANTEE
COM M ITM ENTS
OTHER PROVISIONS
Additions
Reversals
14,000
1,120
21,816
1,750
14,000
15,858
1,194
15,858
1,194
5,388
1,409
55,738
31,052
46,939
40,142
Amount as of Reversal lag
Dec. 31, 2012
0
1,120
61,958
1,750
> 3 years
< 3 years
< 1 year
< 1 year
5,388 > 3 years
1,409 < 1 year
71,625
Note 2.28 Equivalent in euros of assets and liabilities denominated in non-euro zone currencies
ASSETS
Amount as of Amount as of
Dec. 31, 2013 Dec. 31, 2012
CASH, CENTRAL BANKS, POST OFFICE BANKS
GOVERNM ENT SECURITIES AND EQUIVALENT
LOANS AND RECEIVABLES DUE FROM CREDIT INSTITUTIONS
LOANS AND RECEIVABLES DUE FROM CUSTOM ERS
BONDS AND OTHER FIXED-INCOM E SECURITIES
EQUITIES AND OTHER VARIABLE-INCOM E SECURITIES
REAL ESTATE DEVELOPM ENT
SUBORDINATED LOANS
11,081,980
54,489
3,606
19,886
13,347,503
97,321
579,854
17,437
AVAILABLE-FOR-SALE AND OTHER LONG-TERM EQUITY INVESTM ENTS
INVESTM ENTS IN SUBSIDIARIES AND ASSOCIATES
INTANGIBLE ASSETS
PROPERTY AND EQUIPM ENT
OTHER ASSETS
ACCRUALS
1,301,433
1,220,850
81,722
80,689
34,482
76,998
TOTAL FOREIGN-CURRENCY DENOMINATED AS S ETS
12,623,805
15,374,445
Percentage of total assets
7.49%
9.47%
LIABILITIES
Amount as of Amount as of
Dec. 31, 2013 Dec. 31, 2012
CENTRAL BANKS, POST OFFICE BANKS
DUE TO CREDIT INSTITUTIONS
DUE TO CUSTOM ERS
DEBT SECURITIES
OTHER LIABILITIES
ACCRUALS
PROVISIONS
SUBORDINATED DEBT
4,012,219
1,398,215
10,890,958
59,920
115,744
2,778,308
1,034,348
8,195,945
54,386
122,896
TOTAL FOREIGN-CURRENCY DENOMINATED LIABILITIES
16,477,056
12,185,883
Percentage of total liabilities
9.78%
7.50%
148
Note 2.27 Provisions
Amount as of
Dec. 31, 2013
PROVISION FOR ASSOCIATE-RELATED RISKS
PROVISION FOR RETIREM ENT BENEFITS
PROVISION FOR SWAPS
PROVISION FOR TAXES
PROVISION FOR GUARANTEE
COM M ITM ENTS
OTHER PROVISIONS
Additions
Reversals
14,000
1,120
21,816
1,750
14,000
15,858
1,194
15,858
1,194
5,388
1,409
55,738
31,052
46,939
40,142
Amount as of Reversal lag
Dec. 31, 2012
0
1,120
61,958
1,750
> 3 years
< 3 years
< 1 year
< 1 year
5,388 > 3 years
1,409 < 1 year
71,625
Note 2.28 Equivalent in euros of assets and liabilities denominated in non-euro zone currencies
ASSETS
Amount as of Amount as of
Dec. 31, 2013 Dec. 31, 2012
CASH, CENTRAL BANKS, POST OFFICE BANKS
GOVERNM ENT SECURITIES AND EQUIVALENT
LOANS AND RECEIVABLES DUE FROM CREDIT INSTITUTIONS
LOANS AND RECEIVABLES DUE FROM CUSTOM ERS
BONDS AND OTHER FIXED-INCOM E SECURITIES
EQUITIES AND OTHER VARIABLE-INCOM E SECURITIES
REAL ESTATE DEVELOPM ENT
SUBORDINATED LOANS
11,081,980
54,489
3,606
19,886
13,347,503
97,321
579,854
17,437
1,301,433
1,220,850
81,722
80,689
34,482
76,998
TOTAL FOREIGN-CURRENCY DENOMINATED AS S ETS
12,623,805
15,374,445
Percentage of total assets
7.49%
9.47%
AVAILABLE-FOR-SALE AND OTHER LONG-TERM EQUITY INVESTM ENTS
INVESTM ENTS IN SUBSIDIARIES AND ASSOCIATES
INTANGIBLE ASSETS
PROPERTY AND EQUIPM ENT
OTHER ASSETS
ACCRUALS
LIABILITIES
Amount as of Amount as of
Dec. 31, 2013 Dec. 31, 2012
CENTRAL BANKS, POST OFFICE BANKS
DUE TO CREDIT INSTITUTIONS
DUE TO CUSTOM ERS
DEBT SECURITIES
OTHER LIABILITIES
ACCRUALS
PROVISIONS
SUBORDINATED DEBT
4,012,219
1,398,215
10,890,958
59,920
115,744
2,778,308
1,034,348
8,195,945
54,386
122,896
TOTAL FOREIGN-CURRENCY DENOMINATED LIABILITIES
16,477,056
12,185,883
Percentage of total liabilities
9.78%
7.50%
149
Notes to the off-statement of financial position items
Note 3.1 Assets pledged as collateral for commitments
Amount as of Amount as of
Dec. 31, 2013 Dec. 31, 2012
ASSETS PLEDGED FOR TRANSACTIONS ON FORWARD M ARKETS
OTHER ASSETS PLEDGED
of which to Banque de France
of which to Société de financement de l'économie française
TOTAL
0
14,198,821
11,361,977
2,836,844
0
35,604,513
32,725,017
2,879,496
14,198,821
35,604,513
CM -CIC Home Loan SFH is a 99.99%-owned subsidiary of BFCM . Its purpose is to issue,
exclusively on behalf of its parent company, securities backed by mortgages and equivalent assets
distributed through the Crédit M utuel and CIC networks. Contractual provisions require BFCM to provide
assets as collateral for the securities issued by CM -CIC Home Loan SFH, should certain
events occur (such as a decline in ratings below a certain level or in the amount of mortgage loans).
As of December 31, 2013, this procedure had not been called upon.
Note 3.2 Assets received as collateral
Amount as of Amount as of
Dec. 31, 2013 Dec. 31, 2012
ASSETS RECEIVED IN PLEDGE FOR TRANSACTIONS ON FORWARD M ARKETS
OTHER ASSETS RECEIVED
380,860
of which to Société de financement de l'économie française
380,860
TOTAL
380,860
381,807
381,807
381,807
The bank obtains refinancing from Caisse de Refinancement de l'Habitat through the issuance of promissory notes
secured by receivables, in accordance with Article L 313-42 of the French M onetary and Financial Code.
As of December 31, 2013, assigned receivables totaled €9,535,564 thousand. The home loans securing these promissory
notes are provided by the Crédit M utuel Group, of which BFCM is a subsidiary. These loans amounted to
€9,526,015 thousand at the same date.
Note 3.3 Forward transactions in foreign currencies not settled as of December 31
Amount as of
Dec. 31, 2013
FORWARD FOREIGN EXCHANGE TRANSACTIONS
Assets
Liabilities
Amount as of
Dec. 31, 2012
Assets
Liabilities
Euros receivable/foreign currencies payable
of which currency swaps
7,770,434
2,365,192
7,535,580
2,205,463
9,877,193
2,072,617
9,713,865
1,995,606
Foreign currencies receivable/euros payable
of which currency swaps
12,371,563
5,073,622
12,790,462
5,389,995
8,003,935
3,157,096
8,049,429
3,119,918
8,294,326
8,271,923
8,240,891
8,294,836
Foreign currencies receivable/foreign currencies payable
of which currency swaps
150
Note 3.4 Other forward transactions not settled as of December 31
Amount as of Amount as of
Dec. 31, 2013 Dec. 31, 2012
TRANSACTIONS INVOLVING INTEREST-RATE INSTRUM ENTS,
CARRIED OUT ON REGULATED AND SIM ILAR M ARKETS
Firm hedging transactions
of which sales of futures contracts
of which purchases of futures contracts
Conditional hedging transactions
Other firm transactions
of which sales of futures contracts
OTC TRANSACTIONS INVOLVING
INTEREST-RATE INSTRUM ENTS
Firm hedging transactions
of which interest rate swaps
interest rate swaps denominated in foreign currencies
purchases of forward rate agreements
sales of forward rate agreements
Conditional hedging transactions
of which purchases of swap options
sales of swap options
of which purchases of caps and floors
sales of caps and floors
Other firm transactions
of which interest rate swaps
interest rate swaps denominated in foreign currencies
285,186,426
282,343,063
2,843,363
316,207,150
312,734,389
3,472,761
630,000
730,800
315,000
315,000
365,400
365,400
4,122,512
4,118,886
3,626
1,919,620
1,919,620
Other conditional transactions
OTC TRANSACTIONS INVOLVING
FOREIGN EXCHANGE INSTRUM ENTS
Conditional hedging transactions
of which purchases of foreign exchange options
sales of foreign exchange options
OTC TRANSACTIONS INVOLVING
INSTRUM ENTS OTHER THAN INTEREST-RATE AND
FOREIGN EXCHANGE INSTRUM ENTS
Firm hedging transactions
of which purchases of non-deliverable forwards
sales of non-deliverable forwards
Conditional hedging transactions
of which purchases of options
sales of options
151
Note 3.5 Analysis of forward transactions not yet settled by residual maturity
Amount as of
Dec. 31, 2013
0 - 1 year
FOREIGN CURRENCY TRANSACTIONS
22,705,581
1 - 5 years
5,376,933
Amount as of
Dec. 31, 2012
> 5 years
515,451
0 - 1 year
21,426,405
1 - 5 years
4,180,185
> 5 years
451,540
TRANSACTIONS INVOLVING INTEREST RATE INSTRUM ENTS,
CARRIED OUT ON REGULATED M ARKETS
Firm transactions
of which sales of futures contracts
of which purchases of futures contracts
Other firm transactions
of which sales of futures contracts
OTC TRANSACTIONS INVOLVING
INTEREST-RATE INSTRUM ENTS
Firm transactions
50,445,850 58,797,262 180,065,286
of which swaps
50,445,850 58,797,262 180,065,286
purchases of forward rate agreements
sales of forward rate agreements
Conditional hedging transactions
of which purchases of swap options
sales of swap options
of which purchases of caps and floors
sales of caps and floors
81,304,077 62,218,352 174,604,341
81,304,077 62,218,352 174,604,341
630,000
6,400
724,400
315,000
315,000
3,200
3,200
362,200
362,200
Other conditional transactions
OTC TRANSACTIONS INVOLVING
FOREIGN EXCHANGE INSTRUM ENTS
Conditional hedging transactions
of which purchases of foreign exchange options
sales of foreign exchange options
OTC TRANSACTIONS INVOLVING
OTHER FORWARD INSTRUM ENTS
Firm transactions
of which purchases of non-deliverable forwards
sales of non-deliverable forwards
Conditional transactions
of which purchases of options
sales of options
152
Note 3.6 Commitments in respect of fully consolidated subsidiaries and other long-term equity investments
Commitments given
Amount as of Amount as of
Dec. 31, 2013 Dec. 31, 2012
Financing commitments
Guarantee commitments
Foreign exchange commitments
Commitments on forward financial instruments
8,674,000
3,161,262
5,466,591
165,291,405
8,402,000
3,257,609
5,508,542
157,569,568
TOTAL
182,593,258
174,737,719
Commitments received
Amount as of Amount as of
Dec. 31, 2013 Dec. 31, 2012
Financing commitments
Guarantee commitments
Foreign exchange commitments
Commitments on forward financial instruments
3,382
5,129,423
11,308
5,326,011
TOTAL
5,132,805
5,337,319
This table includes the commitments given to and received from fully consolidated subsidiaries and other long-term equity
investments, which are included in the consolidation scope of the Crédit M utuel Centre Est Europe Group.
Note 3.7 Fair value of derivative instruments
Amount as of
Dec. 31, 2013
Assets
Liabilities
Interest rate risk - hedge accounting (macro-micro)
Conditional or optional instruments
Firm instruments other than swaps
Embedded derivatives
Swaps
Interest rate risks - excluding hedge accounting
Conditional or optional instruments
Firm instruments other than swaps
Swaps
Foreign exchange risk
Conditional or optional instruments
Firm instruments other than swaps
Swaps
Amount as of
Dec. 31, 2012
Assets
Liabilities
85,440
2,924,086
220,259
2,153,948
74,711
4,305,207
267,442
2,611,928
12,027,936
12,043,633
13,191,363
13,151,218
8,448
1,432
8,689
2,798
This note has been prepared in application of CRC Regulations 2004-14 to 2004-19, which require
the disclosure of the fair value of financial instruments. The fair value of derivatives is determined
on the basis of market value or, in the absence of a market value, using market models.
153
Notes to the income statement
Note 4.1 Interest income and expense
Income
2013
CREDIT INSTITUTIONS
CUSTOM ERS
BONDS AND OTHER FIXED-INCOM E SECURITIES
SUBORDINATED LOANS
OTHER SIM ILAR INCOM E
NET REVERSAL OF (ADDITION TO) PROVISIONS RELATING TO INTEREST
ON NON-PERFORM ING LOANS
NET REVERSAL OF (ADDITION TO) PROVISIONS ON OTHER SIM ILAR INCOM E
TOTAL
7,782,950
173,498
651,019
87,245
19,749
8,231,066
208,684
841,721
98,713
25,411
9,567
35,789
8,724,028
9,441,384
Expenses
2013
CREDIT INSTITUTIONS
CUSTOM ERS
BONDS AND OTHER FIXED-INCOM E SECURITIES
SUBORDINATED DEBT
OTHER SIM ILAR EXPENSES
NET ADDITION TO (REVERSAL OF) PROVISIONS RELATING TO INTEREST
ON NON-PERFORM ING LOANS
NET ADDITION TO (REVERSAL OF) PROVISIONS FOR OTHER SIM ILAR EXPENSES
TOTAL
Income
2012
Expenses
2012
6,743,180
399,311
1,287,497
341,694
116,165
7,330,178
499,624
1,360,626
379,991
104,522
8,887,847
9,674,941
Note 4.2 Analysis of income from variable-income securities
Amount
2013
AVAILABLE-FOR-SALE EQUITIES AND OTHER VARIABLE-INCOM E SECURITIES
SUBSIDIARIES, ASSOCIATES AND OTHER LONG-TERM EQUITY INVESTM ENTS
M EDIUM -TERM AVAILABLE-FOR-SALE SECURITIES
TOTAL
Amount
2012
13,804
384,963
6,093
406,706
398,767
412,799
154
Note 4.3 Fees and commissions
Income
2013
CREDIT INSTITUTIONS
CUSTOM ERS
SECURITIES TRANSACTIONS
FOREIGN EXCHANGE TRANSACTIONS
FINANCIAL SERVICES PROVIDED
OFF-STATEM ENT OF FINANCIAL POSITION TRANSACTIONS
OTHER
REVERSALS FROM PROVISIONS RELATING TO FEES AND COM M ISSIONS
TOTAL
8,114
5,426
61
1
37,503
284
3,805
82
2
26,777
1,549
1,124
52,654
32,074
Expenses
2013
CREDIT INSTITUTIONS
CUSTOM ERS
SECURITIES TRANSACTIONS
FOREIGN EXCHANGE TRANSACTIONS
FINANCIAL SERVICES PROVIDED
OFF-STATEM ENT OF FINANCIAL POSITION TRANSACTIONS
OTHER
ADDITIONS TO PROVISIONS RELATING TO FEES AND COM M ISSIONS
TOTAL
Income
2012
Expenses
2012
586
1
7,163
1,033
29,938
961
8,943
1,011
16,724
1,601
1,330
40,322
28,969
Note 4.4 Gains (losses) on trading securities
Amount
2013
TRADING SECURITIES
FOREIGN EXCHANGE
FORWARD FINANCIAL INSTRUM ENTS
NET IM PAIRM ENT REVERSALS (LOSSES)
TOTAL
Amount
2012
1,683
4,259
(562)
40,143
16,860
2,825
(793)
131,025
45,523
149,917
Note 4.5 Gains (losses) on available-for-sale and similar securities
Amount
2013
ACQUISITION EXPENSES ON AVAILABLE-FOR-SALE SECURITIES
NET GAIN (LOSS) ON DISPOSALS
NET IM PAIRM ENT REVERSALS (LOSSES)
TOTAL
Amount
2012
(497)
54,246
43,549
(54)
125,094
165,239
97,298
290,279
155
Note 4.6 Other operating income and expenses
Amount
2013
M ISCELLANEOUS OPERATING INCOM E
M ISCELLANEOUS OPERATING EXPENSES
TOTAL
Amount
2012
2,080
(8,822)
743
(9,338)
(6,742)
(8,595)
Note 4.7 Operating expenses
Amount
2013
SALARIES AND WAGES
5,642
RETIREM ENT BENEFITS EXPENSE
690
OTHER PAYROLL-RELATED EXPENSES
1,674
PROFIT-SHARING AND INCENTIVE PLANS
356
PAYROLL AND SIM ILAR TAXES
1,212
OTHER TAXES AND DUTIES
12,456
EXTERNAL SERVICES
38,132
NET ADDITIONS TO/REVERSALS FROM PROVISIONS RELATING TO OPERATING EXPENSES
REINVOICED EXPENSES
(7,069)
TOTAL
53,093
Amount
2012
5,329
641
1,641
325
895
17,893
34,734
1,120
(6,750)
55,828
The competitiveness and employment tax credit (CICE), recognized as a credit to payroll costs, amounted to
€17,822.93 for fiscal year 2013.
The CICE enabled, in particular, the maintenance of or even an increase in financing for employee training at a level well above
the regulatory levels and enhancement of the Group's overall competitiveness, particularly through:
- investment, in particular in new technologies such as digital applications (tablets) and videoconferencing systems on portable
computers, enabling customers and shareholders to not only remain in closer contact with their account officers but also to
achieve energy savings;
- IT developments concerning new telephone-based means of payment;
- research into new services benefiting our merchant customers;
- reductions in the cost of providing services to customers and shareholders in connection with prospecting in new national and
international markets.
As regards new market and new client prospection, in particular, our sales teams will need to be increased in some regions that are
currently under commercial development.
The total amount of direct and indirect remuneration paid in 2013 to directors and corporate officers of BFCM
was €5,514,357.77 compared with €5,267,225.73 in 2012. No attendance fees were paid.
Related party transactions:
· At its meeting of M ay 19, 2011, the Board of Directors of CIC approved a severance payment in case of termination of
M r. Lucas' term of office as CEO, subject to a performance-related condition and representing one year of his remuneration as a
corporate officer, i.e. a commitment currently estimated at €770,000 (including social security contributions);
· At its meeting of M ay 8, 2011, the Board of Directors of BFCM approved a severance payment in case of termination of
M r. Fradin's term of office as COO, subject to a performance-related condition and representing one year of his remuneration as a
corporate officer, i.e. a commitment currently estimated at €1,120,000 (including social security contributions). A provision was
recognized for the outstanding amount as of December 31, 2013. In his capacity as a corporate officer, M r. Fradin also benefits
from a supplemental pension plan on the same terms and conditions as all other BFCM employees.
2013 contributions to the insurance company amounted to €17,923 and covered the entire commitment.
156
Individual right to training (Droit individuel à la formation, DIF) hours earned by employees in accordance with Articles
L 933-1 to L 933-6 of the French Labor Code totaled 2,787.
Pursuant to Decree 2008-1487 of November 30, 2008 relating to statutory auditors, the fees paid for the statutory audit amounted to
€596,961.60. Fees for directly related advisory and other services totaled €939,428.10.
Note 4.8 Net additions to/reversals from provisions for loan losses
Amount
2013
ADDITIONS TO PROVISIONS FOR RECEIVABLES
REVERSALS OF PROVISIONS FOR RECEIVABLES
LOSS ON IRRECOVERABLE RECEIVABLES COVERED BY PROVISIONS
TOTAL
Amount
2012
(10,470)
10
63,045
(60,208)
(10,460)
2,837
The reversal of provisions and the loss on irrecoverable receivables in 2012 were related to the Greek sovereign debt risk.
Note 4.9 Gains (losses) on non-current assets
Amount
2013
GAINS (LOSSES) ON PROPERTY AND EQUIPM ENT
GAINS (LOSSES) ON FINANCIAL ASSETS
IM PAIRM ENT REVERSALS (LOSSES) ON NON-CURRENT ASSETS
REVERSALS FROM (ADDITIONS TO) PROVISIONS FOR RISKS AND CHARGES
TOTAL
Amount
2012
6
(20,218)
(13,253)
(14,000)
178,683
(103,200)
(47,465)
75,483
Note 4.10 Breakdown of corporate income tax
Amount
2013
(A) TAX ON ORDINARY INCOM E
(B) TAX ON EXTRAORDINARY ITEM S
(C) EFFECTS OF TAX CONSOLIDATION
Amount
2012
6,731
25,641
(41,652)
(40,013)
(A + B + C) INCOM E TAX FOR THE YEAR
ADDITIONS TO PROVISIONS RELATING TO INCOM E TAX
REVERSALS FROM PROVISIONS RELATING TO INCOM E TAX
(34,921)
(14,372)
TOTAL CORPORATE INCOME TAX FOR THE YEAR
(35,029)
(108)
(14,372)
157
158
25
4,736,290.22
1,915,023.19
5.95
12.71
4.96
339,294,315.93
48,974,566.71
-106,072,636.66
217,872.50
330,938,950.34
129,177,471.20
1,302,192,250.00
26,043,845
50 €
2009
(NB)
27
7,300,519.96
2,567,884.95
11.36
11.60
0.00
222,520,610.80
284,102,040.62
-11,742,875.03
93,768.43
302,074,929.32
0.00
1,302,192,250.00
26,043,845
50 €
2010
26
4,859,236.29
2,004,643.97
19.89
10.94
2.00
0.83
374,735,749.37
485,783,259.18
-41,469,790.81
120,989.88
289,765,321.77
52,463,198.60
1,324,813,250.00
26,496,265
50 €
2011
27
5,328,750.54
2,281,964.98
15.78
24.48
2.65
1.33
613,947,145.96
404,393,723.58
-14,371,909.94
62,577.07
649,396,490.02
70,263,445.09
1,326,630,650.00
26,532,613
50 €
2012
27
5,641,794.04
2,381,796.54
9.61
11.72
4.90 (b)
2.04 (b)
383,360,600.79
220,719,959.14
-34,921,389.62
91,347.06
311,481,573.22
130,116,946.54
1,329,256,700.00
26,585,134 (a)
50 €
2013
Note: Pursuant to CRC (Comité de la Réglementation Comptable, the French Accounting Regulations Committee) Regulation 2000-03, applied as from 2001,
the amount of corporate income tax mentioned above includes tax due for the year and movements on related provisions.
(b): A dividend of €4.90 was paid out for each share carrying dividend rights for the full year and a dividend of €2.04 was paid out for each new share carrying entitlement to dividends from August 1, 2013.
(a): 26,532,613 shares carrying dividend rights for the full year and 52,521 new shares carrying entitlement to dividends from August 1, 2013.
a) Average number of employees for the year
b) Payroll expense
c) Employee benefits (social security, benefit plans)
4. Employees
a) Earnings after tax and profit-sharing, but before depreciation, amortization and provisions
b) Earnings after tax, profit-sharing, depreciation, amortization and provisions
c) Dividend per share
3. Earnings per share
a) Net banking income, income from securities investments and other income
b) Income before tax, profit-sharing, depreciation, amortization and provisions
c) Corporate income tax
d) Profit sharing
e) Income after tax, profit-sharing, depreciation, amortization and provisions
f) Earnings distributed
2. Results of operations
a) Capital stock
b) Number of common shares outstanding
c) Par value of shares
d) Number of preferred shares (no voting rights) outstanding
1. 1. Capital at the reporting date
(amounts in €)
FIVE-YEAR FINANCIAL SUMMARY
31,137
CM-CIC IMMOBILIER (formerly ATARAXIA)
112,500 (2)
119,231
BANQUE DE TUNISIE, Tunis
CLUB SAGEM, SAS, Paris
519,845
998,461
10,265
68,594
COFIDIS PARTICIPATION, SA, Villeuneuve d'Asq
(4) NBI for credit institutions
(3) Revenue is "not applicable" for the company
(2) Amounts in thousands of Tunisian dinar (TND)
(1) Amounts in thousands of Moroccan dirham (MAD)
12,417,966
840,855
219,342
358,914 (2)
11,394
14,426,322 (1)
36,738
86,701
108,298
26,884
3,916,922
9,162,000
-23,612
460,292
-9,609
476,294
-98,206
EUROCLEAR, SA, Paris
BANCO POPULAR ESPAGNOL
3) Other (less than 10%-owned)
299,702
CAISSE DE REFINANCEMENT DE L'HABITAT, SA, Paris
1,719,635 (1)
64,399
CM-CIC LEASE, SA, Paris
BANQUE MAROCAINE DU COMMERCE EXTERIEUR, Casablanca
23,470
176,045
77,239
1,118,793
608,440
BANQUE DU GROUPE CASINO , SA, Saint Etienne
TARGOBANK Spain (formerly BANCO POPULAR HIPOTECARIO)
2) Associates (10% to 50%-owned)
SPI (SOCIETE PRESSE INVESTISSEMENT), SA, Houdemont
GROUPE DES ASSURANCES DU CREDIT MUTUEL, SA, Strasbourg
CREDIT INDUSTRIEL ET COMMERCIAL, SA, Paris
2,400
CARMEN HOLDING INVESTISSEMENT, SA, Paris
SOCIETE DU JOURNAL L'EST REPUBLICAIN
10,210
489,967
SOCIETE FRANCAISE D'EDITION DE JOURNAUX ET D'IMPRIMES COMMERCIAUX "L'ALSACE",
SAS, Mulhouse
105,934
35,685
15,200
BANQUE DU CREDIT MUTUEL ILE-DE-France, SA, Paris
BANQUE EUROPEENNE DU CREDIT MUTUEL, BECM, SAS, Strasbourg
3,892
40,038
EBRA, SAS
45,497
25,143
78,291
2,097
CIC IBERBANCO, SA à Directoire et Conseil de Surveillance, Paris
220,000
CREDIT MUTUEL-CIC Home Loan SFH (formerly CM-CIC COVERED BONDS)
-3,824
118,736
1,512
200,225
earnings at
Dec. 31, 2012
Shareholder's
equity other
than capital and
unappropriated
GROUPE REPUBLICAIN LORRAIN COMUNICATION, SAS, Woippy
600,000
CM AKQUISITIONS GmbH, Düsseldorf
Dec. 31, 2012
Capital
as of
VENTADOUR INVESTISSEMENT 1, SA, Paris
1) Subsidiaries (more than 50%-owned)
BFCM's CAPITAL (€13,292,567)
TERM EQUITY INVESTMENTS WHOSE GROSS CARRYING AMOUNT EXCEEDS 1% OF
A. DETAILED INFORMATION ABOUT SUBSIDIARIES, ASSOCIATES AND OTHER LONG-
Amounts are expressed in thousands of euros.
7.41
2.50
4.88
12.63
33.52
22.95
26.21
45.94
50.00
50.00
50.96
52.81
72.73
92.04
100.00
95.60
96.08
100.00
100.00
100.00
100.00
100.00
100.00
100.00
100.00
as of
Dec. 31, 2013
Percentage of
capital held
47,499
14,546
515,872
56,694
200,740
71,313
1,132,993
47,779
88,571
312,500
75,200
974,661
2,945,749
83,909
959,834
15,946
244,722
80,986
19,041
40,038
84,998
94,514
220,000
200,225
600,294
Gross
47,499
14,546
490,872
56,694
200,740
71,313
1,132,993
47,779
88,571
312,500
75,200
974,661
2,945,749
62,209
959,834
10,443
244,722
80,986
19,041
0
84,998
38,014
220,000
200,225
600,294
Net
Dec. 31, 2013
Carrying amount of
investment held as of
408,500
0
0
0
0
37,751
0
3,224,457
539,000
9,641
0
0
34,276,603
0
7,430,791
5,436
3,868,875
6,785
0
224,545
34,006
11,536
4,429,328
4,680,000
0
0
0
0
0
0
0
0
0
0
0
0
0
453,359
0
27,787
324,000
27,781
0
0
6,255,182
0
0
0
5,150,000
Dec. 31, 2013
Dec. 31, 2013
403,513
Guarantees
and
securities
granted by
the Bank as of
Outstanding
loans and
advances
granted by
the Bank as of
0 (3)
4,442
2,112 (4)
7,728
520,988 (4)
0 (3)
3,777,816 (4)
0 (3)
161,347 (2)
5,460 (4)
9,017,776 (1)
10,572 (4)
78,678 (4)
82,003 (4)
0 (3)
8,307,197
4,260,000
98,232
0 (3)
1,771
191,126 (4)
3,036
45 (4)
2,164
19,271 (4)
2012
in
Revenue
103,573
12,349
-2,460,943
NC
63,379 (2)
1,764
1,579,461 (1)
1,955
-8,439
483
-37,430
524,221
698,000
-2,212
40,244
-39,648
63,641
11,377
14
-6,455
1,343
-36,356
688
78,765
28,776
2012
in
(loss)
Net income
1,564
0
0
164
0
0
0
0
Notes
2,858 Consolidated
316
1,323 Consolidated
0
4,250
406
11,751 Consolidated
888
0 Consolidated
0
0
127,684 Consolidated
207,012 Consolidated
0
0
0
18,397
2013
in
Net
dividends
received by
the Bank
IV.3 - Information on subsidiaries and associated companies
159
160
12,144
586
a) Other investments in French companies (collectively)
a) Other investments in foreign companies (collectively)
3) Other investments not included in section A
3,152
b) Foreign associates (collectively)
0
305
47,542
Gross
6,604
Dec. 31, 2013
586
11,577
3,152
0
13,224
0
305
33,383
Net
Dec. 31, 2013
Carrying amount of
investment held as of
19,241
earnings as of
Dec. 31, 2012
Shareholders'
equity other Percentage of
than capital and capital held
unappropriated
as of
of which Société de Gestion des Parts du Crédit Mutuel dans le Journal "L'Alsace",
Société Civile, Strasbourg
Dec. 31, 2012
Capital
as of
a) French associates (collectively)
2) Associates not included in section A
b) Foreign subsidiaries (collectively)
of which SNC Rema, Strasbourg
a) French subsidiaries (collectively)
1) Subsidiaries not included in section A
LONG-TERM EQUITY INVESTMENTS
B. GENERAL INFORMATION ABOUT SUBSIDIARIES, ASSOCIATES AND OTHER
Dec. 31, 2013
Dec. 31, 2012
0
0
800
207
0
56,203
Guarantees
and
securities
granted by
the Bank as of
Outstanding
loans and
advances
granted by
the Bank as of
0
0
0
0
0
0
2012
in
Revenue
2012
in
(loss)
Net income
0
56
4,450
553
70
3,262
2013
Net
dividends
received by
the Bank
in
IV.4 - Statutory auditors’ report on the company financial statements
KPMG Audit
A unit of KPMG S.A.
1, cours Valmy
92923 Paris – La Défense Cedex
ERNST & YOUNG et Autres
1/2, place des Saisons
92400 Courbevoie – Paris-La Défense 1
S.A.S. à capital variable (Simplified stock company with
variable capital)
Statutory Auditors
Member of the Versailles
regional institute of accountants
Statutory Auditors
Member of the Versailles
regional institute of accountants
Banque Fédérative du Crédit Mutuel
Year ended December 31, 2013
Statutory Auditors’ report on the parent company financial statements
To the Shareholders,
In compliance with the assignment entrusted to us by your general meeting of shareholders, we hereby report
to you for the year ended December 31, 2013 on:
the audit of the accompanying financial statements of Banque Fédérative du Crédit Mutuel;
the justification of our assessments;
the specific verifications and information required by law.
These financial statements have been approved by the Board of Directors. Our role is to express an opinion
on these financial statements based on our audit.
I.
Opinion on the financial statements
We conducted our audit in accordance with the professional standards applicable in France: those standards
require that we plan and perform the audit to obtain reasonable assurance as to whether the financial
statements are free of material misstatement. An audit involves performing procedures, using sampling
techniques or other methods of selection, to obtain audit evidence about the amounts and disclosures in the
financial statements. An audit also includes evaluating the appropriateness of accounting policies used and
the reasonableness of accounting estimates made, as well as the overall presentation of the financial
statements. We believe that the audit evidence we have obtained is sufficient and appropriate to provide a
basis for our audit opinion.
In our opinion, the financial statements for the year ended December 31, 2013 give a true and fair view of
Banque Fédérative du Crédit Mutuel’s assets, liabilities, financial position and of the results of its operations
in accordance with French accounting rules and principles.
II. Justification of our assessments
In accordance with the provisions of Article L. 823-9 of the French Commercial Code (Code de commerce)
relating to the justification of our assessments, we draw your attention to the following points:
The Company uses internal models and methods to value positions in financial instruments that are not
listed on active markets, as well as to recognize certain provisions, as described in Note 1 to the financial
statements. We examined the control systems applied to the models used and to the process of
determining whether or not a market is inactive and to the criteria used.
161
As stated in Notes 1 and 2.4 to the financial statements, the Company records impairment losses and
provisions to cover the credit risks inherent to its business. We examined the control systems applicable to
the monitoring of credit risk, the assessment of the risk of non-recovery and the coverage of said risks, as
regards assets by specific impairment losses and as regards liabilities by general provisions to cover credit
risks.
The Company makes other estimates in the usual context of preparing its financial statements, in
particular as regards the valuation of investments in non-consolidated companies and other long-term
equity investments, and the assessment of retirement benefit obligations recognized and provisions for
legal risks. We examined the assumptions made and verified that these accounting estimates are based on
documented methods in accordance with the principles described in Note 1 to the financial statements.
These assessments were made as part of our audit of the financial statements taken as a whole, and thus
contributed to the opinion we formed which is expressed in the first part of this report.
III. Specific verifications and information
We have also performed, in accordance with professional standards applicable in France, the specific
verifications required by French law.
We have no matters to report as to the fair presentation and the consistency with the financial statements of
the information given in the management report of the Board of Directors and in the documents sent to
shareholders on the financial position and the financial statements.
As regards the information provided in accordance with Article L. 225-102-1 of the French Commercial
Code on remuneration and benefits paid to corporate officers and commitments made in their favor, we
verified the consistency of this information with the information given in the financial statements or with the
data used to prepare the financial statements, and, if applicable, with the information received by the
Company from companies that control it or are controlled by it. On the basis of this work, we certify that this
information is accurate and fair.
In accordance with French law, we have verified that the required information concerning the purchase of
investments and controlling interests has been properly disclosed in the management report.
Paris-La Défense, April 14, 2014.
The Statutory Auditors
KPMG Audit
A unit of KPMG S.A.
Arnaud Bourdeille
ERNST & YOUNG et Autres
Olivier Durand
162
V. SOCIAL AND ENVIRONMENTAL
RESPONSIBILITY
163
V.1 - General information
V.1.1 - Foreword
Pursuant to Article R225-105 of the French Commercial Code (code de commerce) the management report
must describe the actions taken and policies adopted by the company to take into account the social and
environmental consequences of its activity (Grenelle II Law, Article L.225).
Given the Group’s organization, the required information is provided below in the name of Caisse Fédérale
de Crédit Mutuel on behalf of the CM11-CIC scope. At the CM11-CIC scope, Caisse Fédérale de Crédit
Mutuel holds the collective license (banking code) for all the affiliated Caisses and is the head of the group
comprising Banque Fédérative du Crédit Mutuel and its subsidiaries as defined in Articles L.233-3 and
L.233-16 of the French Commercial Code.
Caisse Fédérale de Crédit Mutuel follows the recommendations of Crédit Mutuel’s national confederation
(Confédération Nationale du Crédit Mutuel) with regard to social and environmental responsibility.
The Federation and Caisse Fédérale de Crédit Mutuel
The local Caisses belong to a federation. Depending on where the local Caisses are located, the federation is
either an association governed by the Law of July 1, 1901 or, for those local Caisses situated in the French
departments of Haut-Rhin, Bas-Rhin and Moselle, an association subject to the locally applicable Civil Code.
As a strategic planning and control body, the federation represents Crédit Mutuel in its region.
From a regulatory, technical and financial standpoint, Caisse Fédérale de Crédit Mutuel holds the collective
banking license that benefits all affiliated local Caisses, in accordance with the French Monetary and
Financial Code.
Caisse Fédérale de Crédit Mutuel is responsible for the CM11 Group’s solvency and liquidity as well as the
Group’s compliance with banking and financial regulations.
On behalf of the local Caisses, Caisse Fédérale de Crédit Mutuel therefore performs financial functions such
as liquidity management and also provides technical, legal and IT services either directly or through
insurance, IT and leasing subsidiaries.
In application of the French Monetary and Financial Code, each Crédit Mutuel group is organized around a
Federation, a regional Caisse and all the local Caisses affiliated to the Federation, and uses the same banking
code as Caisse Fédérale de Crédit Mutuel. The latter holds the collective license granted by the French
Authority for Prudential Supervision and Resolution (ACPR) and guarantees the solvency and liquidity of
the affiliated Caisses.
Caisse Fédérale de Crédit Mutuel’s banking code is 10278.
Since January 1, 2012, the CM11 Group scope includes the Crédit Mutuel federations that have established
partnerships authorized by the supervisory authorities and that resulted in making Caisse Fédérale de Crédit
Mutuel, the common Caisse for the 11 Crédit Mutuel groups formed by:
-
Crédit Mutuel Centre Est Europe - CEE - (Strasbourg),
Crédit Mutuel Ile-de-France - IDF - (Paris),
Crédit Mutuel Midi-Atlantique - MA - (Toulouse),
Crédit Mutuel Savoie-Mont Blanc - SMB (Annecy),
Crédit Mutuel du Sud-Est - SE - (Lyon),
Crédit Mutuel Loire Atlantique et Centre Ouest - LACO - (Nantes),
Crédit Mutuel Normandie - N - (Caen),
Crédit Mutuel Méditerranéen - M - (Marseille),
Crédit Mutuel Dauphiné Vivarais - DV - (Valence),
Crédit Mutuel du Centre (Orléans); and
Crédit Mutuel Anjou - CMA - (Angers)
164
Each Federation has retained its autonomy and prerogatives in its territory.
Mutual support system within the Crédit Mutuel and CM11 groups
Crédit Mutuel’s mutual support system is designed to constantly ensure the liquidity and solvency of all the
entities affiliated to Confédération Nationale du Crédit Mutuel so as to avoid the collapse of any of its
members (Article L511-31 of the French Monetary and Financial Code). This system is based on a set of
rules and mechanisms put in place at the regional and confederal levels.
System at the regional group level
The mutual support system in place within the CM11 group is a federal support mechanism pursuant to
Article R.515-1 of the French Monetary and Financial Code and is independent of the statutory provisions
relating to the joint liability of stock-owning members within the limit of the nominal value of the shares
they hold.
The said article provides that the ACPR may, with respect to mutual and cooperative groups, issue a
collective license to a local bank for itself and all its affiliated local banks “when the liquidity and solvency
of the local banks are guaranteed through this affiliation”. Each of the regional central bodies has received a
collective license for itself and all of its member local banks. The ACPR has deemed that the liquidity and
solvency of the local banks is guaranteed through this affiliation.
All the local banks and Caisse Fédérale de Crédit Mutuel contribute to a mutual guarantee fund (Fonds de
Solidarité). Their contributions are calculated based on total assets and net banking income. The annual
contributions are calculated such that the amount, added to reimbursed subsidies, covers the needs of lossmaking local banks. The results of the mutual guarantee fund are therefore in principle balanced. Lossmaking local banks and those whose income is not sufficient to remunerate member shares receive an annual
subsidy to enable them to pay the said remuneration.
These subsidies are repayable on a return to better fortune. In such cases, the recovered local bank repays all
or part of the subsidies received previously, within the limit of an amount enabling it to payout the dividends
on class B member shares.
165
System at national level
Confédération Nationale du Crédit Mutuelis responsible in particular for ensuring the solidity of its network
and proper operations of its affiliated banks. To this end, it must take all necessary measures, in particular to
ensure the liquidity and solvency of each of its affiliated banks and that of the network as a whole (Article
L. 511-31 of the French Monetary and Financial Code).
The Board of Directors of Confédération Nationale du Crédit Mutuel may decide any necessary measures if
the systems in place at the level of the regional groups prove inadequate to deal with the difficulties
encountered by a group.
Corporate social responsibility
The Group’s fundamental cooperative values – mutual support, solidarity and responsibility – are of
particular significance in a society shaken by economic uncertainties. Its strong regional presence and close
ties with the different players enables it to meet the expectations of its customers and 4.4 million stockowning members.
The sustainable development approach has ensured greater and shared awareness: it corresponds to the
Group’s fundamental values which emphasize the long-term and responsible nature of its banking activity.
These values have never seemed so necessary or so modern. They continue to guide our day-to-day
operations and our goals.
For the past nearly five years, we have published a weekly CSR newsletter to inform and train the various
contributors. This newsletter includes a general news and market watch and highlights good practices at any
of the Group’s entities, thereby enabling us to develop a pedagogical action that was extended to all Group
employees in the autumn of 2013.
This report contains:
- A limited illustration of the diversity of the actions taken and commitments made by the CM11-CIC
group and its subsidiaries, which are presented in greater detail in the annual CSR report.
- Tables with quantified data consolidating the extra-financial indicators used by the Group.
- A description of the methodology used describing the system used to consolidate the quantitative and
qualitative data collected from the Group’s entities, thereby enabling the Group to comply with its
obligations under Article L.225 of the Grenelle 2 Law and more clearly define its goals in this area.
V.1.2 - Sustainable development strategy: access to banking service for all
Led by several regional and national elected representatives of its stock-owner members, CM11-CIC first
began to examine the issues of sustainable development and corporate responsibility many years ago. A
formal policy was drawn up more than eight years ago which, through the various commitments made and
actions taken by group entities, has enabled the Group to gradually build and add to a reporting base that
complies with Grenelle 2 requirements. The cooperative reports and other reports on mutualist activities that
already exist make it easier for the Group to comply with the new reporting requirements. The active
involvement of all within the Group, from local banks to subsidiaries, has over the years enabled it to build
up group expertise, develop reliable data collection and indicators and set improvement targets.
CM11-CIC’s corporate and social responsibility approach is influenced to a large extent by its organization
as a cooperative group. Their dual capacities as members and customers enable the Group’s users/co-owners
to contribute to its management and strategic choices. Its cooperative, decentralized organization close to its
users enables it to offer them a range of appropriate products and services accessible to all. The local banks
are the key element in this close relationship with member-customers, who are more than just consumers.
Each year, close to 1,400 General Meetings are held enabling the Group’s 4.4 million member-customers to
elect their representative on the basis of one man one vote, resulting in the election of nearly 16,400
directors, of whom 4,700 are women. The number of members who attend the General Meetings of the
federations or are represented at them has remained virtually unchanged over the past five years at around
206,000, i.e. an average of 5% of total members. Initiatives have been taken to increase members’
involvement in the Group’s democratic governance, but their effective involvement depends greatly on the
each local bank’s local environment (rural area, city, history in the area, community momentum, means of
promoting involvement, etc.).
166
In a strained and increasingly competitive environment, the Crédit Mutuel has strengthened its fundamentals,
thanks in particular to the quality of the local services provided to its members. While continuing to expand
its customer bases to the benefit of the regional economies, the Group is frequently ranked among the safest
French banks, as illustrated by its ranking by Global Finance in 2012.
In particular, its strong local roots, clear focus on retail banking, prudent cooperative management and
financial strength has enabled it to increase its lending to medium, small and very small businesses.
Loyal to its cooperative origins, the Group contributes actively to ensuring access to banking services for the
entire French population.
By strengthening its network of banking outlets over the years, the Group has built up a strong and
diversified presence in every region in France. A genuine driver of social and economic cohesion, the Group
distributes its products and services through nearly 4,500 outlets in France and abroad.
A firm presence in city outskirts reflects the Group’s policy of leaving no population group aside. In 2013,
more than 15% of the Group’s operations were located in priority rural employment zones (ZAUER) and
more than 45% of urban free-trade zones (zones franches) were served by the Group, showing its constant
determination to provide quality service to its members-customers in every part of France.
The Group plays a key role in local networks and is an active partner to almost 60% of all works councils
and to a third of all associations(it counts more than 313,000 associations among its customers), particularly
in the areas of social and humanitarian aid.
Corporate social responsibility also includes ensuring integrity and honesty at every level of the organization.
Since April 2006, several Group entities have implemented a code of ethics and deontology that is original in
that it set the rules of good conduct for all levels, employees and elected directors, according to their level of
responsibility. It is based on the general principles of best serving customers interests and strict compliance
with confidentiality rules. Employees who hold “sensitive positions” are subject to even stricter rules
governing and limiting their personal transactions. This code is published and available on the Group’s
websites. The foreword to the code stresses the Group’s commitment to:
-
encouraging members’ involvement in the activities and governance of their local mutual bank;
building strong and lasting relations with members and customers based on reciprocal trust,
transparency and compliance with mutual commitments;
listening to, advising and helping members and customers with their projects and their difficulties;
offering high-quality products and services to members and customers;
contributing to local development and employment by encouraging people to save and channeling
deposits into the local and regional economy; and
helping improve the living environment, resolving social problems and promoting sustainable
development.
Committed to transparency and clarity in its relations with members and customer, the Group reaffirms its
determination to make information and practical advice available and accessible to all, thereby fulfilling the
undertakings given to consumer associations through the Consultative Committee on the Financial Sector
(Comité Consultatif du Secteur Financier – CCSF) of which it is a statutory member. Easy-to-understand
guides (Guides Clarté) and fee schedules for transactions and services are published at regular intervals for
each customer category (individuals, businesses, companies, farmers and associations).
The Group has joined the “Territorial” portal to provide information (regulatory, legal, news, etc.) relating to
the not-for-profit sector and continues to develop its own web library for not-for-profit associations
‘associathèque’.
V.1.3 - Social commitments
Despite a difficult economic and social environment, deposit taking has increased strongly, underlining the
trust in local banks and enabling them to develop their lending activities.
The Group can therefore provide its retail and business customers with simple and accessible financing
solutions (equipment loans, home loans, business creation loans, etc.) that meet their needs.
167
Against a background of slowing economic activity in France, investment and operating loans granted by the
Group increased by 2.80% relative to 2012 with total outstanding loans of €53.2 billion (regulatory CM11
scope +CIC network),thereby helping to finance the regional economies. Crédit Mutuel thus actively sustains
the local economies and employment.
Specific procedures have been developed with two guarantee funds, Oséo/BPI France and France Active
Garantie, to facilitate access to financing and bank loans for very small businesses.
As well as the ‘traditional’ lending offer, the Group granted a total of €216 million in micro-loans and
assisted loans through the ADIE and France Active networks under the NACRE and France Initiative Réseau
schemes. CM11-CIC promotes business development and job creation:
directly through the associations and foundations created by the regional federations – in particular
under the Créavenir label – to provide financing(honor loans, repayable advances, grants or
guarantees) and human resources to help entrepreneurs startup new ventures or take over existing
businesses. Financing criteria vary according to the regional organizations, but local roots and strong
responsiveness remain the common denominators;
- through partnerships with support networks: France Initiative, BGE (formerly Réseau boutiques de
gestion), France Active and ADIE. These networks seek to create and consolidate employment, in
priority for those excluded from the labor market (job seekers, minimum welfare benefit recipients,
disabled persons, etc.) and work together according to the amount of the loans, the size of the project
and the business creators financial capacity;
- by facilitating access to financing and providing technical and financial support.
In addition, the Facil’Accès program set up in 2009 gives people banned from issuing checks access to
banking through payment and cash withdrawal cards with systematic authorization. Partnerships with
guardianship organizations have also improved access to banking services for adult wards.
-
Supporting members and customers and encouraging mutual aid
In keeping with its cooperative and mutualist commitments, the Group provides solutions to assist the
economic and social integration of people in difficulty. Thanks in particular to their voluntary unpaid
directors, the local banks know how to find the right solutions and extend a “helping hand” to members and
customers through customized solutions and adapted financing. Strongly involved in the distribution of
subsidized loans, the Group has set up partnerships whenever it seemed preferable to work through
experienced and competent associations.
The Group’s unpaid voluntary directors and employees work hand-in-hand to coordinate the internal
solidarity structures: economic and social aid committees, solidarity commissions, and solidarity credit
unions. They work with associations and social welfare bodies to accompany persons in difficulty. Particular
attention is paid to instances where people have experienced a sudden or accidental change in their personal
or professional situation: illness, redundancy, and other adverse life events. To address the difficulties
experienced by people with serious health problems, the local mutual banks have devised the Areas
agreement to facilitate access to insurance and credit. In addition, several federations have published
‘solidarity guides’ to help directors and account managers to provide concrete and suitable answers to the
specific needs of members who are in difficulty.
Some regional groups have been involved in original initiatives for several years: in 2004, in partnership
with the Secours Catholique social aid organization, the Group became the first bank to grant personal
microcredit. Microcredit has since become part of a State scheme, managed by the Fonds de Cohésion
Sociale (FCS) social aid fund. The Group assumes 50% of the risk on these loans, the rest being borne by
FCS through an agreement with Caisse des Dépôts et Consignations. Similar agreements have been signed
with other partners, in particular Familles Rurales, to extend access to subsidized microcredit to rural areas.
Within Federation Centre Est Europe, assistance for members in difficulty is for the main part provided
directly by the local banks. Thanks to their in-depth knowledge of their members and with the help of the
voluntary directors, they respond by arranging local loans (for small amounts) to help them overcome
temporary difficulties: temporary layoffs, acquiring a means of transport to allow them to take a job in a
neighboring village, etc. In this context, the local banks have lent more than €35 million to respond to 22,000
urgent requests from members and help them out of their difficulties.
168
Alongside its long-standing commitment to economic and social integration, the Group is deeply involved in
combating illiteracy and promoting reading, and more generally, in promoting culture, music and national
heritage.
A socially responsible investment offer based on non-financial criteria
“Socially Responsible Investment is an investment which aims to reconcile economic performance with
social and environmental impact, by funding companies and public institutions across all sectors whose
business is geared towards sustainable development. By touching on issues of governance and corporate
behavior, SRI acts as a driver for a sustainable economy.” The Group adheres fully to this definition,
proposed in 2013 by AFG (Association Française de la Gestion financière) and the French SIF (FIR - Forum
pour l’Investissement Responsable). This clear, concise and understandable definition will promote greater
transparency for SRI funds open to the public and will undoubtedly pave the way for a French SRI label.
For its part, CM-CIC AM, which has been a member of the French SIF since 2004, and is also a member of
Euro SIF, of ICGN (International Corporate Governance Network) and of the CDM (Carbon Disclosure
Project) water program, has adhered to the AFG-FIR transparency charter since the beginning and adhered to
the UN Principles for Responsible Investment (PRI) in 2012.
The businesses included in the SRI portfolio managed by CM-CIC Asset Management are selected according
to strict criteria and represent investments of nearly €5.7 billion managed in several Novethic-certified funds.
Fair practices
Social and environmental responsibility can be defined as respecting stakeholders’ expectations in areas
other than solely financial objectives. In this respect, many of the Group’s decision-making structures now
integrate CSR aspects into their practice. Several regional groups have set up special CSR committees
composed of federal directors. The main missions of these committees concern group-wide CSR reporting
and action plans related to environmental aspects and business practices.
As well as the various codes and charters implemented by Group companies, an effective system for
combating money laundering (AML) and terrorist financing has been put in place. It is based on AML
correspondents in each entity in France and abroad. Periodic, permanent and compliance controls are
implemented to ensure the risks are covered and ensure the consistency of the procedures implemented.
Lastly, the Group does not have any operations in so-called non-cooperative countries and territories, the list
of which is published regularly by the French government. Transactions that might be carried out by
customers with countries on the FATF blacklist are subject to reinforced vigilance.
The Group has introduced stronger security measures for customer transactions via the Internet. The Group’s
IT subsidiary, Euro Information (E-I), has dedicated teams whose task is to constantly update software and
security patches and perform a market watch for remote banking delinquency. Security levels are audited
regularly by independent auditors. E-I has also developed a special module known as Barre de confiance CM
which is installed in Firefox, Chrome and Internet Explorer to secure browsing: as soon as it detects a
phishing site, the module blocks the page and suggest that the customer leave the site immediately. Lastly, a
special email address [email protected] enables anyone who believes they have identified a
fraudulent site to contact Euro Information and systematically receive a reply.
V.1.4 - An ambitious human resources policy guided by mutualist values
Essential to all its economic activities, the men and women that form the CM11-CIC Group are of prime
importance. The Group’s 58,320 employees benefit from favorable wage agreements in terms of working
conditions, particularly social protection, paid leave and training.
Efficient training policies, good human relations and the application of mutualist values result in responsible
business practices and offerings.
The Group’s overall labor policy is guided by its mutualist and cooperative values. This is reflected in a
remuneration system that is not commission-based, topped up by incentive and profit-sharing schemes that
are favorable to employees.
169
Jobs, diversity, training policy and career advancement
Sustainable human resources management consists not only in respecting diversity and developing skills; it
also means encouraging independence and career progression. Numerous initiatives have already been taken
in this respect: professional training to develop skills and favor advancement, diversity in recruitment and
increased attention to gender balance.
Other measures still need to be developed and improved such as managing age issues and integrating
disabled workers.
Career advancement at the different levels of responsibility within the regional groups is favored through
constant and significant investment in training (71% of employees received training in 2013, representing an
average of one week of training per employee) and time-off for self training, in particular via the Athena
intranet training application. It is also based on good labor relations and a decentralized organization that
encourages independence and group recognition. This policy adds to staff mobility, enabling employees to
move from support functions to more commercial coordination and management functions. The Group’s
priorities are to support employment, build staff skills and loyalty (84% of employees have permanent work
contracts), diversify recruitment and promote equal opportunity. Employment is not an adjustment variable,
it is a strategic objective. Some regional groups, such as CMN, have signed diversity or gender equality
charters that are implemented for recruitment and promotion. In 2013, several agreements were signed to
combat intergenerational discrimination (against young and old). CM11-CIC has undertaken to maintain
older employees in their jobs and keep the proportion relative to the total workforce in line with that in 2012
over the three years of application of the plan. This global drive in favor of professional equality has resulted
in an increase in the number of women in executive and management positions (the percentage of women in
management positions has increased from 26% in 2007 to 32% in 2013. Two gender equality agreements
were signed in 2013.
Careful attention to working conditions :
The Group’s human resources policy places great importance on developing action plans for prevention and
monitoring with regard to employee health and safety issues. For many of the Group’s entities, 2013
featured:
-
-
Implementation of an action plan to prevent stress at work. The issues dealt with concerned
workstation ergonomics, the intranet, use of the messaging service, the manager’s role and training
and training and assistance for employees.
Adopting charters relating to the prevention of harassment and violence, which were signed and
included in the internal rules of the companies concerned (CIC, etc.); and
Leaflets entitled “Preventing any type of harassment and violence in the workplace” were handed out
to employees.
Labor relations
Labor relations within the Group are based on complementary bargaining levels at regional and national
levels. The national agreement provided a common base applied by all the regional federations. Following
these national agreements, discussion may begin to take into account factors specific to the regions
concerned. The Group has regular discussions with the unions and staff representatives. Following on from
the previous agreement signed in June 2012, it updated in September 2013 the agreement relating to union
rights and labor relations with all six unions involved and an agreement relating to minimum standard wages
was signed.
Moreover, the sector joint bodies that oversee and monitor training and employment (CPNE - national joint
commission for employment, Observatoire des Métiers - employment and professional training research
body) are also involved in analyzing business trends. In June 2013 the Group’s employment and professional
training research body analyzed the changes in customer relationships arising from changed customer
expectations and new technology and their impact on the organization and development of the jobs
concerned. It also carried out a survey of the way new recruits are welcomed to the Group. Lastly, the
discussions held at the end of 2013 resulted in wage agreements that are among the most beneficial to the
employees in the banking sector.
170
Promoting and complying with ILO conventions
Given its activities and the location of its sites, the Group does not believe that issues related to the
elimination of forced or compulsory labor or child labor apply to it directly. It is nonetheless aware of the
commitments given in the context of the Global Compact and prohibits the use of forced labor or child labor
as defined in the ILO convention.
Social responsibility has also been factored into the Group’s procurement policy, which is mainly based on
group procurement centers such as Euro Information, SOFEDIS and CM-CIC Services. This last is
responsible for logistics and takes social responsibility aspects into account in its calls for tender for general
resources suppliers, particularly with regard to undeclared labor, and requests information on their CSR
approach at each account review (at least annually but usually half yearly).
V.1.5 - Environmental issues
The Group works toward better management of resources, energy savings and reduced environmental
impact. Given its activity as a service provider, the Group’s environmental impact is limited. Nevertheless,
areas have been identified for improvement and quantified objectives have been set that take into account the
specific nature of its activities (reducing paper consumption, more efficient travel planning, reducing energy
consumption: lighting, heating, putting computers in sleep mode, etc.).A self-training module on social and
environmental responsibility is being put together and will be rolled out for all staff early in 2014.
As part of the plan to identify ways to reduce greenhouse gas emissions (BEGES) implemented in 2012 at all
the entities legally required to do so, it has been possible to define common objectives and objectives
adapted to each entity according to its geographic locations, buildings used, etc. and to jointly decide on the
measures to be taken to improve energy efficiency and heat and sound insulation.
Several initiatives have been taken in terms of travel planning, with car pooling sites (intra and extranet) set
up at CM Loire Atlantique and CMCEE or co-financed, such as that of Parc de la Haute Borne co-financed
by Cofidis. Other initiatives were taken to heighten staff awareness of environmental issues and jointly seek
solutions. Generally speaking, with a view to reducing travel, employees have several means at their disposal
for organizing and attending meetings: conference call via Office Communicator or Live meeting, with a
Roundtable option, videoconference, etc. Car fleets have been reviewed applying increasingly restrictive
criteria (lower capacity engines and hybrid or electric vehicles). Lastly, the Group is the biggest user of La
Poste’s ‘green’ stamp service (i.e. not using airmail or night work), with a penetration rate of 80%.
For a number of years, the Group has been behind numerous environmental initiatives at local and regional
levels. It has developed specific products and, in addition to interest-free ‘green’ loans, it offers loans for
long-term energy savings (€45.6 million in outstanding loans) and Scrivener energy savings loans (€50
million outstanding). It is actively involved in encouraging the development of new types of housing known
as ‘participative housing’ which could provide a third way between an individual house and collective
housing. It also works to develop renewable energies and has financed several investments in methane
production and wind energy plants.
A policy has been adopted in corporate banking with a view to improving control of social and
environmental risks. All new project financing in excess of €10 million will be subjected to a more in-depth
review by the division concerned and an annual report. The Group plans to adapt this approach to the other
business lines.
Although it has no particular vulnerability to the hazards of climate change, the Group has begun to develop
strong expertise in reducing energy consumption. It is aware of the issues and followed the national debate
on energy transition that ended in July 2013. It will follow the parliamentary debate in 2014 with great
interest. CM-CIC Services Immobilier (which manages a large part of the group’s real-estate portfolio)has
already begun work to prepare for application of Law No. 2013-619 of July 16, 2013, which introduces
various provisions for adapting to EU sustainable legislation (DDADUE), including the obligations for large
companies to perform a first energy audit before 5 December 2015.
Finally, the group is involved in many corporate citizenship projects to promote sustainable development,
notably to help with the emancipation of populations in emerging countries. For the past thirty years and
more, Centre international du Crédit Mutuel (CICM) has helped populations in emerging countries take
charge of their economic and social development by creating autonomous savings and credit cooperative
societies, whose management is transferred gradually to the members.
171
Against a difficult political backdrop throughout Africa, Centre International du Crédit Mutuel in 2013
reaffirmed its goals: to continue the commitments made, improve risk cover for all the subsidized banks in
Africa and South-East Asia and work to give the banking networks independence. The SIBANQUE software
implemented by CICM to help the networks develop in a professional manner was updated in November
2013. It will facilitate management of wage domiciliation, management of loan collateral and transactions
throughout the network. CICM is equally capable of meeting the needs of a mature network already and the
payment card stage with the BISO card (MUCODEC, Congo) and those of a younger network (CMBF,
Burkina Faso). This provides an excellent illustration of the technical synergies between the development of
CICM’s partner networks and an efficient management tool (transactions, loans, cash, data centralization,
etc.).
To respond to an emergency situation and to help rebuild Haiti, the Group put together the “Together, let's
rebuild Haiti” operation, with the dual objectives of financing the operation, reconstruction and development
of the French Hospital in Port-au-Prince and the building of a residential quarter at Lafiteau.
Overall, with these actions the Group seeks to promote the cooperative model, whose way of operating is a
model of democracy that encourages autonomy, responsibility and solidarity.
V.2 - Methodology - Indicators
The Group sees corporate social responsibility as a means of strengthening its identity and highlighting its
cooperative status. Aware of the challenges facing society, the Group took early action to produce CSR
indicators to enable it to identify the behavior and contribution to society of Group entities and report on
them.
The measurement and reporting methodology developed in 2006 has been extended gradually to all Group
banking and insurance entities. It is regularly updated and added to by a CSR working group set up at
national level, which brings together all the regional federations and the Group’s main subsidiaries.
In CSR matters, CM11-CIC follows the recommendations issued by the Confederation, which publishes a
CSR report.
This working group meets at least six times each year, enabling group entities to exchange information about
internal initiatives and good practices for implementing corporate social responsibility at company level.
Exchanges with stakeholders and other cooperative banks have also enabled them to share knowledge about
governance indicators and define a common set of indicators.
This methodology is the result of a collective effort and defines the rules for collecting, calculating and
consolidating indicators, including the scope of application and the controls to be performed. It is intended
more particularly for the national coordinators involved in collecting and reporting data at the Crédit Mutuel
regional federations and the main subsidiaries and can involve contributions from experts. The methodology
defines the audit trail for both internal and external verifications.
This methodology constitutes a common framework for collecting information within the group on an annual
basis. The data collected comprises close to 400 regularly reviewed items that enable the Group to put
together the 42 indicators required under Article 225 of the Grenelle 2 law, as well as numerous additional
indicators relating to the Group’s cooperative activities and democratic governance.
The information published reflects the Group’s commitment to improving knowledge and transparency.
Qualitative indicators provide a view of all or part of the actions carried out or undertakings given by all or
part of the Group and testify to its constant commitment to corporate social responsibility. The quantitative
indicators enable measurement of the changes that have taken place. In 2012, many of the indicators were
audited and their reliability checked by the independent auditors so as to certify their existence and
compliance with the requirements under Article 225 of the Grenelle 2 law.
Data collection is announced in the autumn so as to mobilize all the departments concerned and organize
reporting and consistency checks. Data collection is broken down into a collection of quantitative and
qualitative data. It may be necessary to adjust certain prior year data after checking the scope, the collection
method and basis for calculation (e.g. Insee map for qualifying operations in rural areas, etc.). Generally
speaking, in the case of partnerships (such as in microcredit) and service providers, preference is given to the
data collected directly by the partner in question.
172
Scope and definitions
For CSR reporting purposes the parent company is defined as Caisse Fédérale, the 11 partner federations and
all the Crédit Mutuel local banks affiliated to the Caisse Fédérale, which holds the collective license on their
behalf. The scope of this report covers that parent company and all the entities it controls within the meaning
of Articles L. 233-3 and L. 233-16 of the French Commercial Code.
In this report, “CM11-CIC Group” designates the member federations and local banks and the BFCM group.
The term “Group” refers to the Crédit Mutuel Group unless otherwise specified.
Employee data:
The workforce data relates to the salaried employees on the payroll at December 31, excluding trainees,
temporary workers and external service providers. The absenteeism data includes all the following absences
of employees with permanent contracts, fixed-term contracts and student contracts: indemnified sick leave,
non-indemnified sick leave, sick leave without a medical certificate, work and travel to work accidents,
special leave, leave to care for a sick child, prolonged unpaid leave (more than one month), sabbatical leave,
parental leave and work inability leave. It does not include paid leave or days off under collective agreements
(compensatory time, seniority, marriage, etc.) or maternity or paternity leave. Lastly, the percentage of
payroll spent on training does not include Fongecif subsidies or student training.
Social data:
The data relating to microcredit consists of the data provided by the Group’s main partners, i.e. Adie and
France Active, which is broken down by federation, and the data provided by Initiative France, which
consists of the global figures for Crédit Mutuel and CIC (to which the national progression factor can be
applied at regional level).
In October 2012, DATAR published a new classification of rural areas in France based on work carried out
by INSEE in 2011. This classification has resulted in significant changes in our assessment of our presence
in rural areas. We consider any outlet in a municipality with fewer than 5,000 inhabitants to be a rural area.
Environmental data:
As energy and water consumption data is not available for all the CM11-CIC Group branches, CM-CIC
Services has developed a calculation system for estimating these figures when necessary.
The reported data for Cofidis and CMA and for part of branches in the CM11-CIC network is based on
energy bills. Estimates are made for consumption of the CIC branches, but consistency checks are performed
between the reported data and the amount billed in respect of energy consumption and the branches are
requested to provide explanations.
For the rest of the scope, representing more than a third of the total reported data, consumption is based on
estimates. The missing data not inputted by the contributors has been estimated based on the following:
-
When data has been entered for some months, it is extrapolated over the missing months based on
the average for the months for which data was entered;
When no data has been entered but the surface area is known, consumption is calculated based on the
surface area of the buildings applying the group average (energy consumption per square meter);
Lastly, if the surface area is not known, a surface area is attributed based on the type of building and
the national rate per m² is applied.
Given the nature of the Group’s activities, its impact in terms of noise, ground pollution and other forms of
pollution at its operating sites is not significant. Neither does the Group have any significant impact on
biodiversity. However, these aspects have been reintegrated into its overall CSR approach although not
included in this report. Credit Mutuel has not recognized any provisions in its accounts in respect of
environmental risk.
Scope of consolidation
All in all, the scope retained covers all the group’s banking, insurance and telephone activities, i.e. 90% of
CM11-CIC’s total workforce. The press activity has been excluded from the scope this year given its
173
particular characteristics. Appropriate indicators will be developed in the near future to enable it to be
included gradually in future reports.
For details regarding the composition of the sub-groups, please refer to the reports published by the reporting
entities.
Area
Governance
Corporate
Social
Environmental
responsibility
Measurement indicator
Number of members
and
Number of employees (average
full-time equivalents)
Coverage ratio
100%
90%
Exclusions from scope
No
exclusion:
all
core
cooperative
activities
are
covered.
Total group France (excluding
press activity. 98% of total
banking/insurance activities.
The data of some subsidiaries (namely CIC, Lyonnaise de banques, Cofidis, CMA and Targo) was reviewed
as part of the verification of extra-financial data reported by the Crédit Mutuel group. The CSR information
reported by the entities concerned by Article 225 of the Grenelle 2 law (CIC, Lyonnaise de banques and
Cofidis) has been audited based on analytical reviews, substantiation tests on a sampling basis and a
consistency review based on interviews, and a report testifying to the existence of the information and
expressing an opinion on its sincerity was issued by the auditors designated as an Independent Third Party.
CSR governance and reporting
The measurement and reporting methodology developed in 2006 has been extended gradually to all Group
banking and insurance entities. It is regularly updated and added to by a CSR working group set up at
national level, which brings together all the regional federations and the Group’s main subsidiaries.
The CSR mission is attached to the Institutional Relations Department of the General Management of Crédit
Mutuel’s national confederation. The twenty or so CSR correspondents within the federations and main
subsidiaries meet regularly to define reporting methods and procedures and propose targets. Within the
regional entities and the subsidiaries, several employees may be involved in CSR both with regard to general
strategy and reporting. Several federations have set up networks of CSR coordinators at the level of the local
banks. With regard to CM11-CIC, at the level of Crédit Mutuel Loire Atlantique et Centre Ouest (LACO), an
Agenda 21 commission has been in place for the past five years and takes action in the field.
This working group meets at least six times each year, enabling group entities to exchange information about
internal initiatives and good practices for implementing corporate social responsibility at company level.
Exchanges with stakeholders and other cooperative banks have also enabled them to share knowledge about
governance indicators and define a common set of indicators.
This methodology is the result of a collective effort and defines the rules for collecting, calculating and
consolidating indicators, including the scope of application and the controls to be performed. It is intended
more particularly for the national coordinators involved in collecting and reporting data at the Crédit Mutuel
regional federations and the main subsidiaries and can involve contributions from experts. The methodology
defines the audit trail for both internal and external verifications.
This methodology constitutes a common framework for collecting information within the group on an annual
basis. The data collected comprises more than 300 regularly reviewed items that enable the Group to put
together the many indicators required under Article 225 of the Grenelle 2 law as well as numerous additional
indicators relating to the Group’s cooperative activities and democratic governance.
The information published reflects the Group’s commitment to improving knowledge and transparency.
Qualitative indicators provide a view of all or part of the actions carried out or undertakings given by all or
part of the Group and testify to its constant commitment to corporate social responsibility. The quantitative
indicators enable measurement of the changes that have taken place. In 2012, many of the indicators were
audited and their reliability checked by the independent auditors so as to certify their existence and
compliance with the requirements under Article 225 of the Grenelle 2 law.
Data collection is announced in the autumn so as to mobilize all the departments concerned and organize
reporting and consistency checks. Data collection is broken down into collection of quantitative and
qualitative data. It may be necessary to adjust certain prior year data after checking the scope, the collection
method and basis for calculation (e.g. Insee map for qualifying operations in rural areas, etc.). Generally
174
speaking, in the case of partnerships and services providers, preference is given to the data collected directly
by the partner in question.
The CSR indicators selected by the group are based on the various existing reporting standards and
guidelines, notably:
-
-
-
The definitions of the indicators given in the environmental, labor relations, social and governance
reporting files,
the Global Reporting Initiative (version 3);
Article 225 of the Grenelle 2 law;
greenhouse gas assessments (Decree 2011-829 of July 11, 2011);
the principles of the International Co-operative Alliance (ICA);
The CoopFR Cooperative Identity Charter adopted in 2010,
International Labour Organization (ILO) Recommendation No. 193 on the promotion of
cooperatives,
OECD guidelines,
the Global Compact (member since 2003);
the transparency code of the Association Française de Gestion Financière - Forum pour
l’Investissement Responsable (AFG-FIR - French Asset Management Association - Forum for
Responsible Investment);
the label of the Comité Intersyndical de l’Epargne Salariale (CIES - Inter-Union Committee on
Employee Savings Plans);
regular exchanges with stakeholders (shareholders’ meetings, NGOs, non-financial rating agencies,
etc.);
Collective guidelines for CSR practices drawn up by the European association of cooperative banks
(EACB..) and other cooperative sectors and the commitments given by the Group at national and/or
federal level:
the principles of the International Co-operative Alliance (ICA);
Principles for Responsible Investment (PRI),
Transparency international France,
The World Forum’s Responsible Company Manifesto,
The Novethic socially responsible investment label
The Finansol solidarity products label.
Subject to the provisions of the third paragraph of Article R. 225-105, the Board of Directors
or Executive Board of the company meeting the conditions set out in the first paragraph
of Article R. 225-104 shall disclose, pursuant to the provisions of the fifth paragraph
of Article L. 225-102-1, the following information in its report:
1° Labor Information:
Crédit Mutuel
Indicators
contained
in this CSR
report
And §3 in this
CSR report
a) Employment:
-
Total headcount and breakdown by gender, age and geographic area;
SO 1
-
Recruitments and dismissals;
SO 02 ; 03
-
Compensation and its evolution
SO 13 ; 14
) Organization of work:
-
Organization of working hours;
SO 04
c) Labor relations:
-
Organization of relations with employees, in particular staff information and consultation
procedures and procedures for negotiating with employee representatives;
SO 11
-
Assessment of collective bargaining agreements;
And §3 in this
CSR report
d) Health and safety:
-
Health and safety conditions at work;
SO 05
175
-
Assessment of agreements with unions and staff representatives regarding health and
safety at work;
e) Training:
-
Training policies implemented;
SO 07
-
Total hours of training;
SO 08
f) Equal treatment:
-
Measures to promote gender equality;
-
Measures to promote the employment and integration of disabled people;
-
Anti-discrimination policy;
2° Environmental information:
SO 09 ; 10
And §3 in this
CSR report
And §4 in this
CSR report
a) General policy on environmental issues:
- Organization adopted by the company so as to take into account environmental issues and,
where necessary, environmental assessments or certification procedures implemented by ENV 07 ; 08
the company;
And §4 in this
- Employee training and information on environmental protection;
CSR report
b) Pollution and waste management:
Measures for preventing, reducing or repairing discharges into the air, water or soil with a serious
impact on the environment;
ENV 05
- Measures for preventing, recycling or eliminating waste;
ENV 06
c) Sustainable use of resources:
Water consumption and supply by reference to local constraints;
ENV 01
Consumption of raw materials and measures taken to improve their efficient use;
ENV 02 ; 03
Consumption of energy, measures taken to improve energy efficiency and use of renewable ENV 04
energy;
d) Climate change:
-
Greenhouse gas emissions;
ENV 05
e) Protection of biodiversity:
Measures taken to preserve or develop biodiversity;
3° Information on social commitments in favor of sustainable development:
NA
And §2 + §1 in
this CSR report
a) Territorial, economic and social impact of the company's activity:
In terms of employment and regional development;
On local and neighboring populations*;
SOT 01 to SOT
09
SOT 11 to SOT
15
b) Group relations with persons or organizations with interests in the companies’ activities,
notably associations working on social inclusion, educational institutions, environmental and
consumer associations, and local residents:
Conditions of dialogue with these persons or organizations;
§2 in this CSR
report
SO 10
Partnership and patronage;
c) Subcontracting and suppliers:
Inclusion of social and environmental issues in procurement policy.
NA
(*) See §1 in this CSR report
176
II. Subject to the provisions of the third paragraph of Article R. 225-105 and in addition to
the information stipulated in point I, the Board of Directors or Executive Board of the
company whose securities are admitted for trading on a regulated market shall disclose the
following information in its report:
1° Labor information:
Crédit Mutuel
Indicators
contained
in this CSR
report
And §3 in this
CSR report
b) Organization of work:
-
Absenteeism;
SO 05
d) Health and safety:
- Frequency and severity of accidents at work and occupational illnesses;
SO 06
g) Promotion of and compliance with the provisions of the fundamental conventions of the
International Labor Organization on:
- Freedom of association and the right to collective bargaining;
SO 11
- The elimination of discrimination in respect of employment and occupation;
And comments
- The elimination of forced or compulsory labor;
in §3 in this
- The effective abolition of child labor ;
CSR report
3° Information on social commitments in favor of sustainable development:
c) Subcontracting and suppliers:
the extent to which subcontracting is used and the importance given to the social and See §2 in this
environmental responsibility of suppliers and subcontractors;
CSR report
d) Fair business practices:
-
-
Measures taken to prevent corruption;
-
Measures taken in favor of consumer health and safety;
e) Other measures, that come under this section 3, taken to promote human rights.
V.3 - CSR report – 2013
GOVERNANCE
(the data provided applies only to the regulatory scope*)
Number of local mutual banks
Number of elected representatives - Local mutual banks
Number of elected representatives in the Board of Directors
o/w women
Number of elected representatives - Federation
Number of directors invited to Board meetings of local mutual
banks
Number of directors in attendance at Board meetings of local
mutual banks
Representation
Number of newly elected representatives - Local mutual banks
o/w women
Number of newly elected Chairmen - Local mutual banks
o/w women
% of women among newly elected representatives – Local mutual
banks
% of women among newly elected Chairmen – Local mutual banks
Number of newly elected representatives - Federations
o/w women
2013
2012
1,382
16,410
10,888
3,322
271
1,360
16,298
NA
NA
271
10,887
10,702
8,475
9,076
1,303
526
134
32
1,362
617
NA
NA
40%
24%
128
8
NA
NA
11
2
177
Number of newly elected Chairmen - Federations
o/w women
13
0
NA
NA
6,890
68,658
5,402
78,583
6,711,052
5,981,500
4,430,286
79.80%
6,631,804
5,925,653
4,365,077
73.66%
4,365,057
205,608
4.71%
4,290,123
216,324
5.04%
Training
Number of directors or corporate officers who have attended at least
one training course during the year
Total hours of training
Share-owning members-Customers
Number of customers of local mutual banks
o/w private individuals
Number of share-owning members
% of individual customers who are share-owning members
Attendance at General Meetings
Number of share-owning members invited
Number of share-owning members present or represented
% participation in voting
(*) The regulatory scope includes the 11 Crédit Mutuel federations,
the Caisses de Crédit Mutuel that are members of their respective
federation and Caisse Fédérale de Crédit Mutuel
EMPLOYMENT INFORMATION
Employment
SO 01-Total number of employees(*)
o/w France
o/w non-managerial staff
o/w men
2013
2012
58,329
48,920
34,132
26,938
55,695
48,035
33,364
24,842
Total number of permanent employees (FTE**)
45,308
o/w non-managerial staff (FTE)
28,993
SO 02 - Recruitment
Total number of new hires
9,218
o/w women
5,571
o/w permanent contracts
2,979
SO 03 - Dismissals and reasons
Number of employees under permanent contracts who left the
organization
2,977
o/w dismissals
471
Work organization, working hours and absenteeism
SO 04 - full-time/part-time(*)
Number of full-time employees
52,403
Number of part-time employees
5,926
SO 05 - Absenteeism and its causes
Number of days of absence
521,027
due to illness
415,439
due to occupational injuries
13,608
Number of occupational illnesses
0
SO 06 - Health and safety conditions
Number of reported workplace accidents, with sick leave
84
SO 07 - Training and occupational integration
NA
NA
9,028
3,734
3,277
7,905
575
51,820
4,682
436,438
422,823
13,615
2
343
178
Amount of payroll spent on training (in euros)
% of payroll costs dedicated to training
SO 08 - Total number of hours dedicated to employee training
Equal opportunity
SO 09 - Gender equality
% of managerial staff who are women
% of women promoted to management positions
SO 10 - Number of managers promoted to a higher level during
the year
o/w women
SO 11 - Promotion of and compliance with International
Labor Organization’s Fundamental Conventions
Number of convictions for impeding the free exercise of
employees' rights (in France)
SO 12 - Employment and integration of disabled workers
Number of disabled workers
% of employees who are disabled
Labor relations
SO 13 - Salaries, including changes
Gross payroll costs (euros)
Average annual gross salary (in euros) - all levels
Average annual gross salary (in euros) - non-managerial staff
Average annual gross salary (in euros) - managerial staff
Gross payroll costs - permanent contracts, all levels
Gross payroll costs - permanent contracts, non-managerial
Gross payroll costs - permanent contracts, managerial
SO 14 - Social contributions
Total amount of social contributions paid (euros)
(*: active employees on payroll at December 31, 2013)
(** FTE (full-time equivalent)
€95,197,477 €95,377,741
4.10%
3.74%
1,465,525
1,558,882
30.50%
33.55%
32.78%
31.26%
1,210
406
NA
NA
0
NA
862
1.48%
520
1.00%
€2.320 bn
€43,664
€29,486
€58,570
€2.312 bn
€41,635
€27,980
€56,437
€2.281 bn
€0.882 bn
€1.071 bn
NA
NA
NA
€1.354 bn
€1.346 bn
(*** hires: all contracts - permanent, short-term, student, holiday
replacement, etc. - gross number of people hired during the year)
179
ENVIRONMENTAL INFORMATION
2013
Consumption of resources
ENV 01 - Water
Water consumption (m3)
608,902
ENV 02 - Energy
Total energy consumption
463,126,021
ENV 03 - Paper
Paper consumption (metric tons)
16,657
Purchasing/suppliers % of recycled paper at time of purchase
1.75%
Measures to reduce environmental impact and greenhouse gas emissions
ENV 04 - Direct fugitive emissions
Refrigerant gas leakage from the air conditioning systems (waterand air-based commercial air conditioning) in kilos
11,892
ENV 05 - Emissions avoided
Number of video-conferences
7,194
ENV 06 - Waste
2012
549,329
431,756,840
11,078
5.00%
NA
NA
What measures were taken in 2012 to reduce the consumption of See §4
resources, paper, waste, etc.?).
ENV 07 - Employees
See §4
Actions taken to inform and train employees about environmental See §4
protection
ENV 08 - Human resources dedicated to CSR
11.050
See §4e
SOCIAL INFORMATION
2013
2012
Territorial, economic and social impact
SOT 01 - Territorial impact
Number of Crédit Mutuel Group points of sale
% of points of sale in rural areas (group total)
% of urban free trade zones covered by points of sale
4,466
21.07%
21.42%
4,581
6.20%
34.20%
929
€2.4m
467
€2.4m
1,609
€37.0m
786
€12.0m
NA
NA
NA
NC
NA
NA
1,464
€14.8m
Microcredit
Intermediated business microcredit
SOT 02 - ADIE support (French association for the right to
economic initiative)
Number of applications processed
Amount of lines of credit made available (euros)
SOT 03 - France Active support (French organization that
promotes business development)
Number of microloans financed
Amounts guaranteed (euros)
SOT 04 - France Initative Réseau support (French organization
that finances entrepreneurs)
Number of bank loans issued
Amount of additional bank loans issued (euros)
Total number of microloans issued in partnership
Total amount of microloans issued in partnership
SOT 05 - Community-based microcredit (not in partnership**)
10.435
180
Number of community-based microloans issued locally within
the Federation
20,317
21,805
Amount of community-based microloans issued locally within
the Federation (euros)
€34.2m
€36.8m
Socially Responsible Investment
SOT 06 - Outstanding SRI (euros)
€5.683bn
SOT 07 - Livret d'Epargne pour les Autres (LEA) (savings
account that benefits humanitarian organizations)
LEA deposits excluding capitalization (euros)
€20.2m
SOT 08 - Socially responsible employee savings plans
Assets under management (euros) in socially responsible
employee savings plans
€112.3m
SO 09 - Associations market
Number of non-profit organizations that are customers
(associations, labor organizations, works councils, etc.)
313,166
SOT 10 - Patronage and sponsorship
Budget of the Crédit Mutuel Foundation at national level or
number of budgets allocated
Total budget dedicated to patronage and sponsorship (euros)
SOT 11 - Zero interest rate eco-loans
Number of zero interest rate eco-loans issued
Average amount of loans issued
SOT 12 - Loans for renewable energy and energy efficiency
Number of projects financed (businesses and farmers)
SOT 13 - Socially responsible products and services
Outstanding regulated subsidized loans (PLS - loans for building
low-cost housing, PSLA - home rental-ownership loans)
SOT 14 - Mediation
Percentage of eligible applications
Number of eligible applications mediated
€4.859bn
€13.0m
€88.1m
302,462
€4.0m
€29.9m
€3.0m
€24.3m
3,970
€18,544
NA
€18,023
2,489
NA
€546.2m
€496.6m
78%
11,777
86%
NA
Number of decision in favor of customers and applied
systematically
9,197
NA
SOT 15 - Outstanding customer loans (retail)***
- Home loans
Consumer credit
o/w home improvement
€125.988bn
€112.563bn
€9.479bn
€3.851bn
€130.041bn
€116.398bn
€9.181bn
€4.341bn
* change of calculation method: communes < 5,000 inhabitants (versus< 3,000 in 2012)
** CM11 regulatory scope only
*** CM11 regulatory scope + CIC regional banks & CIC IdF + Banque Tansatlantique
181
V.4 – Certification by the independent auditor of the presence of employment,
environmental and social information in the management report
ERNST & YOUNG et Autres
1/2, place des Saisons
92400 Courbevoie – Paris-La Défense 1
S.A.S. à capital variable (Simplified stock company with variable capital)
Statutory Auditors
Member of the Versailles
regional institute of accountants
Caisse Fédérale du Crédit Mutuel
Year ended December 31, 2013
Report of one of the auditors accredited as independent verifier on the consolidated corporate social
and environmental information disclosed in the management report
To the Shareholders,
In our capacity as the independent auditors of Caisse Fédérale du Crédit Mutuel designated as an
independent third party, for which the accreditation was received from the French accreditation committee
(Comité français d’accréditation - COFRAC), under the number 3-1065, we present our report on the
consolidated corporate, social and environmental information in respect of the financial year ended
December 31, 2013, presented in Chapter 7 of the Management Report, hereinafter ‘CSR information’, in
accordance with the provisions of Article L. 225-102-1 of the French Commercial Code.
Board of Directors’ Responsibility
The Board of Directors is responsible for preparing a management report including the consolidated social,
environmental and societal information (CSR information) required under Article R. 225-105-1 of the French
Commercial Code in accordance with the guidelines adhered to by the company, comprising the processing
of RH reporting and the 2013 data (hereafter “Reference frames”) whose synopsis appears with item VII in
the management report
Independence and quality control
Our independence is defined by regulatory requirements, the Code of Ethics of our profession (Code de
déontologie) and Article L. 822-11 of the French Commercial Code (Code de commerce). In addition, we
maintain a comprehensive system of quality control including documented policies and procedures to ensure
compliance with ethical requirements, professional standards and applicable legal and regulatory
requirements.
Independent verifier's responsibility
It is our role, on the basis of our work: to attest whether the required Information is presented in the
management report or, if not presented, whether an appropriate explanation is given in accordance with the
third paragraph of Article R. 225-105 of the French Commercial Code (Code de commerce). It is not our
responsibility to verify the relevance of this information.
Our assignment was performed by a team of 6 people between December 2013 and March 2014 over a
cumulative duration of around 10 weeks. We drew on our CSR experts to assist us in our work
Nature and scope of our work
182
Our engagement was performed in accordance with the professional standards applicable in France and the
provisions of the Decree of May 13, 2013 defining the terms and conditions in which the independent
verifier must perform its mission:
We examined, through interviews with the managers of the departments concerned, the policies with
regard to sustainable development, according to the social and environmental impact of the company’s
activity and its social commitments, and, if appropriate, the actions or programs arising therefrom.
We compared the Information presented in the management report with the list provided for by Article
R. 225-105-1 of the French Commercial Code;
If certain consolidated information was omitted, we verified that explanations were provided in
accordance with the provisions of paragraph three of Article R. 225-105-1 of the French Commercial
Code.
We checked that the CSR Information covered the consolidated scope, namely the company and its
subsidiaries within the meaning of Article L. 233-1 of the French Commercial Code and the companies it
controls within the meaning of Article L. 233-3 of said code, based on the limits indicated in the
methodology note presented in Chapter 7 of the management report.
Based on our work, we attest to the presence of the required CSR information in the management report.
Paris-La Défense, April 14, 2014
Statutory Auditors
ERNST & YOUNG et Autres
Olivier Durand
Eric Mugnier
Expert Développement durable
183
VI. LEGAL
INFORMATION
ABOUT BFCM
184
VI.1 - Shareholders
VI.1.1 - Distribution of BFCM's capital at December 31, 2013
Actionnaires
Nombre
d'actions
détenues
Caisse Fédérale de Crédit Mutuel 1
Caisses locales de Crédit Mutuel 2 adhérentes à leur fédération
respective (Centre Est Europe, Sud-Est, Ile-de-France, SavoieMont Blanc, Midi-Atlantique, Centre, Dauphiné-Vivarais, LoireAtlantique Centre-Ouest, Méditerranéen, Normandie, Anjou)
Fédération de Crédit Mutuel Centre Est Europe
CRCM Sud-Est
CRCM Ile-de-France
CRCM Savoie-Mont Blanc
CRCM Midi-Atlantique
CRCM Centre
CRCM Dauphiné-Vivarais
CRCM Loire-Atlantique Centre-Ouest
CRCM Méditerranéen
CRCM Normandie
CRCM Anjou
CFCM Maine Anjou et Basse Normandie
CFCM Antilles - Guyane
CFCM Océan
CFCM Nord Europe
Divers
TOTAL
%
détenu3
24 625 908
92,63%
73 317
0,28%
81
61 545
146 381
20
24 534
308 726
2 480
741 949
74 750
123 956
176 001
222 965
2 477
1
1
42
26 585 134
0,00%
0,23%
0,55%
0,00%
0,09%
1,16%
0,01%
2,79%
0,28%
0,47%
0,66%
0,84%
0,01%
0,00%
0,00%
0,00%
100,00%
(1) La Caisse Fédérale de Crédit Mutuel (CF de CM) est une société
coopérative ayant la forme de société anonyme, affiliée à la Confédération
Nationale du Crédit Mutuel, détenue à plus de 99% par les ACM Vie Mutuelle
et les Caisses de Crédit Mutuel des Fédérations de Crédit Mutuel Centre Est
Europe, Sud-est, Ile-de-France, Savoie-Mont Blanc, Midi-Atlantique, Centre,
Dauphiné-Vivarais, Loire-Atlantique Centre-Ouest, Méditerranéen,
(2) Les Caisses de Crédit Mutuel sont des sociétés coopératives à capital
variable financièrement autonomes, détenues par les sociétaires personnes
(3) Le pourcentage de droits de vote est identique à celui de la détention du capital
185
VI.1.1.1 - Changes in the distribution of capital during the past three years
In 2013
Under the partnership with Crédit Mutuel Anjou Group, which took effect on January 1, 2012, the May 7,
2013 Extraordinary Shareholders' Meeting approved a capital increase in cash of €25 million through the
creation and issue of 52,521 new shares, each with a par value of €50, increasing the share capital from
€1,326,630,650 to €1,329,256,700. These new shares were issued at a unit price of €476, i.e. with an issue
premium of €426 per share. They were fully paid up in cash at the time of subscription.
On January 1, 2012, the Anjou Group joined the partnership to form CM11, which resulted in the Anjou
Caisses acquiring a stake in BFCM under the same conditions as the other groups.
In 2011
On July 28, 2011, BFCM completed a €22,621,000 capital increase through the creation and issue of 452,420
new shares paid for in cash in order to increase its share capital from €1,302,192,250 to €1,324,813,250. This
capital increase reserved for the regional Caisses (CRCM) and local Caisses (CCM) of the Crédit Mutuel
Centre, Crédit Mutuel Dauphiné-Vivarais, Crédit Mutuel Loire Atlantique-Centre Ouest, Crédit Mutuel
Méditerranéen and Crédit Mutuel Normandie federations was subscribed in the amount of €180,968,000,
including an issue premium, distributed as follows:
- CRCM Centre subscribed for 99,000 BFCM shares (0.37%),
- CRCM Dauphiné-Vivarais subscribed for 2,500 BFCM shares (0.01%),
- CRCM Loire Atlantique-Centre Ouest subscribed for 246,500 BFCM shares (0.93%),
- CRCM Méditerranéen subscribed for 75,000 BFCM shares (0.28%),
- CRCM Normandie subscribed for 25,000 BFCM shares (0.09%),
Affiliation of CM Caisses (CCM) to the capital increase (10 BFCM shares per CCM): 99 Centre CCM, 50
Dauphiné-Vivarais CCM, 145 Loire-Atlantique Centre-Ouest CCM, 90 Méditerranéen CCM and 58
Normandie CCM.
During this period, the BFCM share held by Caisse Interfédérale du Crédit Mutuel Sud Europe Méditerranée
(CIF SEM) was transferred to Caisse Fédérale de Crédit Mutuel (CF de CM) following the takeover merger
of CIF SEM by CF de CM.
VI.1.1.2 - Individuals or legal entities exercising control over BFCM
Caisse Fédérale du Crédit Mutuel Centre Est Europe controls nearly 93% of BFCM.
VI.1.1.3 - Knowledge by BFCM of an agreement likely to result in a change in control
To BFCM’s knowledge, no agreement exists that might result in a change in its control at a later date.
VI.1.1.4 - Dependence of BFCM on other group entities
BFCM’s dependence on other CM11-CIC Group entities is limited to the ownership ties described in the
chapter entitled “Presentation of CM11-CIC Group”.
The section entitled “Legal Information – Sundry Information” indicates that no major agreements exist
between BFCM and the subsidiaries.
186
VI.1.2 - Ordinary Shareholders' Meeting of May 7, 2014
VI.1.2.1 - Extract of the Board of Directors' report to the Ordinary Shareholders' Meeting of
May 7, 2014
VI.1.2.1.1 - BFCM activities
BFCM has several key business activities:
- central refinancing for CM11-CIC Group,
- depository for CM11-CIC Group's undertakings for collective investments,
- financial relations with large corporates and local authorities through its payment processing, lending
and financial engineering activities,
- parent company of CM11-CIC Group's subsidiaries and coordination of their activities.
VI.1.2.1.1.1 - Capital markets activity – Refinancing
Access to market resources benefited from a generally favorable environment in 2013.
CM11-CIC managed to raise €17.6 billion in medium- and long-term external funding, mainly in the second
half of the year (56%).
Public issues made up 64% of this funding, with private placements accounting for a significant share.
In what is a sign of a generally confident market, the proportion of guaranteed loans issued by our CM-CIC
Home Loan SFH subsidiary accounted for only 16% of the total, with most issues made by BFCM.
The share of volumes issued in foreign currencies increased to 16% as a result of our investor base
diversification strategy, particularly outside the euro zone.
Meetings with international investors are now being routinely held in major geographic areas worldwide
(Europe, USA and Japan), which is enabling CM11-CIC Group to quickly increase its name recognition and
open new credit lines.
The contribution of US and Japanese investors through the following two issues completed in October 2013
is particularly worth noting:
- an initial three- and five-year BFCM issue under U.S. Rule 144A for USD 1.75 billion (€1.27
billion);
- a BFCM “Samurai” issue for JPY 108 billion (€817 million), which was significant in terms of both
size (one of the largest issues of its kind in Japan in 2013) and quality, in that it attracted more than
100 different Japanese investors.
It should also be noted that the group strengthened its ties with the EIB by securing in late 2013 a new €200
million portfolio of subsidized loans for SME financing. These loans will be distributed by our regional
banks with clients eligible for these facilities.
In addition, we maintained a presence in the short-term money market thanks to operations by our treasury
sales teams in Paris, Frankfurt and London and various short-term programs offering negotiable certificates
of deposit, euro commercial paper and London CDs.
More generally, in terms of treasury and refinancing activities, in 2013 we successfully pursued our strategy
aimed at:
- increasing the proportion of medium- and long-term resources (65% of the total at the end of
December 2013),
- consolidating CM11-CIC Group's liquidity and securing it fully against a prolonged shutdown of the
money markets by holding an LCR and/or ECB-eligible asset buffer calibrated at 145% of market
resources due to mature within the next 12 months (position at December 31, 2013).
187
VI.1.2.1.1.2 - Depository for undertakings for collective investments (UCI)
From a regulatory standpoint, the depository function for UCIs (FCP investment funds, SICAV open-ended
funds, FCPE company mutual funds, FCPR private equity funds, etc.) involves the following:
- Custody account-keeping (mainly investment securities), cash account-keeping and position keeping for
other securities (futures and other directly held financial instruments).
- Ensuring the regulatory compliance of UCI management decisions.
- UCI liabilities management in cases where the management company has delegated it to the depository,
including in particular subscription and redemption order processing initiated by clients. This activity is
carried out by the group's specialized units.
Under the AIFMD (Alternative Investment Fund Managers Directive), a new responsibility has been
assigned to depositories, namely liquidity management.
In 2013, Banque Fédérative du Crédit Mutuel’s depository activity was marked by:
- Implementation of the control plan with priority given to regulatory tasks.
- The resources made available in the area of ratio calculation.
- The integration into the secure IT applications of control plan management, the depository database and
questionnaires regarding new relationships and follow-up of relationships with the management
companies.
- The assumption of the Dubly funds.
- Meetings with the management companies based on a topic-specific agenda along with on-site audits
where necessary.
- Efforts to make the management companies aware of changes related to AIFMD.
- Actions taken in the area of private equity, including in particular making the procedures available.
- Changes to the depository commission invoice forms.
- The contribution to the Data Management working group for the creation of a single group reference
base.
- Participation in the work of the AFTI (French Association of Securities Professionals), including
finalization of a template for depository agreements and topic-based meetings regarding regulatory
changes (French Monetary and Financial Code, AMF General Regulations, etc.).
- The start of updates to the depository agreements and agreements with the group's service providers for
delegated activities.
- A large number of analyses of prospectuses related to the creation of UCIs and to the numerous switches
to key investor information documents (KIID).
- The vast amount of regulatory news.
At the end of December 2013, Banque Fédérative du Crédit Mutuel was the depository for 788 UCIs with
total assets of €80.53 billion, a 1.2% increase compared to 2012.
The vast majority of UCIs held by Banque Fédérative du Crédit Mutuel (71.4%) are managed by the group's
management companies, namely CM-CIC Asset Management for general and employee savings UCIs and
CM-CIC Capital Privé and CM-CIC Private Debt for FCPR private equity funds. Banque Fédérative du
Crédit Mutuel is also the depository for the securitization mutual funds used in connection with group
188
refinancing (26.6%). The UCIs of some 20 asset management companies which are not part of CM-CIC
Group and specialize primarily in private equity represent 2.0% of the assets held.
VI.1.2.1.1.3 - Large accounts and structured products
As expected, in 2013 the euro zone economy remained in the doldrums, recording only anemic growth.
Large French corporations with a strong international presence sought growth opportunities in emerging
countries, whose expansion slowed down at the end of the year.
This environment led companies to adopt a conservative approach to investing, thereby reducing their
demand for credit. As a result, the volume of new financing transactions was low and most transactions
involved renewals in often lower amounts. In a context of strong improvement in bank liquidity, margin and
commission conditions declined significantly. In addition, the disintermediation trend continued, mainly
during the first half of the year, and with a sharp increase in private placements. CM-CIC therefore managed
or participated in several bond issues, including those of ADEO, Air Liquide and Rallye.
The group's financial soundness, confirmed by the rating agencies, enabled further growth in deposits among
both large corporates and institutional investors. A dedicated sales team now markets all the group’s
investment products and services.
In 2013, preparations for SEPA migration (SCT, SDD) were also underway in view of the 01/29/2014 end
date. The staff made great efforts, and continue to do so in 2014, to help clients implement this system by the
specified deadline.
The large accounts department (Direction des Grands Comptes) continued to focus on development of the
group's know-how and expertise through major agreements in the area of employee benefits engineering and
factoring with CAC 40 groups.
In a still challenging environment, in 2014 Large Accounts continues to support its clients, with special
attention given to means of payment in Europe and beyond, by drawing on the expertise of both the group
and our Canadian partner, Mouvement Desjardins.
VI.1.2.1.2 - Information on the activity and results of the subsidiaries and controlled companies
(Art. L. 233-6 paragraph 2 of the French Commercial Code)
Under the above provision, the report submitted to the Shareholders’ Meeting must disclose the results of the
subsidiaries and the companies controlled by BFCM, by business line.
VI.1.2.1.2.1 - Financial and related sector
Groupe Crédit Industriel et Commercial SA:
(Management report on the consolidated financial statements of CIC)
Activity and results
Accounting principles
Pursuant to Regulation (EC) 1606/2002 on the application of international accounting standards and
Regulation (EC) 1126/2008 on the adoption of said standards, the consolidated financial statements for the
year have been drawn up in accordance with IFRS as adopted by the European Union at December 31, 2013.
These standards include IAS 1 to 41, IFRS 1 to 8 and any SIC and IFRIC interpretations adopted as of that
date. Standards not adopted by the European Union have not been applied. The summary documents are
presented in accordance with Recommendation 2013-04 of the Autorité des Normes Comptables (French
accounting standards authority).
All IAS and IFRS were updated on November 3, 2008 by Regulation 1126/2008, which replaced Regulation
1725/2003. These standards are available on the European Commission’s website at:
http://ec.europa.eu/internal_market/accounting/ias/index_fr.htm.
189
The information on risk management required by IFRS 7 is provided in a specific section of the management
report.
Changes in consolidation scope
The changes in scope include:
• the addition of CM-CIC Proximité,
• the removal of CM-CIC Gestion and Alternative Gestion SA,
• the winding up of Valeroso Management Ltd, and
• the change in name of Dubly-Douilhet, which is now Dubly-Douilhet Gestion.
Analysis of the consolidated statement of financial position
The main changes in the consolidated statement of financial position items were as follows:
• customer loans (excluding resale/repurchase agreements), including lease financing, amounted to €136.8
billion at December 31, 2013, an increase of 2.9% compared to December 31, 2012, with equipment loans up
by 5.4% and home loans up by 3.7%;
• customer deposits (excluding resale/repurchase agreements) totaled €112.8 billion (+4.3%), driven by
current accounts (+10.7%) and home savings accounts (+5.2%).
• the "loan-to-deposit" ratio, the ratio of total net loans to bank deposits expressed as a percentage, improved
significantly at 121.2% as of December 31, 2013 compared to 122.9% the previous year.
• customer funds invested in savings products5 totaled €231.1 billion (+3.9%).
• total shareholders' equity and reserves attributable to the group rose to €11.129 billion (compared to
€10.362 billion at December 31, 2012) and the resulting Tier 1 capital totaled €10.813 billion. The Tier 1 and
core Tier 1 solvency ratios were 11.9% and 11.6%, respectively, after repayment of €500 million in supersubordinated securities.
The European regulation on prudential requirements entered into force on January 1, 2014. Under this
regulation, and without considering transitional measures, the CET1 capital ratio would be 10.2% and the
leverage ratio 4.0%.
Analysis of the consolidated income statement
Net banking income rose from €4.260 billion in 2012 to €4.466 billion at December 31, 2013. The growth in
NBI is linked to the recovery of the interest margin and the increase in net fee income. It was mainly driven
by retail banking, which also benefited from the decrease in the cost of funds.
Management fees decreased by 2% to €2.944 billion. In 2013, CIC benefited from the competitiveness and
employment tax credit (crédit d'impôt pour la compétitivité et l'emploi – CICE) and from a decrease in the
systemic tax.
Net additions to/reversals of provisions for loan losses amounted to €367 million at December 31, 2013
compared to €356 million (€324 million after restatement of the impact of the sale on the market of Greek
sovereign securities eligible for the Private Sector Involvement Plan) at December 31, 2012.
Actual net provisioning for known risks, as a proportion of total loan outstandings, rose from 0.20% to
0.22% and the overall non-performing loan coverage ratio was 51.5% at December 31, 2013.
Net income was €851 million at December 31, 2013 compared to €722 million in 2012.
Rating
In 2013, rating agencies Moody’s and Fitch confirmed the long-term rating of CIC, a subsidiary of BFCM,
while Standard & Poor’s lowered it by a notch.
Long-term rating
Outlook
Standard & Poor’s
A
Stable
Moody’s
Aa3
Negative
Fitch Ratings
A+
Stable
5 Month-end outstandings, including securities issued.
190
Breakdown by activity
Description of the business lines
Retail banking, CIC’s core business, comprises all the banking and specialized activities whose products are
marketed by the network of regional banks, which is organized around five regional divisions and that of
CIC in Ile-de-France: life and property-casualty insurance, equipment leasing and leasing with purchase
option, real estate leasing, factoring, fund management, employee savings and real estate.
Corporate banking includes the financing of large corporates and institutional clients, value-added financing
(export, project and asset financing, etc.), international activities and foreign branches.
Capital markets activities include investments in fixed-income, equity and foreign exchange activities
(ITAC) and stock market intermediation.
Private banking develops expertise in financial and wealth management for families of business owners and
private investors in France and around the world.
Private equity encompasses equity investments, merger-acquisition consulting and financial and stock market
engineering.
The holding company includes all activities not assigned to another business.
Results by activity
Retail banking
2013
€ millions
Net banking income
Gross operating income
Income before tax
Net income - Group share
3,330
1,128
918
604
2012
3,083
838
743
518
Change
2013/2012
8.0%
34.6%
23.6%
16.6%
Retail banking loans and deposits increased as follows:
- 3.5% growth in loans to €116 billion (+5.4% for equipment loans and +3.3% for home loans); continued
improvement in the quality of the network, which now totals 2,067 branches, including 15 created in
2013;
-
3.9% increase in deposits to €87 billion thanks to growth in current accounts with credit balances and
home savings accounts.
Net banking income grew by 8% to €3.33 billion at December 31, 2013, compared to €3.083 billion in 2012.
Net fee income in 2013 rose by 7% and represented 42% of net banking income.
General operating expenses fell from €2.245 billion in 2012 to €2.202 billion. The cost/income ratio was
66.1% compared to 72.8% at year-end 2012.
Net additions to/reversals of provisions for loan losses totaled €312 million compared to €201 million in
2012.
Income before tax in retail banking was therefore €918 million compared to €743 million a year earlier.
Banking network
The development of the banking network in 2013 made it possible to:
• add 120,573 new customers to the banking network, bringing the total to 4,688,233 (+2.6);
• develop the property and casualty insurance business (5.5% increase in the portfolio to 3,171,761
policies, excluding individual enrollments);
• record gains in the services area (remote banking +6.3% to 1,718,814 contracts, telephone banking
+13.5% to 344,071 contracts, theft protection +12.1% to 77,966 contracts, electronic payment terminals
(EPT) 7.2% to 113,568 contracts).
191
At December 31, 2013, retail banking recorded a net banking income of €3.111 billion compared to €2.897
billion in 2012, with similar growth in the margin and in net fee income, which represented more than 45%
of net banking income.
General operating expenses fell from €2.113 billion at year-end 2012 to €2.066 billion at the end of 2013.
Net additions to/reversals of provisions for loan losses totaled €304 million (+€109 million).
Income before tax was €743 million compared to €595 million the previous year.
Ancillary businesses to retail banking
In 2013, the net banking income of these businesses was €219 million compared to €186 million at year-end
2012, driven mainly by equipment leasing activities. Income before tax was €175 million (€148 million the
previous year).
Financing
2013
€ millions
Net banking income
Gross operating income
Income before tax
Net income - Group share
278
193
155
104
2012
282
194
130
105
Change
2013/2012
-1.4%
-0.5%
19.2%
-1.0%
In a difficult economic environment, the net banking income of Financing remained satisfactory at €278
million, compared to €282 million at the end of 2012.
Net additions to/reversals of provisions for loan losses fell from €64 million in 2012 to €38 million in 2013.
Income before tax rose to €155 million (€130 million in 2012.)
The business line managed €11 billion in loans (-6%) and €8.7 billion in deposits (+56%).
Capital markets activities
2013
€ millions
Net banking income
Gross operating income
Income before tax
Net income - Group share
473
307
300
185
2012
555
377
351
204
Change
2013/2012
-14.8%
-18.6%
-14.5%
-9.3%
At December 31, 2013, net banking income totaled €473 million (€555 million in 2012). General operating
expenses and net additions to/reversals of provisions for loan losses decreased by 6.7% and 73.2%,
respectively. Income before tax was €300 million compared to €351 million at year-end 2012.
Private banking
2013
€ millions
Net banking income
Gross operating income
Income before tax
Net income - Group share
444
115
109
71
2012
464
130
106
62
Change
2013/2012
-4.3%
-11.5%
2.8%
14.5%
In 2013, Private Banking managed €15.8 billion in deposits and €8.6 billion in loans. Customer funds invested
in savings products totaled €71.9 billion.
NBI decreased slightly to €444 million in 2013 compared to €464 million in 2012. Thanks to a combination of
tight control of general operating expenses and a €22 million decrease in net additions to/reversals of
provisions for loan losses, income before tax grew modestly to €109 million, compared to €106 million at the
end of 2012.
192
Private equity
2013
€ millions
Net banking income
Gross operating income
Income before tax
Net income - Group share
2012
119
85
85
86
100
66
66
67
Change
2013/2012
19.0%
28.8%
28.8%
28.4%
Invested capital totaled €1.7 billion, including €200 million in 2013.
The portfolio consists of 469 investments.
NBI was €119 million at December 31, 2013 compared to €100 million in 2012 and income before tax stood
at €85 million versus €66 million the previous year.
Headquarters and holding company services
2013
€ millions
Net banking income
Gross operating income
Income before tax
Net income - Group share
(178)
(250)
(287)
(205)
2012
(224)
(289)
(374)
(258)
Change
2013/2012
Immaterial
Immaterial
Immaterial
Immaterial
The NBI of headquarters and holding company services consists mainly of:
• -GBP 113 million to finance working capital and the cost of subordinated securities (€-171 million in 2012);
• -€86 million to finance the network development plan (-€82 million in 2012);
• a €10 million net gain on investments in associates (-€6 million in 2012).
In 2012, a reversal was recorded for a €21 million expense related to the fine paid by CIC for interbank fees
on checks, which was paid back by the French antitrust authorities (Autorité de la Concurrence).
General operating expenses rose from €65 million in 2012 to €72 million.
Net additions to/reversals of provisions for loan losses totaled €3 million compared to €36 million at year-end
2012, 34 million of which was related to Greek sovereign debt.
Income before tax includes a €34 million expense related to impairment losses on equity-accounted associates
(€49 million at year-end 2012).
Recent developments and outlook
In 2014, CIC will focus on developing its commercial activity by offering all its customers products and
services that meet their needs. It relies on the latest technology to make customer relationships, whether
physical or digital, the focal point of its strategy. As a bank for professionals and corporates, it plays an active
role in the economic life of France’s regions. As a bank that serves individuals and associations, it provides
day-to-day support for projects that build our society.
By combining growth, efficiency and risk control and by drawing on the professionalism of its employees and
its strong, Europe-wide Crédit Mutuel parent company, CIC is well equipped to face the challenges of the
coming years.
Material changes
There have been no material changes in CIC’s commercial or financial position since the end of the last year
for which audited financial statements were published.
Banque Européenne du Crédit Mutuel SAS:
The BECM network bank works alongside the Crédit Mutuel banking network and with the CIC branch
network in four main markets:
•
•
•
•
large and medium-sized corporates;
financing for real estate developers and investors, mainly in the housing sector;
real estate companies specializing in the management of leased residential and commercial
properties and office space;
management of payments from large order-givers in the retail, transport and services sectors.
193
BECM operates, on a subsidiary basis vis-à-vis the network of Crédit Mutuel Caisses with action levels
appropriate to each region, in the corporates market, particularly in such specialized markets as agriculture
and the healthcare professions, and in financing for professional real estate clients.
In its role as a business center serving the group, BECM organizes training, procedures, management and
development of financing tools for real estate developers, as well as activities related to large order-givers in
the field of corporate cash management.
It has a 46-branch network extending from France and Germany to Saint Martin and including a Monaco
subsidiary, through which it serves 17,800 clients.
The lackluster economic environment and weak demand for credit from French businesses combined with a
movement by real estate companies into bond issues led to a 4% decrease in loans granted to €10.3 billion.
The sturdy efforts of its employees enabled BECM to post a further significant increase in deposits, which
rose by 23% to €6.7 billion. These improvements resulted in a €1.7 billion reduction in the liquidity gap as of
the closing date.
Sales performance, the lower cost of deposits, control of general operating expenses and a low cost of risk
enabled BECM to improve profitability with a 14.7% increase in net income.
CIC Iberbanco:
Sales activity
With 128 employees working at 22 branches in Ile-de-France, the Lyon region and southern France
(Bordeaux, Bayonne, Midi-Pyrénées and Languedoc-Roussillon), CIC Iberbanco added over 6,700 new
customers in 2013, up 13.7% compared to 2012.
Customer savings deposits increased by 9% to €478 million. Overall loan outstandings totaled €404 million,
an increase of nearly 15% compared to 2012. The insurance and telephony activities trended favorably, up
17.5% and 23.9%, respectively. Net income in 2013 was €2.8 million.
Targobank Germany:
Targobank Germany's activity in 2013
Targobank continued to grow in 2013. Outstanding loans benefited from a further increase in personal loan
production, up nearly 6% from the previous year. They stood at €10.8 billion at December 31, 2013, a yearover-year increase of €559 million.
In particular, the bank achieved a new record in July 2013 with a total volume of loans taken out of €284
million, i.e. €13.4 million per day.
This growth in assets was entirely refinanced by an increase in customer deposits, which rose by €679
million to €11.1 billion at December 31, 2013.
The wealth management business has also grown. Financial savings totaled nearly €9 billion at year-end, up
by more than €600 million over a year.
This strong performance is the result of a development strategy geared towards expansion of the sales
network (19 new branches opened in 2012 and 2013, bringing the number of points of sale to 351 at
December 31, 2013) and the gradual roll-out of auto loan products (€59 million in outstanding loans at
December 31, 2013).
Another notable event in 2013 was the acquisition of the retail banking activities of Valovis Bank AG, which
will be finalized in 2014. This acquisition strengthens the bank's position in the vendor credit and credit card
market and will make Targobank the third largest credit card issuer in Germany.
Under IFRS, income before tax for 2013 was €428 million, up 4.9% from 2012. NBI grew by 5%, driven by
the increase in loans outstanding and the recovery of the wealth management business.
Targobank Spain:
(Proportionally consolidated subsidiary whose contribution to the consolidated financial statements represents 50% of the total)
194
An all-purpose bank jointly held 50-50 by BFCM and Banco Popular Español, Targobank Spain has 125
branches located for the most part in Spain’s main centers of economic activity and more than 235,000
customers, more than 80% of which are individuals.
It manages 152 ATMs and 125,000 debit/credit cards.
Targobank Spain posted better results in all its business segments than in 2012.
NBI increased by 24.01%, the gross margin by 13.03% and the net margin by 23.40%.
It ended the year with a profit of €19.05 million compared to €0.48 million the previous year.
Cofidis Group (Carmen Holding Investissement SA):
Cofidis Participations, which is jointly held with Argosyn (formerly 3SI), designs, sells and manages a broad
range of financial services such as consumer credit, payment solutions and banking services (current
accounts, savings, online brokerage and investments).
To that end, it has three brands specializing in the sale of financial products and services:
- Cofidis, a European online credit specialist based in France, Belgium, Italy, Spain, Portugal, Czech
Republic, Hungary and Slovakia;
-
Monabanq, the CM11-CIC online bank; and
-
Créatis, a specialist in consumer credit consolidation.
In 2013, financing grew by 9% compared to 2012, while consumer credit markets saw a drop in production
for the fourth consecutive year in France, Spain and Portugal, the group's main markets.
Sofemo, a former BFCM and CIC subsidiary, became part of the Cofidis Participations Group in May 2014.
This company focuses on installment loans and the development of vendor credit.
Loan production was €497 million in 2013 compared to €603 million in 2012. Net customer loan
outstandings fell slightly to €964 million.
Banque Casino:
(Proportionally consolidated subsidiary whose contribution to the consolidated financial statements represents 50% of the total)
Banque Casino, which has been jointly held 50-50 with Casino Group since July 2011, distributes credit
cards, consumer credit and insurance products in Géant Casino hypermarkets, Casino supermarkets and
online through the C-Discount e-commerce site.
2013 was marked by growth in the overall lending activity, underpinned by the launch of a four-installment
payment solution for financing C-Discount sales, ongoing sound risk management and a return to breakeven
with positive results throughout the year.
CM-CIC Asset Management SA:
In 2013, CM-CIC Asset Management, the business center for Crédit Mutuel-CIC Group's asset management
and France's fifth largest asset manager, recorded 1.56% growth in assets under management in the French
market, from €57.8 billion to €58.7 billion*, increasing its market share from 5.53% to 5.72%.
This increase was mainly due to additional inflows of €525 million in low-risk assets. Despite still low
interest rates, money market funds, among the highest rated in the market (first decile for Union Moneplus
and Union Monecourt at December 31, 2013), continued to post gains through subscriptions by companies
and institutional investors, enabling CM-CIC Asset Management to become France's second-leading asset
manager in terms of cash funds in 2013.
As for equity mutual funds, CM-CIC Asset Management's performance was in line with the stock market,
which was again on an upward trend. The relative portion of equity mutual funds outstandings therefore rose
from 8.9% to 10.4% of total assets.
To best support the networks, steps were taken to restructure the asset management product ranges in 2013.
195
For example, the entire Mid Cap range was updated with two resized and renamed funds, Union
Entrepreneurs and Union Mid Cap. This reorganization contributed to the launch at the end of the year of the
new SME stock savings plan at Crédit Mutuel-CIC Group with two funds "Union PME ETI Actions"and
"Union PME ETI Diversifié". Overall, the assets in the Mid Cap range grew by 48% in 2013 (€153 million).
The Europe Thématique range saw the addition of a Union Europe Rendement fund whose outstandings
increased by 65% (€191 million) in 2013.
In the fixed-income market, to get the benefit of an attractive return that is less susceptible to a potential rate
increase, at the end of the year CM-CIC Asset Management launched Union Obli High Yield 2018 in the
bond segment, a combination of high-yield bonds and staggered maturities.
During the year, CM-CIC Asset Management also endeavored to help the networks plan for the future and
take advantage of opportunities.
The commercial ranges were reviewed and segmented for each of Crédit Mutuel-CIC Group's markets:
individuals, wealth management clients, private banks, professionals, farmers, corporates, associations,
mutual companies and institutions. Information on specific funds was provided regularly via letters, videos
and interviews posted on the group's intranet and Internet portals, and a new more comprehensive and easyto-understand fund report was introduced at the end of 2013.
The year also saw successful campaigns in the networks. New formula-based funds recorded a total inflow of
€363 million.
In Germany, the introduction of a new sales policy integrated into Targobank's internal structures and
methods and the creation of two funds under the Crédit Mutuel brand brought in high volumes of funds.
Further efforts were made to increase complementarity and cross-functionality with the group's other
divisions, which led to notable successes.
Several initiatives focusing on socially responsible investment and the organization of joint requests for
proposals were undertaken with CM-CIC Epargne Salariale. More generally, Crédit Mutuel-CIC Group's
entire RFP organization was overhauled, with CM-CIC Asset Management at the center of this new system.
2013 ended with the conversion of CM-CIC Group's portfolio management company, CM-CIC Gestion, into
a subsidiary. This conversion, authorized by the AMF, became effective in December and affects nearly 360
people throughout France.
CM-CIC Asset Management remains a recognized specialist in its field. Its role as an accounting services
provider has been further enhanced with the valuation of 1,018 internal and external UCITS (including 332
for 79 third-party asset management companies).
CM-CIC Asset Management's revenue in 2013 totaled €216 million. The amount of commissions paid to all
the distribution networks was €160 million.
Crédit Mutuel-CIC Home Loan SFH:
Given that the markets operated in a context favorable to refinancing throughout most of 2013, the bulk of
our issues were carried out under the BFCM signature.
However, with issues totaling €2.843 billion over the year, CM-CIC Home Loan SFH accounted for 16% of
CM11-CIC Group's medium- and long-term external refinancing.
Three public issues carried out by CM-CIC Home Loan SFH are particularly noteworthy:
- €1.25 billion over 7 years (April 2013),
- GBP 250 million over 3 years (April 2013),
- €1.0 billion over 10 years (September 2013).
CM-CIC Lease SA:
In 2013, in a relatively quiet market for commercial real estate transactions and new project launches, CMCIC Lease's activity grew by 18%.
303 new real estate lease financing agreements totaling €684 million were signed on behalf of Crédit
Mutuel-CIC customers, primarily for industrial properties (26%), warehouses (25%) and commercial
196
properties (20%).
Total outstandings, including committed transactions (off-balance sheet), grew by 6% to more than €3.8
billion. Of this total, 69% involve commercial, industrial and warehouse facilities in roughly equal measure,
while the balance comprises facilities in a range of other sectors: office space, healthcare, hotels, recreation
and education.
The financial margin grew by 32% and the payment of commissions to the various networks totaled more
than €17.7 million (+18%). Low general operating expenses and a limited cost of risk resulted in a sharp
increase in net income to €4.5 million.
Efforts to improve customer satisfaction led to the introduction or continued roll-out of new internal and
external procedures with partners during the year. These procedures focus primarily on shorter request
processing and notarial instrument signature times and faster, more streamlined management of construction
sites. Others are designed to significantly reduce the time needed to make decisions and complete the legal
transactions required to implement the real estate leasing agreements and manage the buildings owned.
Banque de Luxembourg:
The bank is engaged in several specialized businesses such as asset management, private banking, lending,
and services to financial sector professionals (fund promoters, asset managers, etc.). It targets international
clients who are often very demanding in terms of quality and advice.
It is one of the largest banks in the Grand Duchy and has had operations in Belgium for the past several
years.
Starting on January 1, 2015, Luxembourg will implement automatic information exchange with its European
partners. Thanks to its employees' commitment and, above all, the measures taken since the early 2000s to
prepare its clients for this deadline, the bank's business complies with the new requirements.
In 2013, it continued to attract clients wishing to benefit from its expertise. These new inflows, market
effects and the acquisition of the private banking business of Lloyd’s Luxembourg allowed private banking
assets to top €18 billion. An agreement was signed at the end of the year to acquire the private banking
business of LBLux S.A.
Loans increased by approximately 6% in 2013. This performance reflects the bank's desire to accelerate its
commercial growth among businesses and individuals.
Administrative support and advisory services for investment funds and services for independent fund
managers and life insurance companies were the bank's two main areas of growth. In an environment marked
by the transposition of the AIFMD directive and a host of new regulations, Banque de Luxembourg was able
to support its customers and confirm its role as partner of choice backed by a multilingual, versatile, wellequipped and well-trained staff.
Net banking income amounted to €232 million and net income was €73 million (+11%).
VI.1.2.1.2.2 - Insurance sector
Groupe des Assurances du Crédit Mutuel – GACM – SA:
CM11-CIC Group’s insurance activities are carried out through the subsidiaries of Groupe des Assurances du
Crédit Mutuel (GACM).
2013 was marked by major legislative developments that affected the insurance sector. Examples include the
reorganization of the supplementary health insurance market following the French multi-sector bargaining
agreement (Accord National Interprofessionnel), the creation of the Euro Croissance and Vie Génération life
insurance policies, and draft legislation on consumption.
Despite this fast-changing and uncertain environment, CM11-CIC Group’s insurance business recorded
exceptional results, with revenues rising by more than 21% and exceeding €10 billion for the first time. 2013
197
marked the first year in which the Spanish subsidiary Agrupacio was consolidated. On a comparable
consolidation scope basis, premium income grew at a very high rate (+18%).
Under IFRS, GACM's income increased by 4% to €637.3 million.
In terms of sales, premium income on life insurance and annuity products rose by 30% to more than €6.1
billion. On a comparable consolidation scope basis, net premium income (more than €1.8 billion) resulted in
a more than 5 percentage point increase in in-force business.
With revenue up 8.1% (+4.8% excluding Agrupacio), property and casualty insurance continued to grow. As
in 2012, the auto and home insurance segments significantly outperformed the market average, posting gains
of 5.7% and 10.0%, respectively. Personal insurance rose by 8.5% thanks to the integration of the Spanish
subsidiary; excluding Agrupacio, it rose by 3.3%, in line with the previous year.
In terms of claims, the number of property insurance claims decreased despite the various weather-related
events during the year. However, this trend was more than offset by legislative and regulatory changes and
low rates, which had a significant effect on the 2013 financial statements. The decision by the French
guarantee fund for compulsory insurance (Fonds de Garantie des Assurances Obligatoires - FGAO) to cease
indexing benefit payments to victims of auto accidents as of January 1, 2013, the setting of a 2.25% inflation
rate to establish provisions for such cases, and the impact of discount rates on the provisioning expense are
factors that negatively affect the 2013 financial statements.
2014 will mark the implementation of the group's new medium-term plan, the launch of the new home
insurance product and the roll-out of a comprehensive product line for professionals and corporates.
In parallel to this, GACM will continue its international expansion, primarily in Spain and Belgium. In
Canada, GACM will support a major growth by acquisition drive by Desjardins Assurances, which will
enable DGAG to double in size and become Canada’s second-largest insurer.
GACM ended 2013 with €8 billion in shareholders’ equity, up 5.2%, and a sound balance sheet structure that
positions it well for 2014 and its future challenges.
VI.1.2.1.2.3 - Real estate sector
CM-CIC IMMOBILIER SAS:
The CM-CIC Immobilier subsidiary develops building sites and housing units through CM-CIC
Aménagement Foncier, Ataraxia Promotion and CM-CIC Réalisations Immobilières (SOFEDIM). It sells
new housing units through CM-CIC Agence Immobilière (AFEDIM) and manages housing units of investors
through CM-CIC Gestion Immobilière. It also participates in financing rounds related to real estate
development transactions through CM-CIC Participations Immobilières.
VI.1.2.1.2.4 - Technology sector
Euro-Information SAS:
Euro-Information SAS acts as an IT sub-holding company for the group. In particular, it finances all the
group’s investments in IT and peripheral equipment as well as the technical subsidiaries’ investments.
It recorded net income of €75.8 million in 2013, in line with projections. Banque Fédérative du Crédit
Mutuel owns 13.83% of its capital.
Euro Protection Surveillance:
EPS continued to expand in 2013 and today has more than 328,000 subscribers (16%). EPS has therefore
established itself as the leading residential video surveillance provider in France with a market share of
approximately 35% (source: Atlas de la Sécurité 2013/Internal data).
VI.1.2.1.2.5 - Communications sector
In 2013, the economic environment affected advertising revenue, with mixed results depending on the
region. The drop in subscriptions and changing behaviors also affected the yearly results of this sector, which
is facing difficulties nationwide. Efforts to reorganize and improve the management of these companies
continue.
198
VI.1.2.2 - Resolutions of the Ordinary Shareholders' Meeting of May 7, 2013
VI.1.2.2.1 - First resolution
The Shareholders' Meeting, having heard the reports of the Board of Directors and statutory auditors,
approves the financial statements and the statement of financial position for 2013 as presented, which show a
net profit of €311,481,573.22.
It also approves the transactions shown in the financial statements or summarized in these reports.
The Shareholders' Meeting grants the directors and statutory auditors full discharge of their duties for the
year under review.
VI.1.2.2.2 - Second resolution
The Shareholders’ Meeting resolves to appropriate the net profit for the year totaling €311,481,573.22, plus
the retained earnings from the previous year totaling €653,565.20, i.e. the sum of €312,135,138.42, as
follows:
-
pay a dividend of €4.90 to each of the 26,532,613 shares carrying dividend rights for the full
year and a dividend of €2.04 to each of the 52,521 new shares carrying dividend rights from July
29, 2013, i.e. a total payout of €130,116,946.54. These dividends are eligible for deduction under
Article 158 of the French Tax Code (Code Général des Impôts – CGI);
transfer €262,605 to the legal reserve, bringing it to 10% of the share capital of BFCM;
-
transfer €181 million to the optional reserve; and
-
transfer the balance of €755,586.88 to retained earnings.
-
In accordance with the legal provisions in force, we remind you that the dividends paid per share for the last
three years were as follows:
Exercice
Montant en €
Dividende éligible à l'abattement
prévu par l'article 158 du CGI
2010
2011
2012
-
2,00 €
2,65 €
-
oui
oui
VI.1.2.2.3 - Third resolution
The Shareholders’ Meeting approves the consolidated financial statements for the year ended December 31,
2013 as presented by the Board of Directors.
VI.1.2.2.4 - Fourth resolution
The Shareholders’ Meeting approves the agreements covered by Article L. 225-38 of the French Commercial
Code (Code de Commerce) presented in the special report of the statutory auditors.
VI.1.2.2.5 - Fifth resolution
Pursuant to Article L. 511-73 of the French Monetary and Financial Code (Code Monétaire et Financier), the
Shareholders' Meeting issues a favorable opinion regarding the total amount of the remuneration specified in
the Board of Directors' report. This amount includes remuneration of any kind paid during the year under
review to the accountable managers and the categories of employees referred to in Article L. 511-71 of this
same code.
VI.1.2.2.6 - Sixth resolution
The Shareholders' Meeting approves the co-optation of Mr. Hervé Brochard as a member of the Board of
Directors to replace Mr. Eckart Thomä for the remainder of Mr. Thomä's term of office, i.e. until today's
Shareholders' Meeting called to approve the 2013 financial statements.
199
VI.1.2.2.7 - Seventh resolution
The Shareholders’ Meeting renews the appointment of Mr. Hervé Brochard as a member of the Board of
Directors for a three-year term.
His term of office will expire at the time of the Shareholders’ Meeting called to approve the 2016 financial
statements.
VI.1.2.2.8 - Eighth resolution
The Shareholders’ Meeting renews the appointment of Mr. Roger Danguel as a member of the Board of
Directors for a three-year term.
His term of office will expire at the time of the Shareholders’ Meeting called to approve the 2016 financial
statements.
VI.1.2.2.9 - Ninth resolution
The Shareholders’ Meeting renews the appointment of Mr. François Duret as a member of the Board of
Directors for a three-year term.
His term of office will expire at the time of the Shareholders’ Meeting called to approve the 2016 financial
statements.
VI.1.2.2.10 - Tenth resolution
The Shareholders’ Meeting renews the appointment of Mr. Jean-Louis Girodot as a member of the Board of
Directors for a three-year term.
His term of office will expire at the time of the Shareholders’ Meeting called to approve the 2016 financial
statements.
VI.1.2.2.11 - Eleventh resolution
The Shareholders’ Meeting renews the appointment of Mr. Gérard Oliger as a member of the Board of
Directors for a three-year term.
His term of office will expire at the time of the Shareholders’ Meeting called to approve the 2016 financial
statements.
VI.1.2.2.12 - Twelfth resolution
The Shareholders’ Meeting renews the appointment of Mr. Michel Vieux as a member of the Board of
Directors for a three-year term.
His term of office will expire at the time of the Shareholders’ Meeting called to approve the 2016 financial
statements.
200
VI.2 - Statutory Auditors’ report on regulated agreements and commitments
KPMG Audit
A department of KPMG S.A.
1, cours Valmy
92923 Paris – La Défense Cedex
Statutory Auditor
Member of the regional association
of accountants of Versailles
ERNST & YOUNG et Autres
1/2, place des Saisons
92400 Courbevoie - Paris-La Défense 1
S.A.S. à capital variable (simplified stock company with
variable capital)
Statutory Auditor
Member of the regional association
of accountants of Versailles
Banque Fédérative du Crédit Mutuel
Shareholders' Meeting called to approve the financial statements for the year ended December 31, 2013
Special report of the statutory auditors on regulated agreements and commitments
Dear Shareholders,
In our capacity as statutory auditors of your company, we hereby report to you on regulated agreements and
commitments.
We are required to inform you, on the basis of the information provided to us, of the main characteristics and
terms and conditions of the agreements and commitments brought to our attention or which we may have
identified in the course of our audit. We are not required to comment as to whether they are beneficial or
appropriate or to ascertain the existence of other agreements and commitments. It is your responsibility, in
accordance with Article R. 225-31 of the French Commercial Code (Code de Commerce), to assess the
benefits of these agreements and commitments prior to their approval.
In addition, we are required, where applicable, to provide you with the information referred to in Article R.
225-31 of the French Commercial Code concerning the implementation, during the year under review, of the
agreements and commitments already approved by the Shareholders’ Meeting.
We followed the procedures that we considered necessary to comply with the professional guidance given by
the national auditing body (Compagnie Nationale des Commissaires aux Comptes) for this type of audit.
These procedures entailed verifying that the information provided to us was consistent with the documents
from which it was extracted.
Agreements and commitments submitted to the Shareholders' Meeting for approval
We have not been advised of any agreement or commitment authorized during the year under review to be
submitted to the Shareholders' Meeting for approval in accordance with Article L. 225-38 of the French
Commercial Code.
Agreements and commitments already approved by the Shareholders' Meeting
Agreements and commitments approved in previous years which remained in effect during the year
under review
Pursuant to Article R. 225-30 of the French Commercial Code, we have been informed that the following
agreements and commitments, already approved by the Shareholders' Meeting in previous years, remained in
effect during the year under review.
201
1.
With CIC and Banque de Luxembourg
Directors and corporate officers concerned
Mr. Michel Lucas, Chairman and Chief Executive Officer of BFCM,
Mr. Alain Fradin, Chief Operating Officer of BFCM,
Messrs. Jacques Humbert, Maurice Corgini and Jean-Louis Girodot, directors of BFCM,
Mr. Daniel Leroyer, permanent representative of CFCM Maine-Anjou, Basse Normandie to the Board of
Directors of your company.
Nature, purpose and terms and conditions
Banque de Luxembourg, CIC and your company are part of CM11-CIC Group and, as such, have occasion to
lend and borrow sums of money through transactions carried out between your company and Banque de
Luxembourg, on the one hand, and between CIC and Banque de Luxembourg, on the other hand, to most
effectively manage their respective cash flows.
These entities wished to globalize their present and future transactions and benefit from the provisions of
Articles L. 211-36 et seq. of the French Monetary and Financial Code and the Luxembourg law of August 5,
2005 concerning collateral security agreements.
These entities therefore decided to enter into a netting agreement under which, in the event of default, the
transactions in question may be canceled and the resulting debts and receivables, regardless of their due
dates, their purposes or the currencies in which they are denominated, may be offset.
This netting agreement between your company, Banque de Luxembourg and CIC received prior
authorization from your Board of Directors on July 26, 2012.
2.
CMNE securitization with Caisse Fédérale de Crédit Mutuel (CFdeCM)
Directors and corporate officers concerned
Mr. Michel Lucas, Chairman and Chief Executive Officer of BFCM,
Messrs. Jean-Louis Boisson, Jacques Humbert, Gérard Bontoux, Gérard Cormorèche, François Duret, Pierre
Filliger, Jean-Louis Girodot, Albert Peccoux, Alain Têtedoie, Eckart Thöma and Michel Vieux, directors of
BFCM.
Nature, purpose and terms and conditions
The following agreements concerning the implementation of a refinancing mechanism with Crédit Mutuel
Nord Europe were authorized by your Board of Directors on July 26, 2012:
the Master Framework and Definitions Agreement between your company (as Borrower, Custodian,
Collateral Security Agent, Issuer Accounts Bank, Issuer Cash Manager, Collection Loss Collateral
Provider), CFdeCM (as Seller, Intermediary Bank and Issuer Servicer), CM-CIC Securities (as
Paying Agent), Caisse Fédérale du Crédit Mutuel Nord Europe (as Initial Notes Subscriber and SubCollateral Security Agent), CMNE Home Loans FCT (represented by France Titrisation) and France
Titrisation (as Management Company);
the Borrower Facility Agreement between your company (as Borrower) and CFdeCM (as
Intermediary Bank);
the Collateral Security Agreement between your company (as Collateral Security Agent, Collateral
Provider and Borrower), CFdeCM (as Intermediary Bank), Caisse Fédérale du Crédit Mutuel Nord
Europe (as Sub-Collateral Security Agent) and the Collateral Providers;
202
3.
the Collection Loss Collateral Agreement between your company (as Borrower, Custodian and
Collection Loss Collateral Provider), CFdeCM (as Intermediary Bank and Issuer Servicer) and
CMNE Home Loans FCT (represented by France Titrisation (as Management Company));
the Transfer and Servicing Agreement between your company (as Borrower and Custodian),
CFdeCM (as Issuer Servicer, Seller and Intermediary Bank) and CMNE Home Loans FCT
(represented by France Titrisation (as Management Company));
the 2012 TEG Letter, which must be sent by CFdeCM (as Intermediary Bank) to your company (as
Borrower), with a copy to France Titrisation (as Management Company);
the 2012 Drawdown Request, which must be sent by your company (as Borrower) to CFdeCM (as
Intermediary Bank), with a copy to France Titrisation (as Management Company).
Zéphyr securitization with Caisse Fédérale de Crédit Mutuel (CFdeCM), Crédit Mutuel MaineAnjou, Basse Normandie and Crédit Mutuel Océan
Directors and corporate officers concerned
Mr. Michel Lucas, Chairman and Chief Executive Officer of BFCM,
Messrs. Jean-Louis Boisson, Jacques Humbert, Gérard Bontoux, Gérard Cormorèche, François Duret, Pierre
Filliger, Jean-Louis Girodot, Albert Peccoux, Alain Têtedoie, Eckart Thöma and Michel Vieux, directors of
BFCM,
Mr. Daniel Leroyer, permanent representative of Caisse Fédérale du Crédit Mutuel Maine-Anjou Basse
Normandie to the Board of Directors of your company.
Nature, purpose and terms and conditions
The following agreements concerning the implementation of a refinancing mechanism with Crédit Mutuel
Maine-Anjou, Basse Normandie and Crédit Mutuel Océan were authorized by your Board of Directors on
July 26, 2012:
the Master Framework and Definitions Agreement between your company (as Borrower, Custodian,
Collateral Security Agent, Issuer Accounts Bank, Issuer Cash Manager, Collection Loss Collateral
Provider), CFdeCM (as Seller, Intermediary Bank and Issuer Servicer), CM-CIC Securities (as
Paying Agent), Caisse Fédérale du Crédit Mutuel Maine-Anjou, Basse-Normandie (as Initial Notes
Subscriber and Sub-Collateral Security Agent), Caisse Fédérale du Crédit Mutuel Océan (as Initial
Notes Subscriber and Sub-Collateral Security Agent), Zephyr Home Loans FCT (represented by
France Titrisation (as Management Company)) and France Titrisation (as Management Company);
the Borrower Facility Agreement between your company (as Borrower) and CFdeCM (as
Intermediary Bank);
the Collateral Security Agreement between your company (as Collateral Security Agent, Collateral
Provider and Borrower), CFdeCM (as Intermediary Bank), Caisse Fédérale du Crédit Mutuel MaineAnjou, Basse-Normandie (as Sub-Collateral Security Agent), Caisse Fédérale du Crédit Mutuel
Océan (as Sub-Collateral Security Agent) and the Collateral Providers;
203
4.
the Collection Loss Collateral Agreement between your company (as Borrower, Custodian and
Collection Loss Collateral Provider), CFdeCM (as Intermediary Bank and Issuer Servicer) and
Zephyr Home Loans FCT, represented by France Titrisation (as Management Company);
the Transfer and Servicing Agreement between your company (as Borrower and Custodian),
CFdeCM (as Issuer Servicer, Seller and Intermediary Bank) and Zephyr Home Loans FCT
(represented by France Titrisation (as Management Company));
the 2012 Drawdown Request, which must be sent by your company (as Borrower) to CFdeCM (as
Intermediary Bank), with a copy to France Titrisation (as Management Company);
the 2012 TEG Letter, which must be sent by CFdeCM (as Intermediary Bank) to your company (as
Borrower), with a copy to France Titrisation (as Management Company).
With Targobank Germany
Directors and corporate officers concerned
Messrs. Eckart Thomä and Jean-Paul Martin, directors of BFCM.
Nature, purpose and terms and conditions
Except in Germany, ownership of the Targo Bank brand name was assigned by Targobank Germany to your
company which may therefore, under the legal conditions specific to each country, make it available to any
subsidiary it controls provided that it ensures compliance with the specifications of the brand name. To this
end, your company delegates to Targobank Germany the task of monitoring and managing protection of the
brand name on behalf of the group.
This agreement received prior authorization from your Board of Directors on November 16, 2012.
5.
With Mr. Alain Fradin, Chief Operating Officer
Nature, purpose and terms and conditions
On May 11, 2011, the Board of Directors decided to approve the proposals of the Remuneration Committee
regarding the fixed and variable remuneration and other employee benefits of Mr. Alain Fradin.
On May 11, 2011, the Board of Directors also decided to approve the proposal of the Remuneration
Committee regarding the termination indemnity of Mr. Alain Fradin, calculated based on the average of the
last 12 months preceding the end of his term of office.
The payment of this indemnity is subject to a performance condition based on the group’s total consolidated
IFRS equity on the final date of the term of office. With respect to this term of office, the above-mentioned
payment does not come at the expense of the payment that he would receive as an employee pursuant, in
particular, to the industrial agreements applicable at the group.
As an employee, Mr. Alain Fradin is subject to the company supplementary pension rules of January 1, 2008.
The Remuneration Committee therefore proposed that these pension rules be applied to Mr. Alain Fradin’s
remuneration, as Chief Operating Officer, under the same conditions applicable to all group employees.
However, it should be recalled that Mr. Alain Fradin has been an employee of the group since June 1, 1983
and that his employment contract was suspended effective May 1, 2011.
204
The termination indemnity of Mr. Alain Fradin as Chief Operating Officer currently represents an estimated
commitment of €1.12 million (including social security and other payroll-related expenses).
As a corporate officer, Mr. Alain Fradin is also covered by a supplementary pension plan, the conditions of
which are the same as those that apply to the other employees of your company and for which the
contributions paid to the insurance company covering this entire commitment amounted to €17,923 in 2013.
Paris-La Défense, April 14, 2014
The Statutory Auditors
KPMG Audit
A department of KPMG S.A.
Arnaud Bourdeille
ERNST & YOUNG et Autres
Olivier Durand
205
VI.3 - Sundry information
VI.3.1 - Issuer’s corporate name and trading name
Banque Fédérative du Crédit Mutuel (BFCM)
VI.3.2 - BFCM’s place of incorporation and registration number
Strasbourg B 355 801 929
APE/NAF code: 6419 Z
VI.3.3 - BFCM’s date of incorporation and term
The company was formed on June 1, 1933 under the name “Banque Mosellane”. Except in the event of an
extension or early dissolution, it will cease to exist on June 1, 2032.
VI.3.4 - Registered office, legal form, legislation governing BFCM’s activities, country of
origin, telephone number of BFCM’s registered office
BFCM is a French Société Anonyme à Conseil d’Administration (joint-stock company with a Board of
Directors). As a credit institution and société anonyme, it is subject to a statutory audit by two registered
auditors. The statutory auditors are appointed by the company’s Shareholders’ Meeting for a term of six
years, subject to approval by the ACPR (French banking and insurance supervisory authority).
BFCM is governed by the provisions of the French Commercial Code (Code de commerce) regarding
sociétés anonymes and by the laws applicable to French credit institutions, most of which are codified in the
French Monetary and Financial Code (Code monétaire et financier). BFCM is a member of the French
Banking Federation (FBF).
The legal documents related to Banque Fédérative du Crédit Mutuel may be consulted at the company’s
registered office at 34 rue du Wacken, 67000 Strasbourg, France. +33 (0)3 88 14 88 14
VI.3.5 - Corporate purpose (Article 2 of the company's bylaws)
The company’s purpose is to:
- organize and develop the diversification activities of the group that it forms with the Crédit Mutuel
Caisses under its authority, Caisse Fédérale de Crédit Mutuel and Fédération du Crédit Mutuel Centre
Est Europe,
- carry out, for its own account, on behalf of third parties or on a joint basis, in France and elsewhere, all
banking transactions and all related and ancillary transactions, all insurance brokerage activities and,
more generally, all insurance intermediation activities, as well as all other transactions falling within a
bank’s scope of activity in accordance with the prevailing regulations and legislation,
- acquire and manage a direct or indirect shareholding in any French or foreign company through the
formation of new companies, contributions, subscriptions or purchases of shares or ownership interests,
mergers, associations or investments, investment banking groups or otherwise, and
- more generally, complete all financial, industrial, commercial, movable or immovable property
transactions related directly or indirectly to the purposes referred to above or falling within a bank’s
scope of activity.
The company’s purpose is also to provide investment services governed by the French Monetary and
Financial Code (Code monétaire et financier).
VI.3.6 - Financial year
The company’s financial year runs from January 1 to December 31 of each calendar year.
206
VI.3.7 - Appropriation of profits (Article 40 of the company's bylaws)
After allocation to the legal reserve, if the financial statements for the year, as approved by the Shareholders’
Meeting, show a distributable profit, the Shareholders’ Meeting shall decide to allocate said profit to one or
more reserve accounts whose allocation and use it shall determine, carry it forward as retained earnings or
distribute it.
In case of a distribution, the dividends shall first be taken from the profits of the year under review.
After determining the existence of reserves at its disposal, the Shareholders’ Meeting may decide to
distribute sums taken from these reserves. In this case, the decision shall expressly indicate the reserves from
which the amounts are to be taken.
The Shareholders’ Meeting called to approve the financial statements for the year has the option to give each
shareholder the choice between payment in cash or in shares, for all or part of the dividend paid out, in
accordance with the prevailing legal provisions.
The Board of Directors may also decide to pay interim dividends, giving each shareholder the choice
between payment in cash or in shares.
VI.3.8 - Shareholders' Meetings
Shareholders’ Meetings are convened by the Board of Directors through an announcement in a publication
that carries legal notices serving the area where the registered office is located. Notice of the meeting is also
given through an individual letter sent by ordinary mail to shareholders who have held registered shares for
at least one month as of the publication date of the above announcement.
Since the capital consists entirely of ordinary shares, one share entitles the holder to one vote. There are no
double voting rights.
Furthermore, the company's bylaws do not provide for a reporting threshold. BFCM’s capital is “closed” (see
Article 10 of BFCM’s bylaws under the section entitled “Additional specific provisions related to the
issuer”).
VI.3.9 - Additional specific provisions related to the issuer
Shareholding structure:
Conditions for admission of shareholders (extract from Article 10 of BFCM’s bylaws)
The only shareholders of the company shall be:
2. Fédération du Crédit Mutuel du Centre Est Europe, Caisse Fédérale de Crédit Mutuel and the
"Assurances du Crédit Mutuel - Vie" mutual insurance company;
3. the Crédit Mutuel Caisses and the other cooperative and mutual bodies that are members of the
Crédit Mutuel Centre Est Europe, Crédit Mutuel du Sud-Est, Crédit Mutuel d’Ile-de-France, Crédit
Mutuel Savoie Mont-Blanc, Crédit Mutuel Midi-Atlantique, Crédit Mutuel Loire-Atlantique CentreOuest, Crédit Mutuel du Centre, Crédit Mutuel de Normandie, Crédit Mutuel Dauphiné-Vivarais,
Crédit Mutuel Méditerranéen and Crédit Mutuel d’Anjou federations;
4. the departmental and interdepartmental Caisses and Caisse Centrale du Crédit Mutuel covered by
Article 5-1, paragraphs 3 and 4, of the order of October 16, 1958; the subsidiaries or associated
companies of the entities covered by points 2 and 3 above and controlled by one or more
departmental or interdepartmental Caisses.
5. the members of the company’s Board of Directors.
Individuals or legal entities that do not fall into any of the above categories and remain owners of the
company's shares may retain their shares in their personal capacity.
The provisions of this article may be modified only after obtaining approval from the Chambre Syndicale de
la Fédération du Crédit Mutuel Centre Est Europe and the Shareholders’ Meeting of Caisse Fédérale de
Crédit Mutuel.
207
Transfer of BFCM shares
The shares are fully tradable; however, share ownership may only be transferred between legal entities or
individuals who meet the above conditions and subject to approval by the Board of Directors (Article 11 of
the company’s bylaws).
Amount of the subscribed capital, number and class of shares that make up the share capital
The share capital amounts to €1,329,256,700.00 and is divided into 26,585,134 shares of €50 each, all
belonging to the same class.
Unissued authorized capital
None.
Exchangeable or redeemable convertible bonds that give access to the capital
None.
Statement of changes in capital
See “Five-year financial summary” in the chapter entitled “Financial elements of BFCM’s corporate
financial statements”.
Market for the issuer's shares
Banque Fédérative du Crédit Mutuel’s shares are not quoted or traded on any market.
Dividends
Changes in earnings and dividends:
2009
26,043,845
12.71
4.96
2010
26,043,845
11.60
2011
2012
2013
Number of shares at December 31
26,496,265 26,532,613 26,585,134 (a)
Net profit (€/share)
10.94
24.48
11.72
2.00
2.65
4.90
(b)
Gross dividend (€/share)
0.83
1.33
2.04
(b)
(a) 26,532,613 shares carrying dividend rights for the full year and 52,521 new shares carrying dividend rights
from August 1, 2013.
(b) The dividend paid is €4.90 for shares carrying dividend rights for the full year and €2.04 for new shares
carrying dividend rights from August 1, 2013.
Unclaimed dividends are subject to the provisions of Article L. 27-3 of the Code of State-Owned Property
(Code du Domaine de l’Etat) which states that:
“…Deposits of sums of money and, more generally, all cash assets held at banks, credit institutions and all
other establishments that receive funds on deposit or in current accounts, when such deposits or assets have
not been subject to any transaction or claim for 30 years by those entitled to such sums, shall definitively
revert to the State...”
VI.3.10 - Financial information contained in the registration document which is not taken
from the issuer's audited financial statements
Financial information contained in the registration document which is not taken from the issuer’s audited
financial statements includes the following points extracted from the following sections:
Presentation of CM11-CIC Group and BFCM Group
CM11-CIC Group's organization and business lines (I.3 – page 5)
Financial information about BFCM Group - Risk report
Interbank loans (V.4.1.2.3 – page 58)
Interest rate risk management (V.4.2.2 – page 59)
Risk management (V.4.3.3 – page 64)
The European solvency ratio (ESR) (V.4.4 – page 66)
Operational risk (V.4.5 – page 66)
208
VI.3.11 - Date of the latest financial information
The date of BFCM’s latest reported financial information is December 31, 2013.
VI.3.12 - Half-year information
Not applicable.
VI.3.13 - Material change in the issuer's financial position
There have been no material changes in BFCM Group’s financial or commercial position since the
publication on February 27, 2014 of the financial statements for the year ended December 31, 2013.
Similarly, there has been no material adverse change in BFCM’s outlook since that date.
VI.3.14 - Recent events specific to BFCM which have a material impact on the measurement
of its solvency
Targobank Germany
Crédit Mutuel-CIC Group's German subsidiary announced the acquisition of the credit card distribution
activities of Valovis Bank AG, the former consumer credit subsidiary of the Karstadt Quelle retail group. The
transaction will be finalized in the first half of 2014. It allows Targobank to increase its customer portfolio by
800,000 and become the third largest credit card issuer in Germany.
There have been no material changes in the group’s financial or commercial position since the end of the last
year for which audited financial statements were published which are likely to affect its solvency.
VI.3.15 - Earnings forecasts and estimates
Not applicable.
VI.3.16 - Major contracts
There are no major contracts (other than contracts entered into in the normal course of business) that could
confer on BFCM and/or its fully or proportionally consolidated subsidiaries a right or obligation impacting
BFCM’s ability to meet its obligations toward the holders of securities issued by it.
VI.3.17 - Information from third parties, experts' declarations and declarations of interest
Not applicable.
VI.3.18 - Legal and arbitration proceedings
During the last 12 months, BFCM has had no knowledge of any governmental, legal or arbitration
proceedings pending, stayed or in preparation, which could have or have recently had a material effect on the
financial position or profitability of BFCM and/or its fully or proportionally consolidated subsidiaries.
209
VII. ADDITIONAL
INFORMATION
210
VII.1 - Documents available to the public
During the period of validity of the registration document, the following documents (or copies thereof) may
be consulted:
By accessing BFCM’s website (Institutional site)
http://www.bfcm.creditmutuel.fr
- Historical financial information on BFCM and the CM11-CIC Group for each of the two financial years
preceding publication of the registration document.
- This annual financial report and those for the two preceding financial years.
In document form
- The issuer's deed of constitution and bylaws.
- All reports, mail and other documents, historical financial information, assessments and declarations
compiled by an expert at the issuer's request, a part of which is included or referred to in the registration
document.
- Historical financial information on BFCM's subsidiaries for each of the two financial years preceding
publication of the registration document.
By mailing a written request to:
Banque Fédérative du Crédit Mutuel
Département Juridique
34 Rue du Wacken BP 412
67002 Strasbourg Cedex
VII.2 - Person responsible for the information
Mr. Marc Bauer
Chief Operating Officer of BFCM and Chief Financial Officer of CM11-CIC Group
Telephone: +33 (0)3 88 14 68 03
E-mail: [email protected]
VII.3 - Person responsible for the annual financial report
Mr. Michel Lucas, Chairman and Chief Executive Officer of Banque Fédérative du Crédit Mutuel.
Declaration of the person responsible
I declare that, to the best of my knowledge, the financial statements are drawn up in accordance with the
applicable accounting standards and give a true and fair view of the assets and liabilities, financial position
and results of the company and of all the companies included in the consolidation scope, and that the
management report gives a true and fair view of changes in the business, results and financial position of the
company and of all the companies included in the consolidation scope as well as a description of the main
risks and uncertainties faced by those companies.
Executed in Strasbourg, April 30, 2014
VII.4 - Statutory Auditors
VII.4.1 - Statutory Auditors
VII.4.1.1 - Principal Statutory Auditors
ERNST & YOUNG et AUTRES, member of the Regional Institute of Accountants of Versailles –
represented by Olivier Durand – 1/2, place des Saisons – 92400 Courbevoie-Paris-La Défense 1.
Start date of first term of office: September 29, 1992.
211
Current term of office: six financial years with effect from May 12, 2010.
Renewal: the Shareholders’ Meeting renewed the term of office of Ernst & Young et Autres as Statutory
Auditors for a period of six years, i.e. until the end of the Shareholders’ Meeting called to approve the
financial statements for the year ending December 31, 2015.
KPMG AUDIT, member of the Regional Institute of Accountants of Versailles, represented by Arnaud
Bourdeille – 1, cours Valmy – 92923 PARIS-LA-DEFENSE Cedex.
Start date of first term of office: September 29, 1992.
Current term of office: six financial years with effect from May 12, 2010.
The Shareholders’ Meeting appointed KPMG as Statutory Auditors for a period of six years, i.e. until the
end of the Shareholders’ Meeting called to approve the financial statements for the year ending December
31, 2015.
VII.4.1.2 - Alternate Statutory Auditors:
Cabinet Picarle & Associés, Malcom McLarty
VII.4.1.3 - Resignation and non-renewal
Not applicable
VII.5 - BFCM annual financial report cross-reference table
The following thematic table identifies principal information required in the annual financial report pursuant
to Article L.451-1-2 of the French Monetary and Financial Code and by Article 222-3 of the AMF's general
regulations.
Cross reference table with information required in the annual report
Declaration by the person responsible for the registration document
Board of Directors’ management report
Financial review of 2013
Board of Directors
BFCM’s main activities
Information on the activities and results of the subsidiaries and companies controlled (Article
L233-6 of the French Commercial Code)
Trends and outlook
Financial information relating to BFCM’s financial statements
Financial information relating to BFCM’s consolidated financial statements
Appendix to the management report (list of mandates and functions exercised during the 2013
financial year (article L225-102-1 of the French Commercial Code)
Corporate social and environmental responsibility and related Auditors’ Report
Financial statements
Company financial statements
Statutory Auditors' report on the parent company financial statements
Consolidated financial statements
Statutory Auditors’ Report on the Consolidated Financial Statements
Pursuant to Articles 212-13 and 221-1 of the AMF’s General Regulations,
the following information is also published:
• statutory auditors’ fees
• the Chairman of the Board of Directors’ report on the conditions for preparing and
organizing the Board’s work and internal control procedures, together with the related
Statutory Auditors’ report
PAGES
211
41
11
9-43-187
189
47
125
40
12
163
128
161
77
123
122
22
212
© Copyright 2026 Paperzz