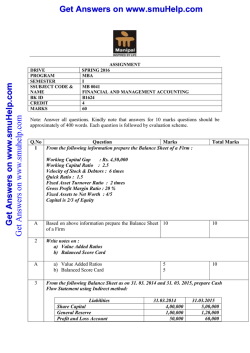
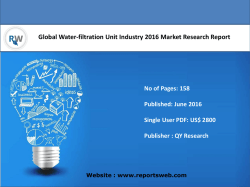
Europlasma
Capital Goods / France
Document generated on the 03/05/2016
Funded green ambitions
KEY DATA
12/13A
12/14A
Adjusted P/E (x)
Buy
Upside potential : 101%
Target Price (6 months)
1.42
Share Price
€ 0.71
Market Capitalisation €M
Price Momentum
Extremes 12Months
Bloomberg ticker
49.0
UNFAVORABLE
0.53
1.25
ALEUP FP
12/15E
12/16E
12/17E
-1.63
-2.92
ns
14.0
7.56
Dividend yield (%)
0.00
0.00
0.00
0.00
0.00
EV/EBITDA(R) (x)
-7.84
-9.72
11.5
2.55
-0.31
Adjusted EPS (€)
-0.60
-0.57
0.00
0.05
0.09
Growth in EPS (%)
n/a
n/a
n/a
n/a
85.4
0.00
0.00
0.00
0.00
0.00
12,572
8,983
17,900
57,173
82,785
-72.7
ns
-1.34
7.48
11.1
-12,254
-25,902
-140
4,961
7,600
-120
-270
-0.57
13.9
14.4
744
34.1
-43.8
-63.6
-57.4
Dividend (€)
Sales (€th)
Operating margin (%)
Attributable net profit (€th)
ROE (after tax) (%)
Gearing (%)
Last forecasts updated on the 10/06/2015
Benchmarks
Values (€)
Upside
Weight
1.90
168%
35%
DCF
NAV/SOTP per share
1.40
97%
20%
EV/Ebitda
Peers
1.42
100%
20%
P/E
Peers
1.36
92%
10%
Dividend Yield
Peers
0.00
-100%
10%
P/Book
Peers
1.20
69%
5%
1.42
101%
100%
TARGET PRICE
Conflicts of interest
Corporate broking
NO
Trading in corporate shares
NO
Analyst ownership
NO
Advising of corporate (strategy, marketing, debt, etc)
NO
Research paid for by corporate
YES
Provision of corporate access paid for by corporate
NO
Link between AlphaValue and a banking entity
NO
Analyst
Brokerage activity at AlphaValue
NO
Pierre-Yves Gauthier
[email protected]
Client of AlphaValue Research
NO
@
corporate.alphavalue.com
+33 (0) 1 70 61 10 50
[email protected]
Contract research, paid for by the above corporate entity. Equity research methods and procedures are as applied by AlphaValue. Target prices and opinions are thus exclusively determined by those
methods and procedures.
ALPHAVALUE CORPORATE SERVICES
Europlasma
(Buy)
Alternative Power Sources / France
Contents
Recent Updates....................................................................................................................
3
Body of research..................................................................................................................
6
Target Price & Opinion....................................................................................................
7
Businesses & Trends......................................................................................................
8
Money Making.................................................................................................................
10
Debt.................................................................................................................................
12
Valuation.........................................................................................................................
13
DCF.................................................................................................................................
15
NAV/SOTP......................................................................................................................
16
Worth Knowing................................................................................................................
17
Financials........................................................................................................................
18
Pension Risks..................................................................................................................
25
Governance & Management...........................................................................................
27
Graphics..........................................................................................................................
29
Methodology.........................................................................................................................
32
May 3 2016
Copyright Alphavalue - 2016 – corporate.alphavalue.com
Page 2
ALPHAVALUE CORPORATE SERVICES
Europlasma
(Buy)
Alternative Power Sources / France
Recent Updates
May 3 2016
Copyright Alphavalue - 2016 – corporate.alphavalue.com
Page 3
ALPHAVALUE CORPORATE SERVICES
Europlasma
(Buy)
Alternative Power Sources / France
Updates
09/03/2016 Liquidity sorted and good revenues on non-energy businesses
Earnings/sales releases
Fact
Europlasma posted €14.1m in revenues for 2015, up 57% on an admittedly painful previous year when a newlyappointed management had to deal with delayed sales, massive losses and a very weak balance sheet.
The small energy group in the making has also organised for an extra €10m of fresh financing (“equity line”) to see it
through the protracted completion of its prototype energy unit, CHO Power.
Analysis
Europlasma has been rather quiet over the bulk of 2015. Its management indeed concentrated on delivery not only
on its headline investment, the CHO Power prototype that will lead to a fleet of similar waste to energy projects, but
also on its other business lines that were prone to slippage.
2015 sales point towards some success in this respect. The actual sales at €14.1m are somewhat below our blue
sky estimates at €17.9m but are nevertheless sending positive vibrations where it matters.
The first such signal is with Inertam/Asbestos treatment that managed to gain 19% to €11.3m. Our own €12m was
without a good grasp of the maintenance constraints. The business seems on a sound footing for 2016.
The second positive signal is derived from the parent company that happens to be an engineering unit on top of a
manufacturing one for plasma torches. 2015 sales at €2.2m are somewhat above our own €2m, although driven by
one Chinese contract (€1.7m). More seems in the 2016 pipeline.
The last leg, the energy promise, is a brain twisting exercise. It had negative sales in 2014 (-€0.6m) and posted a
positive €0.6m this year. More detailing is required but, as a reminder, this business is booking both engineering
projects’ revenues (delayed) and plant operation revenues (delayed and below AlphaValue’s expectations). So that
the €3.9m that we booked at the beginning of 2015 are far off the mark.
This is frustrating but the key is that management has successfully faced another series of technical hiccups and
convincingly so, so that it has managed to secure extra financing (read below). It is also good news that replicates of
the prototype are continuing to make good progress (four sites at different stages of planning). They obviously take
on board all the learning curves of 2015.
2015 proved to be another year of hard work as management quickly realised that necessary changes made to the
initial design had knock-on effects, resulting in protracted delivery calendars. However the” Final Acceptance with
Reserves” received by December 2015 is a definitive turning point as the unit can now churn power (i.e. collect
revenues). The “reserves” do not appear to be stumbling blocks.
New funding
Europlasma has secured another €10m in fresh equity, in two equal tranches at an issue cost of 8%. This is a rightsless capital increase on tap, organised by Kepler Cheuvreux which is providing the funding and takes the built-in risk
of placing the newly-issued equity on stream. This comes on top of: 1) the near €40m that was raised over two years
ago (partly through debt conversion) to pay for the considerable delays having marred the energy project and
compounded by underfunding, and 2) a €5m convertible issued as a private placement last December (three years,
6% coupon, forced conversion call at 130%). As a reminder the 2014 capital increase was beefed up by the award
of two lines of warrants to 2017 (@0.8) and 2019 (@1.3) possibly netting up to €40m extra. Europlasma’s
shareholders have been asked a lot and need to participate in successive fund raisings to avoid steep dilution.
Impact
Europlasma’s management has managed in two years to set up an equity financing in line with the risky nature of
the energy projects. This needs to be commended as it is not easy to keep one’s nerves in such complex projects
and make sure the teams deliver. The 2015 actual earnings delivery is a big unknown, it is likely to be deeply
negative given long cycles of industrial optimization, but evidence of growth and sound liquidity should provide
investors with comfort.
May 3 2016
Copyright Alphavalue - 2016 – corporate.alphavalue.com
Page 4
ALPHAVALUE CORPORATE SERVICES
Europlasma
(Buy)
Alternative Power Sources / France
Updates
28/07/2015 Opinion change, due to market moves, from Add to Buy
10/06/2015 Green ambitions now funded
Change in Opinion
Add vs Buy
The target price is lowered after taking on board: the full extent of 2014 losses (a kitchen-sinking exercise in some
respects); a more cautious timetable on new power plants and the recognition that those more cautious plans rely
on the full exercise of existing warrants.
Change in EPS
2015 : € 0.00 vs 0.04
2016 : € 0.05 vs 0.13
ns
-60.0%
EPSs are driven by a recovery of the waste processing unit and by engineering works on a first new power plant.
Little of that second leg will be booked in 2015, thereby pushing back earnings by about 6 months compared to our
previous expectations. The same delay has a compounded impact on 2016 when a second new plant is launched.
Change in NAV
€ 1.40 vs 1.24
+13.0%
Delays in engineering work and delivery are offset from a valuation standpoint by higher earnings expected from
waste management and higher multiples on the power generation side. We have also allowed for tax loss carry
forwards.
Change in DCF
€ 1.84 vs 2.25
-18.1%
Discounted cash flows suffer from pushing back new power generation projects and the corresponding EPC
margins.
May 3 2016
Copyright Alphavalue - 2016 – corporate.alphavalue.com
Page 5
ALPHAVALUE CORPORATE SERVICES
Europlasma
(Buy)
Alternative Power Sources / France
Body of research
May 3 2016
Copyright Alphavalue - 2016 – corporate.alphavalue.com
Page 6
ALPHAVALUE CORPORATE SERVICES
Europlasma
(Buy)
Alternative Power Sources / France
Target Price & Opinion
Stock Price and Target Price
Earnings Per Share & Opinion
May 3 2016
Copyright Alphavalue - 2016 – corporate.alphavalue.com
Page 7
ALPHAVALUE CORPORATE SERVICES
Europlasma
(Buy)
Alternative Power Sources / France
Businesses & Trends
Businesses & Trends
Founded in 1992 to market plasma torch technology, Europlasma offers solutions to major environmental issues: waste
management and renewable energy production. Since 2013, the company has narrowed down to three divisions: 1) the design and
development of plasma torch systems which are generally sold with operational maintenance contracts. The entity rechristened
“Europlasma Industries” in 2014 also sells export licences (Japan, South Korea); 2) Renewable Energies through the design,
construction and operation of power generation solutions from waste and biomass through production sites which it operates but
only partly owns. Engineering & Construction is handled by CHO Power. Operation has been handled by CHOPEX from mid 2014;
and 3) Hazardous Waste (Inertam) is dedicated to handling asbestos and hazardous waste such as low radioactive waste. It
operates its own kilns for that purpose, powered by plasma torches. Another unrelated engineering business (Europe
Environnement) was divested in 2013.
Europlasma’s business model has been in transition since 2011 with a hard push into “green” electricity combining plasma torch
and waste/biomass to produce a clean gas which is then converted into electricity. The heart of the Europlasma proposition is the
gas cleaning phase that relies on plasma torches. Clean gas means efficient subsequent conversion into power currently through
heavy duty internal combustion engines driving power generators. The thermal and electrical efficiency from waste to power is
attractive to financial investors per se but also because alternative power sources tend to be subsidised as low carbon producer
units (better conversion means less carbon). Europlasma has thus a competitive advantage due to a powerful technological barrier
to entry: the plasma torch technology and related patents that improves the quality of the gas generated from waste/biomass. Green
power offers considerable growth potential as waste to power schemes appear to be much in demand and heavily subsidised while
technological progress brings down costs quickly. Green electricity has been the bold ambition of the group … with all the painful
experiences attached to developing a frontier technology. By 2015, the group is about two years late on its initial schedule.
Up to mid 2014, CHO-Power comprised all the activities linked to this new business (engineering, design, building, operations,
maintenance). From mid 2014, the segregation of the power plants operations into a new company (CHOPEX) is helpful as EPC
and O&M are obviously two very different business models (see next section).
The Europlasma parent company business is essentially to design plasma torches and torch-related solutions used in various
processes. The technology is well established, there are few competitors but it is up to Europlasma’s engineers to find new clients
and usage. The new management team at Europlasma since early 2014 has been shaking up that tree that had gone somewhat
soft.
One such usage, getting rid of asbestos by melting it into an inert component, has considerable potential and has been internalised
through the Inertam operation. Inertam has the only site registered in France for asbestos waste vitrification. The business is clearly
driven by tighter regulations around hazardous waste which have vastly increased opportunities. Inertam is running on scarce
capacities but is also confronted with downtime for relining kilns with refractory materials. Here again the new management has
come to grasp with a lack of urgency to ensure the assets were meant to sweat a bit more.
More on the green power scheme:
The CHO-Power/Renewable Energies prototype industrial facility built at Morcenx (near Bordeaux) produces clean biomass gas,
thanks to the plasma torch. This gas is used in a gas-powered engine to deliver electricity to EDF and heat to local wood-drying
facilities. The global thermal yield is excellent at 75% but, in early 2013, the pilot plant failed on its gasifier, an on-the-shelf, thirdparty manufactured but central piece of kit. This has effectively brought to a halt the project that should have been running at full
capacity by H2 13. The pilot, due to be delivered by summer 2015, is effectively two years late. The Europlasma-engineered bits
performed as expected but it appears after considerable accumulated pains that funding this bold move on a shoestring was a
recipe for disaster. This has had major funding implications with a massive recapitalisation (€36m) by late 2014 (see Debt section).
Europlasma has few competitors in the waste to energy field. It is worth mentioning that its incremental approach is actually less
risky that going for size as Plasco (Ottawa) tried and failed to achieve.
Power is sold to EDF under a 20-year guaranteed-price contract. Pricing depends on the total electrical & thermal output obtained,
knowing that each additional percentage point of output above 50% efficiency gives the right to a €1 increase per MWh relative to
the base tariff of €125/MWh. Hence, for a total yield at 75% already at hand, the facility can sell its electricity for €150/MWh.
Europlasma has big plans to expand from the Bordeaux-based pilot project to other sites, with two close to completing the
authorisation process in France. Eight in all are planned with the backing of a financial investor as the corresponding capital costs
are beyond Europlasma’s resources. Similar plans in the UK seem to be on the back-burner as the engineering team is clearly
stretched. The very nature of power generation means that these projects can be highly leveraged but again the balance sheet of
Europlasma is just not strong enough as eight projects would mean a c.€350m investment.
May 3 2016
Copyright Alphavalue - 2016 – corporate.alphavalue.com
Page 8
ALPHAVALUE CORPORATE SERVICES
Europlasma
(Buy)
Alternative Power Sources / France
Businesses & Trends
2014, after an already catastrophic 2013, showed indeed that execution risks on power production are enormous with a €26m loss
on €9m sales (down 29%). As a result of the prototype mishap, the company has changed its governance substantially over the last
18 months and completed by 2015 a deep financial restructuring matched by a reassessment of its legal organisation.
One key aspect of the new management’s efforts is to make sure that the company is less of a development engineer and more
focused on selling the existing technologies.
The pilot project is expected to be up and running by mid 2015 so that it can be “handed over” to the operating company and
produce MWh. This should trigger all sorts of positive implications for the implementation of the renewable energy strategy.
Divisional Breakdown Of Revenues
Change 15E/14
Sector
Engineering, Torch
(Europlas...
Renewable Energy
(CHO-P...
Toxic Waste
Management (In...
Air & Gaz (Europe
Environne...
Other
Industry Specific
Equipment
Alternative Power
Sources
Waste Mgt &
Recycling
Gases & Liquid
Process.
Total sales
Change 16E/15E
12/14A
12/15E
12/16E
12/17E
117
2,000
4,000
8,000
1,883
21%
2,000
5%
-596 (1)
3,900 (1)
40,173
61,285
4,496
50%
36,273
92%
9,461
12,000
13,000
13,500
2,539
28%
1,000
3%
0.00
0.00
0.00
0.00
0
0%
0
0%
€th
of % total
€th
of % total
0.00
0.00
0.00
0.00
0
0%
0
0%
8,982
17,900
57,173
82,785
8,918
100%
39,273
100%
Key Exposures
1. Construction and subsequent
operation
of
the
energy
production sites
Sales By Geography
Revenues
Costs
Equity
Dollar
6.0%
3.0%
3.0%
Europe
Emerging currencies
1.0%
0.0%
0.0%
Americas
1.0%
25.0%
0.0%
0.0%
Asia
2.0%
Long-term global warming
97.0%
We address exposures (eg. how much of the turnover is exposed to the $ ) rather than sensitivities (say, how much a 5% move in the $ affects the bottom line). This is to make
comparisons easier and provides useful tools when extracting relevant data.
Actually, the subject is rather complex on the ground. The default position is one of an investor managing in €. An investor in £ will obviously not react to a £ based stock trading partly in €
as would a € based investor. In addition, certain circumstances can prove difficult to unravel such as for eg. a € based investor confronted to a Swiss company reporting in $ but with a
quote in CHF... Sales exposure is probably straightforward but one has to be careful with deep cyclicals. Costs exposure is a bit less easy to determine (we do not allow for hedges as
they can only be postponing the day of reckoning). How much of the equity is exposed to a given subject is rarely straightforward but can be quite telling
In addition, subjects are frequently intertwined. A $ exposure may encompass all revenues in $ pegged currencies and an emerging currency exposure is likely to include $ pegged
currencies as well.
Exposure to global warming issues is frequently indirect and may require to stretch a bit imagination.
May 3 2016
Copyright Alphavalue - 2016 – corporate.alphavalue.com
Page 9
ALPHAVALUE CORPORATE SERVICES
Europlasma
(Buy)
Alternative Power Sources / France
Money Making
Money Making
Renewable Energy is a complex business model and one that is in transition.
This transition has had enormous costs in 2012, 2013 and 2014 with losses of respectively €22m, €12m and €26m. The 2014
losses include some foreseeable 2015 losses as the new management decided to take a somewhat more cautious view. We
reckon that Europlasma will do well if it breaks even in 2015. Genuine cash results are expected from 2016, or more than six years
after launch and with a 2-3 year delay.
Europlasma’s immediate challenge is to turn its pilot power generation plant into a cash machine. The target delivery date of the
pilot plant to its owner at nominal performance is mid 2015 after a long series of misfiring broadly linked to too tight a budget.
Summer 2015 should confirm that the pilot works. Then, and only then, will there be another challenge: to turn the working technology
into a park of power sites in which Europlasma has three economic returns: as builder, as operator and as shareholder.
Indeed much is at stake with the pilot unit as Europlasma has the external financing assigned to replicate the Morcenx scheme in
France and Europe. It deems that site authorisations should not be a constraint as these projects are supported by local authorities.
The next two (Tiper and Locminé are in Western France). Its drive, in addition to the build and management contracts with proper
margins (c.10-15%), is to expand its equity holdings in future sites from an initial 25% to 40% when each plant reaches agreed
performance metrics. This amounts to a call option dimension for Europlasma’s shareholders as the percentage ownership of
plants is a function of the output performance and will determine future dividend incomes from those plants.
The economic model for green energy remains a complex one, combining innovative technology and the high leverage that comes
with near certain flows, in a combination of debt and high reliance on third-party equity financing (which is another form of debt in
effect).
For its CHO Morcenx pilot project, Europlasma has set up a series of contracts where it builds and operates but only owns a
minority shareholder position in the underlying assets (25% to be expanded to 45% conditional to performance) after stumping up
10% of the project value (c. €42m per unit). This amounts to “leverage squared” with the risks of a blow up being devastating, as fully
experienced in 2013 and 2014. The underfinancing in 2013 meant that Europlasma had to go for a full recapitalisation in 2014 (see
Funding section.)
The renewable division’s (CHO Power) cash flows combine the margins on construction with those of operations to which would
need to be added the dividend possibly paid by the operating unit out of its excess cash flows. This is a reasonable assumption as
financial partners are likely to be collecting their dues this way. Power generation earnings are thus driven by a stream of
engineering (EPC) revenues and management-type ones for the actual operation of the plant. The 2015 and 2016 outlook is one of
EPC-type profits as the new plants will be operational only by the end of the period.
From 2014, the two sides of the business are to be separated into two distinct legal entities: CHO Power for EPC operations, and
CHOPEX for the operation of the existing plants. This improved clarity is welcomed. It has yet to be implemented in reporting to
investors.
By mid 2015, the CHO unit had two ongoing projects for Morcenx type plants. The first, Tiper, would have see the first construction
steps by the close of 2015. All authorisations have been cleared including the purchase by EDF at attractive prices. The second one
at Locminé is a JV with ENRgy. The permit applications have been presented to local authorities.
Waste management is simpler.
In 2013, Europlasma simplified its legal set up so that other businesses are also simpler to read. This is the case of Inertam, now
fully focused on the processing of dangerous waste (asbestos mostly). In 2013 and 2014, Inertam had to refurbish its units so
processed tonnage was not as strong as could have been the case but waste processing volumes have nevertheless accelerated
very substantially, admittedly from a very low base according to the new management. The potential returns are high due to scarcity
of treatment capacities and increasingly tough legislation that aims at destroying asbestos as opposed to burying it. This is
potentially a money-spinner with EBITDA margins in the 25% region. Of note, the by-product of asbestos burning is a glass-like
material that has heat retention features which makes it attractive for heating systems.
Where Inertam provides a service, Europlasma’s parent company, by contrast, is instead an engineer that explores the many uses
of the plasma torch. This is a complex field with few competitors providing industrial usage equipment. Interesting co-developments,
such as with Kobe Steel concerning fluidified combustion beds, are promising but are long lead-time projects. This part of the
business is in effect a form of R&D on request. Management is keen to turn this into immediate revenues through
consultancy/engineering work in all industries concerned with ultra-high temperatures.
All in all, the earnings pattern has been one of further adjustments in 2014 with again, kitchen-sinking type, enormous one-offs as in
2013. The firm would have gone under without the recap. Earnings visibility remains low for 2015 as it depends on the timetable for
May 3 2016
Copyright Alphavalue - 2016 – corporate.alphavalue.com
Page 10
ALPHAVALUE CORPORATE SERVICES
Europlasma
(Buy)
Alternative Power Sources / France
Money Making
the transfer of the CHO Morcenx to its rightful owner even though the risks of mishaps appear better contained. Earnings will take off
from 2016 with Inertam back on track and with the engineering phase attached to the new energy plants turning out attractive EPCtype margins.
As a summary to the business model, Europlasma combines the business of hazardous waste processing (services, now), of
engineering (construction, to accelerate) and energy production management (services, future).
Divisional Operating result
12/14A
12/15E
12/16E
12/17E
Change 15E/14
€th
Change 16E/15E
of % total
€th
of % total
Holding, R&D, Engineering, Torch
(Europlasma)
-5,478
200
1,000
1,600
5,678
25%
800
18%
Renewable Energy (CHO-POWER)
-14,358
-1,140
1,976
5,893
13,218
58%
3,116
69%
-3,094
700
1,300
1,700
3,794
17%
600
13%
0.00
0.00
0.00
0.00
0
0%
0
0%
-10.0
0.00
0.00
0.00
10
0%
0
0%
-22,940
-240
4,276
9,193
22,700
100%
4,516
100%
Toxic Waste Management (Inertam)
Air & Gaz (Europe Environnement)
Other/cancellations
Total
Divisional Operating result margin
Renewable Energy (CHO-POWER)
Toxic Waste Management (Inertam)
12/14A
12/15E
12/16E
12/17E
ns
-29.2%
4.92%
9.62%
-32.7%
5.83%
10.0%
12.6%
-255%
-1.34%
7.48%
11.1%
Air & Gaz (Europe Environnement)
Total
May 3 2016
Copyright Alphavalue - 2016 – corporate.alphavalue.com
Page 11
ALPHAVALUE CORPORATE SERVICES
Europlasma
(Buy)
Alternative Power Sources / France
Debt
Debt
By late 2014, Europlasma had recovered the necessary breathing space for the pursuit of its capital-intensive projects through a
large and successful rights issue of c. €40m. This is supposed to see Europlasma through both its immediate financing problems
and the funding of its share in new power projects. By 2015, the net cash position of the group could be €24m, mostly accounted for
by the exercise of the first layer of warrants jointly issued with the last rights issue.
Recent financing history:
On 1 December 2010, Europlasma signed a shareholder pact with a major private equity player specialised in renewable energy.
This pact grants extended first say on projects similar to that of the pilot, known as CHO Morcenx. The principle is that Europlasma
is funding 10% of the cost of energy sites (about €4m per project) and gets 25% of the equity/profit sharing. This figure rises to 35%
once operational performance exceeds certain levels. Europlasma successfully launched two capital increases raising a total of
€6.3m on 12 July 2010 to finance part of its share of the construction of the first power facility. The company contracted a €6.2m
bank loan (of which €1.2m pledged) over 12 years and at a fixed interest rate (4.4%) to finance the civil engineering works and
related building materials for the pilot project at Morcenx.
By 2012, the massive losses recorded in that year led debt to shoot up to €20m from c.€4m. The equity base contracted to €14m
from €35m so that the close of 2012 was a painful one in balance sheet terms. 2013 net debt reflected the absence of additional
projects but also the deconsolidation of Europe Environnement which had c.€7m net debt, mostly made up of financial leases.
The short-term financing, provided most notably by Credit Suisse Europlasma LLP for c. €5m, has rapidly proved to be too
expensive a bridge so that the urgent step was to inject fresh equity. The initial c.€4.4m raised in early 2014 has been
complemented by a c. €35.9m increase in November 2014 (including debt conversion) with more to come in the shape of two
tranches of warrants if and when they are exercised (€23m and then €18.8m). As of May 2015, the dilution linked to these warrants
was allowed for from 2015 for the first tranche and 2017 for the second one (B warrants).
Funding - Liquidity
12/14A
12/15E
12/16E
12/17E
EBITDA
€th
-11,176
3,860
8,376
13,293
Funds from operations (FFO)
€th
-16,985
4,960
9,476
11,115
Ordinary shareholders' equity
€th
16,793
31,975
39,570
65,984
Gross debt
€th
13,000
11,000
10,000
4,000
o/w Less than 1 year - Gross debt
€th
8,000
3,000
3,000
4,000
o/w 1 to 5 year - Gross debt
€th
5,000
5,000
4,000
of which Y+2
€th
2,000
of which Y+3
€th
2,000
of which Y+4
€th
1,000
o/w Beyond 5 years - Gross debt
€th
3,000
3,000
+ Gross Cash
€th
17,299
34,694
36,670
53,084
= Net debt / (cash)
€th
-4,299
-23,694
-26,670
-49,084
Bank borrowings
€th
11,000
2,000
2,000
2,000
Financial leases liabilities
€th
0.00
0.00
Other financing
€th
2,000
9,000
8,000
2,000
Gearing (at book value)
%
34.1
-43.8
-63.6
-57.4
Adj. Net debt/EBITDA(R)
x
0.38
-6.14
-3.18
-3.69
Adjusted Gross Debt/EBITDA(R)
x
-1.70
4.40
2.15
1.05
Adj. gross debt/(Adj. gross debt+Equity)
%
53.1
34.7
31.3
17.5
Ebit cover
x
-7.64
2.40
-42.8
-91.9
FFO/Gross Debt
%
-89.5
29.2
52.6
79.4
FFO/Net debt
%
395
-20.9
-35.5
-22.6
FCF/Adj. gross debt (%)
%
-92.5
10.3
47.1
65.1
(Gross cash+ "cash" FCF+undrawn)/ST debt
x
-0.03
12.2
15.0
15.5
"Cash" FCF/ST debt
x
-1.90
0.59
2.83
2.28
May 3 2016
Copyright Alphavalue - 2016 – corporate.alphavalue.com
Page 12
ALPHAVALUE CORPORATE SERVICES
Europlasma
(Buy)
Alternative Power Sources / France
Valuation
Valuation
In 2014, Europlasma had two equity issues: one for €4.4m in February and the second in November. Europlasma’s second
recapitalisation was a vast one with the issue of €27.8m fresh equity out a €36m total (the balance being debt conversion), likely
complemented by the exercise of two tranches of equity warrants (€23.1m if fully exercised for the first, €18.8m for the second
tranche). The two series of warrants have been allowed for in our EPS forecasts. The number of shares would thus shoot from 23
million at the beginning of 2014 to about 112 million if and when the warrants are exercised. The first tranche with a strike at €0.8
stands more than a fair chance of being exercised before the close of this year as it is in the money and entails a call option at
€0.01 held by the issuer before September 2015 if the share trades above €1.05, which is in effect a strong incentive for warrants
holders to exercise their warrants. The second tranche with a strike at €1.3 is a more distant perspective (up to November 2019) but
we have allowed for a full exercise by 2017.
Indeed, as we are of the view that the “raison d’être” of Europlasma is to expand its energy production assets, the equity stemming
from the warrants exercise will be needed to fund the minority share that Europlasma will have anyway in the next seven projects.
The valuation itself is made more complex by the shift in Europlasma’s business profile, as the initial manufacturer of capital goods,
plasma torches, has effectively moved into the operation of this know-how (green energy production), the capital intensity of which
implies complex funding schemes. On top, there are different margin layers as Europlasma’s energy business combines the
engineering bit and the operating bit.
Let us remind what those businesses entail from a valuation stand point:
Europlasma torch manufacturing business can be regarded as a capital goods supplier.
Inertam (hazardous waste)’s valuation is also rather simple. It has set up burning capacity and is being paid to process waste. As it
is a scarce resource, its processing margins are strong because prices hold. This amounts to valuing a waste processor with firm
prices and regulation-dependent growth prospects.
CHO Power is somewhat more complex because it reflects the transition from an engineering capacity (designing and assembling
new plants primarily financed by third parties) to operating them. It could potentially be complemented by capital gains on the selling
of power production entities consolidated under the equity method. The new business can be seen as a form of minority holdings in
as many concessions for producing electricity and heat, with a risk surrounding its speed of deployment and the uncertainty about
the level of subsidies surrounding green power.
For the DCF method, we apply a sales and margin growth of 5% over the long term, but the dividends expected from the energy
production units as they come on line have to be added on. It is an exercise which obviously leads to fragile conclusions because it
depends on the accuracy of the execution, the timing and the strength/commitment of the financial partners. Such dividends are
beyond the time scope of most investors but do impact positively a DCF. Also note that the DCF accrues in 2017 the value of the
tax loss carry forwards bundled in one year.
The calculation using the NAV method puts a finger on the difference in nature between current and future activities. The current
activities are based on engineering and capital goods multiples. Easy enough. But the O&M side is losing money and depends on
the proper execution of the EPC contracts. Less easy. We take a cautious path by averaging 2015 and 2016 EBIT of CHO Power
and applying an 11x EV/EBIT. It is worth mentioning that applying the transaction multiple (19x EBITDA) recorded by the Canadian
group AlterNRG would value the O&M activities alone at c.€70m while we use €43m for CHO Power (EPC +O&M). This valuation of
AlterNRG is due to an ongoing bid (June 2015) from Chinese privately-held Kaidi. It does confirm that there is a paucity of assets in
the waste gasification field.
Then the tricky bit is to put a value on future activities, that is the dividends streamed from the equity-owned producing SPVs. This
obviously depends on the proper execution of years of engineering and then operation. We have essentially discounted to today a
stream of dividend flows and deducted the capex associated with that flow of future dividends. This can be rounded to €10m as of
today. Due to the time factor, it does not take much to reach double this figure if the jigsaw falls neatly into place.
Peer metrics
As a comparison with other companies is difficult, we have chosen a combination of various peers currently tracked by AlphaValue:
Suez, specialised in environmental services; two engineering and industrial equipment supply companies with Abengoa and
Elecnor which have a strong presence in renewable energies/environment (bio-energy, solar energy), both in terms of engineering
and plant operations and so correspond well with the economic model implemented by Europlasma.
In addition, we add Gamesa, a company which is strictly a player in the field of renewable energies (construction of wind turbines
with a maintenance service offer, plus wind farms up to 2012). These stocks, although significantly larger, are overall following an
economic rationale which is very close to that now being pursued by Europlasma in green energies. Abengoa notably has set up an
operating unit on top of its engineering capabilities.
May 3 2016
Copyright Alphavalue - 2016 – corporate.alphavalue.com
Page 13
ALPHAVALUE CORPORATE SERVICES
Europlasma
(Buy)
Alternative Power Sources / France
Valuation
Valuation Summary
Benchmarks
Values (€)
Upside
Weight
DCF
1.90
168%
35%
NAV/SOTP per share
1.40
97%
20%
EV/Ebitda
Peers
1.42
100%
20%
P/E
Peers
1.36
92%
10%
Dividend Yield
Peers
0.00
-100%
10%
P/Book
Peers
1.20
69%
5%
1.42
101%
Target Price
Comparison based valuation
Computed on 18 month forecasts
P/E (x)
Ev/Ebitda (x)
P/Book (x)
Yield(%)
Peers ratios
19.3
7.84
1.61
3.16
Europlasma's ratios
10.1
0.95
0.96
0.00
0.00%
0.00%
0.00%
0.00%
Default comparison based valuation (€)
1.36
1.42
1.20
0.00
Suez
19.1
6.94
1.99
4.15
Gea Group
30.6
14.5
2.63
2.31
ERG
16.8
7.83
1.04
4.36
Elecnor
7.66
7.11
1.26
0.86
Abengoa
5.09
7.16
0.27
0.00
Premium
May 3 2016
Copyright Alphavalue - 2016 – corporate.alphavalue.com
Page 14
ALPHAVALUE CORPORATE SERVICES
Europlasma
(Buy)
Alternative Power Sources / France
DCF
DCF Valuation Per Share
WACC
%
Avg net debt (cash) at book value
€th
-25,182
PV of cashflow FY1-FY11
€th
86,081
8.68
Provisions
€th
6,000
FY11CF
€th
13,136
Unrecognised actuarial losses (gains)
€th
0.00
Normalised long-term growth"g"
%
Financial assets at market price
€th
10,000
Terminal value
€th
196,578
Minorities interests (fair value)
€th
1,000
PV terminal value
€th
85,496
Equity value
€th
199,759
PV terminal value in % of total value
%
Number of shares
Th
105,175
Total PV
€th
Implied equity value per share
€
2.00
49.8
171,577
1.90
Assessing The Cost Of Capital
Synthetic default risk free rate
%
3.50
Company debt spread
bp
300
Target equity risk premium
%
5.00
Marginal Company cost of debt
%
6.50
Tax advantage of debt finance
(normalised)
%
30.0
Company beta (leveraged)
x
0.69
Average debt maturity
Year
Company gearing at market value
%
-48.3
Sector asset beta
x
1.04
Company market gearing
%
-93.5
Debt beta
x
0.60
Required return on geared equity
%
6.93
Market capitalisation
€th
49,022
Cost of debt
%
4.55
Net debt (cash) at book value
€th
-23,694
Cost of ungeared equity
%
8.68
Net debt (cash) at market value
€th
-23,694
WACC
%
8.68
5
DCF Calculation
12/14A 12/15E 12/16E 12/17E Growth 12/18E
Sales
€th
EBITDA
€th
EBITDA Margin
%
Change in WCR
€th
Total operating cash flows (pre tax)
€th
Corporate tax
€th
Net tax shield
€th
Capital expenditure
€th
Capex/Sales
%
Pre financing costs FCF (for DCF purposes)
€th
Various add backs (incl. R&D, etc.) for DCF
purposes
€th
Free cash flow adjusted
€th
Discounted free cash flows
€th
Invested capital
€
May 3 2016
8,983 17,900 57,173 82,785
3,860 8,376 13,293
11,176
-124
21.6
14.7
-846
30.0
30.0
30.0
16.1
0.00
0.00
13,824
18,192
4.00% -2,369
-3,117
41.1
-2,737
-2.42
-2.42
-2.42
9,045
9,407
12,379
20,500
(2)
500 (3)
500 (3)
1,688
8,906 29,545
9,907
12,879
1,688
8,194 25,013
7,717
5,601
27.5
40.2
-11.2
-3.50
15,584
1,688
8,406
12.2
16.1
4.00%
4.00% -2,080
-17.5
15,169
15,169
18,192
31.2
-1,572 -2,000 -2,000 -2,000
415
4.00% 13,824
16.1
3,336 -1,202 1,000
0.00
3,658 10,376 13,293
12,844
-322
0.00
0.00 -2,278
12/25E
4.00% 86,096 113,297
0.00
14.4
500
20.0
26.0
4.00%
Copyright Alphavalue - 2016 – corporate.alphavalue.com
2. Including c.€20m of tax loss
carry forwards. For "out years"
DCF computation purposes the
tax charge is computed clean of
carry forwards but the value of
carry forwards is bundled as a
one-off in 2017
3. Dividend upflow from CHO
Morcenx, net of capex and two
similar
plants.
More
are
planned.
We
allow
for
delays/risks by accruing only
50% of the expected dividends
Page 15
ALPHAVALUE CORPORATE SERVICES
Europlasma
(Buy)
Alternative Power Sources / France
NAV/SOTP (edit)
NAV/SOTP Calculation
% owned
Valuation
technique
Multiple
used
Valuation at
100%
(€th)
Stake
valuation
(€th)
In
currency
per share
(€)
% of gross
assets
CHO-POWER
100%
EV/EBIT
11
42,900
42,900
(1)
0.41
54.7%
Inertam
100%
EV/EBIT
20
20,000
20,000
(2)
0.19
25.5%
Europlasma
100%
EV/EBIT
11
5,500
5,500 (3)
0.05
7.02%
(4)
0.10
12.8%
Total gross assets
78,400
0.75
100%
Net cash/(debt) by year end
49,084
0.47
62.6%
(5)
0.19
25.3%
NAV/SOTP
147,284
1.40
188%
Number of shares net of treasury shares - year end (Th)
105,175
Other
10,000
Commitments to pay
Commitments received
19,800
NAV/SOTP per share (€)
1.40
Current discount to NAV/SOTP (%)
49.3
May 3 2016
Copyright Alphavalue - 2016 – corporate.alphavalue.com
1. Multiple in line with that of the
'Power' divisions of the largest
capital goods companies.
2. Environmental services multiple
3. The EV/EBIT multiple is 20%
below the 2016 weighted
average for the capital goods
sector
4. Best guess about the option
value of yet to be financed new
sites plus the value of the stake
in the pilot project. It could be
five times this amount with
financing on hand
5. Tax credits. We indeed assume
that all power generation
projects are profitable
Page 16
ALPHAVALUE CORPORATE SERVICES
Europlasma
(Buy)
Alternative Power Sources / France
Worth Knowing
Worth Knowing
The 2012 start-up of the CHO Morcenx pilot facility validated its industrial process and mastery of the plasma torch-based
technology used to generate gas and then electricity from waste and biomass. The only (expensive) hiccup has been the near twoyear delay due to a faulty bought-off-the-shelf gasifier. The new management since early 2014 has taken a rather cautious view
about the timetable and deliveries which appears somewhat less prone to surprises.
Europlasma clearly evolves in the “green energy” business. In Europe, the steps to support “green energies” by way of subsidies
and/or feed-in tariffs have been hesitant and impacted by budget constraints just about everywhere. Governments however do see
the point of a more stable background. Europlasma, like its peer, can only benefit from more predictability.
The French government has selected the gasification technology by name and identified Europlasma as a reference player in
France for the Key Technologies 2015 research on the most promising technologies and those likely to create the most value and
jobs.
Shareholders
% owned
Of which
% voting rights
Of which
% free to float
Credit Suisse Europlasma SPV LLC
15.0%
20.0%
0.00%
Gottex
10.0%
5.00%
0.00%
Staff Europlasma
2.00%
2.00%
0.00%
Name
Apparent free float
May 3 2016
73.0%
Copyright Alphavalue - 2016 – corporate.alphavalue.com
Page 17
ALPHAVALUE CORPORATE SERVICES
Europlasma
(Buy)
Alternative Power Sources / France
Financials
Valuation Key Data
12/14A
12/15E
12/16E
12/17E
Adjusted P/E
x
-2.92
ns
14.0
7.56
Reported P/E
x
-4.47
-509
9.88
6.45
EV/EBITDA(R)
x
-9.72
11.5
2.55
-0.31
P/Book
x
6.89
2.23
1.24
0.74
Dividend yield
%
0.00
0.00
0.00
0.00
Free cash flow yield
%
-15.2
2.47
17.3
18.6
Average stock price
€
1.68
1.03
0.71
0.71
Consolidated P&L
12/14A
12/15E
12/16E
12/17E
€th
8,983
17,900
57,173
82,785
Sales growth
%
-28.5
99.3
219
44.8
Sales per employee
188
572
753
Sales
€th
101
Purchases and external costs (incl. IT)
€th
-13,139
Staff costs
€th
-6,437
-6,871
-7,233
-7,956
Operating lease payments
€th
Cost of sales/COGS (indicative)
€th
EBITDA
€th
-11,176
3,860
8,376
13,293
EBITDA(R)
€th
-11,176
3,860
8,376
13,293
EBITDA(R) margin
%
-124
21.6
14.7
16.1
EBITDA(R) per employee
€th
-126
40.6
83.8
121
Depreciation
€th
-5,124
-3,500
-3,500
-3,500
Depreciations/Sales
%
57.0
19.6
6.12
4.23
Amortisation
€th
-516
-600
-600
-600
Additions to provisions
€th
-4,725
0.00
0.00
0.00
Reduction of provisions
€th
0.00
0.00
0.00
0.00
Underlying operating profit
€th
-21,541
-240
4,276
9,193
Underlying operating margin
%
-240
-1.34
7.48
11.1
Other income/expense (cash)
€th
Other inc./ exp. (non cash; incl. assets revaluation)
€th
Earnings from joint venture(s)
€th
Impairment charges/goodwill amortisation
€th
-1,308
Operating profit (EBIT)
€th
-22,849
-240
4,276
9,193
Interest expenses
€th
-1,097
-200
-200
-200
€th
-483
-200
-200
-200
Financial income
€th
76.0
300
300
300
Other financial income (expense)
€th
-1,800
0.00
0.00
0.00
Net financial expenses
€th
-2,821
of which effectively paid cash interest expenses
of which related to pensions
Pre-tax profit before exceptional items
€th
Exceptional items and other (before taxes)
€th
of which cash (cost) from exceptionals
€th
100
100
100
0.00
0.00
-25,670
-140
4,376
9,293
-322
0.00
-983
-2,278 (4)
983
0.00
Current tax
€th
Impact of tax loss carry forward
€th
Deferred tax
€th
Corporate tax
€th
-322
0.00
0.00
-2,278
Tax rate
%
-1.32
0.00
0.00
24.5
Net margin
%
-289
-0.78
7.65
8.47
Equity associates
€th
90.0
0.00
585
585
€th
0.00
0.00
0.00
0.00
€th
-413
7,600
Actual dividends received from equity holdings
Minority interests
Actual dividends paid out to minorities
(4)
€th
Income from discontinued operations
€th
Attributable net profit
€th
-25,902
-140
4,961
Impairment charges/goodwill amortisation
€th
1,308
0.00
0.00
Other adjustments
€th
Adjusted attributable net profit
€th
May 3 2016
5. Offset to allow for the fact that
Europlasma will not pay taxes in
2017. See note in DCF 2017.
0.00
0.00
€th
4. See "other adjustments"
0.00
2,278 (5)
-24,594
-140
4,961
9,878
Copyright Alphavalue - 2016 – corporate.alphavalue.com
Page 18
ALPHAVALUE CORPORATE SERVICES
Europlasma
(Buy)
Alternative Power Sources / France
Financials
Interest expense savings
€th
Fully diluted adjusted attr. net profit
€th
-24,594
-140
4,961
9,878
NOPAT
€th
-14,989
-168
3,578
7,020
Cashflow Statement
12/14A
12/15E
12/16E
12/17E
EBITDA
€th
-11,176
3,860
8,376
13,293
Change in WCR
€th
3,336
-1,202
1,000
0.00
of which (increases)/decr. in receivables
€th
374
-1,690
-1,000
-1,000
of which (increases)/decr. in inventories
€th
-89.0
-911
0.00
-1,000
of which increases/(decr.) in payables
€th
997
1,003
1,000
1,000
of which increases/(decr.) in other curr. liab.
€th
2,054
396
1,000
1,000
Actual dividends received from equity holdings
€th
0.00
0.00
0.00
0.00
Paid taxes
€th
-326
0.00
0.00
-2,278
Exceptional items
€th
Other operating cash flows
€th
-5,000
1,000
1,000
Total operating cash flows
€th
-13,166
3,658
10,376
11,015
Capital expenditure
€th
-1,572
-2,000
-2,000
-2,000
Capex as a % of depreciation & amort.
%
27.9
48.8
48.8
48.8
(6)
(6)
-4,000
Net investments in shares
€th
0.00
Other investment flows
€th
-1,000
-1,500
-1,500
-1,500
Total investment flows
€th
-2,572
-7,500
-7,500
-7,500
Net interest expense
€th
-2,821
100
100
100
€th
-483
100
100
100
of which cash interest expense
-4,000
-4,000
Dividends (parent company)
€th
Dividends to minorities interests
€th
-413
0.00
0.00
0.00
New shareholders' equity
€th
25,000 (7)
23,137
0.00
18,799
-2,000
-1,000
-6,000
21,237
-900
12,899
of which (acquisition) release of treasury shares
7. September 2014 rights issue
on top of the €4.4m raised in
early 2014. The rights issue
was partly funded through debt
conversion so that the total
equity increase is close to
€40m
8. Europe Environnement debt
and leasing deconsolidated on
disposal
€th
(Increase)/decrease in net debt position
€th
1,050
Other financial flows
€th
(8)
Total financial flows
€th
25,154
Change in scope of consolidation, exchange rates & other
€th
1,000
Change in cash position
€th
10,416
17,395
1,976
16,414
Change in net debt position
€th
9,366
19,395
2,976
22,414
Free cash flow (pre div.)
€th
-17,559
1,758
8,476
9,115
Operating cash flow (clean)
€th
-13,166
3,658
10,376
11,015
Reinvestment rate (capex/tangible fixed assets)
%
12.8
15.4
14.3
13.3
May 3 2016
6. Europlasma's share of three
new power plants
Copyright Alphavalue - 2016 – corporate.alphavalue.com
Page 19
ALPHAVALUE CORPORATE SERVICES
Europlasma
(Buy)
Alternative Power Sources / France
Financials
Balance Sheet
12/14A
12/15E
12/16E
12/17E
Goodwill
€th
1,316
1,316
2,000
2,000
Other intangible assets
€th
1,065
1,065
2,000
3,000
Total intangible
€th
2,381
2,381
4,000
5,000
Tangible fixed assets
€th
12,287
13,000
14,000
15,000
Financial fixed assets (part of group strategy)
€th
3,685
4,000
8,000
12,000
Other financial assets (investment purpose mainly)
€th
2,392
2,000
3,000
4,000
WCR
€th
-6,202
-5,000
-6,000
-6,000
11,000
of which trade & receivables (+)
€th
7,310
9,000
10,000
of which inventories (+)
€th
1,089
2,000
2,000
3,000
of which payables (+)
€th
8,997
10,000
11,000
12,000
of which other current liabilities (+)
€th
5,604
6,000
7,000
8,000
€th
15,622
10,000
10,000
10,000
Other current assets
€th
354
Total assets (net of short term liabilities)
of which tax assets (+)
€th
30,165
26,381
33,000
40,000
Ordinary shareholders' equity (group share)
€th
16,793
31,975
39,570
65,984
Minority interests
€th
128
100
100
100
Provisions for pensions
€th
364
0.00
0.00
0.00
Other provisions for risks and liabilities
€th
5,613
6,000
8,000
10,000
Deferred tax liabilities
€th
-1,587
-2,000
-2,000
-2,000
Other liabilities
€th
13,153
14,000
14,000
15,000
Net debt / (cash)
€th
-4,299
-23,694
-26,670
-49,084
Total liabilities and shareholders' equity
€th
30,165
26,381
33,000
40,000
Average net debt / (cash)
€th
5,734
-13,997
-25,182
-37,877
EV Calculations
12/14A
12/15E
12/16E
12/17E
EV/EBITDA(R)
x
-9.72
11.5
2.55
-0.31
EV/EBIT (underlying profit)
x
-5.05
ns
4.99
-0.44
EV/Sales
x
12.1
2.49
0.37
-0.05
EV/Invested capital
x
8.94
3.10
1.07
-0.16
€th
115,756
71,244
49,022
49,022
+ Provisions (including pensions)
Market cap
€th
5,977
6,000
8,000
10,000
+ Unrecognised actuarial losses/(gains)
€th
0.00
0.00
0.00
0.00
+ Net debt at year end
€th
-4,299
-23,694
-26,670
-49,084
+ Leases debt equivalent
€th
0.00
0.00
0.00
0.00
- Financial fixed assets (fair value) & Others
€th
10,000
10,000
10,000
15,000
+ Minority interests (fair value)
€th
1,250
1,000
1,000
1,000
= Enterprise Value
€th
108,684
44,550
21,352
-4,062
May 3 2016
Copyright Alphavalue - 2016 – corporate.alphavalue.com
Page 20
ALPHAVALUE CORPORATE SERVICES
Europlasma
(Buy)
Alternative Power Sources / France
Financials
Per Share Data
Adjusted EPS (bfr gwill amort. & dil.)
Growth in EPS
€
%
12/14A
12/15E
12/16E
12/17E
-0.57
0.00
0.05
0.09
n/a
n/a
n/a
85.4
Reported EPS
€
-0.38
0.00
0.07
0.11
Net dividend per share
€
0.00
0.00
0.00
0.00
Free cash flow per share
€
-0.41
0.02
0.09
0.09
Operating cash flow per share
€
-0.31
0.05
0.15
0.16
Book value per share
€
0.24
0.46
0.57
0.96
Number of ordinary shares
Th
69,045
69,045
69,045
69,045
Number of equivalent ordinary shares (year end)
Th
69,045
69,045
69,045
69,045
Number of shares market cap.
Th
69,045
69,045
69,045
69,045
Treasury stock (year end)
Th
Number of shares net of treasury stock (year end)
Th
69,045
69,045
69,045
69,045
Number of common shares (average)
Th
42,773
69,045
69,045
69,045
28,900
28,900
43,360
Conversion of debt instruments into equity
Th
Settlement of cashable stock options
Th
Probable settlement of non mature stock options
Th
Other commitments to issue new shares
Th
Increase in shares outstanding (average)
Th
0.00
14,450
28,900
36,130
Number of diluted shares (average)
Th
42,773
83,495
97,945
105,175
Goodwill per share (diluted)
€
0.03
0.00
0.00
0.00
EPS after goodwill amortisation (diluted)
€
-0.61
0.00
0.05
0.09
EPS before goodwill amortisation (non-diluted)
€
-0.61
0.00
0.07
0.11
Actual payment
€
Payout ratio
%
0.00
0.00
0.00
0.00
Capital payout ratio (div +share buy back/net income)
%
0.00
0.00
0.00
May 3 2016
Copyright Alphavalue - 2016 – corporate.alphavalue.com
Page 21
ALPHAVALUE CORPORATE SERVICES
Europlasma
(Buy)
Alternative Power Sources / France
Financials
Funding - Liquidity
12/14A
12/15E
12/16E
12/17E
EBITDA
€th
-11,176
3,860
8,376
13,293
Funds from operations (FFO)
€th
-16,985
4,960
9,476
11,115
Ordinary shareholders' equity
€th
16,793
31,975
39,570
65,984
Gross debt
€th
13,000
11,000
10,000
4,000
4,000
o/w Less than 1 year - Gross debt
€th
8,000
3,000
3,000
o/w 1 to 5 year - Gross debt
€th
5,000
5,000
4,000
of which Y+2
€th
2,000
of which Y+3
€th
2,000
of which Y+4
€th
1,000
o/w Beyond 5 years - Gross debt
€th
3,000
3,000
+ Gross Cash
€th
17,299
34,694
36,670
53,084
= Net debt / (cash)
€th
-4,299
-23,694
-26,670
-49,084
Bank borrowings
€th
11,000
2,000
2,000
2,000
Financial leases liabilities
€th
0.00
0.00
Other financing
€th
2,000
9,000
8,000
2,000
Gearing (at book value)
%
34.1
-43.8
-63.6
-57.4
Adj. Net debt/EBITDA(R)
x
0.38
-6.14
-3.18
-3.69
Adjusted Gross Debt/EBITDA(R)
x
-1.70
4.40
2.15
1.05
Adj. gross debt/(Adj. gross debt+Equity)
%
53.1
34.7
31.3
17.5
Ebit cover
x
-7.64
2.40
-42.8
-91.9
FFO/Gross Debt
%
-89.5
29.2
52.6
79.4
FFO/Net debt
%
395
-20.9
-35.5
-22.6
FCF/Adj. gross debt (%)
%
-92.5
10.3
47.1
65.1
(Gross cash+ "cash" FCF+undrawn)/ST debt
x
-0.03
12.2
15.0
15.5
"Cash" FCF/ST debt
x
-1.90
0.59
2.83
2.28
ROE Analysis (Dupont's Breakdown)
12/14A
12/15E
12/16E
12/17E
Tax burden (Net income/pretax pre excp income)
x
1.01
1.00
1.13
0.82
EBIT margin (EBIT/sales)
%
-254
-1.34
7.48
11.1
Assets rotation (Sales/Avg assets)
%
28.7
63.3
193
227
Financial leverage (Avg assets /Avg equity)
x
3.27
1.16
0.83
0.69
ROE
%
-270
-0.57
13.9
14.4
ROA
%
-270
-2.31
35.6
65.7
12/14A
12/15E
12/16E
12/17E
Shareholder's Equity Review (Group Share)
€th
1,632
16,730
31,975
39,570
+ Net profit of year
Y-1 shareholders' equity
€th
-25,902
-140
4,961
7,600
- Dividends (parent cy)
€th
0.00
0.00
0.00
0.00
+ Additions to equity
€th
25,000
23,137
0.00
18,799
€th
0.00
0.00
0.00
0.00
- Unrecognised actuarial gains/(losses)
o/w reduction (addition) to treasury shares
€th
0.00
0.00
0.00
0.00
+ Comprehensive income recognition
€th
16,000
-7,752
2,634
15.0
= Year end shareholders' equity
€th
16,730
31,975
39,570
65,984
May 3 2016
Copyright Alphavalue - 2016 – corporate.alphavalue.com
Page 22
ALPHAVALUE CORPORATE SERVICES
Europlasma
(Buy)
Alternative Power Sources / France
Financials
Staffing Analytics
12/14A
12/15E
12/16E
Sales per staff
€th
101
188
572
753
Staff costs per employee
€th
-72.3
-72.3
-72.3
-72.3
Change in staff costs
%
18.2
6.74
5.26
10.0
Change in unit cost of staff
%
10.2
0.00
0.00
0.00
Staff costs/(EBITDA+Staff costs)
%
-136
64.0
46.3
37.4
Average workforce
unit
89.0
95.0
100
110
Europe
unit
90.0
95.0
100
110
North America
unit
0.00
0.00
0.00
0.00
South Americas
unit
0.00
0.00
0.00
0.00
Asia
unit
0.00
0.00
0.00
0.00
Other key countries
unit
0.00
0.00
0.00
0.00
Total staff costs
€th
-6,437
-6,871
-7,233
-7,956
Wages and salaries
€th
-6,437
-6,871
-7,233
-7,956
€th
-2,472
-2,500
-2,700
-3,000
0.00
0.00
0.00
12/14A
12/15E
12/16E
12/17E
of which social security contributions
Equity linked payments
€th
Pension related costs
€th
Divisional Breakdown Of Revenues
12/17E
Engineering, Torch (Europlasma)
€th
117
2,000
4,000
8,000
Renewable Energy (CHO-POWER)
€th
-596 (1)
3,900 (1)
40,173
61,285
Toxic Waste Management (Inertam)
€th
9,461
12,000
13,000
13,500
Air & Gaz (Europe Environnement)
€th
0.00
0.00
0.00
0.00
Other
€th
0.00
0.00
0.00
0.00
Total sales
€th
8,982
17,900
57,173
82,785
12/14A
12/15E
12/16E
12/17E
Divisional Breakdown Of Earnings
1. Construction and subsequent
operation
of
the
energy
production sites
Operating result Analysis
Holding, R&D, Engineering, Torch (Europlasma)
€th
-5,478
200
1,000
1,600
Renewable Energy (CHO-POWER)
€th
-14,358
-1,140
1,976
5,893
Toxic Waste Management (Inertam)
€th
-3,094
700
1,300
1,700
Air & Gaz (Europe Environnement)
€th
0.00
0.00
0.00
0.00
Other/cancellations
€th
-10.0
0.00
0.00
0.00
Total
€th
-22,940
-240
4,276
9,193
Operating result margin
%
ns
-1.34
7.48
11.1
12/16E
12/17E
Revenue Breakdown By Country
12/14A
12/15E
Europe
%
100
97.0
Americas
%
0.00
1.00
Asia
%
0.00
2.00
Other
%
0.00
0.00
May 3 2016
Copyright Alphavalue - 2016 – corporate.alphavalue.com
Page 23
ALPHAVALUE CORPORATE SERVICES
Europlasma
(Buy)
Alternative Power Sources / France
Financials
Capital Employed
12/14A
12/15E
12/16E
12/17E
ROCE (NOPAT+lease exp.*(1-tax))/(net) cap employed adjusted
%
-123
-1.17
17.9
27.0
Goodwill
€th
1,316
1,316
2,000
2,000
€th
0.00
0.00
0.00
0.00
€th
1,065
1,065
2,000
3,000
Accumulated goodwill amortisation
All intangible assets
€th
0.00
0.00
0.00
0.00
Financial hedges (LT derivatives)
Accumulated intangible amortisation
€th
0.00
0.00
0.00
0.00
Capitalised R&D
€th
0.00
0.00
0.00
0.00
PV of non-capitalised lease obligations
€th
0.00
0.00
0.00
0.00
Other fixed assets
€th
12,287
13,000
14,000
15,000
€th
0.00
0.00
0.00
0.00
Capital employed before depreciation
Accumulated depreciation
€th
12,151
14,381
20,000
26,000
WCR
€th
-6,202
-5,000
-6,000
-6,000
Other assets
€th
3,685
4,000
8,000
12,000
Unrecognised actuarial losses/(gains)
€th
0.00
0.00
0.00
0.00
Capital employed after deprec. (Invested capital)
€th
12,151
14,381
20,000
26,000
12/14A
12/15E
12/16E
12/17E
Divisional Breakdown Of Capital
Holding, R&D, Engineering, Torch (Europlasma)
€th
Renewable Energy (CHO-POWER)
€th
Toxic Waste Management (Inertam)
€th
Air & Gaz (Europe Environnement)
€th
Other
€th
12,151
14,381
20,000
26,000
Total capital employed
€th
12,151
14,381
20,000
26,000
May 3 2016
Copyright Alphavalue - 2016 – corporate.alphavalue.com
Page 24
ALPHAVALUE CORPORATE SERVICES
Europlasma
(Buy)
Alternative Power Sources / France
Pension Risks
Pension matters
Europlasma is a small company in terms of headcount. Actual engineering work is delivered by partners.
Summary Of Pension Risks
12/14A
12/15E
12/16E
0.00
0.00
0.00
0.00
€th
16,793
31,975
39,570
65,984
Pension ratio
%
Ordinary shareholders' equity
Total benefits provisions
12/17E
€th
0.00
0.00
0.00
0.00
of which funded pensions
€th
0.00
0.00
0.00
0.00
of which unfunded pensions
€th
0.00
0.00
0.00
0.00
of which benefits / health care
€th
0.00
0.00
0.00
Unrecognised actuarial (gains)/losses
€th
0.00
0.00
0.00
0.00
Company discount rate
%
4.60
4.60
4.60
4.60
Normalised recomputed discount rate
%
Company future salary increase
%
3.00
3.00
Normalised recomputed future salary increase
%
Company expected rate of return on plan assets
%
6.00
6.00
Normalised recomputed expd rate of return on plan assets
%
3.00
Funded : Impact of actuarial assumptions
€th
0.00
Unfunded : Impact of actuarial assumptions
€th
0.00
Geographic Breakdown Of Pension Liabilities
US exposure
%
UK exposure
%
Euro exposure
%
Nordic countries
%
Switzerland
%
Other
%
Total
%
Balance Sheet Implications
2.50
3.00
3.00
2.00
6.00
6.00
12/14A
12/15E
12/16E
12/17E
100
100
100
100
100
100
100
100
12/14A
12/15E
12/16E
12/17E
Funded status surplus / (deficit)
€th
0.00
0.00
0.00
0.00
Unfunded status surplus / (deficit)
€th
0.00
0.00
0.00
0.00
Total surplus / (deficit)
€th
0.00
0.00
0.00
0.00
Total unrecognised actuarial (gains)/losses
€th
0.00
0.00
0.00
0.00
Provision (B/S) on funded pension
€th
0.00
0.00
0.00
0.00
Provision (B/S) on unfunded pension
€th
0.00
0.00
0.00
0.00
Other benefits (health care) provision
€th
0.00
0.00
0.00
Total benefit provisions
€th
0.00
0.00
0.00
0.00
12/14A
12/15E
12/16E
12/17E
P&L Implications
Funded obligations periodic costs
€th
0.00
0.00
0.00
0.00
Unfunded obligations periodic costs
€th
0.00
0.00
0.00
0.00
Total periodic costs
€th
0.00
0.00
0.00
0.00
of which incl. in labour costs
€th
0.00
0.00
0.00
0.00
of which incl. in interest expenses
€th
0.00
0.00
0.00
0.00
May 3 2016
Copyright Alphavalue - 2016 – corporate.alphavalue.com
Page 25
ALPHAVALUE CORPORATE SERVICES
Europlasma
(Buy)
Alternative Power Sources / France
Pension Risks
Funded Obligations
12/14A
12/15E
12/16E
12/17E
0.00
0.00
0.00
0.00
€th
0.00
0.00
0.00
Interest expense
€th
0.00
0.00
0.00
Employees' contributions
€th
Impact of change in actuarial assumptions
€th
0.00
0.00
0.00
of which impact of change in discount rate
€th
0.00
of which impact of change in salary increase
€th
0.00
Balance beginning of period
€th
Current service cost
Changes to scope of consolidation
€th
Currency translation effects
€th
Pension payments
€th
Other
€th
Year end obligation
€th
Plan Assets
0.00
0.00
0.00
0.00
12/14A
12/15E
12/16E
12/17E
Value at beginning
€th
0.00
0.00
0.00
Company expected return on plan assets
€th
0.00
0.00
0.00
Actuarial gain /(loss)
€th
0.00
0.00
0.00
Employer's contribution
€th
0.00
0.00
0.00
0.00
Employees' contributions
€th
0.00
0.00
0.00
0.00
Changes to scope of consolidation
€th
Currency translation effects
€th
Pension payments
€th
0.00
0.00
0.00
0.00
Other
€th
Value end of period
€th
0.00
0.00
0.00
0.00
Actual and normalised future return on plan assets
€th
0.00
0.00
0.00
0.00
12/14A
12/15E
12/16E
12/17E
0.00
0.00
0.00
0.00
Unfunded Obligations
Balance beginning of period
€th
Current service cost
€th
0.00
0.00
0.00
Interest expense
€th
0.00
0.00
0.00
Employees' contributions
€th
Impact of change in actuarial assumptions
€th
0.00
0.00
0.00
of which Impact of change in discount rate
€th
0.00
of which Impact of change in salary increase
€th
0.00
0.00
0.00
Changes to scope of consolidation
€th
Currency translation effects
€th
Pension payments
€th
Other
€th
Year end obligation
€th
May 3 2016
0.00
0.00
Copyright Alphavalue - 2016 – corporate.alphavalue.com
Page 26
ALPHAVALUE CORPORATE SERVICES
Europlasma
(Buy)
Alternative Power Sources / France
Governance & Management
Governance parameters
Existing committees
Yes
Weighting
20%
/ No
One share, one vote
Audit / Governance Committee
Compensation committee
Chairman vs. Executive split
5%
Financial Statements Committee
Chairman not ex executive
5%
Litigation Committee
Independent directors equals or above 50% of total directors
Full disclosure on mgt pay (performance related bonuses, pensions and non
financial benefits)
Disclosure of performance anchor for bonus trigger
20%
Nomination Committee
Safety committee
10%
SRI / Environment
15%
Compensation committee reporting to board of directors
5%
Straightforward, clean by-laws
20%
Governance score
45
100%
Management
Name
Function
Birth date
Date in
Jean-Eric PETIT
M
CEO
Pierre CATLIN
M
Chairman
1949
2010
Laurence GERICOT
F
CFO
1965
2015
Date out
Compensation, in k€ (year)
Cash
Equity linked
2014
80.0 (2013)
44.0 (2013)
Fees / indemnity,
in k€ (year)
Value of holding,
in k€ (year)
Board of Directors
Pierre CATLIN
M
President/Chairman of th...
Completion
Birth
of current
date
mandate
2016
1949
Kim Ying LEE
M
Member
2014
Jean-Eric PETIT
M
Member
Name
Indep. Function
CREDIT SUISSE ASSET MA...
Date out
2010
0.00 (2013)
2008
38.0 (2013)
2014
Member
2018
Jean-Claude REBISCHUNG
M
Member
2018
François MARCHAL
M
Member
2017
May 3 2016
Date in
2014
1952
2006
0.00 (2013)
2011
60.0 (2013)
Copyright Alphavalue - 2016 – corporate.alphavalue.com
Page 27
ALPHAVALUE CORPORATE SERVICES
Europlasma
(Buy)
Alternative Power Sources / France
Governance & Management
Human Resources
Accidents at work
25% Of H.R. Score
Human resources development
35% Of H.R. Score
Pay
20% Of H.R. Score
Job satisfaction
10% Of H.R. Score
Internal communication
10% Of H.R. Score
HR Breakdown
Yes
Accidents at work
/ No
25%
Set targets for work safety on all group sites?
40%
Are accidents at work declining?
60%
Human resources development
35%
Rating
25/100
10/100
15/100
28/100
Are competences required to meet medium term targets identified?
10%
4/100
Is there a medium term (2 to 5 years) recruitment plan?
10%
0/100
Is there a training strategy tuned to the company objectives?
10%
4/100
Are employees trained for tomorrow's objectives?
10%
4/100
Can all employees have access to training?
10%
4/100
Has the corporate avoided large restructuring lay-offs over the last year to date?
10%
4/100
Have key competences stayed?
10%
4/100
Are managers given managerial objectives?
10%
4/100
If yes, are managerial results a deciding factor when assessing compensation level?
10%
4/100
Is mobility encouraged between operating units of the group?
10%
Pay
20%
Is there a compensation committee?
30%
Is employees' performance combining group performance AND individual performance?
70%
Job satisfaction
0/100
6/100
10%
6/100
0/100
10/100
Is there a measure of job satisfaction?
33%
3/100
Can anyone participate ?
34%
3/100
Are there action plans to prop up employees' morale?
33%
Internal communication
10%
Are strategy and objectives made available to every employee?
3/100
0/100
100%
Human Ressources score:
0/100
69/100
HR Score
H.R. Score : 6.9/10
May 3 2016
Capital Goods
Europlasma
Copyright Alphavalue - 2016 – corporate.alphavalue.com
Page 28
ALPHAVALUE CORPORATE SERVICES
Europlasma
(Buy)
Alternative Power Sources / France
Graphics
Momentum
: Strong momentum corresponding to a continuous and overall positive moving average trend confirmed by volumes
: Relatively good momentum corresponding to a positively-oriented moving average, but offset by an overbought pattern or lack of confirmation
from volumes
: Relatively unfavorable momentum with a neutral or negative moving average trend, but offset by an oversold pattern or lack of confirmation from
volumes
: Strongly negative momentum corresponding to a continuous and overall negative moving average trend confirmed by volumes
Momentum analysis consists in evaluating the stock market trend of a given financial instrument, based on the analysis of its trading flows.
The main indicators used in our momentum tool are simple moving averages over three time frames: short term (20 trading days), medium term (50 days)
and long term (150 days). The positioning of these moving averages relative to each other gives us the direction of the flows over these time frames.
For example, if the short and medium-term moving averages are above the long-term moving average, this suggests an uptrend which will need to be
confirmed. Attention is also paid to the latest stock price relative to the three moving averages (advance indicator) as well as to the trend in these three
moving averages - downtrend, neutral, uptrend - which is more of a lagging indicator.
The trend indications derived from the flows through moving averages and stock prices must be confirmed against trading volumes in order to confirm the
signal. This is provided by a calculation based on the average increase in volumes over ten weeks together with a buy/sell volume ratio.
May 3 2016
Copyright Alphavalue - 2016 – corporate.alphavalue.com
Page 29
ALPHAVALUE CORPORATE SERVICES
Europlasma
(Buy)
Alternative Power Sources / France
Graphics
Moving Average MACD & Volume
May 3 2016
Copyright Alphavalue - 2016 – corporate.alphavalue.com
Page 30
ALPHAVALUE CORPORATE SERVICES
Europlasma
(Buy)
Alternative Power Sources / France
Graphics
€/$ sensitivity
Sector Capital Goods
May 3 2016
Copyright Alphavalue - 2016 – corporate.alphavalue.com
Page 31
ALPHAVALUE CORPORATE SERVICES
Europlasma
(Buy)
Alternative Power Sources / France
Methodology
May 3 2016
Copyright Alphavalue - 2016 – corporate.alphavalue.com
Page 32
ALPHAVALUE CORPORATE SERVICES
Europlasma
(Buy)
Alternative Power Sources / France
Methodology
Fundamental Opinion
It is implicit that recommendations are made in good faith but should not be regarded as the sole source of advice.
Recommendations are geared to a “value” approach.
Valuations are computed from the point of view of a secondary market minority holder looking at a medium term (say 6 months) performance.
Valuation tools are built around the concepts of transparency, all underlying figures are accessible, and consistency, same methodology whichever the
stock, allowing for differences in nature between financial and non financial stocks. A stock with a target price below its current price should not and will not
be regarded as an Add or a Buy.
Recommendations are based on target prices with no allowance for dividend returns. The thresholds for the four recommendation levels may change from
time to time depending on market conditions. Thresholds are defined as follows, ASSUMING long risk free rates remain in the 2-5% region.
Buy
Low Volatility
Normal Volatility
High Volatility
(10-30)
(15-35)
(above 35)
More than 15% upsideMore than 20% upsideMore than 30% upside
Add
From 5% to 15%
From 5% to 20%
From 10% to 30%
Reduce
From -10% to 5%
From -10% to 5%
From -10% to 10%
Sell
Below -10%
Below -10%
Below -10%
Recommendation
There is deliberately no “neutral” recommendation. The principle is that there is no point investing in equities if the return is not at least the risk free rate (and
the dividend yield which again is not allowed for).
Although recommendations are automated (a function of the target price whenever a new equity research report is released), the management of AlphaValue
intends to maintain global consistency within its universe coverage and may, from time to time, decide to change global parameters which may affect the
level of recommendation definitions and /or the distribution of recommendations within the four levels above. For instance, lowering the risk premium in a
gloomy context may increase the proportion of positive recommendations.
Valuation
Valuation processes have been organized around transparency and consistency as primary objectives.
Stocks belong to different categories that recognise their main operating features : Banks, Insurers and Non Financials.
Within those three universes, the valuation techniques are the same and in relation to the financial data available.
The weighting given to individual valuation techniques is managed centrally and may be changed from time to time. As a rule, all stocks of a similar profile
are valued using equivalent weighting of the various valuation techniques. This is for obvious consistency reasons.
Within the very large universe of Non Financials, there are in effect 4 sub-categories of weightings to cater for subsets: 1) 'Mainstream' stocks; 2) 'Holding
companies' where the stress is on NAV measures; 3) 'Growth' companies where the stress is on peer based valuations; 4) 'Loss making sectors' where
peers review is essentially pointing nowhere. The bulk of the valuation is then built on DCF and NAV, in effect pushing back the time horizon.
Valuation Issue
Normal
Growth
industrials industrials
Holding Loss
company runners
Bank
Insurers
DCF
35%
35%
10%
40%
0%
0%
NAV
20%
20%
55%
40%
25%
15%
PE
10%
10%
10%
5%
10%
20%
EV/EBITDA
20%
20%
0%
5%
0%
0%
Yield
10%
10%
20%
5%
15%
15%
P/Book
5%
5%
5%
5%
15%
10%
Banks' instrinsic method
0%
0%
0%
0%
25%
0%
Embedded Value
0%
0%
0%
0%
0%
40%
Mkt Cap/Gross Operating Profit
0%
0%
0%
0%
10%
0%
Typical sectors
Bio Techs
May 3 2016
Copyright Alphavalue - 2016 – corporate.alphavalue.com
Page 33
© Copyright 2026 Paperzz