Paper
zz
Explore Categories
Log in
Create new account
No category
特集:中国における地域発展戦略の動向とその実態
Download
Report
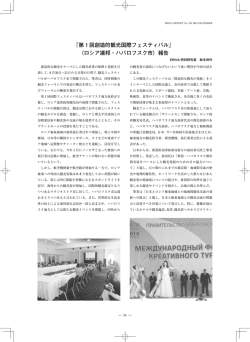
第1回創造的観光国際フェスティバル」(ロシア連邦・ハバロフスク市)報告
分科会B ポスト京都議定書時代の環境・エネルギー協力
ロシア極東の観光振興へ向けて
基調講演「エネルギー・気候安全保障と北東アジアの地域協力」
「2015 北東アジア経済発展国際会議イン新潟」を開催します
イルクーツク、ノボシビリスクの調査に参加して
「第 2 回国際欧州アジア輸送会議」及び「第 5 回
立ち上げ準備中のトヨタのロシア・サンクトペテルブルグ工場を訪ねて
北極圏の資源開発と航路利用に関する一般情報
基調講演「北東アジアの歴史と平和的発展」
© Copyright 2026 Paperzz
About Paperzz
DMCA / GDPR
Report