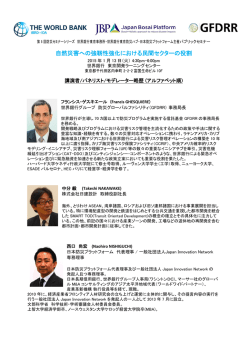
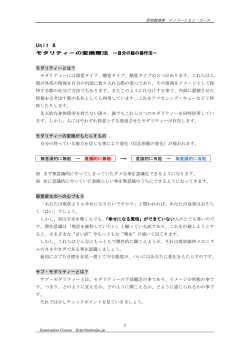
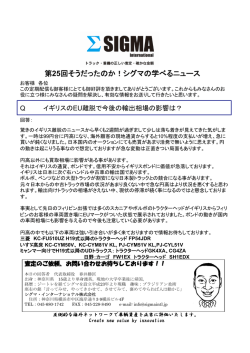
DISCUSSION PAPER No.137
研究開発活動における組織・人事マネジメントが
イノベーションに与える影響
The Effect of Organizational and
Human Resource Management on Innovation
2016 年 6 月
文部科学省 科学技術・学術政策研究所
第 1 研究グループ
羽田 尚子
伊藤 恵子
本 DISCUSSION PAPER は、所内での討論に用いるとともに、関係の方々からの御意見を頂く
ことを目的に作成したものである。
また、本 DISCUSSION PAPER の内容は、執筆者の見解に基づいてまとめられたものであり、
必ずしも機関の公式の見解を示すものではないことに留意されたい。
The DISCUSSION PAPER series is published for discussion within the National Institute
of Science and Technology Policy (NISTEP) as well as receiving comments from the
community.
It should be noticed that the opinions in this DISCUSSION PAPER are the sole
responsibility of the author(s) and do not necessarily reflect the official views of NISTEP.
【執筆者】
羽田 尚子
伊藤 恵子
中央大学商学部 准教授
文部科学省科学技術・学術政策研究所 客員研究官
専修大学経済学部 教授
文部科学省科学技術・学術政策研究所 客員研究官
【Authors】
Shoko HANEDA Associate Professor, Faculty of Commerce, Chuo University
Affiliated Fellow, National Institute of Science and Technology Policy
(NISTEP), MEXT
Keiko ITO
Professor, School of Economics, Senshu University
Affiliated Fellow, National Institute of Science and Technology Policy
(NISTEP), MEXT
本報告書の引用を行う際には、以下を参考に出典を明記願います。
Please specify reference as the following example when citing this paper.
羽田尚子・伊藤恵子 (2016) 「研究開発活動における組織・人事マネジメントがイノベーションに
与える影響」,NISTEP DISCUSSION PAPER,No.137,文部科学省科学技術・学術政策研究
所.
DOI: http://doi.org/10.15108/dp137
Haneda, Shoko and Ito, Keiko (2016) “The Effect of Organizational and Human Resource
Management on Innovation,” NISTEP DISCUSSION PAPER, No.137, National Institute of
Science and Technology Policy, Tokyo.
DOI: http://doi.org/10.15108/dp137
研究開発活動における組織・人事マネジメントがイノベーションに与える影響
文部科学省 科学技術・学術政策研究所 第 1 研究グループ
要旨
本研究は、文部 科学省 科学技術・学術政策 研究 所「全国イノベーション調査」の企業個票デー
タを利用して、研究開発組織に対するさまざまなマネジメントがイノベーションの成果に与える影響
を定量的に分析するものである。特に、プロダクト・イノベーションの実現に対して、研究開発組織の
マネジメントや研究開発部門の人事管理が与える影響に焦点を当てる。分析の結果、部門間連携、
部門間での会議や情報交換、成果を反映した人事・評価、研究開発部門の新設・移転・統合が、
プロダクトおよびプロセス・イノベーションの実現確率を高めていることが示された。また、研究開発
部門出身の役員の登用はプロダクト・イノベーションの実現にプラスに作用しており、新しいプロダク
トの開発において、研究開発に関するトップダウンの意思決定が重要である可能性を示唆している。
プロダクト・イノベーションの実現に対して、とりわけ大きなインパクトをもつ組織マネジメントの手法は、
研究開発成果に連動した人事評価の実施、研究開発組織の新設・移転・統合であった。これらの
結果から、研究者に対して比較的長期にわたるインセンティブを付与する人事・評価システムを採
用し、企業戦略に合致した研究開発組織の再編まで手掛ける組織マネジメントこそが、効率的にイ
ノベーションを推進するためには重要であると推測される。
The Effect of Organizational and Human Resource Management on Innovation
1st Theory-Oriented Research Group, National Institute of Science and Technology Policy
(NISTEP), MEXT
ABSTRACT
We examine the determinants of firms’ innovation success, using the firm-level data
underlying the Japanese National Innovation Survey. We focus on the effect of organizational and
human resource management within a firm on product innovation. We find that interdivisional
cooperation/teams, interdivisional meetings/systems, personnel assessment reflecting research and
development (R&D) outcomes, and the creation/relocation/integration of R&D centers positively
affect both product and process innovation. Having board members with an R&D background
positively affects product innovation, implying that top-down R&D decision-making may be
important for firms to innovate new products. In particular, our results show that the
creation/relocation/integration of R&D centers has the largest impact on innovation success,
suggesting that drastic organizational changes can work as a clear signal of firms’ determination to
pursue an innovation-oriented strategy and help to accelerate innovation success.
概要
1. 研究の背景と目的
企業がイノベーション活動を進めるには、イノベーションを実現することができるのか、そしてそれ
が市場に受け入れられるかという意味での不確実性を引き受けなければならない。一方で、イノベ
ーションを生み出すためには、研究開発活動に一定の時間や費用を投じなくてはならない。このた
め、不確実性を和らげ、効率的に研究開発活動を行うための組織マネジメントの重要性が論じられ
てきた。例えば、部門間連携の促進、研究開発のための人事・評価、あるいは研究開発組織の改
編・再編は、組織内での情報のスピルオーバーの促進、イノベーション創出のインセンティブの向上、
規模の経済・範囲の経済の創造に奏功するものと考えられてきた(Teece 1996)。
組織マネジメントとイノベーション活動にはなんらかの相互作用が働いていると考えられ、数多く
の先行研究によりその検証が試みられてきた。例えば、中央集権的な組織マネジメントを行ってい
る企業では引用件数の多い特許が生み出されている(Lerner and Wulf 2007)。また、比較的長期
にわたって発明に対するインセンティブを付与する人事・評価制度の有効性や発明報奨制度のよ
うな外発 的インセンティブを付与する人事 ・評価 制 度の有効性も、特 許の引 用数を用いた先 行研
究から示されている(例えば Nagaoka et al. 2014; Stern 2004)。
ただし、イノベーションに関連する研究では多くの場合、イノベーション活動の成果を測定するこ
とが難しい。先行研 究では特許の取得件 数や引 用数をイノベーションの成果を表す変数として用
いているが、Azoulay and Lerner (2013) が指摘するように、市場での成果を反映したものとはいえ
ない。Kanama and Nishikawa (2015) はイノベーションの成果としてイノベーションの有無だけでな
く重要度を考慮した変数を用いた数少ない研究であるが、研究の対象は日本の製造業であり、外
発的および内発的インセンティブといった人事・評価制度に焦点を当てている。
これらの国内外の先行研究から、組織マネジメントを実施している企業はイノベーションの成功確
率が高いことが示唆される。しかし、その多くはサンプルサイズが小さく有効なマネジメント手法を詳
細に示すに至っていない。イノベーションの成果として特許数や引用数を使っているが、それは必
ずしも市場での成果を表すものではないため、イノベーションの実現やイノベーションの成果の重要
度の面で組織マネジメントが作用するのか、そのインパクトはどれくらいなのか、まだ十分に解明 さ
れていない疑問は多い。
本研究では、文部科学省科学技術・学術政策研究所「全国イノベーション調査」の企業個票デ
ータを利用して、研究開発組織に対するさまざまなマネジメントがイノベーションの成果に与える影
響を定量的に分析するものである。「全国イノベーション調査」には、各企業 が研究開発推進のた
めに実施した施策に関する情報、プロダクトまたはプロセス・イノベーションの有無、競合他社が同
様のプロダクト・イノベーションを実現するのに要すると推測される年数といった、イノベーションの頻
度や成果の大きさに関する情報が含まれている。これらの情報は、通常の企業財務データでは得
られないものであり、日本企業の研究開発組織マネジメントとイノベーション活動との間に何等かの
関連性があるのか、大規模なサンプルを用いて詳細に分析した実証研究となっている。
2. 利用したデータ
本研究では「全国イノベーション調査」の個票データを利用している。本調査は、イノベーション活
動を測定・分 析する際の標準的なガイドラインであるオスロ・マニュアルに準拠して実施 されたもの
である。欧州諸国で定期的に実施されている Community Innovation Survey (CIS)にも対応しうる
調査と解釈することもできる。前述したように「全国イノベーション調査」では、プロダクトおよびプロセ
i
ス・イノベーションの実現といったイノベーションの有無のみならず、キャッチアップタイム、新プロダク
トの売上比率 、市 場シェアの拡大の程度といったイノベーションの重要度を企業が回答 している。
特許データには、プロダクトやプロセスとして結実するかわからない技術情報が含まれているが、イノ
ベーション調査の情報はプロダクトやプロセスとして実現された技術情報である。特許とは異なる情
報からイノベーションの成果を把握できる点で調査データを活用する利点がある。研究開発活動を
行うために実施した方法に関する設問は、同調査の第 2 回調査(以下 2009 年調査と記す)におい
てのみ実施されており、本研究では研究開発のための組織マネジメントに焦点をあてていることから
2009 年調査を利用している。データの信頼性を確保するため、基礎的な情報である売上高を回答
していない企業は分析対象から除外した。その結果、本研究の分析対象は 3,837 社(製造業 1,587
社、非製造業 2,248 社)となった。
3. 分析方法
本研究は、イノベーションの実現、さらにはより質の高い重要なイノベーション(本研究では、競合
他社が技術的に同等なイノベーションを実現するためにかかる期間が長いほど、より質の高い重要
なイノベーションであると解釈している。競合他 社 のキャッチアップに時間がかかるほど、自社の市
場における技術的優位性を保持できる期間は長くなるからである)を実現するために、どのような組
織マネジメントが有効であるかを分析するものである。まず、各マネジメント項目を「部門間連携の促
進」、「人事・評価」、「組織の改編・再編」という 3 つのタイプに分類し、これら 3 つのタイプのマネジ
メントの実施状況を概観する。そして、これら 3 つのマネジメントを実施する企業において、よりイノベ
ーション実現の確率が高いかどうかを検証し、さらに 3 つのマネジメントの間に補完性があるかどうか
を検証する。
分析の後半では、上記の 3 つのマネジメントについて、さらに詳細な項目ごとに、イノベーション
実現と組織マネジメントの関連を検証する。より具体的には、「部門間連携の促進」に関しては、①
従業員の部門間ローテーションの実施・部門横断的なプロジェクトチームの結成、②部門間での会
議・情報を蓄積、交換、共有するシステムの導入を実施したか否かを考慮する。次に「人事・評価」
に関しては、③研究開発部門出身の取締役、④研究開発の成果を反映した人事評価、⑤職務発
明報奨制度、⑥定年退職した研究者・技術者の再雇用が該当する。最後に「組織の改編・再編」
に関しては、⑦研究開発拠点の新設/移転/統合/改組、⑧研究者の権限拡大が含まれる。
以上のように、プロダクト・イノベーションまたはプロセス・イノベーションの実現確率とさまざまな研究
開発組織におけるマネジメントの実施との関連性を検証するため、イノベーションの実現の決定要
因をプロビットモデルを用いて推定する。
さらに、より質の高い重要なイノベーションの実現については、特にプロダクト・イノベーションに注
目し、競合他社が技術的に同等なイノベーションを実現するためにかかる期間を被説明変数とした
インターバル・リグレッションという推定方法を用いる。そして、重要なイノベーションの実現には、特
にどのような組織マネジメントが効果的であるのかを検証する。ただし、データの制約により両者の
因果関係を厳密に検証することはできず、関連性を統計的に分析するにとどまっている。このため
結果の解釈には注意を要する。
ii
概要図表 1: イノベーションの実現に組織マネジメントが与えるインパクト(タイプ
別の組合せ)
プロダクト・イノベーションの実現
プロセス・イノベーションの実現
0.5
0.4
0.3
0.2
0.1
0
部門間連携
部門間連携
+人事評価
部門間連携
+組織改編
部門間連携
+人事評価+組織改編
注:縦軸は本文の Table 2 の限界効果。
4. 分析結果
まず、研究開発組織マネジメントの 3 つのタイプ別に実施状況を見てみると、半数以上の企業が、
プロダクト・イノベーションの実現の有無にかかわらず、少なくとも 1 つのタイプのマネジメントを実施
している。「部門間連携の促進」は多くの企業が実施しており、イノベーション実現企業の 80%、非
実現企業の 41%で行われていた。3 つのタイプ全てを実施している企業は、イノベーション実現企
業の 28%を占めており、各タイプのマネジメントの間に何らかの相互作用が働いているのかもしれな
い(本文の Table 1 を参照のこと)。
これを確認すべく、組織マネジメントの 3 タイプの補完性の検証を行う。本文の Table 2 に基づき、
プロダクト・イノベーション、プロセス・イノベーション双方に与えるインパクトの大きさを概要図表 1 で
示した。部門間 連携のみ実施、部門 間連携+人 事 ・評価の実施、部門 間連 携+組織の改編・再
編の実施、および部門間連携+人事・評価+組織の改編・再編の実施は、正で有意な限界効果
をもっている。各タイプの組み合わせが与えるインパクトの大きさは、部門間連携の促進を実施する
と、何も実施しなかった時と比べてプロダクト・イノベーションの実現確率が 9 ポイント上昇する。さら
に人事・評価制度もあわせて実施すると、何も実施しなかった時と比べ、実現の確率は 24 ポイント
上昇する。これは部門間連携の促進のみを実施した時の約 2.6 倍である.また、人事・評価制度の
替りに組織の改編・再編を実施した場合、部門間連携の促進のみを実施していた時と比べて、プロ
ダクト・イノベーションを実現する確率は約 3.5 倍になる。更に人事・評価制度も加え 3 タイプ全てを
実施した場合、プロダクト・イノベーションの実現確率は 37 ポイント上昇する。これは人事・評価制度
を加えなかった時と比べて 1.2 倍実現しやすくなることを意味する.概要図表 1 の 4 つの組み合わ
せにおける推定係数の差異は、検定により確認することができた。3 つのタイプのマネジメントの間
に補完性があるかどうかを統計的に検定してみたが、厳密な補完性を見出すことはできなかった。
iii
概要図表 2:イノベーションの実現に組織マネジメントが与えるインパクト(方法別)
プロダクト・イノベーションの実現
プロセス・イノベーションの実現
①従業員の部門間ローテーション
②部門間での会議・情報蓄積
③研究開発部門出身役員
④研究開発成果を反映した人事評価
⑤職務発明報奨制度
⑥退職研究者の再雇用
⑦研究開発部門新設・移転・統合
⑧研究者の権限拡大
-0.1
-0.05
0
0.05
0.1
0.15
0.2
注:横軸は本文の Table 4 の限界効果。斜線は統計的に有意でなかった方法。
次に、各マネジメントのタイプの中の詳細な項目である①~⑧の組織マネジメントの方法が、イノ
ベーションの実現や成果に与えるインパクトの大きさを明示する。イノベーションを実現した企業とそ
うでない企業とでは、人事・評価に該当する③~⑥の方法で顕著な違いがある。イノベーションを実
現した企業では、④研究開発の成果を反映した評価、⑤職務発明報奨制度、⑥定年退職となった
研究者・技術者の再雇用の 3 つの方法を実施している企業数が比較的多い。イノベーションを実
現しなかった企業では、なかでも⑥を実施した企業が相対的に多くみられる。一方、組織マネジメン
トの手法として④を採用した企業数は大幅に少なく、イノベーションを実現した企業とは対照的な結
果になっている。組織の改編・再編の取り組みでは、⑦研究開発拠点の新設/移転/統合/改
組を組織マネジメントの方法として実施する企業が多いことに気づく。これは 3 つのマネジメントタイ
プ別の分析からはわからなかったことであり、イノベーションを実現した企業では、⑦が⑤、④および
③と同等に実施され、イノベーションの実現のための重要な方法の 1 つとなっていると推察できる
(本文の Table 3 を参照のこと)。
それぞれの組織マネジメントの方法が、プロダクト・イノベーション、プロセス・イノベーションに与え
るインパクトの大きさを、本文の Table 4 に基づき、概要図表 2 の棒グラフで図示している(斜線は統
計的に有意ではなかった方法である)。いくつかの方法は、プロダクト・イノベーションおよびプロセ
ス・イノベーションの実現確率を有意に高める要因となっている。一方、プロダクト・イノベーションと
プロセス・イノベーションに異なる作用を及ぼす要因もある。①従業員の部門間ローテーションの実
施・部門横断的なプロジェクトチームの結成、④研究開発の成果を反映した人事評価、⑦研究開
発部門の新設/移転/統合/改組はプロダクト、プロセスに対し、正で有意な限界効果を持って
iv
いる。棒グラフの高さは効果の大きさを表しており、④および⑦はプロダクト・イノベーションに対して
より強く働き、①はプロセス・イノベーションに対してより大きなインパクトをもたらす。すなわち、プロダ
クト・イノベーションの実現確率を高めるためには、人事評価や研究開発組織の再編がより重要で
ある一方、部門を横断した情報のやり取りがプロセス・イノベーションの実現にはより大きなインパクト
を持つことを意味している。③研究開発部門出身の取締役は、プロダクト・イノベーションの実現に
正で有意なインパクトを与え、③を 1 人増やすことで、プロダクト・イノベーションの実現確率を約 10
ポイント上昇させている。研究開発は不確実 性が伴う投資であり、研究開 発に精通したトップが組
織運営において采配を振るうことが、新プロダクトの成功の確率を高めていると推測する。②部門間
での会議・情 報蓄 積 、交 換、共 有システムの導入 、⑤職務 発明 報 奨制 度 、⑧研究 者の権 限 拡大
はプロセス・イノベーションにおいてのみ有意な限界効果を持っている。②は、プロセス・イノベーシ
ョンの実現に①と同等のインパクトを与え、プロセス・イノベーションにおける情報共有の重要性をう
かがうことができる。⑧は研究開発に対する内発的動機付けとしてプロセス・イノベーションの実現に
プラスに作用するものと解釈できるが、⑤の外発的動機付けは、プロセス・イノベーションの実現に
むしろマイナスの影響を与えており、日本 企業における研究者の動機付けの手法として④研究開
発の成果を反映した人事評価の方が、組織マネジメントの手法として機能していることがうかがえる。
また、⑦研究開発部門の再編は、特に新プロダクトを生み出すことにおいて、人事評価と比肩する
効果をもっている。組織を適宜見直し、新プロダクトを生み出す過程において必要な設備や人材を
速やかに配置しなおすことが、新プロダクトを創出する確率を高めていると考えられる。
最後に、より重要なイノベーションの実現についてみてみる。本論文 Table 5 を基に、重要なイノ
ベーションを実現するのに有効な方法を概要図表 3 に示した。①従業員の部門間ローテーションの
実施・部門横断的なプロジェクトチームの結成、③研究開発部門出身の取締役、④研究開発の成
果を反映した人事評価、⑦研究開発部門の再編の 4 つの項目の実施が統計的に有意な効果を持
ち、①、③、④、⑦の中では相対的に④が大きな値を持っている。価値ある重要なイノベーションを
実現するためには、研究開発の成果を反映した人事評価が重要であることを示唆している。
v
概要図表 3:組織マネジメントが価値あるイノベーションに与えるインパクト
価値あるイノベーションの実現
①従業員の部門間
ローテーション
③研究開発部門
出身役員
④研究開発成果を
反映した人事評価
⑦研究開発部門
新設・移転・統合
0
0.1
0.2
0.3
0.4
0.5
注:横軸は本文の Table 5 の限界効果。
5. 結論と政策的含意
本研究の分析結果から、まず、組織マネジメントを実施している企業は、イノベーションを実現し
やすいことが確認された。組織マネジメントの 3 タイプの分析から、3 つのタイプに補完性は確認でき
なかったが、部門間連携の促進を実施している企業が、他のタイプのマネジメントを追加的に実施
していくことによりプロダクト・イノベーションをより実現しやすくなる傾向がみられた。そして 3 つのタイ
プに含まれている詳細な項目の分析から、従業 員 の部門間ローテーションの実施、成果を反映 し
た人事・評価、研究開発部門の再編の 3 つの方法が、プロダクトおよびプロセス・イノベーションの
実現確率を高めることが示された。プロダクトとプロセスには異なる影響を与える項目もあり、研究開
発部門出身の役員の登用はプロダクト・イノベーションの実現にプラスに作用していた。イノベーショ
ンを実現したか否かだけではなく、イノベーションの成果の大きさ(キャッチアップタイム)でみた場合
でも、同じ方法が正で有意なインパクトを持っていた。プロダクト・イノベーションの実現に対して、と
りわけ大きなインパクトをもつ組織マネジメントの手法は、研究 開発成 果に連動した人事評 価の実
施、研究開発組織の再編であった。これらの結果は、プロダクト・イノベーションをより実現しやすく、
さらには重要なプロダクトまで実現しやすくするという点では、3 つのタイプを組み合わせて組織を管
理することが重要であることを示唆している。すなわち、情報を共有できる組織のもとで、研究者に
対して比較的長期にわたるインセンティブを付与する人事・評価システムを採用し、企業戦略に合
致した研究開発組織の統廃合まで手掛ける組織マネジメントこそが、効率的にイノベーションを推
進するためには重要であると推測される。
最後に残 された課題と今 後の展望について簡潔に述べる。本研 究の結果 から、プロダクト・イノ
ベーションの実現確率を高めるという点では、発明報奨制度のような外発的 動機付けよりも、成 果
vi
に連動した人事・評価制度のような内発的動機付けに働きかける方法を採用する方がより大きな効
果を発揮することがわかった。しかし、そのインセンティブの構造を厳密に分析するには至っていな
い。成果に連動した人事・評価制度によりどれだけの収入増あるいは昇進があるのか、発明に対し
て報奨金の額がどのように決まっているのかなど、両者間の相対的なバランスに依存しているため、
成果に連動した評価が、必ずしも内発的動機付けに働きかけるものとなっていないのかもしれない。
研究開発組織の再編に関しても、現在の組織が以前の組織とどのように変わったのか、具体的な
あ改編の中身を知ることはできない。本研究のような統計分析に加え、定性的なケーススタディやア
ンケート調査などを組み合わせたより詳細な分析が必要である。
また、本研究の分析結果はイノベーションと組織マネジメントの因果関係を示唆するものではある
が、本研究で用いた分析枠組みでは、両者間の因果関係に対して明快な解答を得ることはできな
い。すなわち、イノベーションに成功している企業であるから、効率的な研究開発組織の実現に向
けたさまざまな取 り組みを積極 的に実 施する必 要があるのか判別することはできない。この意 味で
本研究の分析結果の解釈には注意が必要であり、組織マネジメントの動機について理解を深める
ためには、因果関係の検証がもとめられる。
これらの課題については、本研究で用いた 2009 年調査だけでは分析できない部分も多い。たと
えば欧州諸国では、CIS 調査結果の蓄積が進み、企業レベルのパネル・データ化や他のデータベ
ースと接合したデータの分析なども進展している。日本においても、調査データの蓄積とその積極
的な分析・活用を通じて、日本企業がより効率的にイノベーションを実現し、イノベーションからより
大きな成果を獲得するための政策立案・環境整備につなげていくことが望まれる。
参考文献
Azoulay, Pierre, and Josh Lerner (2013) “Technological Innovation and Organizations,” in Robert
Gibbons and John Roberts (eds.), The Handbook of Organizational Economics, Princeton
University Press: Princeton, NJ; 575-603.
Kanama, Daisuke and Kohei Nishikawa (2015) “Does an Extrinsic Reward for R&D Employees
Enhance Innovation Outcomes? Evidence from A Japanese Innovation Survey,” R&D
Management,forthcoming. DOI:10.1111/radm.12165
Lerner, Josh, and Julie Wulf (2007) “Innovation and Incentives: Evidence from Corporate R&D,”
Review of Economics and Statistics 89 (4): 634-644.
Nagaoka, Sadao, Hideo Owan, and Koichiro Onishi (2014) “Incentive Design for Inventors:
Theory and Empirical Evidence,” RIETI Discussion Paper 14-J-044, September, Research
Institute of Economy, Trade and Industry, (in Japanese).
Stern, Scott (2004) “Do Scientists Pay to Be Scientists?” Management Science 50 (6): 835-853.
Teece, David J. (1996) “Firm Organization, Industrial Structure, and Technological Innovation,”
Journal of Economic Behavior and Organization 31 (2): 193-224.
vii
本文
1. Introduction
Innovation has long been recognized as the most important source of economic
development and firms’ growth (Schumpeter 1934; Penrose 1959). Consequently, how to
boost innovation has been of central interest to both policy makers and entrepreneurs.
In the academic field, market competition is considered to be an important
determinant of firms’ incentive to innovate, and research examining the relationship
between competition and innovation both from a theoretical and an empirical perspective
spans back more than half a century (e.g., Arrow 1962; Gilbert and Newbery 1982; Cohen
and Levin 1989; Aghion et al. 2005; Vives 2008). However, the degree of competition
among firms in a particular product market is not necessarily the main or key factor
determining the rate and direction of innovation.
Teece (1996), for instance, argues that an important determinant of innovation is
firm organization and that scholars need to understand the importance not only of market
structure and the business environment but also of the formal and informal structures of
firm organization, where formal structures include aspects such as scale, scope, integration,
and hierarchy, while informal structures comprise a firm’s organizational culture,
consisting of elements such as corporate norms and values as well as a shared identity
within the firm. There is some quantitative evidence indicating that such organizational
aspects indeed are important determinants of innovation inputs and output. For example,
estimating patent production functions, Pakes and Griliches (1984) found that the
magnitude of the coefficient on research and development (R&D) investment fell
drastically when firm-specific effects are controlled for. Meanwhile, Scott (1984) found
that firm fixed effects explained about 50% of the variance in R&D intensity. These results
imply that there are unobserved firm-specific factors which greatly affect innovation
activities. While neither of these two studies nor any subsequent research explore what the
key determinants of such firm-specific effects are, one possible explanation of the results
is that firm-specific organizational practices play a role in determining firms’ innovation
output and inputs.
Against this background, the literature has increasingly focused on various
features of organizations, including (1) the design of incentive systems; (2) firms’ ability
to manage spillovers of knowledge; and (3) firms’ choice of organizational structure.
However, although there is a burgeoning literature on organizational and human resource
management issues (for a survey, see, e.g., Bloom and Van Reenen (2011)), most studies do
not focus on R&D or innovation activities. Instead, they investigate, for example, the
relationship between firm productivity and firm-wide management practices such as the
role of teams, payment schemes, and training for workers overall, without specifically
focusing on management practices with regard to researchers and/or research units.
That being said, although relatively scarce, there are some studies, including
quantitative studies, that examine on the relationship between innovation and organization.
Yet, as pointed out by Azoulay and Lerner (2013), most of our knowledge on this
1
relationship does not stem from the mining of traditional datasets such as large sample
survey datasets or census-type datasets, but from small-sample surveys and questionnaires.
Previous empirical studies using firm-level innovation survey data or patent-inventor
linked data, as we will detail in the next section, have not yet provided conclusive evidence
on the relationship between R&D human resource management and R&D outcomes.
Moreover, the majority of previous empirical studies on innovation activities use patent or
R&D expenditure data as proxies for innovation outcomes. Examples include the studies
by Yanadori and Cui (2013) and Nagaoka et al. (2014), which use patent data as innovation
outcomes to examine innovation performance and payment schemes. However, as pointed
out by Azoulay and Lerner (2013), patent citations are far from an ideal measure of the
relevance of research to firms’ product markets, and a more appropriate metric would be
sales of innovative products. On the other hand, R&D expenditure is a measure of R&D
inputs and therefore not an adequate measure of innovation outcomes when analyzing the
efficiency/productivity of R&D activities.
This means that there are still very few empirical examinations of organizational
management and R&D activities based on large-scale firm-level databases. 1 Against this
background, the aim of the present study is to empirically examine the relationship
between firms’ R&D-related organizational and human resource management on the one
hand and innovation output on the other hand. For the analysis, we use the firm-level data
underlying the Japanese National Innovation Survey conducted by the Ministry of
Education, Culture, Sports, Science and Technology in 2009. This survey is the Japanese
equivalent of the Community Innovation Surveys (CIS) conducted by the European Union.
Using the data enables us to define firm-level innovation output as the successful
introduction of new products or sales from innovative products. The data also enable us to
take technological superiority into account by distinguishing sales of new-to-the-market
products and sales of new-to-the-firm products or by using information on the time
required by rivals to catch up. Moreover, using the data, we can obtain firm-level
information on within-firm R&D organizational changes or assessment schemes for
researchers. The novelty of our study is that it examines the link between the management
of researchers or research units and firm-level product innovation without relying on
patent citation data, but using firm-level information on innovative products instead.
Moreover, by taking account of the technological superiority of new products, we
explicitly investigate what kinds of management practices are effective to achieve
breakthrough innovation.
Our findings suggest that implementing more than one management practice at
the same time is associated with a higher probability of innovating new products.
Particularly for product innovation, management practices such as interdivisional
cooperation, board members with an R&D background, personnel assessment reflecting
1
A few exceptions which analyze the relationship between internal organization and R&D
activities using firm-level data include Argyres and Silverman (2004), Lerner and Wulf (2007),
Arora et al. (2011), and Kanama and Nishikawa (2015).
2
R&D outcomes, and restructuring of R&D centers have strong and positive impacts on the
success of breakthrough innovation. Among these, personnel assessment appears to have
an especially strong impact on product innovation. Meanwhile, the importance of board
members with an R&D background and the restructuring of R&D centers suggests that
top-down R&D decision making and drastic organizational changes can serve as a
definitive signal of firms’ intent to pursue an innovation-oriented strategy and can
accelerate innovation success.
The remainder of this study is organized as follows. Section 2 provides a survey
of the related literature and highlights the importance of organizational factors as
determinants of innovation success. Section 3 describes the dataset used in this study and
discusses various characteristics of the innovation activities of Japanese firms. Section 4
then examines complementarities between organizational and human resource management
practices. Next, Section 5 explores effective management practices in more detail and
investigates practices particularly effective for breakthrough innovation. Finally, Section 6
concludes.
2.
Related Literature
Teece (1996) argues that the formal and informal structures of a firm have an important
bearing on the strength of innovation activity. In this section, we briefly explain the
importance of organizational factors as determinants of innovation success based on
Teece’s (1996) argument. We then review the findings of previous empirical studies and
summarize the issues on the role of organizational and human resource management in
innovation activities.
Teece (1996) highlights seven key properties of technological innovation.
Specifically, innovation tends to be characterized by uncertainty, path dependency, and
technological interrelatedness, it tends to be cumulative in nature and exhibit
irreversibilities, knowledge is often tacit, and innovations can be difficult to appropriate.
Given these underlying properties of technological innovation, he identifies the
organizational requirements for innovation success: (1) joint research projects or alliances
with other firms to obtain better access to capital; (2) cooperation and coordination across
business units or divisions to mitigate various types of uncertainties; (3) horizontal and/or
vertical integration of organizational subunits such as R&D, manufacturing, and marketing,
in order to attain economies of scope and successfully commercialize innovations; and (4)
human resource management practices to develop corporate norms and instill them in
employees.
Based on Teece’s (1996) discussion, this study – mainly reflecting data
availability – focuses on the following three broad types of management practices: (1)
cooperation and coordination across business units or divisions at the firm as a whole; (2)
human resource management with regard to R&D personnel; and (3) restructuring the
3
organization of R&D. The remainder of this section reviews findings of previous empirical
studies related to these types of management practices.
First, cooperation and coordination across business units or divisions is expected
to increase knowledge spillovers within a firm and to improve firm performance. There are
a substantial number of studies that have correlated various aspects of firms’ performance
with various management practices. Bloom and Van Reenen (2007) and Bloom et al.
(2014), for example, construct a large-scale firm-level dataset which they use to score
various management practices. They find that such scores are strongly associated with
measures of firm performance such as productivity. However, their measures of
management practices include both organizational and human resource management
practices and do not explicitly distinguish the effects of each type of management practices.
They calculate management scores basically as the simple average of scores across 18
questions related to both organizational and human resource management issues. Although
this approach makes sense in certain respects – since some management practices likely
are complimentary to each other and it is not straightforward to attach weights to
individual practices – it makes it difficult to assess which management practices are
particularly important determinants of firm performance. Focusing on organizational
management practices, Jones (2009), using a large micro dataset of inventors, shows that
teamwork becomes more important over time. However, the relationship between
teamwork and research outcomes has not been examined.
A topic that has received considerably more attention is the role of incentive
systems such as pay for performance. Studies on pay for performance have produced mixed
results, however. While some show that compensation based on the pay-for-performance
principle induces higher levels of effort and productivity (e.g., Lazear 2000; Shearer 2004),
other studies highlight the distortions associated with incentive pay schemes (e.g., Bloom
and Van Reenen 2011). Meanwhile, using a large micro dataset on inventors, Nagaoka et al.
(2014) examine the relationship between revenue-based payments for inventions and
research outcomes (proxied by the number of patent citations). They find that although
incentive pay schemes tend to increase the number of patent citations (i.e., result in
higher-quality inventions), the effect depends on the degree of inventors’ intrinsic
motivation for science. Intrinsic motivation is based on researchers’ enthusiasm for
exploration and means that researchers work on something because they find it personally
rewarding. On the other hand, monetary incentives provide only extrinsic incentives, and
Nagaoka et al. (2014) find that for inventors with greater intrinsic motivation incentive pay
schemes have a smaller positive effect. This result is consistent with findings by Stern
(2004), who, using a dataset on job offers for postdoctoral biologists, observes a negative
relationship between intrinsic and extrinsic incentives. These studies suggest that firms
need to design incentive schemes that do not crowd out researchers’ intrinsic motivation to
innovate.
Studies that statistically examine the relationship between remuneration schemes
and innovation include those by Lerner and Wulf (2007), Yanadori and Cui (2013), and
4
Kanama and Nishikawa (2015). Lerner and Wulf (2007) analyze the relationship between
compensation of senior executives and R&D outcomes and find that more long-term
incentives such as stock options are associated with more heavily cited patents. However,
Yanadori and Cui (2013), focusing on the compensation of R&D employees, find that pay
dispersion among R&D employees is negatively associated with firm innovation (proxied
by the number of successful patent applications), which implies that large pay differentials
among employees decrease collaboration and preclude innovation. Meanwhile, Kanama
and Nishikawa (2015), using the same dataset as that employed in this study, find that
monetary compensation does not have a positive impact on innovation, while the
introduction of an assessment system based on R&D performance does. Also of interest in
this context is the study by Ederer and Manso (2013), who, using a laboratory experiment,
provide evidence that the combination of tolerance for early failure and reward for
long-term success is effective in motivating innovation, suggesting that incentive schemes
should be designed from a long-term perspective. This result is consistent with the findings
by Lerner and Wulf (2007) and Kanama and Nishikawa (2015) that long-term incentives
are positively associated with innovation.
Turning to R&D organization structures, several studies investigate whether the
choice of a centralized or decentralized R&D structure affects R&D outcomes (e.g.,
Argyres and Silverman 2004). Lerner and Wulf (2007), focusing on the relationship
between innovation and compensation of corporate R&D heads, find that more long-term
incentives are clearly associated with innovation in firms with centralized R&D
organizations while no association in firms with decentralized R&D organizations is found.
These studies suggest that firms with a centralized R&D organization tend to generate
more frequently cited patents.
However, with the exception of the study by Kanama and Nishikawa (2015), most
of the studies mentioned above employ patent data to measure innovation outcomes and do
not examine the role of management practices in the successful commercialization of
innovation. As pointed out by Azoulay and Lerner (2013), patent citations do not represent
the relevance of the research to the firm’s product markets. A better proxy for the relevance
of research outcomes would be the introduction of new-to-the-market products. Moreover,
some management practices may be complementary and the choice of management
practices is potentially endogenous. Although some studies such as Lerner and Wulf (2007)
imply that human resource management and organization management practices have
complimentary effects, such complementarities have not yet been sufficiently explored in
previous studies. Moreover, our knowledge on the magnitude of the impact of each
management practice is still limited, and the internal organization of innovating firms still
largely represents a black box.
In the following sections, mainly focusing on organizational and human resource
management issues, we examine the factors which affect the likelihood that firms innovate,
using a large-scale firm-level dataset on product and process innovation. More specifically,
we aim to investigate complementarities among various management practices and to
5
examine which management practices are strongly associated with innovation outcomes.
3.
Overview of the Organizational and Human Resource Management Practices in
Japanese Firms
3.1
Data
The data used in this study are the firm-level data from the Japanese National Innovation
Survey (J-NIS). 2 The survey is based on the Oslo Manual and provides a wide range of
information on firms’ innovation activities and their outcomes such as the sale of products
which embody innovations new to the firm or the market.
The J-NIS was conducted in 2003, 2009, 2012, and 2015, and the data collected in
the 2003, 2009, and 2012 surveys were available for the purpose of academic research at
the time of writing of this study. However, each survey is considerably different in terms of
sample size and size distribution of responding firms. 3 Moreover, the questions and the
choices provided for answers were also quite different, although all the surveys are based
on the Oslo Manual. This means that only the J-NIS 2009 asks about human resource
management for researchers and organizational management of research units/divisions,
while the J-NIS 2003 and the J-NIS 2012 focus more on organizational management of the
entire firm. For these reasons, we use the J-NIS 2009 data for this study.
In addition, for our empirical analyses below, we eliminate observations for firms
that did not provide information on their total sales amount. As a result, we are left with
3,837 observations for 2009. The number of firms by industry is provided in Appendix
Table 1. Although more detailed (3-digit level) industry information is available, we
classify firms into 11 manufacturing industries and 7 non-manufacturing industries. Our
cross-section database includes 1,589 manufacturing firms (41.4%) and 2,248 firms that
fall into non-manufacturing industries (58.6%).
3.2 Overview of Innovative Firms and Factors that Determine Firms’ Innovation Behavior
2
The statistical analysis of the firm-level data was conducted by the First Theory-Oriented
Research Group, National Institute of Science and Technology Policy (NISTEP), Ministry of
Education, Culture, Sports, Science and Technology (MEXT) under arrangements that maintain
legal confidentiality requirements.
3
Although in all the surveys, the questionnaire was sent out to a sample of firms with 10 or
more regular persons employed, the size distribution of the sample firms is very different
across surveys. In the 2003 survey, 19% of the firms that answered were large firms (250 or
more employees), while in the 2009 survey 48% were large firms. We could try to construct a
panel consisting of firms that responded to all the three surveys. Unfortunately, however, there
are very few such firms, so that we do not have a sufficient number of observations. For more
details on the J-NIS 2003, 2009, and 2012 s, see National Institute of Science and Technology
Policy (2004, 2010, and 2014).
6
In this study, we focus on product innovation as an outcome of innovation activities. In our
dataset, 1,218 firms (31.7%) out of the total 3,837 firms answered that they successfully
innovated new products and/or services in the preceding three years (i.e., 2006-2008 for
the 2009 survey).
As for internal factors which affect firms’ innovation activities, we focus on
organizational and human resource management within a firm. The survey asks 11
questions regarding organizational and human resource management for the purpose of
efficient R&D activities during the preceding three years. For simplicity, we aggregate the
11 questions into 8 items and group them into 3 broad categories. Categories O1 and O3
are related to narrowly-defined organizational management while category O2 is related to
human resource management:
O1) Cooperation and coordination across business units or divisions at the firm as a whole
- Interdivisional cooperation/teams: The firm implemented rotation of employees across
divisions or created project teams across divisions.
- Interdivisional meetings/systems: The firm held meetings across divisions or introduced
systems which accumulate, exchange, or share information across divisions.
O2) R&D personnel human resource management
- Board members with R&D background: The firm assigned a person from the R&D
division as a board member.
- Personnel assessment reflecting R&D outcomes: The firm reflected R&D outcomes in the
assessment of researchers or engineers.
- Incentive payments: The firm employed an incentive payment scheme to reward
inventions by employees.
- Employment or re-employment of retired researchers or engineers: The firm employed or
re-employed researchers or engineers who had reached retirement age.
O3) Restructuring of R&D organization
- Creation/relocation/integration/reorganization of R&D centers or divisions: The firm
created, relocated, integrated, or reorganized centers or divisions of the firm’s
R&D activities.
- Increased authority for researchers/engineers: The firm increased or extended the
authority of researchers or engineers.
In addition to questions asking about these management practices, firms were also
asked whether they had innovated new products and/or services in the preceding three
7
years. Table 1 shows the distribution of firms in terms of their answers to these questions.
First, in order to obtain a broad overview of the characteristics of management practices at
Japanese firms, we look at the number of firms which had implemented at least one
practice in each of the three categories, O1, O2, and O3. Table 1 lists various combinations
of management practices and shows the number of firms for each combination. The
combination (1, 0, 0), for example, represents firms that had implemented at least one of
the two practices in category O1 but none of the practices in categories O2 and O3.
Similarly, the combination (0, 1, 1) represents firms that had not implemented any of the
practices in category O1 but had implemented at least one practice in category O2 and at
least one practice in category O3. Further, firms are divided into those that had replied that
they had innovated new products and/or services in the preceding three years and those that
had not.
As seen in Table 1, the majority of non-innovating firms (55.9%, 1,463 firms out
of the 2,619 non-innovating firms) had not implemented any of the management practices
listed in the three categories, i.e., their combination was (0, 0, 0), while most of the
innovating firms (83.2%, i.e., 100%−16.8%) had implement at least one of the management
practices listed above. Table 1 thus clearly shows that innovating firms are much more
likely to focus on organizational and human resource management for R&D.
That being said, practices in category O1 (cooperation across business units at the
firm
level)
are
quite
widespread
even
among
non-innovating
firms:
1,061
(=549+363+40+109) firms out of the 2,619 non-innovating firms (40.5%) implement at
least one of the practices in category O1, while the corresponding figures for categories O2
and O3 are 561 (=84+363+5+109) and 160 (=6+40+5+109), respectively. Among
innovating firms, 969 (=259+303+67+340) out of 1,218 firms (80%) implement at least
one of the practices in category O1, while 678 (=26+303+9+340) and 425 (=9+67+9+340)
firms implement at least one of the practices in categories O2 and O3, respectively. Further,
the number of firms implementing practices in the O3 category (restructuring of R&D
organization) is much smaller than that of firms implementing practices in the O2 category
(human resource management), particularly in the case of non-innovating firms. One
possible explanation is that restructuring of R&D organizations may be a less important or
more difficult practice than human resource management.
More importantly, a significant number of firms implement practices in more than
one category, particularly in the case of innovating firms. 379 firms (31.1%) out of the
1,218 innovating firms implement practices in two out of the three categories, and 340
firms (27.9%) implement practices in all three categories, while 294 firms (24.1%)
implement practices in only one of the three categories. However, in the case of
non-innovating firms, the number and share of firms that implement practices in all three
categories is very small: 109 firms or 4.2%. The fact that a substantial share of innovating
firms implement all three types of management practices simultaneously suggests that all
three categories are potentially important for greater efficiency of R&D activities and that
there may be some complementarities among the different management practices.
8
INSERT Table 1
4. Complementarities Between Organizational Management and Human Resource
Management Practices
4.1 Empirical Model
Our initial aim is to examine which combinations of management practices determine a
firm’s innovation success and how large the magnitude of the impact of respective
combinations is. Furthermore, we statistically test complementarities among the practices.
Specifically, we measure two types of innovation outcomes: product innovation and
process innovation. Based on the J-NIS2009 data, we identify whether a firm introduced
new or significantly improved products (or production processes) during the preceding
three years or not.
We start by estimating a probit model in order to examine what factors determine
the probability that a firm introduces new or significantly improved products (or
production processes). The probit model assumes that there exists an underlying
relationship, 𝑦𝑦𝑖𝑖∗ = 𝑋𝑋𝑖𝑖 𝛽𝛽 + 𝑢𝑢1𝑖𝑖 , where 𝑢𝑢1 ~𝑁𝑁(0,1). 𝑦𝑦𝑖𝑖∗ is a latent innovation variable for
firm i measuring the propensity to innovate, while X i is a vector of firm characteristics
including the combinations of management practices implemented. The corresponding
𝑝𝑝𝑝𝑝𝑝𝑝𝑝𝑝𝑝𝑝𝑝𝑝
observed variable, 𝑦𝑦𝑖𝑖
and zero otherwise:
, is a binary variable, which takes a value of one for innovators
𝑝𝑝𝑝𝑝𝑝𝑝𝑝𝑝𝑝𝑝𝑝𝑝
𝑦𝑦𝑖𝑖
= (𝑦𝑦𝑖𝑖∗ > 0)
(1)
We should note that firms likely decide first whether to invest in R&D activities
before they introduce new products or processes. Moreover, firms that do not invest in
R&D activities in most cases do not have an official R&D section or department, and are
very unlikely to implement any of the management practices regarding R&D organization
and R&D human resources. In other words, the estimation results may be biased when the
decision of undertaking innovation activities and engaging in R&D management are
correlated. We therefore have to take this sample selection into account and consequently
employ a probit model with sample selection to address the potential selection bias. More
specifically, employing Heckman’s (1979) two-step estimation approach, we estimate the
determinants of firms’ R&D decision in the first stage and then estimate the determinants
of innovation success in the second stage. For the first stage estimation regarding whether
a firm is engaged in R&D activities, the binary choice variable we use, 𝑦𝑦𝑖𝑖𝑠𝑠𝑠𝑠𝑠𝑠𝑠𝑠𝑠𝑠𝑠𝑠 ,
whether the firm reports positive R&D expenditure for 2006, i.e.:
9
is
𝑦𝑦𝑖𝑖𝑠𝑠𝑠𝑠𝑠𝑠𝑠𝑠𝑠𝑠𝑠𝑠 = (𝑧𝑧𝑖𝑖 𝛾𝛾 + 𝑢𝑢2𝑖𝑖 > 0)
(2)
where 𝑢𝑢2𝑖𝑖 ~𝑁𝑁(0,1). If ρ (the correlation of 𝑢𝑢1 and 𝑢𝑢2 ) ≠ 0, standard probit techniques yield
biased results. As we obtain a statistically significant ρ, we employ the probit model with
sample selection. As explanatory variables in the first stage, z i , we use the logarithm of
firms’ total sales in 2006 as a proxy for firm size and industry dummies to capture
industry-specific factors such as technological characteristics and competitive pressures.
For identification, we exclude firms’ total sales in the second-stage probit model. However,
it should be noted that our analysis does not allow us to rigorously examine the causal
relationship. The reason is that firms may be more likely to implement various
management practices if they are undertaking R&D activities that are certain to bring forth
new products than if this were not the case. We cannot address the endogeneity between
the decision to implement management practices and the probability of innovation success,
since our data are not panel data and we cannot control for unobserved firm-specific
factors which affect the certainty of new product development. While this is a limitation of
this study, we can examine the direction and the strength of the relationship between
management practices and innovation success.
We estimate selection equation (2) with all observations. We calculate the inverse
Mills ratio using equation (2) and then estimate equation (1) with the restricted
observations including the estimated inverse Mills ratio. The explanatory variables of main
interest to us are the dummy variables representing various combinations of firms’
organizational and human resource management practices. The definitions of these
variables are the same as those employed in Table 1 and we prepare seven dummy
variables representing the same combinations of management practices shown in the table,
with firms that employ none of the practices serving as the reference group. As other
explanatory variables, we also include firms’ R&D intensity, which is measured as the
logarithm of the ratio of R&D expenditure to total sales, and industry dummies based on
the 18 industries presented in Appendix Table 1. The reason for including industry
dummies is to capture technological opportunity conditions, industry-targeted innovation
policies, industry-specific demand growth effects, and structural effects such as the
intensity of competition. Appendix Tables 2 and 3 respectively present descriptive
statistics and correlation coefficients for all the variables.
4.2 Results
The results of the probit estimation with sample selection (average marginal effects) for
equation (1) above are shown in Table 2.
4
Looking at the results, some of the
combinations of management practices, namely, combinations (1,0,0), (1,1,0), (1,0,1) and
4
The estimated coefficients are shown in Appendix Table 4.
10
(1,1,1), are positively associated with both product and process innovation, suggesting that
implementing O1 (cooperation across business units) increases the probability of both
product and process innovation.
Moreover, the results indicate that the marginal effect of combinations of more
than one practice tends to be larger than that of just one practice, particularly in the case of
product innovation. For example, the marginal effect of the combination (1,1,0) on product
innovation is 0.24, meaning that the probability to innovate a new product is 24 percentage
points higher when a firm implements both O1-type and O2-type management practices at
the same time than when a firm implements none of the management practices, (0,0,0). On
the other hand, firms implementing solely O1-type practices for example only have a 9
percentage point higher probability of product innovation than firms implementing none of
the practices. Therefore, this latter result for (1,0,0) suggests that adding O2 practices
(human resource management of R&D personnel) to O1 practices (cooperation across
business units) increases the probability that firms innovate by 15 percentage points
(=24-9). Comparing the marginal effects of (1,0,0) and (1,0,1), adding O3 practices
(restructuring of R&D organization) to O1 practices increases firms’ innovation probability
by 22 percentage point (=31-9). Moreover, in the case of product innovation, implementing
all three management practices has the highest marginal effect, suggesting that particularly
in the case of product innovation implementing different types of management practices is
positively associated with innovation success. However, in the case of process innovation,
there is no monotonic increase in the magnitude of marginal effects as the number of
practices implemented increases. Thus, the results in Table 2 imply that while
implementing different types of management practices at the same time is important for
product innovation, process innovation can be achieved more easily by implementing at
least one type of practice.
We also check whether the difference between the coefficients for each pair of
combinations is statistically significant using the Wald test, and the results are shown in
Appendix Table 5. Appendix Table 5 shows the significance level of the difference
between the coefficient on the combination shown in the row of the table and the
coefficient on the combination shown in the column of the table. The results confirm that
the coefficient tends to be significantly larger the larger the number of practices firms
implemented.
We also test for complementarities among O1, O2 and O3 based on the
complementarity test suggested by Kodde and Palm (1986). However, we did not find
statistically significant complementarities for any pair of the three types of management
practices. Nevertheless, our results above imply that product innovation is positively
correlated with the number of practices implemented.
INSERT Table 2
11
5. Which Management Practices Matter for Innovation Success?
5.1 Details on R&D organizational and human resource management practices
So far, we focused on the three broad categories of organizational and human resource
management, O1, O2, and O3, and found that such management practices are positively
associated with product and process innovation. We also found that implementing different
types of management practices at the same time is important for innovation success,
particularly for product innovation.
In this section, we look at each management practice in more detail. As outlined
in Section 3.2, each of the three management categories, O1, O2, and O3, comprises
between two and four detailed management practices. Table 3 shows the number of firms
which implemented each of the management practices included in the three categories.
Firms are further divided into two groups: firms which successfully innovated new
products in the preceding three years and firms which did not. Looking at Table 3, a large
number of firms – including non-innovating firms – implemented both of the two practices
in category O1 (cooperation across business units). On the other hand, there seems to be a
clear difference between innovating firms and non-innovating firms in human resource
management (O2). Among innovating firms, the number of firms is relatively evenly
distributed across the three practices: personnel assessment reflecting R&D outcomes,
incentive payments, and employment or re-employment of retired researchers or engineers.
However, among non-innovating firms, employment or re-employment of retired
researchers or engineers is much more widespread than other practices, and personnel
assessment reflecting R&D outcomes is much less widespread. In contrast, personnel
assessment reflecting R&D outcomes is the most widespread O2 practice among
innovating firms. Finally, looking at the two practices in category O3 (restructuring of
R&D organization), the number of non-innovating firms implementing such practices is
much smaller than that implementing practices in categories O1 or O2, while among
innovating firms a substantial number of firms implement practices in category O3.
Although unfortunately further detailed information on each practice is not
available, these figures imply that there are significant differences in management
practices between innovating and non-innovating firms, and that these differences likely
determine innovation outcomes at the firm level.
INSERT Table 3
5.2 Econometric methodology and results
In this section, we examine which management practices are associated with the
probability that firms innovate and assess the magnitude of the impact. We start by
estimating a probit model with sample selection in order to investigate which factors
12
determine the propensity to innovate new products or services and the propensity to
innovate new processes. Similar to the estimations in Section 4, we estimate the
determinants of firms’ R&D decision in the first stage and then estimate the determinants
of innovation at the second stage. We use the same dependent variable as in the estimations
in Section 4, namely, a binary variable which takes one if a firm innovates new products
(or processes) and zero otherwise. As explanatory variables we include firms’ R&D
intensity and eight dummy variables representing the management practices listed in Table
3, namely, interdivisional cooperation/teams, interdivisional meetings/systems, board
members with an R&D background, personnel assessment reflecting R&D outcomes,
incentive
payments,
employment/re-employment
creation/relocation/integration
of
R&D
centers,
of
retired
and
researchers/engineers,
increased
authority
for
researchers/engineers.
The binary dependent variable – i.e., whether a firm innovates or not – does not
indicate how significant new products are in the market in which firms operate. We
therefore also employ an alternative measure of innovation outcomes as a dependent
variable. Specifically, we construct a variable representing the technological superiority of
a new products using information on the time a firm thinks it would take competitors to
catch up with its most important innovative product.
In the J-NIS 2009, firms were asked to choose one of the following six answers
regarding how long it would take competitors to invent a similar product: (1) less than 6
months; (2) 6 months to 1 year; (3) 1 to 3 years; (4) 3 to 5 years; (5) 5 to 10 years; and (6)
more than 10 years. The more superior a new product or service innovation is, the longer it
will take competitors to catch up, so that we use the answers to this question to indicate
how significant a product innovation is.
Only firms that innovated new products were asked this question on how long it
would take competitors to catch up. In the analysis using this alternative measure of
innovation outcome as the dependent variable we therefore restrict our sample to firms that
achieved product innovation. More specifically, we conduct an interval regression with the
1,218 innovating firms in our sample. Interval regression fits a model in which the
dependent variable may be measured as point data, interval data, left-censored data, or
right-censored data. We therefore create a dependent variable containing the lower and
upper endpoints of the above 6 choices. Doing so, we end up with 227 left-censored
observations (firms responding that the expected catch-up time was equal to or less than 6
months), 22 right-censored observations (firms responding that the excepted catch-up was
equal to or more than 10 years), and 969 interval observations.
We first present the results of the probit estimation which examines the factors
determining whether firms innovate or not (Table 4). Then, in the latter half of this section,
we present the results of the interval regression taking account of the technological
superiority of a new products (Table 5). Table 4 shows the results of the probit estimation
13
with sample selection (average marginal effects). 5 While some of the organizational and
human resource management practices are associated with both product and process
innovation, others are associated with product or process innovation only. Specifically,
interdivisional cooperation/teams, personnel assessment reflecting R&D outcomes, and
creation/relocation/integration of R&D centers are positively associated with both product
and process innovation. On the other hand, having board members with an R&D
background is positively associated with product innovation only, while incentive
payments are negatively associated with process innovation only.
While interdivisional cooperation/teams and interdivisional meetings/systems
have a higher marginal effect than personnel assessment and restructuring of R&D centers
in the case of process innovation, the opposite is observed in the case of product
innovation. These results suggest that horizontal communication across divisions and
teamwork are more important for process innovation. On the other hand, board members
with an R&D background, personnel assessment, and drastic changes in R&D organization
are more important for product innovation, implying that top-down R&D decision-making
may have a larger impact on product innovation.
In fact, in the case of product innovation, the marginal effect of having a board
member with an R&D background is 0.097, implying that assigning a person with an R&D
background as a board member increases the probability of innovating new products by 9.7
percentage points. Given the fact that the share of product innovators in the total sample is
31.7% (=1,218/3,837; see Table 1 or 3), this is a significant increase in the probability. On
the other hand, there is no significant association between the employment or
re-employment of retired researchers or engineers and either type of innovation, and the
coefficient estimate is even negative. Since innovation is an interactive process where
employees interact in groups and develop, discuss, modify, and realize new ideas, previous
studies such as that by Van der Vegt and Janssen (2003) suggest that employee diversity is
positively associated with innovation performance. However, our result does not support
this argument regarding age diversity among researchers. 6
Next, turning to the role of authority for researchers or engineers, the results
indicate that such authority has a significant positive impact in the case of process
innovation, but no significant impact in the case of product innovation. On the other hand,
incentive payments have a negative effect on process innovation, while no statistically
significant effect is observed in the case of product innovation. As mentioned in Section 2,
5
The estimated coefficients are shown in Appendix Table 6. We also tried IV probit estimation,
assuming that firm-level R&D intensity is an endogenous variable. We constructed a binary
variable representing competition in the market. Specifically, the variable takes a value of one
if a firm answered in the J-NIS questionnaire that products/services became more diversified or
the lifecycle of products/services became shorter, and zero otherwise. The IV probit estimation
results are shown in Appendix Table 7 and are consistent with those in Table 4.
6
In fact, Østergaard et al. (2011) show a negative effect of age diversity on product innovation,
while they find a positive relationship between employee diversity in gender and education on
the one hand and product innovation on the other.
14
previous studies tend to suggest that intrinsic motivation (i.e., individuals’ enthusiasm for
science) is more important for researchers’ performance than extrinsic motivation through,
e.g., financial incentives. 7 Our finding of a negative impact of incentive payments in the
case of process innovation is in line with those studies; on the other hand, the reasons for
the insignificant result in the case of product innovation deserves further investigation in
the future. Meanwhile, personnel assessment reflecting R&D outcomes has a significantly
positive marginal effect on both product and process innovation, raising the probability of
introducing new products and production processes by 18.3 percentage points and 8.5
percentage points, respectively. A possible interpretation of these results is that financial
incentives may be counterproductive in fostering an environment that stimulates
innovation, while personnel assessment either offers incentives to innovate – for example,
by providing recognition – or helps to identify the most innovative R&D personnel. 8
INSERT Table 4
The results of the interval regression are presented in Table 5. They show that four types of
management practices have a significantly positive impact in terms of generating
significant product innovations (where the significance of innovations is gauged based on
the time firms expect it will take rivals to catch up): interdivisional cooperation/teams,
having board members with an R&D background, personnel assessment reflecting R&D
outcomes, and the creation/relocation/integration of R&D centers. Both in Tables 4 and 5,
these practices have a significant and relatively large positive marginal effect. Therefore,
all our results suggest that among the various management practices, these four practices
are important for achieving product innovations, particularly significant innovations that
take longer to replicate (referred to as “breakthrough innovations” hereafter). It is
interesting to note that the use of interdivisional cooperation/teams is a practice in
category O1, while having board members with an R&D background and relying on
personnel assessment reflecting R&D outcome are practices in category O2, and the
creation/relocation/integration of R&D centers is a practice in category O3. This implies
that both organizational and human resource management significantly affect firms’
innovation outcomes. As for human resource management of R&D personnel, while
personnel assessment reflecting R&D outcomes has a large positive marginal effect in
terms of achieving significant innovations, incentive payments and the employment or
7
Although there are an increasing number of theoretical and experimental studies by
psychologists, sociologists, and economists on researchers’ intrinsic and extrinsic motivation
(e.g., Bénabou and Tirole 2003, Manso 2011), systematic empirical studies using real-world
data are extremely scarce. One of the few exceptions is the study by Owan and Nagaoka (2011),
who examine the relationship between the strength of inventors’ intrinsic and extrinsic
motivation and their productivity (proxied by patent applications) using large-scale survey data
of Japanese inventors.
8
Kanama and Nishikawa (2015), using the same dataset as our study, find that
performance-based evaluation promotes innovation, while monetary compensation does not,
which is consistent with our results.
15
re-employment of retired researchers or engineers do not have a significant impact in terms
of achieving significant innovations.
Moreover,
having
board
members
with
an
R&D
background and
the
creation/relocation/integration of R&D centers have a significant positive marginal effect,
which is consistent with the results on product innovation in Table 4 and implies that
drastic top-down decision-making seems to foster breakthrough innovation. 9
INSERT Table 5
6. Conclusion
In this study, we examined the link between firms’ organizational and human resource
management of their research units on the one hand and innovation outcomes on the other.
Our findings can be summarized as follows. First, implementing more than one
management practice at the same time is associated with a higher probability of innovating
new products. However, in the case of process innovation, the magnitude of the marginal
effects does not monotonically increase in the number of practices implemented,
suggesting that in the case of process innovation implementing at least one type of
management practice already yields substantial benefits.
Second, particularly for product innovation, we found that four types of
management practices – namely, the use of interdivisional cooperation/teams, having board
members with an R&D background, personnel assessment reflecting R&D outcomes, and
the creation/relocation/integration of R&D centers – had a strong positive impact on
innovation success. The results were very similar when we focused on breakthrough
innovation, i.e., taking the technological superiority of products into account.
Personnel assessment reflecting R&D outcomes consistently had a large positive
effect on product innovation, while incentive payments and the employment or
re-employment of retired researchers or engineers did not have a significant impact on
product innovation. These results suggest that human resource management of R&D
personnel is an important determinant of innovation success and that providing the right
incentives to motivate researchers and assessing researchers are important for promoting
breakthrough innovation. However, incentive payments and employment/re-employment of
retired researchers/engineers do not clearly promote innovation.
The importance of having board members with an R&D background and the
creation/relocation/integration of R&D centers for product innovation suggests that
top-down R&D decision-making and drastic organizational changes may serve as a
definitive signal of a firm’s determination to pursue an innovation-oriented strategy and
9
We also investigated the determinants of breakthrough innovation by estimating an ordered
probit model and obtained results that were broadly consistent with those in Tables 4 and 5.
The methodology and results of the ordered probit estimation are explained in the Appendix.
16
help to accelerate innovation success.
Given various data limitations, however, these results should be interpreted with
caution. For example, our data contain no detailed information on the assessment and/or
payment system each firm employs. The effects of the pay-for-performance system may
depend on the relative importance of incentive payments compared to fixed payments.
Similarly, the effects of personnel assessment may depend on the importance of research
outcomes in personnel assessments, that is, the extent to which research outcomes are
taken into account in personnel assessments and/or the promotion of researchers. Moreover,
whether or not, or to what extent, researchers’ wages reflect the result of personnel
assessment may affect their motivation and change the rate and direction of innovation.
Due to data constraints, however, we cannot control for the relative importance of
incentive payments and personnel assessment or the potential links between them.
Moreover, we also do not know details on R&D organizational changes, that is, whether an
R&D center was creased, relocated, or integrated. To understand the relationship between
organizational structure and innovation success, it would be necessary to combine
quantitative analyses such as those in this study with detailed case studies.
Last but not least, as mentioned above, data limitations mean that we cannot
rigorously examine the causal relationship between management practices and innovation
success. In order to examine causal relationships and the mechanisms underlying such
relationships, we would need to construct firm-level panel data and/or utilize various data
sources for detailed firm-level information. Although data constraints mean that this is not
an easy task, we believe that future studies which address these issues would provide
further insights to gain a better understanding of firms’ innovation and the role of
organizational and human resource management.
Acknowledgements
This paper is based on findings from research conducted by the authors at the National
Institute of Science and Technology Policy (NISTEP) in 2013-2015. This work was
supported by JSPS KAKENHI Grant Number 23683003. The opinions expressed and
arguments employed in this paper are the sole responsibility of the authors and do not
necessarily reflect those of NISTEP.
17
References
Aghion, Philippe, Nick Bloom, Richard Blundell, Rachel Griffith, and Peter Howitt (2005)
“Competition and Innovation: An Inverted-U Relationship,” Quarterly Journal of
Economics 120 (2): 701-728.
Argyres, Nicholas S., and Brian S. Silverman (2004) “R&D, Organization Structure, and
the Development of Corporate Technological Knowledge,” Strategic Management
Journal 25 (8-9): 929-958.
Arora, Ashish, Sharon Belenzon, and Luis A. Rios (2011) “The Organization of R&D in
American Corporations: The Determinants and Consequences of Decentralization,”
NBER Working Paper No. 17013, May, National Bureau of Economic Research.
Arrow, Kenneth J. (1962) “Economic Welfare and the Allocation of Resources in
Innovation,” in Richard R. Nelson (ed.), The Rate and Direction of Inventive
Activity, Princeton University Press: New York; 609-626.
Azoulay, Pierre, and Josh Lerner (2013) “Technological Innovation and Organizations,” in
Robert Gibbons and John Roberts, eds., The Handbook of Organizational
Economics, Princeton University Press: Princeton, NJ; 575-603.
Bénabou, Roland, and Jean Tirole (2003) “Intrinsic and Extrinsic Motivation,” Review of
Economic Studies 70 (3): 489-520.
Bloom, Nicholas, and John Van Reenen (2007) “Measuring and Explaining Management
Practices Across Firms and Countries,” Quarterly Journal of Economics 122 (4):
1351-1408.
Bloom, Nicholas, and John Van Reenen (2011) “Human Resource Management and
Productivity,” in Orley Ashenfelter and David Card (eds.), Handbook of Labor
Economics, North Holland: Amsterdam; Vol. 4 B, 1697-1767.
Bloom, Nicholas, Renata Lemos, Raffaella Sadun, Daniela Scur, and John Van Reenen
(2014) “The New Empirical Economics of Management,” Journal of the European
Economic Association 12 (4): 835-876.
Cohen, Wesley M., and Richard C. Levin (1989) “Empirical Studies of Innovation and
Market Structure,” in Richard Schmalensee and Robert D. Willig (eds.), Handbook
of Industrial Organization, North Holland: Amsterdam; Vol. 2, 1059-1107.
Ederer, Florian, and Gustavo Manso (2013) “Is Pay for Performance Detrimental to
Innovation?” Management Science 59 (7): 1496-1513.
Gilbert, Richard J., and David Newbery (1982) “Preemptive Patenting and the Persistence
of Monopoly,” American Economic Review 72 (2): 514-526.
Heckman, James J. (1979) “Sample Selection Bias as a Specification Error,” Econometrica
47: 153-161.
Jones, Benjamin F. (2009) “The Burden of Knowledge and the ‘Death of the Renaissance
Man’: Is Innovation Getting Harder?” Review of Economic Studies 76 (1):
283-317.
Kanama, Daisuke, and Kohei Nishikawa (2015) “Does an Extrinsic Reward for R&D
Employees Enhance Innovation Outcomes? Evidence from a Japanese Innovation
18
Survey,” R&D Management, forthcoming.
Kodde, David A., and Palm, Franz C. (1986) “Wald Criteria for Jointly Testing Equality
and Inequality Restrictions,” Econometrica 54 (5): 1243-1248.
Lazear, Edward (2000) “Performance Pay and Productivity,” American Economic Review
90 (5): 1346-1361.
Lerner, Josh, and Julie Wulf (2007) “Innovation and Incentives: Evidence from Corporate
R&D,” Review of Economics and Statistics 89 (4): 634-644.
Manso, Gustavo (2011) “Motivating Innovation,” Journal of Finance 66: 1823-1860.
Nagaoka, Sadao, Hideo Owan, and Koichiro Onishi (2014) “Incentive Design for
Inventors: Theory and Empirical Evidence,” RIETI Discussion Paper 14-J-044,
September, Research Institute of Economy, Trade and Industry (in Japanese).
National Institute of Science and Technology Policy (2004) “Statistics on Innovation in
Japan: Report on the Japanese National Innovation Survey 2003,” Research
Material No. 110, National Institute of Science and Technology Policy, First
Theory-Oriented Research Group, Ministry of Education, Culture, Sports, Science
and Technology.
National Institute of Science and Technology Policy (2010) “Report on the Japanese
National Innovation Survey 2009,” NISTEP Report No. 144, National Institute of
Science and Technology Policy, First Theory-Oriented Research Group, Ministry of
Education, Culture, Sports, Science and Technology.
National Institute of Science and Technology Policy (2014) “A Report on [the] Japanese
National Innovation Survey 2012,” NISTEP Report No. 156, National Institute of
Science and Technology Policy, First Theory-Oriented Research Group, Ministry of
Education, Culture, Sports, Science and Technology.
Østergaard, Christian, Bram Timmermans, and Kari Kristinsson (2011) “Does a Different
View Create Something New? The Effect of Employee Diversity on Innovation,”
Research Policy 40 (3): 500-509.
Owan, Hideo, and Sadao Nagaoka (2011) “Intrinsic and Extrinsic Motivations of
Inventors,” RIETI Discussion Papers 11-E-022, March, Research Institute of
Economy, Trade and Industry.
Pakes, Ariel, and Zvi Griliches (1984) “Patents and R&D at the Firm Level: A First Look,”
in Zvi Griliches (ed.), Patents, R&D, and Productivity, University of Chicago
Press: Chicago; 55-72.
Penrose, Edith T. (1959) The Theory of the Growth of the Firm, Basil Blackwell: Oxford.
Schumpeter, Joseph A. (1934) The Theory of Economic Development, Harvard University
Press: Cambridge.
Scott, John T. (1984) “Firm versus Industry Variability in R&D Intensity,” in Zvi Griliches
(ed.), Patents, R&D, and Productivity, University of Chicago Press: Chicago;
233-245.
Shearer, Bruce (2004) “Piece Rates, Fixed Wages and Incentives: Evidence from a Field
Experiment,” Review of Economic Studies 71 (2): 513-534.
19
Stern, Scott (2004) “Do Scientists Pay to Be Scientists?” Management Science 50 (6):
835-853.
Teece, David J. (1996) “Firm Organization, Industrial Structure, and Technological
Innovation,” Journal of Economic Behavior and Organization 31 (2): 193-224.
Van der Vegt, Gerben S., and Onne Janssen (2003) “Joint Impact of Interdependence and
Group Diversity on Innovation,” Journal of Management 29 (5): 729-751.
Vives, Xavier (2008) “Innovation and Competitive Pressure,” Journal of International
Economics 56 (3): 419-469.
Yanadori, Yoshio, and Victor Cui (2013) “Creating Incentives for Innovation? The
Relationship between Pay Dispersion in R&D Groups and Firm Innovation
Performance,” Strategic Management Journal 34 (12): 1502-1511.
20
Appendix: Ordered Probit Estimation Results
The main dependent variable used in our analysis is a binary indicator taking a value of
one if a firm innovates new products or new processes and zero otherwise. However, since
such a binary variable does not indicate how significant a new or improved product is in
the market where a firm operates, we employ multiple and ranked discrete innovation
𝑜𝑜
, which take the significance of innovations into account. We then estimate
variables, 𝑦𝑦1𝑖𝑖
the determinants of innovation success employing ordered probit regression. To identify
the significance of innovations, we construct two alternative variables to characterize the
innovativeness of products: (a) the newness of the product; and (b) the length of time firms
expect it will take competitors to catch up with the product.
The first of these variables consists of the following discrete alternatives for all
firms: (0) no product innovation; (1) product innovation; (2) new-to-the-market innovation,
ordered in this manner.
𝑛𝑛𝑛𝑛 𝑝𝑝𝑝𝑝𝑝𝑝𝑝𝑝𝑝𝑝𝑝𝑝𝑝𝑝 𝑖𝑖𝑖𝑖𝑖𝑖𝑖𝑖𝑖𝑖𝑖𝑖𝑖𝑖𝑖𝑖𝑖𝑖𝑖𝑖
𝑜𝑜
𝑦𝑦1𝑖𝑖 = � 𝑝𝑝𝑝𝑝𝑝𝑝𝑝𝑝𝑝𝑝𝑝𝑝𝑝𝑝 𝑖𝑖𝑖𝑖𝑖𝑖𝑖𝑖𝑖𝑖𝑖𝑖𝑖𝑖𝑖𝑖𝑖𝑖𝑖𝑖
𝑛𝑛𝑛𝑛𝑛𝑛-𝑡𝑡𝑡𝑡-𝑡𝑡ℎ𝑒𝑒-𝑚𝑚𝑚𝑚𝑚𝑚𝑚𝑚𝑚𝑚𝑚𝑚 𝑝𝑝𝑟𝑟𝑟𝑟𝑟𝑟𝑟𝑟𝑟𝑟𝑟𝑟 𝑖𝑖𝑖𝑖𝑖𝑖𝑖𝑖𝑖𝑖𝑖𝑖𝑖𝑖𝑖𝑖𝑖𝑖𝑖𝑖
𝑖𝑖𝑖𝑖 𝑦𝑦𝑖𝑖∗ ≤ 𝑐𝑐1
𝑖𝑖𝑖𝑖 𝑐𝑐1 < 𝑦𝑦𝑖𝑖∗ ≤ 𝑐𝑐2
𝑖𝑖𝑖𝑖 𝑐𝑐2 <
We use the following information to construct this variable:
(A1)
𝑦𝑦𝑖𝑖∗
S1) New-to-the-market product innovation: Whether the firm during the past three
years introduced a new or significantly improved product to the market in which the firm
operated.
Only firms with product innovation were asked to answer this question, and we
therefore assign a value of zero for all non-innovating firms. For firms answering that the
innovative products they introduced were not new-to-the-market products, the variable
takes a value of one. For firms answering that they introduced a new or significantly
improved product to the market in which they operate, the variable takes a value of two.
The second dependent variable we construct consists of the following discrete
alternatives for all firms: (0) no product innovation; (1) product innovation; (2) innovative
products with moderate catch-up time; (3) innovative products with significant catch-up
time, ordered in this manner.
21
𝑜𝑜
𝑦𝑦2𝑖𝑖
=
𝑖𝑖𝑖𝑖 𝑦𝑦𝑖𝑖∗ ≤ 𝑐𝑐1
𝑖𝑖𝑖𝑖 𝑐𝑐1 < 𝑦𝑦𝑖𝑖∗ ≤ 𝑐𝑐2
𝑛𝑛𝑛𝑛 𝑝𝑝𝑝𝑝𝑝𝑝𝑝𝑝𝑝𝑝𝑝𝑝𝑝𝑝 𝑖𝑖𝑖𝑖𝑖𝑖𝑖𝑖𝑖𝑖𝑖𝑖𝑖𝑖𝑖𝑖𝑖𝑖𝑖𝑖
⎧
⎪𝑝𝑝𝑝𝑝𝑝𝑝𝑝𝑝𝑝𝑝𝑝𝑝𝑝𝑝 𝑖𝑖𝑖𝑖𝑖𝑖𝑖𝑖𝑖𝑖𝑖𝑖𝑖𝑖𝑖𝑖𝑖𝑖𝑖𝑖
𝑖𝑖𝑖𝑖 𝑐𝑐2 < 𝑦𝑦𝑖𝑖∗ ≤ 𝑐𝑐3
⎨ 𝑚𝑚𝑚𝑚𝑚𝑚𝑚𝑚𝑚𝑚𝑚𝑚𝑚𝑚𝑚𝑚 𝑐𝑐𝑐𝑐𝑐𝑐𝑐𝑐ℎ-𝑢𝑢𝑢𝑢 𝑡𝑡𝑡𝑡𝑡𝑡𝑡𝑡
⎪
⎩ 𝑠𝑠𝑠𝑠𝑠𝑠𝑠𝑠𝑠𝑠𝑠𝑠𝑠𝑠𝑠𝑠𝑠𝑠𝑠𝑠𝑠𝑠 𝑐𝑐𝑐𝑐𝑐𝑐𝑐𝑐ℎ-𝑢𝑢𝑢𝑢 𝑡𝑡𝑡𝑡𝑡𝑡𝑡𝑡
(A2)
𝑖𝑖𝑖𝑖 𝑐𝑐3 < 𝑦𝑦𝑖𝑖∗
That is, with regard to product innovations, we distinguish innovations in terms of the time
firms expect rivals to catch up with its most important product.
S2)
Catch-up time to the firm’s most important products: Average time a firm expects
it would take competitors to develop a rival product.
For innovating firms which answered that average excepted catch-up time is less
than one year take, this variable takes a value of one (“product innovation” in equation
(A2) above). For firms answering that the expected catch-up time is 1-5 years, this
variables takes a value of two (“moderate catch-up time” in equation (A2) above), and for
firms answering that the expected catch-up time is over 5 years, the variable takes a value
of three (“significant catch-up time” in equation (A2) above).
𝑐𝑐1 , 𝑐𝑐2 and 𝑐𝑐3 in equations (A1) and (A2) above are threshold parameters. We
specify the latent variable 𝑦𝑦𝑖𝑖∗ for firm i indicating the degree of significance of product
innovation as 𝑦𝑦𝑖𝑖∗ = 𝑋𝑋𝑖𝑖 𝛽𝛽 + 𝜀𝜀.
𝑋𝑋𝑖𝑖 is a vector of explanatory variables consisting of firms’ R&D intensity and
size as well as dummy variables representing firms’ organizational and human resource
management. R&D intensity, which is measured as the logarithm of the ratio of R&D
expenditure to total sales, is employed as a proxy for firms’ innovation inputs. Firm size,
which reflects access to finance, economies of scale and scope, differences in firm
organization such as vertical or horizontal integration, and so on, is measured as the
logarithm of a firm’s total sales in 2006.
However, the variables of main interest are the dummy variables representing firms’
organizational and human resource management. The definitions of these variables are the
same as those employed in the analysis in Section 5 and we prepare the following eight
dummy variables for firms’ management practices corresponding to O1, O2 and O3:
interdivisional cooperation/teams, interdivisional meetings/systems, board members with
an R&D background, personnel assessment reflecting R&D outcomes, incentive payments,
employment/re-employment
of
retired
22
researchers/engineers,
creation/relocation/integration
of
R&D
centers,
and
increased
authority
for
researchers/engineers. We also include industry dummies (based on the 18 industries
presented in Table 1).
The results of the ordered probit estimation (average marginal effects) for
equations (A1) and (A2) are shown in Appendix Tables 8 and 9, respectively. Appendix
Table 8 shows the marginal effects on product innovation (outcome=1) and on
new-to-the-market product innovation (outcome=2). The results are consistent with those
in Table 4, confirming that many of the organizational variables have a significant positive
marginal effect on the outcome and that the magnitude of the marginal effects are larger for
new-to-the-market
product
innovation
(outcome=2).
These
results
imply
that
organizational management is relevant for successful innovation and that it is even more
important for firms to achieve breakthrough innovation. However, again, the use of
incentive payments does not have a statistically significant effect. In addition, employment
or re-employment of retired researchers or engineers has a significant negative marginal
effect on product innovation.
Appendix Table 9 shows the marginal effects on product innovation for products
with a catch-up time of less than one year (outcome=1), of 1-5 years (outcome=2), and
with more than 5 years (outcome=3). Again, the results are consistent with those in Tables
4 and 5, and we find that many of the organizational variables have a significant positive
marginal effect on the outcome. The magnitude of the marginal effects tends to be larger
for product innovation with a 1-5 year catch-up time (outcome=2) than the other two cases
(outcome=1
and
outcome=3).
This
implies
that
while
improvements
in
organizational/human resource management may relatively easily increase the probability
of introducing innovative products with a moderate catch-up time, they do not readily
increase the probability of achieving breakthrough product innovation. However, only 71
firms (1.9%) out of the total 3,837 firms introduced an innovative product with a
significant catch-up time. Implementing personnel assessment reflecting R&D outcomes
has a marginal effect of 0.018, the largest among all the management practices, implying
that the implementation of this practice increases the probability of breakthrough
innovation by 1.8 percentage points, which is a very significant impact.
Moreover,
employment or re-employment of retired researchers or engineers has a significant
negative effect on product innovation, while incentive payments do not have a statistically
significant effect. These results are broadly consistent with those in Tables 4 and 5,
suggesting that employment or re-employment of retired researchers or engineers does not
raise firms’ likelihood of innovating. Rather, according to our ordered probit results,
employment or re-employment of retired researchers or engineers is negatively associated
with product innovation.
23
Table 1. Number of firms implementing different combinations of the three broad
categories of organizational and human resource management
Combinations (O1, O2, O3)
Number of firms (Total=3,837)
Product innovation
Product innovation
=Yes
= No
1,218 (100.0%)
2,619 (100.0%)
None (0, 0, 0)
205
(16.8%)
1463
(55.9%)
One
(1, 0, 0)
(0, 1, 0)
(0, 0, 1)
294
259
26
9
(24.1%)
(21.3%)
(2.1%)
(0.7%)
639
549
84
6
(24.4%)
(21.0%)
(3.2%)
(0.2%)
(1, 1, 0)
(1, 0, 1)
(0, 1, 1)
379
303
67
9
(31.1%)
(24.9%)
(5.5%)
(0.7%)
408
363
40
5
(15.6%)
(13.9%)
(1.5%)
(0.2%)
All (1, 1, 1)
340
(27.9%)
109
(4.2%)
Two
24
Table 2. Marginal effects of management practice combinations on innovation: Product
innovation and process innovation
Log of R&D/sales
Log of sales (2006)
Combination (0,1,0)
Combination (0,0,1)
Combination (0,1,1)
Combination (1,0,0)
Combination (1,1,0)
Combination (1,0,1)
Combination (1,1,1)
Industry dummies
No. of observations
Log pseudolikelihood
Chi^2
Wald test (rho=0)
Product innovation
dy/dx
s.e.
0.064
0.207
0.081
0.035
0.180
0.090
0.240
0.312
0.376
YES
3,837
-2,481.65
167.44 ***
12.42 **
0.083
0.206
0.159
0.040
0.030
0.065
0.028
Process innovation
dy/dx
s.e.
-0.259
0.173 *
**
***
***
***
0.138
0.467
0.119
0.315
0.269
0.396
0.382
YES
3,837
-2,444.68
314.69 ***
47.59 ***
0.067
0.177
0.126
0.025
0.022
0.054
0.022
*, **, and *** indicate significance at the 10%, 5%, and 1% level, respectively.
Reference group: firms with combination (0,0,0).
25
**
*
***
***
***
***
Table 3. Number of firms implementing organizational and human resource management
practices
Number of firms (Total=3,837)
Product innovation
=Yes
Total number of firms
Product innovation
=No
1,218
(100.0%)
2,619
(100.0%)
770
(63.2%)
677
(25.8%)
922
(75.7%)
982
(37.5%)
219
(18.0%)
73
(2.8%)
415
(34.1%)
155
(5.9%)
386
(31.7%)
222
(8.5%)
362
(29.7%)
399
(15.2%)
388
(31.9%)
129
(4.9%)
117
(9.6%)
54
(2.1%)
O1) Cooperation across business units
Interdivisional cooperation/teams
Interdivisional meetings/systems
O2) Human resource management
Board members with R&D background
Personnel assessment reflecting R&D
outcomes
Incentive payments
Employment or re-employment of retired
researchers or engineers
O3) Restructuring of R&D organaization
Creation/relocation/integration of R&D
centers
Increased authority for
researchers/engineers
26
Table 4. Marginal effects of management practices on innovation: Product innovation and
process innovation
Product innovation
selection: Implement R&D
Log of R&D/sales
Log of sales (2006)
dy/dx
-0.028
s.e.
0.230
Process innovation
selection: Implement R&D
dy/dx
-0.353
s.e.
0.250
Interdivisional cooperation/teams
Interdivisional meetings/systems
0.100
0.054
0.034 ***
0.037
0.139
0.176
0.030 ***
0.030 ***
Board members with R&D background
0.097
0.047 **
0.014
0.041
Personnel assessment reflecting R&D
outcomes
0.183
0.036 ***
0.085
0.034 **
Incentive payments
-0.024
0.036
-0.070
0.033 **
Employment or re-employment of retired
researchers or engineers
-0.039
0.035
-0.025
0.032
Creation/relocation/integration of R&D
centers
Increased authority for researchers/engineers
Industry dummies
No. of observations
Log pseudolikelihood
Chi^2
Wald test (rho=0)
0.140
-0.007
0.037 ***
0.087
0.033 ***
0.052
0.107
0.048 **
YES
YES
3,837
-2,466.21
182.97 ***
12.28 ***
3,837
-2,439.41
282.47 ***
37.4 ***
*, **, and *** indicate significance at the 5%, and 1% level, respectively.
27
Table 5. Marginal effects based on interval regression
Catch-up time
dy/dx
s.e.
-0.410
0.328
0.040
0.042
0.313
0.157 **
-0.253
0.198
0.376
0.179 **
0.469
0.147 ***
-0.090
0.157
Log of R&D/sales
Log of sales (2006)
Interdivisional cooperation/teams
Interdivisional meetings/systems
Board members with R&D background
Personnel assessment reflecting R&D outcomes
Incentive payments
Employment or re-employment of retired researchers or
engineers
0.092
0.164
Creation/relocation/integration of R&D centers
0.256
0.142 *
Increased authority for researchers/engineers
0.094
0.191
Industry dummies
No. of observations
Wald chi^2
YES
1,218
115.39
*, **, and *** indicate significance at the 10%, 5%, and 1% level, respectively.
28
Appendix Table 1. Number of firms by industry
Industry
ISIC Rev. 3.1
Manufacturing
Number of firms
1,589
Food products and beverages, tobacco products
15-16
121
Textiles; wearing apparel; dressing and dyeing of fur; tanning
and dressing of leather; manufacture of luggage, handbags,
saddlery, harnesses and footwear
17-19
104
Wood and products of wood and cork, except furniture;
articles of straw and plant materials; paper and paper
products; publishing, printing and reproduction of recorded
media
20-22
141
Coke, refined petroleum products and nuclear fuel;
chemicals and chemical products
23-24
134
Rubber and plastic products
25
102
Other non-metallic mineral products
26
62
27-28, 37
201
29
156
30-33
335
34-35
167
36
66
2,248
Basic metals and recycling; fabricated metal products,
except machinery and equipment
Machinery and equipment n.e.c.
Office, accounting and computing machinery; electrical
machinery and apparatus n.e.c.; radio, television and
communication equipment and apparatus; medical, precision
and optical instrument, watches and clocks
Motor vehicles, trailers and semi-trailers. Other transport
equipment.
Furniture, n.e.c.
Non-manufacturing
Agriculture, hunting and forestry, fishing, mining and
quarrying
1-2, 5, 10-11, 1314
104
Electricity, gas, heat supply and water
40-41
275
Wholesale and retail trade; repair of motor vehicles
50-52
825
Transport and storage; postal services
Telecommunications
Financial intermediation
Real estate; rental and leasing activities; business services
Total
60-64
64
65-67
70-74
327
246
163
308
3,837
29
Appendix Table 2. Descriptive statistics
Variable
Number of
observations
Innovation output
Product innovation
Process innovation
New-to-the-market product innovation
Expected catch-up time for most important
product
Explanatory variables
Log of R&D/sales
Log of sales in 2006
O1) Cooperation across business units
Interdivisional cooperation/teams
Interdivisional meetings/systems
O2) Human resource management
Board members with R&D background
Personnel assessment reflecting R&D
Incentive payments
Employment or re-employment of retired
O3) Restructuring of R&D organization
Creation/relocation/integration of R&D
Increased authority for researchers/engineers
Combination (O1, O2, O3)
Combination (0,1,0)
Combination (0,0,1)
Combination (0,1,1)
Combination (1,0,0)
Combination (1,1,0)
Combination (1,0,1)
Combination (1,1,1)
30
Mean
Std. dev.
Min
Max
3,837
3,837
3,837
0.317
0.571
0.444
0.466
0.495
0.708
0
0
0
1
1
2
3,837
0.517
0.828
0
3
3,837
3,837
0.006
7.919
0.039
1.946
0.000
0.000
1.684
16.203
3,837
3,837
0.377
0.496
0.485
0.500
0
0
1
1
3,837
3,837
3,837
3,837
0.076
0.149
0.158
0.198
0.265
0.356
0.365
0.399
0
0
0
0
1
1
1
1
3,837
3,837
0.135
0.045
0.341
0.206
0
0
1
1
3,837
3,837
3,837
3,837
3,837
3,837
3,837
0.029
0.004
0.004
0.211
0.174
0.028
0.117
0.167
0.062
0.060
0.408
0.379
0.165
0.321
0
0
0
0
0
0
0
1
1
1
1
1
1
1
Appendix Table 3. Correlation matrix (3,837 observations)
(1) Log of R&D/sales
(2) Log of sales (2006)
(1)
1.000
0.023
1.000
(3) Interdivisional cooperation/teams
0.103
0.299
1.000
(4) Interdivisional meetings/systems
(5) Board members with R&D
background
(6) Personnel assessment reflecting
R&D outcomes
(7) Incentive payments
(8) Employment or re-employment of
retired researchers or engineers
(9) Creation/relocation/integration of
R&D centers
0.084
0.259
0.649
1.000
0.123
0.231
0.270
0.246
1.000
0.132
0.257
0.371
0.380
0.422
1.000
0.106
0.292
0.335
0.362
0.365
0.495
1.000
0.052
0.135
0.302
0.340
0.274
0.311
0.344
1.000
0.111
0.284
0.359
0.327
0.365
0.440
0.362
0.261
1.000
0.066
0.051
0.194
0.177
0.148
0.265
0.166
0.171
0.296
1.000
(11) Combination (0,1,0)
-0.002
-0.055
-0.134
-0.171
0.016
-0.019
0.045
0.244
-0.068
-0.037
1.000
(12) Combination (0,0,1)
0.001
-0.001
-0.049
-0.062
-0.018
-0.026
-0.027
-0.031
0.134
0.088
-0.011
1.000
(13) Combination (0,1,1)
0.000
0.010
-0.047
-0.060
0.032
0.036
0.045
0.111
0.141
0.050
-0.010
-0.004
1.000
(14) Combination (1,0,0)
(15) Combination (1,1,0)
(16) Combination (1,0,1)
(17) Combination (1,1,1)
0.006
0.027
0.009
0.115
0.003
0.095
0.063
0.252
0.267
0.306
0.133
0.373
0.435
0.416
0.142
0.339
-0.148
0.151
-0.049
0.412
-0.216
0.285
-0.071
0.548
-0.224
0.378
-0.074
0.437
-0.257
0.473
-0.084
0.344
-0.204
-0.181
0.350
0.809
-0.112
-0.099
0.186
0.448
-0.089
-0.079
-0.029
-0.063
-0.032
-0.029
-0.011
-0.023
-0.031
-0.028
-0.010
-0.022
(10) Increased authority for
researchers/engineers
(2)
(3)
(4)
(5)
(6)
31
(7)
(8)
(9)
(10)
(11)
(12)
(13)
(14)
(15)
(16)
1.000
-0.237
-0.088
-0.188
1.000
-0.078
-0.167
1.000
-0.062
(17)
1.000
Appendix Table 4. Coefficients of Heckman probit estimation: Combination of the three
broad categories of organizational and human resource management
Log of R&D/sales
Combination (0,1,0)
Combination (0,0,1)
Combination (0,1,1)
Combination (1,0,0)
Combination (1,1,0)
Combination (1,0,1)
Combination (1,1,1)
Product innovation
selection=Implement R&D
coef.
s.e.
0.179
0.578
0.099
0.099
0.503
0.252
0.669
0.869
1.048
0.575
0.575
0.444
0.115
0.094
0.189
0.092
*
***
***
***
Selection equation (Dependent variable: Implementing R&D)
Log of sales (2006)
0.175
0.013 ***
Industry dummies
No. of observations
Rho
Wald test (rho=0)
Log pseudolikelihood
Chi^2
Process innovation
selection=Implement R&D
coef.
s.e.
-0.830
0.555
0.442
1.498
0.382
1.012
0.862
1.272
1.224
0.218
0.572
0.407
0.104
0.084
0.181
0.083
0.171
0.013 ***
YES
3,837
-0.24
12.42 ***
-2,481.65
167.44 ***
*, **, and *** indicate significance at the 10%, 5%, and 1% level, respectively.
32
**
***
***
***
***
***
YES
3,837
-0.49
47.59 ***
-2,444.68
314.69 ***
Appendix Table 5. Chi-square test on the weight of pairs of combinations: Product
innovation
(0,1,0)
(1,0,0)
(0,1,0)
(1,0,0)
n.a.
n.a.
(0,0,1)
n.a.
n.a.
n.a.
(1,0,1)
n.a.
n.a.
n.a.
n.a.
(1,1,0)
(0,1,1)
n.a.
n.a.
n.a.
n.a.
n.a.
n.a.
n.a.
n.a.
n.a.
n.a.
n.a.
(1,1,1)
n.a.
n.a.
n.a.
n.a.
n.a.
n.a.
(0,0,1)
n.a.
(1,0,1)
***
*
(1,1,0)
***
*
(0,1,1)
(1,1,1)
***
*
*
***
n.a.
* and *** indicate significance at the 10% and 1% level, respectively.
n.a.: Not applicable.
33
Appendix Table 6. Coefficient of Heckman probit estimation: Product and process
innovation
Log of R&D/sales
Interdivisional cooperation/teams
Interdivisional meetings/systems
Product innovation
selection=Implement R&D
dy/dx
s.e.
-0.078
0.636
0.278
0.096 ***
0.151
0.102
Process innovation
selection=Implement R&D
dy/dx
s.e.
-1.071
0.756
0.422
0.092 ***
0.533
0.097 ***
Board members with R&D background
Personnel assessment reflecting R&D
Incentive payments
Employment or re-employment of retired
0.269
0.507
-0.066
-0.109
0.130 **
0.100 ***
0.101
0.096
0.041
0.259
-0.211
-0.076
0.124
0.102 **
0.101 **
0.096
Creation/relocation/integration of R&D centers
Increased authority for researchers/engineers
0.387
-0.018
0.101 ***
0.145
0.264
0.323
0.100 ***
0.146 **
0.013 ***
0.172
0.013 ***
Selection equation (Dependent variable: Implementing R&D)
Log of sales (2006)
0.175
Industry dummies
No. of observations
Rho
Wald test (rho=0)
Log pseudolikelihood
Chi^2
YES
3,837
-0.22
12.28 ***
-2,466.21
182.97 ***
** and *** indicate significance at the 5% and 1% level, respectively.
34
YES
3,837
-0.38
37.40 ***
-2,439.41
282.47 ***
Appendix Table 7. Estimated marginal effects - IV probit model: Product innovation
(Endogenous variable=Log of R&D/sales)
IV: A dummy variable which takes one for firms that answered that products/services
became more diversified or the lifecycle of products/services became shorter
Coefficient
s.e.
Log of R&D/sales
-48.330
37.386
Log of sales (2006)
0.056
0.038
Interdivisional cooperation/teams
Interdivisional meetings/systems
0.503
0.403
0.193 ***
0.105 ***
Board members with R&D background
0.734
0.388 *
Personnel assessment reflecting R&D
outcomes
0.776
0.267 ***
0.274
0.183
Incentive payments
Employment or re-employment of retired
researchers or engineers
Creation/relocation/integration of R&D
centers
Increased authority for
researchers/engineers
Industry dummies
No. of observations
Wald chi^2
Wald test
-0.277
0.138 **
0.768
0.195 ***
0.327
0.227
YES
3,837
182.97 ***
12.28 ***
*, **, and *** indicate significance at the 10%, 5%, and 1% level, respectively.
35
Appendix Table 8. Estimated marginal effects - ordered probit model: New-to-the-market
innovation
Log of R&D/sales
Log of sales (2006)
Outcome: no product innovation (0)<product innovation
(1)<new-to-the-market product innovation (2)
Outcome=1
Outcome=2
(Observations: 731)
(Observations: 487)
dy/dx
s.e.
dy/dx
s.e.
0.087
0.047 *
0.114
0.061 *
0.010
0.002 ***
0.013
0.002 ***
Interdivisional cooperation/teams
Interdivisional meetings/systems
0.036
0.049
0.007 ***
0.007 ***
0.047
0.065
0.010 ***
0.010 ***
Board members with R&D background
0.024
0.010 **
0.031
0.012 **
Personnel assessment reflecting R&D
outcomes
0.043
0.008 ***
0.056
0.010 ***
Incentive payments
0.002
0.008
0.003
0.011
Employment or re-employment of
retired researchers or engineers
-0.012
0.007 *
-0.015
0.009 *
Creation/relocation/integration of R&D
centers
0.053
0.008 ***
0.070
0.010 ***
Increased authority for
researchers/engineers
0.029
0.012 **
0.038
0.016 **
Industry dummies
No. of observations
LR chi^2
R^2
YES
3,837
1,018.12
0.1611
*, **, and *** indicate significance at the 10%, 5%, and 1% level, respectively.
36
Appendix Table 9. Estimated marginal effects - ordered probit model: Catch-up time to
innovative products
Outcome: no product innovation (0) < product innovation (1) < moderate catch-up
time (2) < significant catch-up time (3)
Log of R&D/sales
Log of sales (2006)
Outcome=1
(Observations: 523 )
dy/dx
s.e.
0.053
0.030 *
0.006
0.001 ***
Outcome=2
(Observations: 624 )
dy/dx
s.e.
0.105
0.059 *
0.012
0.002 ***
Outcome=3
(Observations: 71)
dy/dx
s.e.
0.026
0.015 *
0.003
0.001 ***
Interdivisional cooperation/teams
Interdivisional meetings/systems
0.025
0.030
0.005 ***
0.005 ***
0.049
0.059
0.009 ***
0.010 ***
0.012
0.015
0.003 ***
0.003 ***
Board members with R&D backgroun
0.020
0.007 ***
0.039
0.013 ***
0.010
0.003 ***
Personnel assessment reflecting
R&D outcomes
0.037
0.006 ***
0.073
0.011 ***
0.018
0.003 ***
Incentive payments
0.003
0.005
0.006
0.011
0.002
0.003
Employment or re-employment of
retired researchers or engineers
-0.009
Creation/relocation/integration of
R&D centers
0.036
0.006 ***
0.071
0.010 ***
0.017
0.003 ***
Increased authority for
researchers/engineers
0.014
0.007 *
0.027
0.014 *
0.007
0.004 *
0.005 *
-0.017
0.009 *
YES
3,837
1,008.43
0.1579
Industry dummies
No. of observations
LR chi^2
R^2
*and *** indicate significance at the 10% and 1% level, respectively.
37
-0.004
0.002 *
DISCUSSION PAPER No.137
研究開発活動における組織・人事マネジメントがイノベーションに与える影響
2016 年 6 月
文部科学省 科学技術・学術政策研究所 第1研究グループ
羽田 尚子 伊藤 恵子
〒100-0013 東京都千代田区霞が関 3-2-2 中央合同庁舎第 7 号館 東館 16 階
TEL: 03-3581-2396 FAX: 03-3503-3996
The Effect of Organizational and Human Resource Management on Innovation
June 2016
Shoko HANEDA and Keiko ITO
First Theory-Oriented Research Group
National Institute of Science and Technology Policy (NISTEP)
Ministry of Education, Culture, Sports, Science and Technology (MEXT), Japan
http://doi.org/10.15108/dp137
http://www.nistep.go.jp
© Copyright 2026 Paperzz