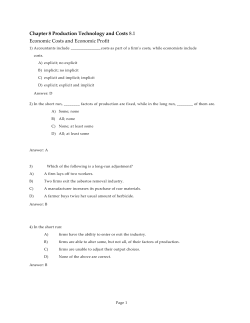
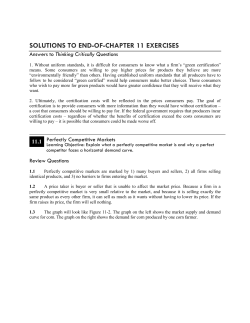
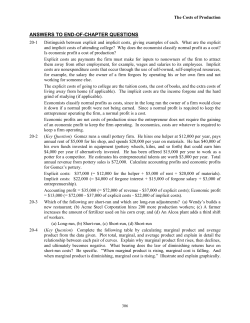
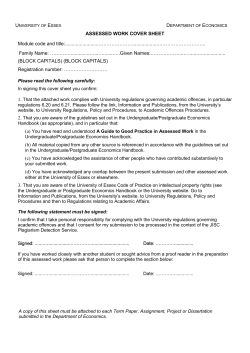
Econ 500 – Microeconomic Review – Demand What these notes hope to do is to do a quick review of supply, demand, and equilibrium, with an emphasis on a more quantifiable approach. Demand Curve (Big Picture) The whole point of a demand curve is to find the relationship between the price of a good and the quantity that consumers wish to purchase (the quantity demanded). Why does it matter? First off, a solid understanding of supply and demand is generally necessary to have an economic understanding of the world around you. Second, and as important, if firms have knowledge of the demand curve facing their firm, they will have the ability to make more informed pricing and output decisions. These decisions that will directly affect the firm’s profitability. This will be particularly true of firms with pricing power (monopoly power). For even more background, read the textbook. I am going to assume that you have some understanding of the 1st Law of Demand. The 1st Law of Demand states, “ceteris paribus (holding other relevant factors constant), as the price of a good falls, the quantity demand of that good increases.” Basically, it states that demand curves are downward sloping. Interpretations of the Demand Curve There are two different ways you can interpret the information given in a demand curve. Horizontal Interpretation of Demand Curve - this is the interpretation of the demand curve you are most likely familiar with. The idea here is to pick a price, then move (horizontally) over to the demand curve. For example, if the price of a Honda Accord is $22,000, the quantity demanded of Honda Accords might be 450,000. That is, if the price is $22,000, consumers will wish to purchase 450,000 cars. Likewise, if the price of a Honda Accord is $20,000, the quantity demanded might be 500,000. See the graph below. The reason we call this the horizontal interpretation should be apparent. PACCORD $22,000 $20,000 Demand 450,000 500,000 QACCORD Vertical Interpretation of Demand Curve – this will be less familiar, and will come in handy when discussing consumer surplus, and later when we discuss price discrimination and other pricing strategies. The idea here is to pick a quantity, then move (vertically) up to the demand curve. We sometimes call the result the “height of the demand curve”. See the picture below. 1 Econ 500 – Microeconomic Review – Demand For instance, if the height of the demand curve facing a specialized pizza store at Q = 20 is $17, this means that the most a consumer will be willing to pay for the 20th pizza is $17.1 Likewise, if the height of the demand curve at Q = 25 is $13, this means the most a consumer will be willing to pay for the 25th pizza is $13.2 PPIZZA $17 $13 Demand 20 25 QPIZZA As eluded to above and in the previous footnote, price discrimination is a strategy where firms will try to charge different customers different prices. If the firm can come up with a way to charge the first consumer $17 and the other consumer $13, it will earn more revenue than if it charges a price of $17 (only the 1st consumer will purchase the pizza) or a price of $13 (both consumers purchase the good). Of course, we could use either interpretation on a demand curve, depending in which type of problem we are interested. We could have asked what is the most a consumer will be willing to pay for the 450,000th or the 500,000th Honda Accord.3 Likewise, we could ask how many pizzas that consumers will wish to purchase at a price of $13 or $17.4 Which interpretation we choose does not change the underlying demand curve. As you progress, you will find it makes more sense to use one interpretation or the other depending on the problem we are dealing with. 1 This consumer would be willing to purchase the 20th pizza for any price less than $17, but will not pay any price higher than $17. We sometimes call the height of the demand curve the marginal benefit, marginal value, or marginal willingness to pay. 2 If you recall the difference between an individual consumer’s demand curve and the market demand curve, we are discussing the market demand curve in this case. We know that individual’s demand curves are downward sloping. Individually, you would be willing to pay more for the 20th pizza then you would for the 25th pizza. Are you still hungry? However, when we look at the market (overall) demand curve for a product, we have combined every person’s individual demand curve. The consumer who was willing to pay $17 for the 20th and the consumer who was willing to pay $13 for the 25th pizza are likely to be different people, a point we shall revisit when we discuss price discrimination. 3 Some consumer would be willing to pay $22,000 for the 450,000th Honda Accord and some other consumer would be willing to pay $20,000 for the 500,000th Honda Accord. In this case, I am very sure these are different consumers. Do you know anyone who owns 50,000 Honda Accords? 4 Hopefully not surprisingly, the answers here are 25 and 20, respectively. 2 Econ 500 – Microeconomic Review – Demand Ceteris Paribus Conditions for Demand Curves Thus far, we have glossed over the 1st Law of Demand and the ceteris paribus conditions for demand. Some more very deep background that you should have learned before... If, we were interested in the important factors determining the number of cars sold, surely the price of cars would be important. This is exactly what we hope to capture with a demand curve. A demand curve illustrates how the quantity of cars consumers wish to purchase changes as the price of cars changes, holding other relevant factors constant.5 On the other hand, many other things (aside from the price of cars) affect the number of cars people wish to purchase. We call these other things “demand shifters” or “ceteris paribus conditions for demand”. In order to draw a demand curve (to isolate the relationship between the own price of a car and the quantity demanded of cars), we must hold the ceteris paribus conditions constant. On the other hand, when one of these ceteris paribus conditions changes, we must shift the demand curve in the appropriate direction. What are these “demand shifters” or ceteris paribus conditions for the demand for cars? Just to name a few: Price of gasoline / insurance / tires, price of trucks / bicycles / public transportation, incomes of consumers, quality and characteristics of cars, expectations about future car prices, … More in the next section... Mathematical Expressions of Demand Curves The following section borrows heavily from Baye’s Chapter 2, and uses the notation therein. We can learn something from mathematicians. Here is what they would write: Q xd = f ( Px , Py , M , H ) d What does it mean? It means the quantity demanded of good X ( Qx ) is a function of, or depends on, the price of good X ( Px ) the price of related goods ( Py ), the income level of consumers ( M ) and other stuff ( H ). In fact, we can get even more specific about the form of the relationship. While it is not necessarily the case, we often model demand curves as being linear.6 If so, we can write out a very simple numerical expression of a demand curve. For example: Q xd = 100 − 12 Px − 2 Py + 6 M 5 If you recall from your previous economics classes, in this case, we would call the price of the car the “own price”. The own price is the price of the good for which we are drawing the demand curve. 6 A linear demand curve is one with a constant slope of the demand curve. Mathematically, this means the power (exponent) on the Px term is (implicitly) 1. We will focus on linear demand curves in this class. As an example of a non-linear demand curve, consider Q x = 100 − d 1 2 Px2 − 2 Py + 6 M . 3 Econ 500 – Microeconomic Review – Demand We will call this a demand function. The demand function contains a whole slew of information. First off, suppose you were told to draw the demand curve for good X. You would pull out a piece of graph paper, label the vertical axis Px , the horizontal axis Q x , and then you would be stuck.7 In fact, you cannot draw the demand curve without knowing the values of Py and M , which are the ceteris paribus conditions for demand. Suppose you were told that M = 10 and Py = 30. In that case, you could simplify the demand function to the point where you could draw it.8 Q xd = 100 − 12 Px − 2 Py + 6 M Q xd = 100 − 12 Px − 2(30) + 6(10) Q xd = 100 − 12 Px − 60 + 60 Q xd = 100 − 12 Px d Now, your demand function is expressed with only Qx and Px . You can graph it, which we will do in a bit. Before doing this, though, let us take an aside on the inverse demand function. Aside Inverse Demand Function It turns out it will save us some trouble to find what is called the inverse demand function. To find the inverse demand function, simply start with the demand function, and solve it for Px . In the case where M = 10 and Py = 30, we start with: Q xd = 100 − 12 Px Now we just do the algebra. You can take whatever steps get you to the end. I will begin by adding 1 2 Px to both sides: Q xd + 12 Px = 100 d Then subtract Qx from both sides: 1 2 Px = 100 −Q dx And multiply both sides by 2: 7 d Why not label it Qx ? You could. Eventually, we will have the quantity of good X supplied, as well, so often we will just be lazy and label it Q x . 8 It is just a coincidence in this case that the last two terms in the demand function cancel out. This will not always be the case. See also below the examples for when M and Py change. 4 Econ 500 – Microeconomic Review – Demand Px = 200 − 2Q dx Why have I done this? First off, you will see in a second that it is now very easy to find a second point on our demand curve. In addition, this expression will come in handy when we find the marginal revenue curve for the firm. Graphing the Demand Function Recall from out demand function that Q x = 100 − d 1 2 Px . By plugging in Px = 0 in the expression above, d x we find that Q = 100. This is one point on our demand curve. In fact, this is the horizontal intercept of the demand curve. We also solved for the inverse demand function, finding that Px = 200 − 2Q x . By plugging in Qx =0, d d we find that Px =200. It turns out this is the vertical intercept of the demand curve. Because we have a linear demand function, to draw the line, we need only find two points on the line, which we have just done. Put these two points on a graph, connect the dots, and we are finished. See below. PX $200 D 100 QX 5 Econ 500 – Microeconomic Review – Demand Shifting the Demand Curve What if M increases from $10 to $20? What happens to the demand curve? From a mathematical perspective, we can just plug and chug. But we would also like to go back to the intuitions as well. First the math… Q xd = 100 − 12 Px − 2 Py + 6 M Q xd = 100 − 12 Px − 2(30) + 6(20) Q xd = 100 − 12 Px + 60 Q xd = 160 − 12 Px (compare this to Q x = 100 − d 1 2 Px ) When we change the demand function, we will also get a new inverse demand function. Taking the same steps as before (but leaving out the explanation of these steps), we get: Q xd = 160 − 12 Px Q xd + 12 Px = 160 1 2 Px = 160 −Q dx Px = 320 − 2Q dx Now, we draw the new demand curve. From the demand function, I see that setting Px = 0 in the d d expression above results in Qx = 160. From the inverse demand function, I see that setting Qx = 0 results in Px =320. Now we stick these new points on our graph paper. Below is a picture with the original demand curve ( M = $10) labeled D0 and the new demand curve ( M = 20) labeled D1. We see immediately what has happened is that the demand curve has shifted to the right because of the increase in income. We call a rightward shift of the demand curve an “increase in the demand curve”.9 Likewise, we call a leftward shift of the demand curve a “decrease in the demand curve”. Again, any change in a ceteris paribus conditions shifts the demand curve. That is, a change in anything but the own price, causes a shift in the demand curve. 9 Why is this called an increase in the demand curve? From the horizontal interpretation of the demand curve, notice that at any (and every) price, there is a larger quantity demanded on the new demand curve than there is on the old demand curve. 6 Econ 500 – Microeconomic Review – Demand PX $320 $200 D0 100 D1 200 QX Some exercises, you ask? Start with original demand curve and if M fell to $5? M = $10 and Py = $30. What would happen to the demand curve 10 Start over at the original values. What would happen if the price of good Y fell to $20?11 Start over at the original values. What would happen if the price of good Y rose to $40?12 More on Ceteris Paribus Conditions In our original demand shift, an increase in M from $10 to $20 results in an increase in the demand for the good. That is, an increase in income has lead to an increase in income. In fact, this tells us that good X is a normal good. But we also want to hone your intuition. We can make predictions about what happens to the demand curve without knowing anything about the actual mathematics of the demand curve. Now is the time for a review of our ceteris paribus conditions. Our focus will be on how changes in our ceteris paribus conditions shift the demand curve. 10 The demand curve decreases (shifts left). The new vertical intercept would be $140 and the new horizontal intercept would be 70. 11 The demand curve increases (shifts right). The new vertical intercept would be $240 and the new horizontal intercept would be 120. 12 The demand curve decreases (shifts left). The new vertical intercept would be $160 and the new horizontal intercept would be 80. 7 Econ 500 – Microeconomic Review – Demand Generally speaking, the ceteris paribus conditions can be classified into a few major groups” 1. Price of Related Goods – Substitutes and Complements. 2. Income of Consumers – Normal or Inferior Goods 3. Expectations of Future Prices 4. Other Stuff Prices of Related Goods Complements are things that are used together. The classic example is peanut butter and jelly. In the car example, cars and gas and cars and insurance would be complements. Substitutes are alternatives. The classic example is butter and margarine. In the car example, car and trucks and are substitutes and cars and public transportation would also be substitutes. Substitutes You tend to know them when you see them, but the definitions are as follows: Goods A and B are called substitutes, if, when the price of good A changes, the quantity demanded (demand curve) for good B changes in the same direction. Say we examine Coke and Pepsi, which are substitutes. If the price of Coke increases, the demand for Pepsi will increase. Why? Because people will substitute from drinking Coke (whose price has increased) to drinking Pepsi. When the price of Coke rises, at each and every price of Pepsi (the horizontal interpretation of a demand curve), there will be a larger quantity demanded of Pepsi on the new demand curve than the original demand curve. The change in the price of coke has caused the demand curve for Pepsi to shift to the right (an increase in demand). In the car example, if the price of trucks rise, the demand for cars will increase (shift right). If the price of public transportation falls, the demand for cars will decrease (shift left). Had two ugly errors here Complements Goods A and B are called complements, if, when the price of good A changes, the quantity demanded (demand curve) for good B changes in the opposite direction. Consider ink cartridges and printers. If the price of ink cartridges increases, the demand for printers will shift to the left, or decrease. Why? People will realize the overall cost of printing will have increased, and thus will cut back on their printer purchases In the car example, an increase in the price of gas will decrease the demand for cars. A decrease in the price of car insurance would increase the demand for cars. The Numerical Example Recall our original expression of the demand function: 8 Econ 500 – Microeconomic Review – Demand Q xd = 100 − 12 Px − 2 Py + 6 M Believe it or not, that expression tells us if the goods X and Y are complements. How can you tell? For every $1 increase in the price of good Y, the quantity demanded of good X falls by 2 units. This means the price of good Y and the quantity demanded of good X are changing in the opposite direction. From this, we can conclude the goods are complements. In fact, it is the sign (not the magnitude) on the Py term that tells us this. In this case, we have − 2 Py in the expression (the sign is negative), indicating complements. If for example, the demand function were instead Q xd = 100 − 12 Px + 3Py + 6 M then X and Y would be substitutes.13 Not convinced? Go back to the example where the Py decreased to $20. What happened to the demand curve for cars? What happened to the demand curve when Py increased to $40? Income Normal Goods Good A is called a normal good, if, when the incomes of consumers changes, the quantity demanded (demand curve) for good A changes in the same direction. Examples of normal goods include Saints tickets, steak dinners, SUVs, almost everything else. An increase in the incomes of Saints fans will increase the demand for Saints Tickets (shift right). A decrease in the incomes of SUV consumers will decrease the demand for SUVs (shift left). Inferior Goods Good A is called an inferior good, if, when the incomes of consumers changes, the quantity demanded (demand curve) for good A changes in the opposite direction. Examples of inferior Goods include Ramen Noodles, SPAM, Mad Dog 20/20, used underwear. An increase in the incomes of consumers will decrease the demand for Ramen Noodles (shift left). A decrease in the incomes of consumers will increase the demand for SPAM (shift right). 13 If you are wondering about the meaning of the magnitude of the coefficient on the Py term, that is a good thing to wonder. The magnitude of the coefficient indicates how closely related the goods are. A large coefficient (in absolute value or further from zero) indicates the goods are closely related. If we considered the demand for Pepsi, substitutes for Pepsi that might be included are the price of Coke and the price of orange juice. But the demand for Pepsi will be more sensitive to the price of Coke than the price of orange juice. Thus, we would expect a larger coefficient on PCOKE then POJ, even though both would be positive. More when we get to elasticities. 9 Econ 500 – Microeconomic Review – Demand The Numerical Example The logic is the same as above. A positive coefficient on the M (in this case we have 6 M ) in the demand function indicates that a one unit increase in income leads to a 6 unit increase in the quantity demanded of good X. This is consistent with a normal good. A negative coefficient on the M term in the demand functions indicates inferior goods, as M and the demand curve for good X change in the opposite direction.14 Not convinced? See the example above about from $10 to $5. M increasing from $10 to $20 or the exercise decreasing Expectations of Future Prices Quite simple. When people expect prices to fall in the future, the (current) demand falls. People delay their purchases. When people expect prices to rise in the future, the (current) demand rises. People try to act ahead of the price increases. This becomes interesting for firms that regularly schedule sales. On the one hand, the sale itself would tend to increase purchases (while the sale occurs) according to the 1st Law of Demand. On the other hand, if people expect the sale, they may curtail their purchases in the period leading up to the sale. Automakers with their model year-end closeout? “Last-year's” fashions? The hardback version of a book before the paperback comes out? Microsoft Vista? Dollar movie theaters? Everything Else I do not mind writing notes, but I do not want to write forever! Many other things can shift a demand curve. Consumer Surplus The height of the demand curve tells us the maximum amount a consumer is willing to pay for a unit of the good. But very seldom does this consumer actually pay this amount. If there is a gap between the two, we call this gap consumer surplus. Consumer Surplus = Amount consumer is willing to pay - the amount they had to pay Can we find this are graphically? We can. From the vertical interpretation of a demand curve, we know that the height of a demand curve at some quantity tells us the maximum amount a consumer was willing to pay. If we compare this to the price on the graph, we have consumer surplus. Let’s go back to the pizza example, only we will add in some additional information and assume the price of pizza is $11. We can calculate the consumer surplus enjoyed for each individual unit of pizza consumed. 14 Again, the magnitude determines how sensitive consumption of that good is to changes in income. Consider Kraft Mac & Cheese and restaurant meals. I believe both Mac & Cheese and restaurant meals are normal goods, and thus both will have positive coefficients on M in their respective demand functions. I would also expect the coefficient on M in the demand function for Mac & Cheese to be close to zero, while the coefficient on M in the demand function for restaurant meals to be larger. When people win the lottery, they do not a bunch more Mac & Cheese than they used to, but people likely do buy a bunch more restaurant meals than they used to. More when we get to elasticities. 10 Econ 500 – Microeconomic Review – Demand For example, at Q = 15, the height of the demand curve is $21, while the price is $11, so consumer surplus is $10 ($21 - $11 = $9). The idea is this consumer is getting a “deal”. They would have paid $10 more than they had to. The larger the consumer surplus, the larger is the welfare (happiness) of consumers. At Q = 20, the demand curve tells us the consumer is willing to pay $17, while the price is only $11, leaving consumer surplus of $6. It should be easy for you to calculate consumer surplus on the 25th pizza.15 PPIZZA $21 $17 $13 $11 Demand 15 20 25 QPIZZA Adding consumer surplus up for each individual unit of the goods gets very tedious. Fortunately there is a calculus trick. In general, if you want to add up the total consumer surplus for consuming Q units (where Q can be any quantity), simply add up the entire area that is (1) under the demand curve, (2) above the price that consumers pay, and (3) out to the quantity Q. See the picture below. This will come in very handy when we talk about price discrimination. As a firm, wouldn’t you want to try to charge everyone the maximum they are willing to pay? 15 Consumer surplus is $2, as the consumer is willing to pay (the height of the demand curve) $13, while the price is $11. Consumer surplus is $13 - $11 = $2. 11 Econ 500 – Microeconomic Review – Demand P Consumer Surplus P Demand Q Q 12 Econ 500 – Microeconomic Review – Supply Supply Curve (Big Picture) The whole point of a supply curve is to find the relationship between the price of a good and the quantity that firms wish to produce (the quantity supplied). I am going to assume that you have some understanding of the 1st Law of Supply. The 1st Law of Supply states, “ceteris paribus (holding other relevant factors constant), as the price of a good rises, the quantity supplied of that good increases.” Basically, it states that supply curves are upward sloping. Interpretations of the Supply Curve There are two different ways you can interpret the information given in a supply curve. Horizontal Interpretation of Supply Curve - this is the interpretation of the supply curve you are most likely familiar with. The idea here is to pick a price, then move (horizontally) over to the supply curve. For example, if the price of a car is $22,000, the quantity supplied of cars might be 450,000. That is, if the price is $22,000, firms will wish to produce 450,000 cars. Likewise, if the price of a car is $24,000, the quantity supplied might be 500,000. See the graph below. The reason we call this the horizontal interpretation should be apparent. PCAR Supply $24,000 $22,000 450,000 500,000 QCAR Vertical Interpretation of Supply Curve – again, less familiar, and will be discussed in greater detail when it comes to cost curves. Just as the demand curve illustrated the highest price a consumer would be willing to pay, a supply curve illustrates the lowest price a firm would be willing to accept to produce the good. The idea here is still to pick a quantity then move (vertically) up to the supply curve. We sometimes call the result the “height of the supply curve”. See the picture below. For instance, if the height of the supply curve facing a specialized pizza store at Q = 20 is $15, this means that the least a firm will be willing to accept to produce the 20th pizza is $15.1 1 This producer would be willing to produce the 20th pizza for any price above $15, but will not produce for any price less $15. The height of the supply curve is called the marginal cost of producing, a term we will return to in our discussion of cost curves. 1 Econ 500 – Microeconomic Review – Supply Likewise, if the height of the supply curve at Q = 25 is $19, this means the least a firm would be willing to accept for the 25th pizza is $19.2 PPIZZA Supply $19 $15 20 25 QPIZZA And as was case for demand, we can use either interpretation of a supply curve, depending in which type of problem we are interested. We could have asked what is the least a firm would have been willing to accept to produce the 450,000th or the 500,000th car.3 Likewise, we could ask how many pizzas that firms will wish to purchase at a price of $15 or $19.4 Which interpretation we choose does not change the underlying supply curve. As you progress, you will find it makes more sense to use one interpretation or the other depending on the problem we are dealing with. Ceteris Paribus Conditions for Supply Curves Thus far, we have glossed over the 1st Law of Supply and the ceteris paribus conditions for supply. Some more very deep background that you should have learned before... If, we were interested in the important factors determining the number of cars produced, surely the price of cars would be important. This is exactly what we hope to capture with a supply curve. A supply curve illustrates how the quantity of cars that firms wish to produce changes as the price of cars changes, holding other relevant factors constant.5 2 If you recall the difference between an individual firm’s supply curve and the market supply curve, I want to be discussing the market supply curve in this case. We know that individual’s supply curves are upward sloping. When we look at the market (overall) supply curve for a product, we have combined every firm’s individual supply curve. It may or may not be the case that the firm that was willing to produce the 20th unit for $15 is the same firm that is willing to produce the 25th pizza. More later… 3 Some firm would be willing to produce the 450,000th car for $22,000 and some firm (could be the same firm or a different firm) would be willing to produce the 500,000th car for $24,000. 4 Hopefully not surprisingly, the answers here are 20 and 25, respectively. 5 If you recall from your previous economics classes, in this case, we would call the price of the car the “own price”. The own price is the price of the good for which we are drawing the supply curve. 2 Econ 500 – Microeconomic Review – Supply On the other hand, many other things (aside from the price of cars) affect the number of cars firms wish to produce. We call these other things “supply shifters” or “ceteris paribus conditions for supply”. In order to draw a supply curve (to isolate the relationship between the own price of a car and the quantity supplied of cars), we must hold the ceteris paribus conditions constant. On the other hand, when one of these ceteris paribus conditions changes, we must shift the supply curve in the appropriate direction. What are these “supply shifters” or ceteris paribus conditions for the supply of cars? Just to name a few: Price of steel / wages of workers, price of trucks, technology of producing, expectations about future car prices. More in the next section... Mathematical Expressions of Supply Curves We revisit our friends the mathematicians. Here is what they would write: Q xs = f ( Px , Pr , W , H ) s What does it mean? It means the quantity supplied of good X ( Qx ) is a function of, or depends on, the price of good X ( Px ) the price of technologically related goods ( Pr ), the price of inputs ( W ) and other stuff ( H ).6 While it is not necessarily the case, we often model supply curves as being linear.7 If so, we can write out a very simple numerical expression of a demand curve. For example: Q xs = 70 + 13 Px − 2 Pr − 5W We will call this a supply function. The supply function contains a whole slew of information. If you were told to draw the supply curve for good X, again you would pull out a piece of graph paper, label the vertical axis Px , the horizontal axis Q x , and would be stuck.8 In fact, you cannot draw the supply curve without knowing the values of Pr and W , which are the ceteris paribus conditions for supply. 6 Why W for the price of inputs? One of the main inputs that firms use is labor, and the price of this input is called a wage. In short, W is to remind us of wages. Baye’s textbook slips once and uses PW to refer to wages. Also, the items in H , the other stuff, will be different things for supply curves than they were for demand curves. 7 A linear supply curve is one with a constant slope of the supply curve and therefore the power (exponent) on the Px term is (implicitly) 1. We will focus on linear supply curves in this class. As an example of a s non-linear supply curve, consider Q x = 70 + 13 Px3 − 2 Pr − 5W . 3 Econ 500 – Microeconomic Review – Supply Suppose you were told that W = 8 and Pr = 5. You could simplify the supply function to the point where you could draw it. Q xs = 70 + 13 Px − 2 Pr − 5W Q xs = 70 + 13 Px − 2(5) − 5(8) Q xs = 70 + 13 Px − 10 − 40 Q xs = 20 + 13 Px Now, your supply function is expressed with only Q xs and Px as unknowns. Aside Inverse Supply Function You guessed it, you can solve for an inverse supply function. Not as useful as the inverse demand function, but it will help a bit on the graphing. To find the inverse supply function, simply start with the supply function, and solve it for Px . In the case where W = 8 and Pr = 5, we start with: Q xs = 20 + 13 Px Now we just do the algebra. You can take whatever steps get you to the end. I will begin by subtracting 20 from both sides: Q xs − 20 = 13 Px Then multiply each side by 3. 3Q xs − 60 = Px And then just rearrange the terms: Px = −60 + 3Q xs Graphing the Supply Function s A bit trickier than demand functions in most cases. Recall from out supply function that Q x By plugging in = 20 + 13 Px . Px = 0 in the expression above, we find that Qxs = 20. This is one point on our supply curve. In fact, this is the horizontal intercept of the supply curve. We also solved for the inverse supply function, finding that Px find that = −60 + 3Q xs . By plugging in Qxs =0, we Px = -60. Technically, this is the vertical intercept of the supply curve. But is any firm going to pay their customers $60 for their product? There is no such thing as a negative price. Let’s look at what we’d have on a graph thus far. 8 s Why not label it Qx ? You could. Eventually, we will combine the demand curve and supply curve, and thus we will just lazy and label it Q x . 4 Econ 500 – Microeconomic Review – Supply PX Supply QX 20 -$60 However, as you can see, this information still helps us out in drawing the picture. But as we hinted at above, only the portion of the supply curve in the positive quadrant (with positive price and positive quantity) is going to be relevant. Se we’ll end up discarding that lower (dotted) portion of the supply curve. PX Supply $240 20 100 QX Sometimes is helps to throw in one more point. You’ll see above, I’ve chosen Q = 100, at random, and stuck that on the graph as well. If we plug in Q = 100 to the inverse supply function, we see: Px = −60 + 3Q xs Px = −60 + 3(100) Px = 240 5 Econ 500 – Microeconomic Review – Supply Shifting the Supply Curve What if W decreases from $8 to $4? What happens to the supply curve? First the math, then the intuition. Q xs = 70 + 13 Px − 2 Pr − 5W Q xs = 70 + 13 Px − 2(5) − 5(4) Q xs = 70 + 13 Px − 10 − 20 Q xs = 40 + 13 Px (compare this to Q xs = 20 + 13 Px ) When we change the supply function, we will also get a new inverse supply function. Taking the same steps as before (but leaving out the explanation of these steps), we get: Q xs = 40 + 13 Px Q xs − 40 = 13 Px 3Q xs − 120 = Px Px = −120 + 3Q xs Now, we draw the new supply curve. From the supply function, I see that setting above results in s x Px = 0 in the expression s x Q = 40. From the inverse supply function, I see that setting Q = 0 results in Px =-120. Not much help there. So let me stick in Qxs = 100 in the inverse supply function and I’ll get Px = 180. Now we stick these new points on our graph paper. Below is a picture with the original supply curve ( W = $8) labeled S0 and the new supply curve ( W = 4) labeled S1. We see immediately what has happened is that the supply curve has shifted to the right because of the decrease in wages. Just as we did with demand curves, we call a rightward shift of the supply an “increase in the supply curve”.9 We call a leftward shift of the supply curve a “decrease in the supply curve”. Again, any change in a ceteris paribus conditions shifts the supply curve. That is, a change in anything but the own price, causes a shift in the supply curve. One more note: having discussed both demand curves and supply curves at this point, it is worth noting that most changes affect only the demand curve or the supply curve. There are separate lists of ceteris paribus conditions for demand and ceteris paribus conditions for supply. A change in wages will shift the supply curve, but not the demand curve. A change in the income of consumers will shift the demand curve, but not the supply curve. However, every so often something comes about that shifts both the supply curve and the demand curve, but these are fairly rare.10 9 Why is this called an increase in the supply curve? From the horizontal interpretation of the supply curve, notice that at any (and every) price, there is a larger quantity supplied on the new supply curve than there is on the old supply curve. 10 An example might be the discovery of AIDS in the market for prostitution. This would affect both suppliers of prostitution services and the customers of prostitution services. Expectations about future prices will also affect both supply and demand. 6 Econ 500 – Microeconomic Review – Supply PX S1 S0 $240 $180 QX 20 40 100 Some exercises, you ask? Start with original supply curve and W = $8 and Pr = $5. What would happen to the supply curve if W rose to $12?11 Start over at the original values. What would happen if the price of the related good ( Pr ) fell to $2?12 Start over at the original values. What would happen if the price of the related good ( Pr ) rose to $8?13 More on Ceteris Paribus Conditions In our original supply shift, a decrease in W from $8 to $4 resulted in an increase in the supply for the good. That is, a decrease in an input price has led to an increase in supply. But we also want to hone your intuition. We can make predictions about what happens to the supply curve without knowing anything about the actual mathematics of the supply curve. Now is the time for a review of our ceteris paribus conditions. Our focus will be on how changes in our ceteris paribus conditions shift the supply curve. 11 The supply curve decreases (shifts left). The new vertical intercept would be horizontal intercept would also be Px = $0 and the new Qxs = 0 (the supply curve starts at the origin). Px = $300 and Qxs = 100 would be another point. 12 The supply curve increases (shifts right). The new vertical intercept would be -$84 and the new s horizontal intercept would be Qx = 26. 13 Px = $216 and Qxs = 100 would be another point. The supply curve decreases (shifts left). The new vertical intercept would be -$42 and the new horizontal intercept would be Qxs = 14. Px = $258 and Qxs = 100 would be another point. 7 Econ 500 – Microeconomic Review – Supply Generally speaking, the ceteris paribus conditions for Supply can be classified into a few major groups” 1. Input Prices 2. Prices of Technologically Related Goods (substitutes and complements in production) 3. Expectations of Future Prices 4. Other Stuff Input Prices With input prices, a mix of the vertical interpretation of the supply curve and the horizontal interpretation of the supply curve is necessary. Consider, as we did above, a decrease in wages, one of the firm’s input prices. That is, consider a decrease in an input price. It stands to reason that a firm would now be willing to accept a lower price to produce the good. Why? We know a firm, broadly speaking, won’t produce a good unless it covers it costs. Because the cost of production is decreasing, the firm can accept a lower price (and still cover it costs). For example, if the height of the old supply curve at some quantity Q was $12, and now wages fall, the firm might accept $11 to produce the Qth unit of the good. More generally, because the height of the supply curve tells us the lowest price a firm will accept to produce a good, a decrease in an input price will cause the supply curve to shift down, vertically.14 See the picture below. PX Supply Supply’ Q QX But as soon as we see this picture, we want to go back to the horizontal interpretation of supply curve. When we discuss increases in supply or decreases in supply, we want you think of these as changes as shifts to the right or left (not up or down). So if you were presented with the picture shown below (the same two supply curves), and you were forced to describe it using the horizontal interpretation of a supply curve, hopefully you would conclude there has been a shift to the right of the supply curve, which we call an increase in supply. 14 If you are comfortable interpreting supply curves as marginal cost curves, than all we are saying is the marginal cost of production is reduced at each level of output. The supply curve (marginal cost curve) shifts down vertically. 8 Econ 500 – Microeconomic Review – Supply PX Supply Supply’ Q QX At the end of the day, a decrease in an input price leads to a rightward shift of the supply curve (an increase in supply). An increase in an input price leads to a shift to the left of the supply curve (a decrease in supply). Don’t believe me? Go back to the example above where we change the wage from $8 to $4. You’ll see we had a rightward shift of the supply curve. Finally, for an increase in an input price, do the exercise where I suggested an increase in the wage from $8 to $12. More examples? What happens to the supply curve for pizza if there is a decrease in the price of tomato sauce?15 What happens to the supply curve for cars if there is an increase in the price of steel?16 Prices of Technologically Related Goods Technological Complements Technological complements are things that are produced together. Let’s imagine for expositional purposes that every time a donut is produced, a donut hole is also produced. Another example would be that at a slaughterhouse, every time a cow is slaughtered, there is both beef and a hide produced. Any situation in which a “byproduct” is involved would be an example of technological complements. The main idea is that production of the one good might be influenced by the price of the other, because the production of both goods is linked. A more formal definition: Goods A and B are called technological complements, if when the price of good A increases, the quantity supplied of Good B changes in the same direction. Examples: If the price of donut holes increases, the firm will react by increasing the quantity supplied of donuts (increase in supply). 15 The supply curve increases (shifts right). 16 The supply curve decreases (shifts left). 9 Econ 500 – Microeconomic Review – Supply If the price of beef decreases, a firm would decrease the quantity of hides it will produce (decrease in supply). Technological Substitutes Technological substitutes are alternative products. General motors can use its equipment to produce compact cars or SUVs. A donut shop could produce crème filled donuts or danishes. Goods A and B are called technological substitutes, if when the price of good A increases, the quantity supplied of Good B changes in the opposite direction. Examples: If the price of SUVs decreases, General Motors will increase the quantity supplied of compact cars (increase in supply). The logic here is that because the equipment is capable of producing both, producing SUVs will be less relatively less lucrative, and thus the firm will switch to producing compact cars. Sound familiar? If the price of danishes increases, a donut shop will decrease its quantity supplied of donuts (decrease in supply). Now producing danishes will be more lucrative, so the firm will substitute from producing donuts to danishes. The Numerical Example Recall our original expression of the supply function: Q xs = 70 + 13 Px − 2 Pr − 5W Recall that Pr indicates the price of the related good. Are goods X and the related good technological substitutes or technological complements? Again, it will come down to the sign on the Pr term. In this case, the coefficient on the Pr term is -2. This means if Pr increases by $1, Qxs will fall by 2 units.17 This is consistent with technological substitutes, as the price of the one good and the quantity supplied of the other good are moving in the opposite direction. Not convinced? Go back to the exercise of changing Pr from $5 to $2 and then changing Pr from $5 to $8. Confirm that the changes in the supply curve are what you’d expect. Expectations of Future Prices When suppliers expect prices to fall in the future, current supply will increase. Firms will attempt to sell their products at the high current price. 17 If you are thinking that the magnitude of the coefficient tells you how closely technologically related the two good are you are correct. The larger the size of the coefficient (in absolute value, further from zero) the more technologically related the two goods. And of course, a positive coefficient on the Pr term would indicate technological complements. 10 Econ 500 – Microeconomic Review – Supply When firms expect prices to rise in the future, the current supply decreases. Firms will hold back production. One detail here…take for example the second situation in which firms expect prices to rise in the future. While we say that current supply will decrease, we could be a bit more precise. What is likely to happen is that firms will continue to produce goods, but will not sell as many of these goods today, instead choosing to accumulate inventories, which they then expect to liquidate when prices rise in the future. In this regard, when we say supply, we are talking about those products that are brought to market, not the quantity of goods that are manufactured.18 You may also have noticed that if firms hold back production today in anticipation of future prices, this act itself may cause prices to increase now. More later… Everything Else I liked writing notes more last week… Many other things can shift a supply curve. Producer Surplus My hope is that you can anticipate everything that is forthcoming here. The height of the supply curve tells us the minimum amount a producer is willing to accept to produce a unit of the good. But seldom does this producer actually get paid this amount. If there is a gap between the two, we call this gap producer surplus. Producer Surplus = Amount producer actually is paid - the minimum amount they would have accepted From the vertical interpretation of a supply curve, we know that the height of a supply curve at some quantity tells us the minimum amount a producer was willing to accept. If we compare this to the price on the graph, we have producer surplus. Let’s go back to the pizza example, and assume the price of pizza is $22. At Q = 15, the height of the supply curve is $11, while the price is $22, so consumer surplus is $11 ($22 $11 = $11). The idea is that the producer is getting a deal. They would have accepted $11 for the good, but they received $22. If this $11 sounds something like profit, you’re on the right track.19 At Q = 20, producer surplus is $22 - $15 = $7. It should be easy for you to calculate producer surplus on the 25th pizza.20 18 Not all firms have this option. For example, Domino’s pizza can not produce pizzas in August, and sell them in September. 19 If you are comfortable with interpreting supply curves as a marginal cost curve, producer surplus is the difference between P and marginal costs, sometimes called operating profit. 20 Producer surplus is $3, as the producer is willing to accept (the height of the supply curve) $19, while the price is $22. Producer surplus is $22 - $19 = $3. 11 Econ 500 – Microeconomic Review – Supply PPIZZA Supply $22 $19 $15 $11 15 20 QPIZZA 25 Just as before, adding producer surplus up for each individual unit of the goods gets very tedious. We’ll use the same calculus trick. In general, if you want to add up the total producer surplus for producing Q units (where Q can be any quantity), simply add up the entire area that is (1) above the supply curve, (2) below the price that suppliers receive, and (3) out to the quantity Q. See the picture below. P Producer Surplus Supply P Q Q 12 Econ 500 – Microeconomics Review – Equilibrium Markets and Equilibrium Market – a process or location in which equilibrium is established and the otherwise inconsistent aspirations of demanders and suppliers are reconciled. Equilibrium - an outcome or state that will tend to persist unless disturbed by a change in one or more of the ceteris paribus conditions. Is the equilibrium price PH? I bet you guys know the drill, but as long as we’ve wandered down this path, we may as well wander a bit more. Let’s combine a supply curve (firm behavior) with a demand curve (consumer behavior) and see if we can’t see how things play out. Basically, what is the equilibrium price and quantity we will observe? Let’s try out PH. At this price, we find out how much suppliers want to produce by looking at their supply curve (QS1), and how much demanders want to consume by looking at the demand curve (QD1). At this price, QS1 > QD1. This is called an excess quantity supplied or surplus. Suppliers would like to supply more than demanders want to purchase (suppliers and demanders aspirations are not consistent). Suppliers will not be able to sell all that they wish to at this high price. The surplus will cause downward pressure on price. As price falls, two things happen simultaneously. Suppliers desire to produce less as price lowers, and demanders desire to purchase more as price lowers. This causes the size of the surplus to decrease. The downward pressure on price will continue until the equilibrium price is reached and there is no longer a surplus. Price Supply PH PL Demand QD1 QS2 QD2 QS1 Quantity Is the equilibrium price PL? Let’s try PL. At this price, we again find out how much suppliers want to produce by looking at their supply curve (QS2), and how much demanders want to consume by looking at the demand curve (QD2). At this price, QD2 > QS2. This is called an excess quantity demanded or shortage. At this low price, many consumers want to purchase the product, but suppliers will not be willing to produce as much as consumers desire (the aspirations of suppliers and demanders are inconsistent). This will cause upward pressure on price. As the price rises, two things simultaneously happen. Suppliers desire to produce more as price rises, and demanders desire to purchase less as price rises. These two factors cause the size of the shortage to decrease. This upward pressure on price will continue until the equilibrium price is reached and the shortage disappears entirely. 1 Econ 500 – Microeconomics Review – Equilibrium The equilibrium price is P* Let’s try P*. Refer to the picture below. At P*, demanders want to purchase Q* units. At P*, suppliers want to supply Q* units. Everyone who is willing to pay P* can buy all the goods they want. Everyone who is willing to supply goods at P* is supplying what they want. Everyone’s aspirations are consistent and everyone is happy. Let’s all hold hands and sing. No one wants to change their behavior, hence an equilibrium. Price Supply P* Demand Q* Quantity P* and Q* are the equilibrium price and equilibrium quantity. Equilibrium occurs where the supply curve intersects the demand curve. In other words, at the equilibrium price, quantity supplied equals quantity demanded. There is neither a shortage, nor a surplus - we say that the market clears. Even if we find the market price temporarily away from the equilibrium price, these pressures will cause the price to tend to return to equilibrium price. This is why we say equilibrium will “tend to persist” unless there is a change in a ceteris paribus condition. Comparative Statics Finding equilibrium prices and quantities are nice, but the most useful thing we’ll get out of supply and demand analysis will be what we call comparative statics. Basically, we change a ceteris paribus condition for some good then we see what impact this will have on the equilibrium price and quantity of that good. You can think of comparative statics exercises as a four part process. As your get more comfortable, you’ll breeze through these without doing them step by step. 1. 2. 3. 4. Start in initial equilibrium (draw an initial S & D curve to start) Change one or more of the ceteris paribus conditions Examine the impact on demand or supply (shift the appropriate curve) Examine new equilibrium (compare) 2 Econ 500 – Microeconomics Review – Equilibrium Examples of Comparative Statics Suppose we are looking at the market for oranges. The initial equilibrium is (P0, Q0). There is an increase in income. Oranges are a normal good. This causes an increase in demand (demand curve to shift to the right). At the original price, P0, there is now an excess quantity demanded, putting upward pressure on the price. The new equilibrium will be (P1, Q1). Both equilibrium price and quantity will increase. Price S P1 P0 D D’ Q0 Q1 Quantity Now, suppose unusually cold weather occurs in Florida, destroying some of the orange crop. This causes a reduction in the supply of oranges (supply curve shifts left). The initial equilibrium is (P0, QO). The new equilibrium is (P1, Q1). The equilibrium price will increase and the equilibrium quantity will decrease. Price S’ S P1 P0 D Q1 Q0 Quantity What if more than one curve shifts? Suppose we are looking at the market for prostitution. Suddenly, AIDS is developed. What happens to the prostitution market? Again, the initial equilibrium is (P0, QO). AIDS decreases the demand for prostitution, as well as decreases the supply of prostitution. The new equilibrium is (P1, Q1). You can think of AIDS as a sort of increase in the cost of producing “prostitution services”. Prostitutes will need to be paid a higher price to incur the risk of contracting AIDS. PPROSTITUTION S’ S P0 D’ Q1 Q0 D QPROSTITUTION 3 Econ 500 – Microeconomics Review – Equilibrium As it is drawn, the price does not appear to have changed. However, the change in price is ambiguous. This can be seen two ways. First, take the two changes one at a time. Change Decrease in supply Decrease in demand Total Effect on P increases decreases ambiguous Effect on Q decreases decreases decreases The other way this can be shown is to use supply and demand shifts of different magnitudes. Draw this with a large demand curve shift and a small supply curve shift. Check your answer. Now draw it again with a large supply curve shift and a small demand curve shift. Compare. You should see that in one case the price rises, while in the other case, the price falls. In general, if you simultaneously change both a ceteris paribus condition for both supply and for demand, either the direction in the change of price or the direction of the change in quantity will be ambiguous. What about the math? If we had a demand function and a supply function, can we solve for the equilibrium price? The answer is yes. Hurray! Here is how. We noted above that the equilibrium price was the price where quantity demanded is equal to quantity supplied. The nice thing is the demand function tells us what quantity demanded will be at various prices, while the supply function tells us what quantity supplied will be at various prices. By setting quantity demanded equal to quantity supplied and solving for the price, we can determine the equilibrium price. Once we do this, we can plug the equilibrium price back into the demand function (or the supply function) to determine the equilibrium quantity. Let’s do an example with our hopefully now familiar demand function and supply function. Recall we started with: Q xd = 100 − 12 Px − 2 Py + 6 M then assumed that M = 10 and Py = 30, which resulted in: Qxd = 100 − 12 Px On the supply side, we started with: Q xs = 70 + 13 Px − 2 Pr − 5W then assumed that W = 8 and Pr = 5, which simplified to: Qxs = 20 + 13 Px Now, set quantity demanded equal to quantity supplied, and solve for Px . 4 Econ 500 – Microeconomics Review – Equilibrium Q xd = Q xd ⇒ 100 − 12 Px = 20 + 13 Px ⇒ 80 = 56 Px ⇒ 80( 65 ) = Px ⇒ 80 − 12 Px = 13 Px ⇒ 96 = Px Can we be sure we are correct? Let’s indeed confirm that at a price of $96, the quantity demanded is equal to the quantity supplied. Qxd = 100 − 12 Px = 100 − 12 (96) = 100 − 48 = 52 Qxs = 20 + 13 Px = 20 + 13 (96 ) = 20 + 32 = 52 Indeed, the quantity demand equals quantity supplied. One last thing we can do is to check the graph. Visually, our answer looks reasonable. PX $240 $200 $96 D 20 52 100 QX 5 Econ 500 – Microeconomics Review – Elasticity of Demand, Marginal Revenue Elasticities – Why? Why should we bother with elasticities? As we learn a bit more economics, one of the things we would like to do is to try to be more specific. If you think back to your first microeconomics course, we were happy with you telling us simply in what direction the price and quantity will change. As we progress, we will still want to know in what direction the price and quantity will change, but in addition, we’d like to know how much the price and quantity will change. Elasticities enable us to answer these questions. Is it a big change in price or a small one? Further, and perhaps more importantly, a firm’s pricing decisions will be directly influenced by the elasticity of demand for the product it is selling. Elasticities – What are they? All elasticities will be a measure of sensitivity. The (own) price elasticity of demand measures how sensitive quantity demand is to changes in (own) price. The (own) price elasticity of supply measures how sensitive quantity supplied is to changes in (own) price. The income elasticity of demand measures, you guessed it, how sensitive demand is to changes in income. The cross price elasticity of demand measure how sensitive quantity demanded is to a change in the price of a different good (a substitute or complement). The next step is to come up with a classification of what is “sensitive” and what is “insensitive”. Consider the example below: Suppose a $1 increase in the price of gas leads to a 500 gallon decrease in gas sold. Now, suppose a $1 increase in the price of a BMW leads to a 500 fewer BMW cars to be sold. Which of these is a “big” quantity response? Even though both changes involve an increase of $1 and a reduction in quantity of 500, my feeling is that car change is extremely sensitive, while the gas is not so sensitive. The point here is that measuring changes is dollars and units sold might not be appropriate. $1 is a big deal for gas, but not for cars. Perhaps measuring the changes in percentages would give us a better idea? This is in fact how elasticities are measured. In general, an elasticity is the percentage change in one variable resulting from a 1% increase in another. (Own) Price Elasticity of Demand (Own) Price Elasticity of Demand is defined as the percentage change in quantity demanded of a good resulting from a 1% increase in its price. EQx ,Px = %∆Qxd %∆Px You should read this as “the percentage change in quantity demanded of good X divided by the percentage change in price of good X”. The notation “∆” means “change in”. Of course, because demand curves are downward sloping, the elasticity of demand will always be a negative number. An increase in price (positive denominator) will lead to a reduction in quantity demanded (negative numerator), giving us a negative value of EQx , Px . Likewise, a decrease in price (negative denominator) will lead to an increase in quantity demanded (positive numerator), and again result in a negative value of EQx , Px . Since the elasticity of demand is always negative, people often strip off the negative sign and talk about the absolute value of elasticity. If someone ever tells you the elasticity of 1 Econ 500 – Microeconomics Review – Elasticity of Demand, Marginal Revenue demand is 2, what they really mean to say is that the absolute value of the elasticity of demand is 2. No matter how you slice it, we’ll all know that this really means is that EQx , Px = -2. Categorization of Price Elasticity of Demand Values We’ll want to classify demand curves into three categories. When you think of elasticities, think of sensitivities. The (own) price elasticity of demand is a measure of how sensitive the change in quantity demanded is to a given sized price change. If a demand curve is inelastic, this means that change in quantity demanded is relatively insensitive to changes in price. If a demand curve is elastic, this means that the change in quantity demanded is relatively sensitive to changes in price. Let’s be a bit more formal: | EQx ,Px | > 1, elastic a 1% ↑ in price will lead to a more than 1% ↓ in quantity demanded | EQx , Px | = 1, unit elastic a 1% ↑ in price will lead to an exactly 1% ↓ in quantity demanded | EQx , Px | < 1, inelastic a 1% ↑ in price will lead to an less 1% ↓ in quantity demanded Also, there are some extreme elasticity values. | EQx , Px | = ∞, perfectly elastic a 1% ↑ in price will lead to an infinite reduction in quantity demanded | EQx , Px | = 0, perfectly inelastic a 1% ↑ in price will lead to no change in quantity demanded Check out Baye for pictures of the demand curve for these extreme cases, flat and vertical, respectively. Are price elasticities the same thing as slopes of demand curves? No. To see this, we can look at the definition of elasticities, do some rearranging, and you’ll see why. First, we need to back to 6th grade and remember how to calculate percentage changes. Remember a percentage change in just the change in the value divided by the original value. So we have: %∆Qxd = ∆Qxd Qxd and %∆Px = ∆Px Px Thus, we can rewrite the elasticity formula, plug in the above definitions, and then do a little rearranging: EQx , Px = The first term ( %∆Q xd %∆Px ⇒ EQx , Px ∆Q xd Qd = x ∆Px Px ⎛ ∆Q xd ⇒ EQx , Px = ⎜⎜ ⎝ ∆Px ⎞⎛ Px ⎟⎟⎜⎜ d ⎠⎝ Q x ⎞ ⎟⎟ ⎠∆Qxd ) is constant along a linear demand curve and equal to the inverse of the slope of the ∆Px demand curve. The second term ( Px ) changes as we move along a linear demand curve. On the Qxd d uppermost portion of a demand curve, Px will be relatively high and Qx relatively low, resulting in Px Qxd 2 Econ 500 – Microeconomics Review – Elasticity of Demand, Marginal Revenue d being a large number. On the lower portion of a demand curve, Px will be relatively low while Qx is relatively high, resulting in Px being a low number. Therefore, as we move along a linear demand curve Qxd the elasticity of demand will change from 0 to negative infinity. How about an example? Example Suppose you were told a demand curve was described by the equation Q x = 8 − 2 Px .1 I’ve drawn the d demand curve below. Ignore the slope calculation for just a second if you can. In this case, and you should confirm, the inverse demand function is Px = 4 − 12 Q xd . Px 4 Slope = 3 Rise ∆Px − 4 1 =− = = Run ∆Qx 8 2 2 1 2 4 6 8 Qx Now, go and calculate the slope using the graph. The slope is − 12 (see picture above). You’ll notice it’s d easy to grab the slope from the inverse demand function, as it is just the coefficient on Qx . Suppose I asked you to calculate the elasticity of demand at five different spots along the demand curve, specifically where Px = 4, Px = 3, Px = 2, Px = 1, and Px = 0. You’d no doubt consult your notes and write down the formula for the elasticity of demand. E Qx , Px ⎛ ∆Q xd = ⎜⎜ ⎝ ∆Px ⎞⎛ Px ⎟⎜ d ⎟⎜ Q ⎠⎝ x ⎞ ⎟ ⎟ ⎠Now, hopefully your remember the first term ( ∆Q xd ), has something to do with the slope of a demand ∆Px curve and remains constant along a demand curve. d You could stare at the demand curve, Q x d = 8 − 2 Px , and note that a one dollar increase in price leads to a two unit reduction in Qx , and thus conclude that 1 ∆Q xd − 2 = = −2 . +1 ∆Px This example is very close, but not exactly the same as one in Baye’s book. 3 Econ 500 – Microeconomics Review – Elasticity of Demand, Marginal Revenue Or you could stare at the inverse demand function, Px = 4 − 12 Q xd , and note that a 1 unit increase in Qxd ∆Q xd +1 leads to a ½ unit decrease in Px leading you again to conclude that = 1 = −2 . −2 ∆Px Or you might have calculated the slope of the demand curve as it, you’ll conclude that − 12 and took the inverse. Any way you do ∆Q xd = −2 . Now you just need Px and Qxd . ∆Px To figure out Qx for each Px , it is more convenient to use the demand curve.2 Because Q x d d = 8 − 2 Px , it is pretty easy to plug and chug... d When Px = 4, Qx = 8 – 2(4) = 0 d When Px = 3, Qx = 8 – 2(3) = 2 d When Px = 2, Qx = 8 – 2(2) = 4 d When Px = 1, Qx = 8 – 2(1) = 6 d When Px = 0, Qx = 8 – 2(0) = 8 Finally, put it all together: Px = 4, Qxd = 0 ⎛ ∆Qxd EQx, Px = ⎜⎜ ⎝ ∆Px ⎞⎛ Px ⎟⎟⎜⎜ d ⎠⎝ Qx ⎞ 4 ⎟⎟ = −2⎛⎜ ⎞⎟ = −∞ 0 ⎝ ⎠⎠perfectly elastic Px = 3, Qxd = 2 ⎛ ∆Q d EQx, Px = ⎜⎜ x ⎝ ∆Px ⎞⎛ Px ⎟⎟⎜⎜ d ⎠⎝ Qx ⎞ 3 ⎟⎟ = −2⎛⎜ ⎞⎟ = −3 ⎝2⎠⎠elastic Px = 2, Qxd =4 ⎛ ∆Q d EQx, Px = ⎜⎜ x ⎝ ∆Px ⎞⎛ Px ⎟⎟⎜⎜ d ⎠⎝ Qx ⎞ 2 ⎟⎟ = −2⎛⎜ ⎞⎟ = −1 4⎠⎝ ⎠unit elastic Px = 1, Qxd = 6 ⎛ ∆Qxd EQx , Px = ⎜⎜ ⎝ ∆Px ⎞⎛ Px ⎟⎟⎜⎜ d ⎠⎝ Qx ⎞ 1 ⎟⎟ = −2⎛⎜ ⎞⎟ = −0.33 6⎠⎝ ⎠inelastic Px = 0, Qxd = 8 ⎛ ∆Qxd EQx , Px = ⎜⎜ ⎝ ∆Px ⎞⎛ Px ⎟⎟⎜⎜ d ⎠⎝ Qx ⎞ 0 ⎟⎟ = −2⎛⎜ ⎞⎟ = 0 8 ⎝ ⎠⎠perfectly inelastic Notice that as the price increase (as you move up a demand curve), the demand curve becomes more elastic. As price decreases (as you move down a demand curve), the demand curve becomes more inelastic. Some intuition on this point is in order. As the price increases, people will look for alternatives. When the price of gas is $2.00, a 10% increase in the price of gas might lead to a small reduction in the quantity demanded of gas. But at a price of $4.00, there might now be more viable alternatives than before, and thus we might see a larger change in quantity demanded. None of us were biking to work when gas was $2.00 a gallon, but some of us were when gas was $4.00 a gallon. The higher the price, the more sensitive consumers will be. 2 You, of course, will get the same answers if you use the inverse demand function, you’ll just have to do more algebra. Try it. It will get old quick. 4 Econ 500 – Microeconomics Review – Elasticity of Demand, Marginal Revenue It looks like the point where demand is unit elastic is half way along the demand curve (the midpoint of the demand curve). In fact it is. You can take it on faith, and that’s fine. If you like algebra, you let me know and I can send you a proof.3 See the graphs next page. Px | EQx , Px | = ∞ | EQx , Px 4 |=3 | |=1 EQx , Px 3 | EQx , Px 2 | = 0.33 | EQx , Px | = 0 1 2 4 6 Qx 8 In general, Px | EQx , Px | = ∞ (perfectly elastic) elastic | EQx , Px | = 1 (unit inelastic) at the midpoint of the demand curve inelastic | EQx , Px | = 0 (perfectly inelastic) Qx Why do some goods have elastic demand curves while other inelastic demand curves? Reasons why goods tend to have elastic demand curves: 1. 2. 3. The good have many available substitutes – Kellogg’s Corn Flakes The good is a large fractions of consumer’s budget – appliances The goods in an input into a product that is itself has an elastic demand curve – computer components Reasons why goods tend to have inelastic demand curves: 1. 2. 3. 4. 5. The good has few available substitutes / unique features – Britany Spears albums The goods is a small fraction of a consumer’s budget – table salt Comparisons amongst substitutes are difficult – door to door products Consumers pay only a fraction of the full price of a product – health care The consumer is “committed” to using the product – your printer’s ink jet cartridges Which would be more sensitive to change in price – the demand curve for Kellogg’s Corn Flakes or the demand curve for all cereal? 3 No one has ever taken me up on that offer. 5 Econ 500 – Microeconomics Review – Elasticity of Demand, Marginal Revenue The answer is Kellogg’s Corn Flakes. If the price of all cereals increased, people would cut back on cereal, but consumers are limited because the price of all cereals have increased. They could switch to having pancakes for breakfast, but not all people would. The quantity of cereal consumed would fall, but not very dramatically. On the other hand, if only the price of Kellogg’s Corn Flakes increased, we’d expect a large reduction in quantity demanded of Kellogg’s Corn Flakes, as consumers would substitute to any number of breakfast cereals, or even pancakes. In short, there are more substitutes for Corn Flakes specifically than cereal in general. The elasticity of demand for Miller Lite will be more elastic that the elasticity of demand for beer, which will be more elastic than the demand for beverages. Another way of stating this idea is that brand elasticities are higher (more elastic) than industry elasticities. Relationship between inverse demand curves and marginal revenue You need to be familiar with how to go from an inverse demand function to a marginal revenue curve. Recall that marginal revenue is the additional revenue associated with a one unit increase in production. Inverse Demand Function: Px = a − bQxd Total Revenue = Px *Qxd = (a − bQxd )* Qxd = aQxd − bQxd Marginal Revenue = ∂ (Total Re venue ) = a − 2bQ d x ∂Qxd 2 For those of you who are calculus inclined, marginal revenue is the derivative of total revenue with respect to quantity. For those of you who are not calculus inclined, do not fret, you can use the shortcut method described below. A few things to notice... • The marginal revenue curve has the same vertical intercept (a) as the demand curve does. • The slope of the marginal revenue curve is twice the slope of the demand curve, or more simply the MR curve is twice as steep as the demand curve. • The marginal revenue curve intersects the horizontal axis where Qxd = a which is half way 2b between the origin and where the demand curve intersects the horizontal axis Qxd = a . b Marginal revenue can be negative. • In general, the picture will look like this: 6 Econ 500 – Microeconomics Review – Elasticity of Demand, Marginal Revenue P D MR Q I want everyone to be able to come up with the equation of the MR curve given the inverse demand function (or for that matter the demand function). Notice that Px = a − bQxd and that MR = a − 2bQxd . For those of you who aren’t calculus inclined, to transform an inverse demand function to a marginal revenue function, you just have to change the coefficient on the Qx term.4 See the examples below. d Examples: Inverse Demand Function: Px = 12 − 2Qxd Total Revenue = Px *Qxd = (12 − 2Qxd )* Qxd = 12Qxd − 2Qxd 2 Marginal Revenue = ∂ (Total Re venue ) = 12 − 4Q d x ∂Qxd You should sketch both the demand function and the marginal revenue function. You should find the d demand curve intersects the vertical axis where Px = $12 and the horizontal axis where Qx = 6. You should also find that the marginal revenue curve intersects the vertical axis where MR = $12 and the d horizontal axis where Qx = 3, and then continues along into negative values. If you were given an inverse demand function Px = 14 − 3.5Qxd , the marginal revenue function would be MR = 14 − 7Qxd . If you were given a demand curve of Qxd = 4 − 2 Px , you have to first transform the demand function into an inverse demand function, and then use the “trick”. In this case, you’d find an inverse demand function of Px = 2 − 12 Qxd and MR = 2 − Qxd If you are not sure, graph them. 4 Be sure that you are using the inverse demand function when you do this trick. 7 Econ 500 – Microeconomics Review – Elasticity of Demand, Marginal Revenue What is the relationship between Marginal Revenue and Total Revenue? Marginal revenue is the extra revenue associated with a one unit increase in production. The calculus inclined should realize that MR is the slope of the total revenue function. Others don’t need to worry. Let’s start at Q = 0 (the upper most point on the demand curve). At Q = 0, MR is positive, meaning that producing another unit will increase total revenue. However, we can see that MR is getting smaller as we increase output (though for the time being it is still positive). Thus we know that total revenue is increasing, but increasing at decreasing rate. Eventually (at the midpoint of the linear demand curve), MR = 0. This means total revenue is neither rising nor falling. Total revenue has reached a peak. For all additional units, MR < 0, this means total revenue will fall as we produce additional units of output. We can combine this information, and the fact that we know revenue is $0 when we sell zero units (the vertical intercept of the demand curve) and the fact that we know revenue is 0 when price is zero (the horizontal intercept of the demand curve) to draw the following picture. Total revenue is maximized where MR = 0, which just so happens to be the spot where the elasticity of demand is equal to -1 (unit elastic). This is no coincidence. Those of you who like calculus can note we are setting the derivative of the total revenue function to zero to find out where total revenue is maximized. Others need not worry. Px A B C (midpoint) D E Demand MR Qx Total Revenue Qx Given an inverse demand function Px = 18 − 3Q xd , could you calculate MR? Could you then find the quantity that will have the largest total revenue? Hint: what is the value of marginal when total revenue is at its maximum? What is the quantity where this occurs? What is the price at this quantity? What is value of total revenue at this quantity?5 5 If Px = 18 − 3Q xd , then MR = 18 − 6Q xd . MR = 0 when total revenue reaches it maximum. Setting MR = 0 ⇒ 18 − 6Q xd = 0 ⇒ Q xd = 3 . To find Px when Qxd = 3 , use the inverse demand curve. Px = 18 − 3Q xd = 18 − 3(3) = 18 − 9 = $9. TR = Px * Q xd = $9 * 3 = $27 . If you 8 Econ 500 – Microeconomics Review – Elasticity of Demand, Marginal Revenue What is the relationship between elasticity of demand and total revenue? If a firm or manager knew what their whole demand curve looked like, it would be easy for the firm to calculate marginal revenue and elasticities. Often, though, firms will not have information on their entire demand curve, but will have a pretty good idea about the elasticity of demand for their product. What if you only know the elasticity? What could you say about what happens to total revenue if price changes? An easy thing you should be able to do is tell me what happens to total revenue when there is an increase in price when demand is elastic, when demand is unit elastic and when demand is inelastic. If you combine the picture above with the picture on the middle of page 5 of these lecture notes, you have the whole story. For instance, you know on the upper half of the demand curve, demand is elastic. You also know that if you raise price (move from B to A), total revenue is decreasing. On the lower half of the demand curve, demand is inelastic. You see from the picture above if you raise price (moving from E to D), total revenue is increasing. And finally, if you are right in the middle of the demand curve, demand is unit elastic. You know if you make a very small change in price at point C, there is no change in revenue. You might try and figure out what is going on for price decreases for each of inelastic, elastic, and unit elastic. Confirm your answers in the chart below. Demand Elastic Demand Unit Elastic Demand Inelastic Price Decrease TR ↑ no ∆ TR TR↓ Price Increase TR↓ no ∆ TR TR ↑ One More Nice Formula Some smart people have told us that a way you can write the expression for marginal revenue is as follows. We will likely come back to this when we discuss firms with pricing power. ⎛ 1 + EQx , Px MR = Px ⎜ ⎜ E Qx , Px ⎝ ⎞ ⎟ ⎟ ⎠For fun, plug in EQx , Px = -1 and see what the formula tells you.6 Then plug in a value of EQx , Px that is inelastic, say -0.5.7 Finally, plug in a value of EQx , Px that is elastic, say -3.8 d get bored, you could calculate revenue at Qx =0, 1, 2, 3, 4, 5, 6 and confirm the picture looks like the one I’ve drawn (it will). You’d find revenue would be $0, $15, $24, $27, $24, $15, and $0, respectively. 6 It tells you that MR = 0 when EQx , Px =1, a point we already discussed in drawing the MR curve. 7 It tells you that MR = -0.5 * P, which means that MR is less than zero, a point we already discussed in drawing the MR curve 8 It tells you that MR = 0.67 * P, which means that MR is less than P, but positive, again a point we discussed in drawing the MR curve. 9 Econ 500 – Microeconomics Review – Elasticity of Demand, Marginal Revenue This is really just another look at how MR various along different spots on a demand curve. The reason your textbook points it out is, later, this formula will be used to come up with a very simple pricing rule for firms with market power. It turns out that a firm’s “mark-up” over MC will be a function of its elasticity. The more inelastic the demand curve, the higher the mark-up. More later… Other Elasticities By far, the most important elasticity we will deal with is the price elasticity of demand, there are other elasticities that come in handy. I’ll just list them here. Check Baye for more. We’ll come back as appropriate. See also page 1 of these notes. Cross Price Elasticities Income Elasticities Advertising Elasticities Own Price Elasticity of Supply 10 Econ 500 – Microeconomic Review – Cost Curves The goal for this set of notes is to figure out the basic shape of cost curves. Ultimately, I want you to be able to understand the ATC, AVC, and MC curves. To do that, we have to do what seems like a ton of background. To know what the MC curve looks like we will need to know what the marginal product of labor curve looks like. To know the marginal product of labor curve looks like we will need to talk about production functions. Therefore, the first part will work on the marginal product of labor. Once we get there, we will put that aside and work on cost curves. You will see when we bring back the marginal product… Production Functions The production process, broadly speaking, is converting inputs into outputs. We general call inputs the factors of production. Most textbooks label them labor, capital, and materials. Some textbooks will add land to the list. Labor is human effort, physical or mental. Capital is things that are used to aid in the production of goods and services. Examples are buildings, delivery fans, factories, hammers, cranes, computers, cash registers, etc. Materials are inputs into production that are not capital. See below for an example. McDonalds will convert labor (workers), capital (building, grill, cash registers), and materials (beef, buns, cheese) into cheeseburgers. General Motors will convert labor (workers), capital (assembly lines, forklifts, tools), and engines, tires, and headlights to produce cars. For McDonalds the output is cheeseburgers, for GM the output cars. Next, we need a way to describe the technology of producing. We do this with something called a production function. The textbook definition is below: A production function indicates the highest output level (q) that a firm can produce for every specified combination of output. To simplify, we will assume that a firm only uses two inputs of production - capital and labor. The notation will be: q = F(K,L) where: q K L represents output produced by the firm1 represents capital represents labor All this means is that the amount of output produced by the firm is a function of (depends on) how much capital the firm uses and the amount of labor the firm uses. If you know you were going to hire 5 units of labor and 10 units of capital, you could plug them in a production function and it would spit out how much output the firm could produce. You can think of a production as a description of the technology the firm has it its disposal. If a firm is to acquire better technology, the same amount of input will result in more output, and the firm will have a new production function to describe this new technology. Most of the time we will simply draw production functions, but we will take care to make sure they have the shape that best fits the real world. 1 Later we may use Q to represent industry level output. Both Baye and Besanko will use capital Q. It will not be an issue here. 1 Econ 500 – Microeconomic Review – Cost Curves Short run vs. Long Run: If we took a look at capital and labor in general, it seems reasonable to me that one of these inputs is more “variable” than the other. If McDonalds wanted to produce twice as many burgers tomorrow as they did yesterday, it seems sensible to suggest that McDonalds would want to use both more labor and more capital. Think about how McDonalds might be able to add labor. They can call in a few extra workers who had the day off or maybe can have folks work overtime. This seems doable. However, if the firm wants to add capital, will they be able to do it overnight? Remember that for McDonalds, capital is the building, cash registers, grills, etc. Can McDonalds quickly increase the amount of capital they have available? Not so easy. We think it takes a significant amount of time for firms to increase the amount of capital they have available. As such, we will want to distinguish between what we call the short run and the long run. The short run is the period of time in which at least one input is fixed (can not be varied). We assume the amount of capital is fixed, while the amount of labor is variable. Basically, in the short run, you are stuck with the amount of capital you have. The long run in the period of time that is sufficiently long enough so that all inputs are variable. It will vary from industry to industry. A firm will be able to change the amount of capital they have in the long run. If it takes McDonalds one month to increase the size of their restaurant, then the long run for McDonalds is one month. If you think of the “Lucky Dog” hotdog cart industry, it seems like the long run would only be maybe only a week – you could increase the capital stock in this industry quickly (a hot dog cart). For a nuclear power plant, it takes a very long time to change the size of a nuclear power plant. Lots of permits, regulation, elaborate construction, etc. The long run for nuclear power might be ten years. Production in the Short Run: Let us direct our focus on the firm’s decisions in the short run. The first insight to have is that because we are assuming there are only two inputs, capital and labor, and because we are talking about the short run, the amount of capital is fixed by assumption. Therefore, the only way the firm can produce more output in the short run is to vary the amount of labor. This will make the firm’s decision quite simple – decide how much output they want to produce and hire the corresponding amount of labor. But let’s not get ahead of ourselves… Consider the numerical example below of a short run production function below. It is clipped from another textbook. Ignore the last two columns for a moment. Notice that the second column reminds you that the amount of capital is fixed in the short run. As the firm changes the amount of labor, the firm will be able to produce differing amounts of output. Labor (L) Capital (K) Output (q) 0 1 2 3 4 5 6 7 8 9 10 10 10 10 10 10 10 10 10 10 10 10 0 10 30 60 80 95 108 112 112 108 100 Average Product (q / L) -10 15 20 20 19 18 16 14 12 10 Marginal Product (∆q /∆L) -10 20 30 20 15 13 4 0 -4 -8 Below is a picture of the production function. 2 Econ 500 – Microeconomic Review – Cost Curves 120 Output (q) 100 80 F(K,L) 60 40 20 0 0 2 4 6 8 10 12 Labor (L) Some important measures: As it turns out, we will find it useful to take a look at the production function and calculate some quantities. First the definitions: APL = Average Product of Labor = q / L = output per unit of labor MPL = Marginal Product of Labor = (∆q /∆L) = additional output produced by each additional unit of labor The average product of labor is just what it sounds like – a measure of the average productivity of labor. For instance, if 108 units of output are produced with 9 units of labor, then the average amount of output produced per unit of labor is 12 units. This one will not be too important for us. And if you remember your Econ 211, I would bet you could guess what the marginal product of labor is. The marginal product of labor is the additional output produced by each extra unit of labor. More on this in a bit. This one will be important for us. Go back and look at the last two column of the table above. Make sure you can calculate the marginal product of labor. Things to note about the shape of the production function: It is important you understand what is going on inside our hypothetical firm and how this relates to the shape of the production function, and thus the marginal product of labor. Consider a McDonalds with a fixed amount of capital – a certain size grill, a certain number of tables, cash registers, and building size. Now imagine this McDonalds with only one worker. Think of how many burgers this worker can produce. This worker would have to take care of all of the tasks at the restaurant, grilling, taking orders, cleaning up the tables, etc. Hiring this first worker would enable some extra burgers to be produced, but perhaps not many. However, hiring a second or third worker would enable much output to occur. Perhaps now one worker could take care of the cash register, another the grill, another cleaning up the restaurant. In fact, the additional output produced by the 2nd and 3rd unit of labor might be quite high compared to the first. 3 Econ 500 – Microeconomic Review – Cost Curves But eventually, hiring additional workers will enable only a small number of extra units of output to be produced. How many extra burgers would be produced by sticking the 43rd worker in the McDonalds? Not much, if any. In fact, it is possible that hiring another worker may lead to less output being produced. The Marginal Product of Labor Curve The marginal product of labor is the extra output produced by an extra unit of labor. Notice in the example, and consistent with our story, the marginal product of labor increases for the first couple of units of labor. Perhaps this is because of the specialization of the employees described above. But also notice as more and more workers are hired, the marginal product of labor begins to diminish and eventually becomes negative. This concept has a special name - the law of diminishing marginal returns. The law of diminishing marginal returns states as we hire more and more of one input, holding other inputs constant, the marginal product of the variable input will eventually decrease. In our case (the short run), the amount of capital is fixed and the amount of labor is variable. Thus, as we hire more and more labor, holding the amount of capital constant, the marginal product of labor decreases. It is very important that you understand that the reason for this is not that the 7th or 10th worker is hired is any less skilled that the 1st worker. We have implicitly assumed that all units of labor are equally skilled. This has nothing to do with the quality of labor. The reason for the diminishing marginal product of labor is that the restaurant is becoming more crowded. You can’t fit 8 workers around a grill, nor can three workers work on the same cash register. More precisely, with a fixed amount of capital at the restaurant, hiring additional units of labor means that each worker has less capital to work with. If the restaurant becomes so crowded, adding another worker may cause even more less output to be produced – workers just bumping to each other. It has everything to do with the quantity of labor. Simply put, a worker’s marginal product of labor will depend on the amount of capital they have at their disposal. With a fixed amount of capital, adding labor necessarily means that each worker has less capital at their disposal. Drawing the Pictures of the MPL curve: Obviously, given the chart above, you could simply calculate the MPL and draw the picture from those figures. But you would miss out on an insight or too. I have drawn the pictures below. The biggest thing we want to notice right now is that the marginal product of labor curve first increases, then decrease. It is an upside-down U shaped curve. 4 Econ 500 – Microeconomic Review – Cost Curves 120 Output (q) 100 80 60 F(K,L) 40 20 0 0 2 4 6 8 10 12 Labor (L) Output (q) MPL 35 30 25 20 15 10 5 0 -5 0 -10 MPL 2 4 6 8 10 12 Labor (L) Technically, the marginal product of labor is the slope of the production function. A bit more intuitively, it is the extra output that each unit of labor enables to be produced. Notice, at low levels of output, the production function is getting steeper; therefore, the marginal product of labor is increasing. Eventually, the slope of the production function decreases, and hence the marginal product of labor decreases. Also notice at q = 8, the production function is neither increasing nor decreasing, and therefore the marginal product of labor is zero. Finally, adding more labor (past Q = 8) will cause output to fall, leading to a negative marginal product of labor. It seems with this production function, the maximum slope occurs at q = 3. 5 Econ 500 – Microeconomic Review – Cost Curves Firms’ Cost Curves Ok – so having figured out what the marginal product of labor curve looks like, we will stick that in our back pocket and work on discussing the costs of firms. A couple of important distinctions… Economic Costs vs. Accounting Costs: The big difference between the way accountants calculate costs and the way that economists calculate costs is that accountants do not include non-explicit opportunity costs. The most common missed opportunity costs are the entrepreneur’s time and the opportunity cost of the capital involved in the business. Let us run through the some quick stylized examples. Consider a proprietor running a pizza restaurant and assume this proprietor does not pay himself or herself a salary. If yearly total revenue were $120,000, while the explicit (accounting) costs of production were $90,000, then the accountant would calculate accounting profit of $30,000. The economist would be certain to add in the opportunity cost of the proprietor’s time. If this individual could have earned $40,000 a year elsewhere, then the opportunity cost of time is $40,000. Economic costs therefore would include the $90,000 explicit costs and the $40,000 opportunity cost, for a total of $130,000. The economist would conclude economic profits in this case were -$10,000. This calculation is suggesting that proprietor would be better served working elsewhere. Suppose a business involves $40,000 of capital that is already “paid for”. Suppose that yearly revenue is $12,000, while explicit accounting costs are $10,000. The accountant may calculate a profit of $2,000 in this case. But again, we need to be careful to include the opportunity costs, this time the opportunity cost of capital. If the market interest rate was 10%, then instead of having the $40,000 worth of capital invested here, the capital have been invested elsewhere (or simply sold and the money could sit in the bank). With a 10% interest rate, this amount of capital would have earned $4,000 yearly. The economist would include this opportunity cost, and thus would calculate an economic profit of -$2000. Sunk Costs vs. Recoverable Costs: Once a decision is made, and is totally irreversible, it should be ignored. Costs that have been incurred, and cannot be recovered, are called sunk costs. The old expression - “It’s a sunk cost, get over it” - is right on. Consider the purchase of a specialized piece of equipment that has no value to any other business. Once the equipment is purchased, the costs are sunk. They cannot be recovered. There is some date where you can no longer get a refund on your tuition dollars from NSU. After you cross that date, the amount spent on tuition is a sunk cost. A different textbook takes you through an interesting example about how a firm is considering relocating. Say it spends $50,000 to purchase an option (the legal right to buy the building) at a price of $500,000. Regardless of whether this building is purchased, the $50,000 spent on the option is non-refundable. It is a sunk cost. Now, suppose a second building is located that is similar and costs $525,000. Someone might argue that because if the first building is purchased, a total of $550,000 will have been spent, and because the second building costs only $525,000, it makes sense to purchase the second building. But this reasoning is fallacious. The $50,000 was spent, cannot be recovered, and therefore is irrelevant in future decisionmaking. Going forward, and ignoring this cost, the decision should be made to purchase the building that costs only $500,000. 6 Econ 500 – Microeconomic Review – Cost Curves The lesson here is to ignore the sunk costs, and focus on the incremental costs (the costs going forward). Have you ever heard someone say in the middle of a crappy movie, “Since we have already paid for the movie, we should stay.” Might this person be making a mistake? Shouldn’t the decision be based on the benefit of watching the rest of the movie, and the costs of watching the movie? Aren’t the expenditures on the ticket sunk? Or how about walking into a bar and opening a beer, then saying, “Since I bought the beer, I should finish it before leaving”. I am pretty sure once you goober on your beer, it is a sunk cost. Does your beer have any resale value? It is unrecoverable. As such, whether your stay to finish your beer or leave should be based on the benefits of consuming the beer (going forward) and the cost of drinking the beer (going forward), but the $2 you spent on the beer is now irrelevant. Fixed Costs vs. Variable Costs: This one is pretty easy. Some costs change depending on how much output is produced, while other costs do not change depending on how much output is produced. Fixed costs (FC) are costs that do not vary with the level of output. Examples would include monthly rent, a fee paid to a security monitoring company, the salary of the manager. Variable costs (VC) are costs to do vary with the level of output. If you produce more pizzas, you will need to hire more labor, buy more cheese, and more tomatoes. Therefore, labor, cheese, and tomatoes are variable costs. Notice that some types of labor can be fixed costs, while other types of labor can be variable costs. Your textbook also points out that some costs that are fixed in the short run are variable in the long run. Perhaps you have agreed upon a fixed salary for your manager. But in the long run, if you produce more output, it may be the case that the manager has to work more hours and will demand a higher salary. In this case, in the long run, the salary paid to the manager is a variable cost. Examples: Fixed Costs Large – development costs independent of how many copies produced Large – rent, proprietor’s time, kitchen equipment, chairs and tables Variable Costs Small – costs of duplication of software relatively small Sunk Costs Large - once software is developed, these expenditures are sunk Relatively low – labor, materials, ingredients University Huge – buildings, IT infrastructure, library Computer Hardware Small – need some place to assemble the computers, but not very specific technology Low – cardboard sign Small – university can hire adjunct professor cheaply Large – processors, memory, components, assemblers Very few – kitchen equipment, tables and chairs, can be sold. Main sunk cost may be long term nonrefundable lease Very large – would anyone buy dorms, old library books? Small Software Development Pizza Restaurant Lemonade Stand High – lemons, sugar Low – cardboard sign? 7 Econ 500 – Microeconomic Review – Cost Curves Marginal, Average, and Total Costs: So often, we preach that it is always marginal stuff that matters in economics class. Here is one notable exception. To figure out what firms will be up to in both the short run and the long run, we have to keep track of what is going on with both marginal costs and average costs. Going back to our distinctions above, the first important relationship is simple. Costs are either fixed or variable. Total Costs (TC) = Variable Costs (VC) + Fixed Costs (FC) Next, we will work on marginal cost. As you know, marginal cost is just the change in total cost associated with a one-unit increase in output. So you will see below that MC = ∆ TC / ∆ q. But because TC = VC + FC, and because fixed costs don’t change when we alter then output level, another way we can write MC is to note that MC = ∆ VC / ∆ q MC = ∆ TC / ∆ q = ∆ VC / ∆ q Average Costs: All of the average costs measures are calculated the same way. Take some measure of total cost, and divide by the quantity of output produced. Your book is a bit sloppy about how it abbreviates average total costs. Sometimes it will use ATC and sometimes it will use AC (average costs). Average Total Costs: Average Fixed Costs: Average Variable Costs: ATC = TC / q AFC = FC / q AVC = VC / q Example: At this point, mechanically, you should be able to calculate this whole mess of a table, given the first two columns. Remember that fixed costs do not change with the level of output. Output 0 1 2 3 4 5 6 7 8 9 10 11 FC 50 VC 0 50 78 98 112 130 150 175 204 242 300 385 TC MC -- AFC -- AVC -- ATC -- See the answers at the end of these notes. 8 Econ 500 – Microeconomic Review – Cost Curves What determines short run costs: Keep in mind that in the short run, the amount of capital is fixed. If the firm is to produce more output, it must hire more labor. What then determines the marginal cost of producing? The important factors will be the wage rate (the cost of hiring labor) and the marginal product of labor (how much output that labor can produce). For instance, if the market wage is $5 in one situation and $8 in a second situation, marginal cost will be lower in the first. Also, if the marginal product of labor is high in one situation (one extra unit of labor produces many additional units of output) and lower in a second situation (one extra unit of labor produces fewer additional units of output), the marginal cost will be lower in the first. If we continue with this logic, we can figure out that when the MPL curve is rising, the MC curve will be falling. When the MPL curve is falling, the MC cost curve will be rising. That is, because the MPL curve is upside-down U shaped, the MC will be U-shaped.2 Still unconvinced? We are cheating a bit, but we can get the basic idea by looking back at our production function. Let us assume that the going wage that has to be paid to a unit of labor is $30, regardless of how many units of labor the firm hires. We can calculate the extra cost per unit produced by figuring out how many extra things we get (MPL) for each $30 increase in costs. Labor (L) Output (q) 0 1 2 3 4 5 6 0 10 30 60 80 95 108 Marginal Product (∆q /∆L) -10 20 30 20 15 13 Additional Labor Costs -$30 $30 $30 $30 $30 $30 Something Pretty Close to MC $3.00 / unit $1.50 / unit $1.00 / unit $1.50 / unit $2.00 / unit $2.31 / unit ($30 / 10) ($30 / 20) ($30 / 30) ($30 / 20) ($30 / 15) ($30 / 13) 2 For you people who like math…We know that marginal cost is equal to the change in variable costs for a given change in output. However, the change in variable costs is simply equal to the market wage multiplied by the change in the amount of labor hired. MC = ∆ VC / ∆q = w ∆ L / ∆q But if you remember from our discussion of production functions, ∆ q / ∆L = MPL. Therefore, you can conclude that MC = w / MPL Thus, if MPL is first increasing then decreasing, the MC will be first decreasing, then increasing. 9 Econ 500 – Microeconomic Review – Cost Curves Pictures of Cost Curves (Short Run) Your textbook draws the picture of total costs, (total) fixed costs, and (total) variable costs, but I do not think it adds much. I would focus on the picture with MC, ATC, AVC, and AFC. I think the best way to go about understanding this picture is to attack the curves in the following order: MC, then AVC, then AFC, and finally ATC. While you can do these mechanically, and simply graph them in the numerical example, there are few more insights to gain from scratching your head about them. Marginal Cost – marginal cost is typically U-shaped. Why? When we talked about production functions, we told a story about how the marginal product would initially increase for a while, then (eventually) decrease. Since marginal costs moves in the opposite direction of the marginal product of labor, it will be the case that MC first decreases, then increases. Average Fixed Costs – fixed costs are some set figure, say $50. As more and more output is produced, average fixed costs continually decrease. Check the example above. Notice that AFC decreases rapidly for the first few units of output, and while AFC continues to decrease, the AFC flattens out considerably. This is what people are talking about when they discuss spreading out the overhead. Average Variable Costs – a test analogy. If your last test score is higher than your average test score, your average will be rising. If your last test score is lower than your average, the average will be falling. But the average will not be rising quite as rapidly. If MC > AVC, AVC will be rising. If MC < AVC, AVC will be falling. Because MC is falling at low output levels, it will be below AVC and thus AVC will be falling at low levels of output. When MC begins to rise, eventually it will be above AVC, and thus AVC will be rising at high levels of output. As a result, AVC will be U-shaped as well. The lowest level of AVC will occur at the spot where the AVC curve bumps into the MC curve. Average Total Costs – I think the best way to think about the ATC as coming from adding up the AVC and AFC curve. Because TC = FC + VC, then it is the case that ATC = AFC + AVC. We have already figure out what the AVC curve looks like, and what the AFC curve looks like, so we just add them up. At low levels of output, AFC is high, so the ATC will be much larger than AVC. At high levels, we know that AFC is low, and thus the ATC curve will be very close to AVC curve. As output increases, the ATC curve will get closer and closer to AVC. 10 Econ 500 – Microeconomic Review – Cost Curves The picture: 60 50 40 MC AFC 30 AVC ATC 20 10 0 0 2 4 6 8 10 12 What to notice? • • • Notice that then MC < AVC, AVC is falling and when MC > AVC, AVC is rising. Notice where MC = AVC, AVC is at its minimum. Notice that when MC < ATC, ATC is falling, and when MC > ATC, ATC is rising. • • • Notice where MC = ATC, ATC is at its minimum. Notice at low levels of output, AVC and ATC are far apart (as AFC are high). Notice at high levels of output, AVC and ATC are close together (as AFC are low). What is Next? We will take a look at firm’s decisions next. Given some assumptions about the structure of the industry (competitive, monopolistic, etc), we will model how firms behave. We will also look at how firm decisions differ in the long run. What should I read? If you were only going to read one, I would read Baye on this one. Besanko – Cost Curves are discussed at the beginning of the primer. You will see a bit more emphasis on the long-term there than in these notes. Also, the notation will be just a bit different. Baye – Chapter 5. Read the beginning and the end. Chapter 5 begins with production functions, which will be similar to what you see above. I do not think the middle portion, starting with the subsection “Algebraic Forms of Production Functions” is as important as the things I have discussed above. (It covers isocost lines and isoquants – nothing wrong with it but we are time constrained). Start reading again when you get to the section “The Cost Function”. The notation is a pinch different, but I think you will be ok. 11 Econ 500 – Microeconomic Review – Cost Curves Answers to Example in Notes Output FC VC TC MC AFC AVC 0 50 0 50 -- -- -- ATC -- 1 50 50 100 50 50.00 50.00 100.00 2 50 78 128 28 25.00 39.00 64.00 3 50 98 148 20 16.67 32.67 49.33 4 50 112 162 14 12.50 28.00 40.50 5 50 130 180 18 10.00 26.00 36.00 6 50 150 200 20 8.33 25.00 33.33 7 50 175 225 25 7.14 25.00 32.14 8 50 204 254 29 6.25 25.50 31.75 9 50 242 292 38 5.56 26.89 32.44 10 50 300 350 58 5.00 30.00 35.00 11 50 385 435 85 4.55 35.00 39.55 12 Econ 500 Microeconomics Review - Perfectly Competitive Firms Perfectly Competitive Markets We turn our attention to perfectly competitive markets. To be sure, this is a textbook ideal. There are few if any markets that are perfectly competitive. Nonetheless, it will be useful to examine. Competitive Market Assumptions 1. Many buyers and sellers. Some books simply say firms are small relative to the market. The idea is that each firm is a small portion of the overall market. If that one firm produces a little more or a little less, the market price will not change. As a result, each individual firm acts as though the price is beyond their control. 2. Homogenous products. Homogeneous means that products are identical – firm A’s product is a prefect substitute for firm B’s product. As an example, consider gasoline or sugarcane. Amoco gas is just about the same as BP gas, just like Farmer Joe’s sugarcane is just about the same as Farmer John’s sugarcane. All #2 pencils are alike. Because products are homogenous, a single firm can not raise their price above the market or competitive price. If the firm did, consumers find a suitable alternative at any number of other firms, and thus the firm whose price had increased would lose most or all of its business. Shoes would be an example of a heterogeneous product – one firm’s shoes are not exactly the same as the others. A firm will have more pricing leeway in this case as one firm’s product may not be a perfect substitute for another. This would not be a perfectly competitive market. 3. No transaction costs. No taxes, waiting in line, etc. 4. Perfect information. Consumers are well informed about the availability of goods and their prices, as are rival firms. 5. Free entry and exit. This is very important for the long run dynamics. This means there are no special costs that make it difficult for a new firm to enter into an industry, nor are their special costs that make it difficult for an existing firm to leave the industry. We will see that if entry is free, if the industry is earning unusually high profits, new firms will quickly enter the industry. If exit from the industry is free and the industry is earning unusually low profits, existing firms will exit the industry. Restaurants would be a good example of an industry where entry and exit are easy. Nuclear power plants (exit and entry), airlines (entry), drug companies (entry), and cemeteries (exit) would be examples of businesses where have a more difficult time entering or exiting. A bit on the goals of the firm We assume that firms maximize profits. Is it true? I will tell you a story about a company my brother worked for – clearly we can come up with examples of actions managers take that do not maximize profits. But we certainly know that firms do not minimize profits. A particular instance where people often claim managers are not maximizing profits is the case of large corporations. The problem here is that managers of the firm own little if any of the firm, and thus may not have much incentive to maximize profits. Nonetheless, if managers stray too far from the ideal, they will be replaced. At the end of the day, assuming firms maximize profits is a useful assumption in trying to predict behavior. Profit Maximization You may remember from your Econ 211 class that a perfectly competitive firm chooses to produce where P = MC, or you might have learned that a price taking firm chooses to produce where MR = MC. Both of these are true. The reason is because that for a price taking competitive firm, MR = P. Why? Because the price taking firm takes the price as given, the demand curve facing an individual firm is a horizontal line at the prevailing market price. If the market price is $10, the firm acts as though it can sell 1 Econ 500 Microeconomics Review - Perfectly Competitive Firms all it wants at a market price of $10. A consequence of this fact is that the marginal revenue curve of a competitive firm is also a horizontal line at the market price. Quantity 0 1 2 3 4 5 Price $10 $10 $10 $10 $10 $10 Total Revenue $0 $10 $20 $30 $40 $50 Marginal Revenue -$10 $10 $10 $10 $10 On the right, we picture the overall market demand curve; on the left we picture the situation facing one individual firm. If for whatever reason the prevailing market price was P0, then each individual firm would face a horizontal demand curve (and marginal revenue) curve located at P0. (I believe in class we did this the other way around – it makes no difference). P P S d = mr P0 D q Q Choosing Output in the Short Run If the firm is to produce, the firm will operate where P = MC (or MR = MC). It turns out there are three relevant cases we will want to discuss. We will also assume that all fixed costs are sunk, and that all firms have identical costs. 2 Econ 500 Microeconomics Review - Perfectly Competitive Firms High Price: First, consider the case where P is “high”.1 If the firm is to produce, it will choose to produce where P = MC (or MR = MC). In the graph below, it is labeled q*. P ($ per unit) MC P = MR $25 ATC AVC $21 q* = 20 q We can illustrate profits graphically. If for instance, P = $25, and ATC = $21, this means there is an average profit of $4 per unit. If we knew that say 20 units were produced, we would know in this case that total profit was $80. Graphically, this area is depicted above. Shade in the area between P and ATC and from q = q* to q = 0. This firm is earning positive economic profits. P > ATC, so the firm is earning enough to cover variable costs and fixed costs. The firm will of course continue to operate. More generally, if P > ATC, firms will continue to operate. Medium Price: Now, consider the case where the price is “medium”.2 Again, if the firm is to produce, it will produce where P = MC, or MR = MC. In the picture below it is labeled q*. If ATC is $20, while P = $16, the firm is losing $4 per unit. Because 18 units are being produced, profits are -$72. This firm is earning negative economic profits – the firm is losing money. The losses are shaded in the graph below. The question is, should the firm produce 18 units, or should it shut down? If the firm produces nothing (shuts down), it still has to pay its fixed costs, because they are sunk. How much are fixed costs? Recollect that ATC = AVC + AFC. Therefore, the gap between ATC and AVC is AFC. In this example, ATC = $20, AVC = $14, so AFC are $6. Since 18 units are being produced, we can 1 2 Any price where P intersects the MC curve where P > ATC. Any price so that P intersects the MC curve where P is between AVC and ATC. 3 Econ 500 Microeconomics Review - Perfectly Competitive Firms calculate total fixed costs are $108 ($6 * 18 = $108). If the firm shuts down, then it will have no variable costs, no revenue, and will have paid its fixed costs of $108, and thus profit would be -$108. If the firm produces 18 units, as we noted above, the profit level is -$72. While the firm is losing money by producing overall, it will lose less money by producing. It should not shut down. In fact, in any case where P > AVC, price will be enough to cover the variable costs and still cut into the fixed costs. The firm should continue to operate. More generally, as long as P > AVC, the firm will produce (at least in the short run.)3 P ($ per unit) MC ATC AVC $20 $16 P = MR $14 q* = 18 q 3 If you are thinking that the fixed costs can be ignored because they are sunk, you are correct. So long as the price is enough to cover the variable costs, the firm will want to operate. 4 Econ 500 Microeconomics Review - Perfectly Competitive Firms Low Price: Finally, consider a "low" price.4 Again, if the firm is to produce, it will produce where P = MC, or MR = MC. In the picture below it is again labeled q*. P ($ per unit) MC ATC AVC $23 $14 P = MR $12 q* = 12 q If the firm is to produce, it will produce 12 unites. Say price is $12, AVC is $14, and ATC is $23, should the firm operate? Note that the gap between ATC and AVC is $9, which means that AFC must be $9. Because 12 units are being produced, this again makes fixed costs $108 (of course the same as we had above -- fixed costs are fixed). If the firm shuts down, we know the firm’s profits are -$108. If the firm produces 12 units, it will lose $11 a unit, and because 12 units are being produced, the firm’s profits are -$132. This loss is shaded above in red. Clearly it is better for the firm to shut down, because price is not even high enough to cover variable costs. It is better to lose $108 than to lose $132. More generally, if P < AVC, the firm will shut down. Is there a concise combination of this information – the firm’s short run supply curve? Yes. We now know that if the firm is going to operate, it will operate where P = MC (or MR = MC). We also know in the short run, the firm will operate as long as the P > AVC. If you imagine trying every possible price, and connect the dots, you fill find that the firm’s short run supply curve is the portion of the firm’s MC curve above AVC. See the picture below – the firm’s supply curve is the thick black line. So after all that, we know where a firm’s short run supply curve comes from. 4 Any price where P intersects the MC where P < AVC. 5 Econ 500 Microeconomics Review - Perfectly Competitive Firms P ($ per unit) MC ATC AVC Firm’s Short Run Supply Curve q What happens as we transition to the long run? High Price: Keep in mind when we added up costs, we included the opportunity cost of the proprietor’s time and the opportunity cost of capital. If we end up with economic profit equal to exactly zero, that means price is just high enough to cover all costs, variable costs and fixed. The proprietor is earning fair or normal return for their time. The capital invested is earning a fair or normal rate of return on its investment. The capital could not earn more elsewhere.5 With P > ATC, in the short run, firms will be earning positive profits (economic profits above 0). A positive economic profit means that firms in this industry are earning profits better than in other industries. Capital in this industry is earning a higher return than capital in other industries, sometimes called an above normal return. As a result, we will expect new firms to be attracted to this industry. In short, there will be entry. Entry will increase output in the industry and drive down price. How low must prices go until there is no longer an incentive to enter the industry? Prices must fall until economic profits are zero. At what price are economic profits zero? Where P = ATC. Price will be just high enough to cover fixed and variable costs. Likewise, price will be just high enough so that capital earns a fair or normal rate of return. In the long run, entry will occur until economic profits are driven to zero and price is driven to the minimum of the ATC curve. Medium Price: We have assumed all of our fixed costs are sunk. For example, if the firm’s only fixed costs was a lease that was signed for say a year, the moment this lease is signed it would be a sunk cost as it is not recoverable. In the “medium” price case, price is high enough to cover variable costs, but only some, not all of the firms fixed costs. If the time comes to sign a lease for next year, would the firm do it? That is, if the fixed costs 5 Remember that even though economic profits are 0, accounting profits will be greater than 0. 6 Econ 500 Microeconomics Review - Perfectly Competitive Firms are not sunk, should the firm stay in business? Should the firm continue to operate if it will be earning negative economic profits? The answer is no. Next year’s lease is not a sunk cost; it is avoidable. The firm will not want to continue operating at a loss. Some firms will shut down. In short, exit will occur. Firms will leave, industry output will decrease, and prices will rise. How high must price increase until there is no longer an incentive for firms to exit? Again, price must rise until economic profits return to zero. At what price are economic profits zero? Again, where P = ATC. In the long run, exit will occur until price rises to the level where economic profits are zero. Again, price will be driven to the minimum of the ATC curve. Low Price: Not much to say here. At this price, because the firm shuts down immediately, there is obviously exit from the industry. Exit will occur, price will rise, and firms will continue to exit until economic profits are zero and P is at the minimum of the ATC curve. Below is a picture of a firm operating where economic profits are zero. P ($ per unit) MC ATC AVC P = MR q* q Big Picture Keep in mind what we’ve assumed. There are many firms, producing a homogeneous product, and importantly entry and exit are easy. Ask yourself if they are realistic in real world situations. Pick your favorite industry. Are there are large number of firms in each industry? Do they produce homogenous products? Is entry and exit easy? If not, our model won’t do such a great job predicting behavior. It is really only a starting point. If there are a small number of firms, firms may be able to charge prices above the competitive level, or perhaps collude or otherwise behave strategically. If different firms produce differentiated products, each firm may be able to charge different prices, as a perfect substitute is not available for each firm’s product. As a result, they will have more latitude in pricing. If entry and exit are not easy, economic profits could persist for long periods of time. 7 Econ 500 Microeconomics Review - Perfectly Competitive Firms Also, we have implicitly assumed that firms all have the same costs. If a firm has a cost advantage, it will be able to produce at a lower cost, will sell more output than other firms, and will earn additional profits. If a firm has a cost disadvantage, it will struggle to say in business. We will start to work on next is what happens as the number of firms decreases – this makes firm behavior much more fun and much more strategic. What should I read? Chapter 8 in Baye. The primer in Besanko. 8 Structure / Conduct / Performance The Structure / Conduct / Performance paradigm is a bit of an outdated way to describe the differences across market structures and the resulting performance of the firms and industries. It is nice because it introduces some variables and ways to categorize the conditions facing different industries. We first focus on Structure – trying to describe the differences across firms. Structure Market Structure – factors such as • number of firms that compete in a market • the relative size of the firms (concentration) • technological and cost conditions • demand conditions • ease at which firms can enter / exit the industry. Different firms have different structures – and these affect managerial decision marking. See Table 7-1 in Baye for differences in sales for biggest firms in various industries. Structure: Concentration Two main measures of concentration – C4 and the HHI. C4 = Four firm concentration ratio S1 = sales of the largest firm S2 = sales of 2nd largest firm S3 = sales of 3rd largest firm S4 = sales of 4th largest firm ST = total sales of all firms in the industry (including 5th thru Nth largest firms) C4 = (S1 + S2 + S3 + S4) / ST Alternatively, C4 = w1 + w2 + w3 + w4 w1 = market share of largest firm w2 = market share of 2nd largest firm w3 = market share of 3rd largest firm w4 = market share of 4th largest firm C4 ranges from 0 to 1. With a large number of (small) firms, C4 is close to zero. With a small number of (large) firms, C4 is close to one. With four or fewer firms, C4 = 1. See Table 7-2 in Baye: Good Breakfast Cereals Breweries Milk Jewelry Ready-mixed concrete C4 83 90 21 13 7 HHI 2446 --205 81 29 HHI = Herfindahl-Hirschman Index HHI = 10,000 * Σwi2 HHI squares the market shares of each firm and adds them up. It includes all firms whereas c4 contains only 4. The multiplication of this sum by 10,000 serves to ensure the number is not a decimal. HHI ranges from 0 - 10,000.1 An industry with a single firm (monopoly) would have an HHI of 10,000. Example: Three firms, with sales of $10, $10, and $30, respectively. Firm 1’s market share is $10 / $50 = 0.2 Firm 2’s market share is $10 / $50 = 0.2 Firm 3’s market share is $30 / $50 = 0.6 HHI = 10,000 * (0.22 + 0.22 + 0.62) = 10,000 * (0.04 + 0.04 + 0.36) = 10,000 * 0.44 = 4400 For a comparison, C4 in this case would be C4 = 0.2 + 0.2 + 0.6 = 1 The Department of Justice antitrust guidelines use HHI. Caveats with both measures • Don’t include imports – consider beer. With many imported beers available to consumers, the beer industry is likely much more competitive than calculated with just the domestic data. • National, not regional or local – in some cases, a regional HHI or C4 might be more appropriate. For instance, if there was one gas station in each state, and we assumed each station or state was the same size, each gas station would have a national market share of 0.02, making the C4 = 0.08, leading us to think the market was very competitive. However, if there were only one gas station in each state, each station would have much monopoly power. • Product definitions – what should we include when we calculate the HHI for soft drinks? Coke and Pepsi should be in. Should we include root beer, fruit drinks, bottled water, gin? It is difficult. You can actually make a living do this. • Industry definitions – how do we classify firms? Uncle Sam has come up with SIC (Standard Industry Classification) codes, but they aren’t perfect, but helpful. Read Baye if you are interested. Structure: Technology Labor intensive technologies: accounting, econ 211 lectures Capital intensive technologies: ship building, auto manufacturing In some industries, a firm might have superior technology than competitors – oil drilling In other industries, all firms might have identical technology as their competitors – restaurants 1 When Besanko reports HHI, they don’t multiply by 10,000. So in Besanko, the HHI ranges from 0 to 1. Structure: Demand Conditions General demand conditions Broadly speaking, we sometime see low demand or can support only a few firms. My business idea: “Wrinkle in Time”. In other cases, demand is sufficiently large that it can support many firms. In such cases, niche firms can exist. Comic book stores? Scarf stores? Information available to consumers: Prices: Used Cars vs. Flights, Sushi vs. Mrs. Paul’s fish sticks Elasticity of Demand Brand vs. product elasticities Elasticity of demand for Marlboros is different from elasticity of demand for cigarettes Rothschild Index: provides a measure of sensitivity to price of product group as a whole relative to the sensitivity of quantity demanded of a single firm R = ET / EF ET = elastiticity for the total market EF= elasticity for the product of an individual firm Rothschild ranges from 0 to 1. If R = 1 firm’s elasticity same as the market demand curve If R = 0, firm’s elasticity much larger than the market demand curve If R = 0.10, a firm’s demand curve is 10 times more sensitive that the industry level elasticity. See Baye Table 7.3 Good Food Tobacco Apparel Paper Agriculture ET -1.0 -1.3 -1.1 -1.5 -1.8 EF -3.8 -1.3 -4.1 -1.7 -96.2 R 0.26 1.00 0.27 0.88 0.02 Structure: Potential for Entry Barriers to Entry ƒ Explicit Costs – Capital requirements ƒ Patents – you can’t duplicate Lipitor until its patent runs out in 20 years ƒ Economies of Scale – the efficient scale of production might be very large (autos?) making it difficult for new firms to achieve this scale. This isn’t unrelated to capital requirements. More later on barriers to entry… Conduct Having dealt with the observable differences in the characteristics of firms (structure), we turn out attention to the firm’s conduct. What do they do? How much do they mark-up their products? Do they merge with other firms? Do they spend on advertising? On R&D? The bigger here is the pricing behavior. Conduct: Pricing Behavior Lerner index – difference between P and MC as a fraction of the price L= P − MC P The Lerner index (L) tells us how much the mark-up is as a fraction of the price of the good. The Lerner index varies from 0 to 1. If P = MC, as it would be in a perfectly competitive industry, L = 0. If P is much larger than MC, say P = $100 and MC = $1, the Lerner would be L = 0.99, very near one. Alternatively, we could solve for the price as a function of the marginal cost. So let’s solve for P. L= P − MC MC MC ⇒ L = 1− ⇒ L −1 = − ⇒ − P( L − 1) = MC P P P MC − MC ⎛ 1 ⎞ ⇒P= ⇒P= ⇒ P = MC ⎜ ⎟ 1− L L −1 ⎝1− L ⎠⎛ 1 ⎞ ⎟ . ⎝1− L ⎠Thus, P = MC ⎜ So now price is expressed as a function of the MC of producing and 1 , which is called the 1− L mark-up factor. Examples: When P = $5 and MC = $4, L= P − MC 5 − 4 = = 0.2 P 5 1 1 1 = = = 1.25 1 − L 1 − 0.2 0.8 So we can think of the “mark-up” as being 20% of the price, or can think of the price as being 25% higher than MC (from the mark-up factor of 1.25). I think the latter is more intuitive. When P = $2 and MC = $1, L= P − MC 2 − 1 = = 0.5 P 2 1 1 1 = = = 2. 1 − L 1 − 0.5 0.5 So here we can think of the mark-up as being 50% of the price, or can think of the price as being 100% higher than MC (from the mark-up factor of 2). Again, I think the latter is more intuitive. See Table 7.5 in Baye for more real world examples. Food Tobacco Leather L 0.26 0.76 0.43 MUF 1.35 4.17 1.75 Conduct: Integration & Merger Behavior Vertical Integration: Various states in the production of a single product are carried out a single firm: A car company could buy steel, makes engines, make bodies, put them together, and therefore builds cars. Alternatively, it could buy engines, buy bodies, and put them together. The reason for vertical integration is transaction costs. An example would be that General Motors once bought Fisher Body Parts. Instead of buying car bodies from Fisher, GM bought Fisher. Horizontal Integration: Merging of the production of similar products into a single firm. The reasons for horizontal integration are economies of scale or score or to enhance market power. But is market power increases, the HHI increases, and this market power is potentially bad for consumers. So our Uncle Sam has come up with some antitrust guidelines: 1800 = highly concentrated, block mergers that increase more than 100. <1000 = unconcentrated, you can merge if you want >1000, <1800 = weight cost savings vs. anti-competitive An example would be the merger of AT& T / Cingular, specifically their cellular divisions. Conglomerate Merger: Integration of product lines into a signal firm of non-related final products. The reason for conglomerate mergers is sometime said to be the ability to smooth revenues by diversifying into product lines. I find that argument a bit sketchy. An example would be the merger of RJR (a tobacco company) with Nabisco (a food / snack company). Conduct: Research and Development, Advertising Industries and firm differ in the amount of research and development they choose. For drug companies, lots of research, while for cereal companies not so much. Both do a lot of advertising. See Table 7-6 in Baye. Bristol-Myers-Squib AT&T R & D Advertising 10.6 9.2 0.6 3.0 Profits 25.9 7.1 P&G (Soaps & Cosmetics) Kellogg 4.8 1.7 9.2 8.7 8.6 8.5 Performance The last chuck on the Structure – Conduct – Performance paradigm is to evaluate the effect on overall profits and social welfare. Managers are surely interest in how profitable the industry is, but economist always like to worry about is the “right” amount of output is produced and if the gains from trade are maximized. We’ll address profits as we go, but not worry so much about the efficiency considerations. Check out profits as a percentage of sales in the last column of Table 6. Structure Conduct Performance - Critique Should we buy this whole Structure – Conduct – Performance train of logic? Some do. They believe in the “Causal” view. Others suggest is it is more complicated, believing in the “Feedback” view. I think the feedback folks are right. But it’s not so far off that you can’t learn anything from it. And if you compare it to what the folks that espouse the 5-Forces view say, it doesn’t seem all that far off. Causal View: Structure causes conduct. If we have a small number of firms (concentrated), this causes market power for the firms, resulting in high prices, high profits, and low social welfare (not enough being produced). Feedback View: Not a one-way street. The conduct of firms can leads to changes in concentration, which then loops back around to the conduct of firms. All of these items are interrelated. 5-Forces View: Growth and sustainability of profits are affected by: (1) entry (2) power of input suppliers (3) power of buyers (4) industry rivals (5) substitutes and complements Market Structures Having discussed all this, we next turn to classify market structures. We can classify firms and industries into 4 broad groups. We’ve already talked about perfect competition. We can quickly know off monopolies. We’ll come back to monopolistic competition later. And we’ll get into oligopoly shortly, using our game theory skills. Perfect Competition: Firms / Buyers: Many firms, many buyers Technologies: Firms have access to same technologies Products: Homogeneous Market Power: Firm has no market power (no firm can alter p, q, or quality) C4 and R: C4, R, tend to be close to zero. Example: corn farming Pricing / Output Rule: P = MR = MC Barriers / Entry: In the long run, entry will occur, zero economic profits, P = min of ATC in LR Bottom line: Ignore your rivals, take market price as given, entry / exit until zero profits. Monopoly Firms / Buyers: One firm that is a sole producer, many buyers Technologies: One firm – n/a Products: One firm - n/a Market Power: Large market power (no competition) C4 and R: C4 = 1, R = 1 Example: local utility Pricing / Output Rule: Restrict output, charge prices above MC. MR = MC. Barriers / Entry: Positive economic profits, P > ATC. Bottom line: No rivals, pick a spot on the demand curve, positive profits Monopolistic Competition Firms / Buyers: Many firms, and many buyers Technologies: Firms can have access to same or different technologies Products: Heterogeneous (differentiated) Market Power: Firms have some market power C4 and R: C4 close to 0, R close to 0 Example: Chili’s Pricing / Output Rule: Restrict output, charge prices above MC. MR = MC. Barriers / Entry: No barriers to entry. Positive economic profits will lead to entry. Bottom line: Ignore rivals? Pick a spot on the demand curve, expect entry if profitable **Advertising: Convince consumers their brand is better or even different Oligopoly Firms / Buyers: A few large firms dominate the market, many buyers Technologies: Firms can have access to same or different technologies Products: Homogeneous or heterogeneous Market Power: Firms have substantial market power C4 and R: C4 and R large (close to 1). Example: Airlines, Auto Manufacturers, Aerospace Pricing / Output Rule: Restrict output, charge prices above MC. MR = MC. But interdependent. Barriers / Entry: Barriers to entry, positive economic profits Bottom Line: strategy is important – mutual interdependence – can’t ignore rivals - models **Bertrand, Cournot Monopoly Why no competitors? a. Economies of scale - LRAC decline as output increases. b. Economies of scope - big firms access to capital at lower cost. c. Cost Complementarities – core competencies d. Patents and Other Legal Barriers • • • • • Need not be big firms – small town movie theater, gas station Firm’s demand curve is market demand curve Free to charge any price – but consumers decide how much to purchase Choose any spot on the demand curve Clear Tradeoff between P and Q. Pricing for Monopoly. Why is MR less than price? Econ 211 style. Price $10 $9 $8 $7 $6 $5 $4 $3 Quantity 1 2 3 4 5 6 7 8 Total Revenue $10 $18 $24 $28 $30 $30 $28 $24 Marginal Revenue $10 $8 $6 $4 $2 $0 -$2 -$4 But we know how to do math from before: Q = 200 – 2P or P = 100 – ½ Q Use inverse demand curve. Because P = 100 – ½ Q, MR = 100 – Q Now, set MR = MC. Say MC = $40 and is constant. MR = MC 100 – Q = 40 Q = 60 Finally, stick back into the inverse demand curve to find the price. See picture below. P = 100 – ½ Q = 100 – ½ * 60 = 100 – 30 = $70 P 100 70 MC 40 D 60 100 200 MR Q More generally, with a typical cost curve. Graphically, first find the quantity where MR = MC. Then scoot up to the demand curve to determine the maximum amount the consumer is willing to pay. P Profit maximizing rate of output MC ATC P ATC D MR Q Q* By the way, if you don’t believe that choosing that quantity is the right one, pick another spot on the demand curve, shade in the box for profits, and see if it’s bigger than the one above. It won’t be. P Not the profit maximizing rate of output P MC ATC ATC D MR Q QWRONG Econ 500 – Game Theory Intro to Game Theory Game theory is the theory of strategic behavior. Its development is largely related to military applications, but game theory is now extensively utilized by those studying economics, management, political science, and even biology and genetics. Broadly speaking, players (participants) are placed in strategic situations called games. Players are given choices they can take, rules (when they can take them), and develop certain courses of actions (strategies). The game is then played, and players either win or lose, or receive some payment (payoffs). For example, in the prisoner’s dilemma, the payoffs will the number of years in prison Bonnie and Clyde serve. In most games, the payoffs will be profits of some hypothetical firm. While games can have more than two players, we will focus on games with only two participants. Some games are simultaneous – people make their choices at the same time (e.g. rock, scissors, paper). Other games are sequential – people take turns (e.g. tic, tac, toe). Most games we’ll look at are one-shot games – games that are played only once, while other games are repeated games – games that are played more than once with the same opponents. Solution Methods Depending on how far you go in game theory, there are number of different ways to solve games. Nash equilibrium One of the most simple is called a Nash equilibrium. A Nash equilibrium is called an “equilibrium” because no player wishes to change his or her strategy. Each person is making the best response to their opponent’s strategy and these strategies are consistent. Some games have what are called pure Nash equilibria. An example of a game of this type is the prisoner’s dilemma. See below. Some games have no (pure) Nash equilibrium. These games are often solved with a method called mixed strategy equilibrium. In these games, some sort of randomness is involved. An example of this type of game is the employee monitoring game. See below. Some games have multiple Nash equilibrium. Determining which of the multiple Nash equilibrium will occur in a simultaneous game is a difficult problem. An example of this type of game is the product choice game. What you will see is that when these games become sequential (taking turns) they become easy to solve. Backwards Induction – Backwards induction is a way to solve sequential games (players take turns). The idea is – surprise – to work backwards. The sequential games we will consider will be solved by backwards induction. The solutions we’ll get are special cases of Nash equilibrium called sub-game perfect equilibria. By going backwards, we are effectively able to eliminate strategy combinations that would not occur. There are others ways to solve more complex games, but we will not get there. We are just scratching the surface. The games you will see, say on an exam, will be similar to those here. We will focus on Nash equilibrium and backwards induction. 1 Econ 500 – Game Theory Prisoner’s Dilemma First off, note that this particular formation of the prisoner’s dilemma wasn’t discussed in class.1 This classic game theory exercise is called the prisoner’s dilemma. The story is just what it sounds like – two criminals are put in separate cells and have been accused of committing a crime (which they have committed). They cannot communicate and will make their decisions simultaneously. It is a one-shot game. If both confess, they both will go to prison for 5 years. If neither confesses, they will be charged with a lesser crime and each go to prison for 2 years. The prosecutor offers a plea bargain to each – if one confesses and the other does not, the one who confesses gets a break – only one year in prison – while the one who does not gets a long sentence, going to prison for 10 years. When this might as first glance seem like textbook BS, this will be very much related to when we discuss pricing and output decisions for in an oligopolistic decision. After you read about Bertrand Oligopoly, come back. And we’ll see a bunch of examples below. The game can be expressed in the following chart: Confess Bonnie Don’t Confess Confess Bonnie: 5 years Clyde: 5 years Bonnie: 10 years Clyde: 1 years Clyde Don’t Confess Bonnie: 1 years Clyde: 10 years Bonnie: 2 years Clyde: 2 years Bonnie’s strategy choices are reflected in the rows of the game. Clyde’s strategy choices are reflected in the columns of the game. Each of the four shaded boxes represents a combination of Bonnie’s strategy and Clyde’s strategy. For instance, if Bonnie chooses not to confess and Clyde chooses to confess, we end up with Bonnie going to prison for 10 years and Clyde going to prison for 1 year. Solving the Prisoner’s Dilemma / Best Responses / Dominant Strategies Where you should always start when looking for the solution to a game is to look for dominant strategies. A dominant strategy is the case where one player’s best response does not depend on their opponent’s strategy.2 First, what is Bonnie’s best response if Clyde chooses to confess? If (Clyde confesses and) Bonnie chooses to confess, she goes to prison for 5 years. If (Clyde confesses and) Bonnie chooses not to confess, she goes to prison for 10 years. Clearly, Bonnie will wish to confess. That is, when Clyde chooses to confess, Bonnie’s best response is to confess. Next, what is Bonnie’s best response if Clyde chooses not to confess? If (Clyde does not confess and) Bonnie chooses to confess, she goes to prison for 1 year. If (Clyde does not confess and) Bonnie chooses not to confess, she goes to prison for 2 years. 1 The game we used in class is later in these notes, labeled as the Cartel / Pricing game. 2 Sometimes students think that games must have either no players or both players with dominant strategies. As you saw in the assignment, a game can be such that only 1 player has a dominant strategy. 2 Econ 500 – Game Theory Again, Bonnie will wish to confess. That is, when Clyde chooses to confess, Bonnie’s best response is to confess. In this case, we say Bonnie has a dominant strategy. Her best response (confess) does not change depending on what strategy her opponent chooses. Whether Clyde chooses to confess or Clyde chooses not to confess, we find that Bonnie’s best response is to confess. We would expect Bonnie to Confess. You should now work through what Clyde’s best responses are. What is Clyde’s best response if Bonnie chooses to confess? What is Clyde’s best response if Bonnie chooses not to confess? Does Clyde have a dominant strategy? If so, what is it?3 Solving the Prisoner’s Dilemma / Nash Equilibrium Back to the idea of a Nash equilibrium. At this point, you will hopefully be inclined to think that the solution to this game is that both Bonnie and Clyde confess. In fact, if both players have dominant strategies, the Nash equilibrium (outcome of the game) will be both play their dominant strategy. It is instructive, however, to confirm that Bonnie confesses, Clyde confesses is in fact a Nash equilibrium. If so, neither player will have an incentive to change their strategy. Let’s check. Given that Bonnie is choosing to confess, is Clyde making his best response by confessing? Yes. Does he want to change his strategy? No. Given that Clyde is choosing to confess, is Bonnie making her best response by confessing? Yes. Does she want to change her strategy? No. Neither wants to change – and their strategies are consistent. Thus, the Nash equilibrium of this game is for both to confess. Both will confess, and both will spend 5 years in prison. Now, at this point hopefully you’re yelling wait a minute. If they both had chosen not to confess, they would both go to prison for only 2 years. True. Why can’t they pull it off? Suppose for a second that Bonnie was reasonably convinced that Clyde will “cooperate” and keep his mouth shut.4 What should she do at this point? She will again want to take the plea and rat him out. Her best response is to confess. The same goes for Clyde. Regardless of what their opponent does, they are better off confessing. In a prisoner’s dilemma type game, there will be a powerful individual incentive to confess (“cheat”), even though what is best for the group (“cooperate”) is for everyone to keep their mouth shut. This type of situations shows up all the time in the real world. Provision of public goods, studying for exams, and importantly cartels (pricing decisions) all can be though of as prisoner’s dilemma situations. I tried to put my money where my mouth was in class one time with undergraduates – 80% of them actually played the Nash equilibrium strategy when playing for extra credit points. 3 You should have found that Clyde also has a dominant strategy to confess. We’d expect Clyde to confess. 4 We mean cooperate from the point of view of Bonnie and Clyde (not cooperate as in cooperating witness). 3 Econ 500 – Game Theory The Prisoner’s Dilemma as a repeated game The analysis above assumes that this game is what we call a one-shot game – a game played only once. The problem with the prisoner’s dilemma is that it is difficult to get cooperation in the face of the selfinterest of the participants. If this game is played repeatedly, however, we get a much more interesting story. If Bonnie and Clyde know each other, have been in this situation many times in the past, and have always kept their mouth shut, it is quite likely that trust may factor into the game and we might see both keep their mouth shut (both don’t confess). However, one interesting aspect of this part of the story is that when we know that the game is in its “last period”, there is no tomorrow and cooperation is very unlikely. That is cooperation induced by repeated games can break down when the end is known. See the end of these notes. Product Choice Game Here is one we didn’t talk about in class. You should try it out. The story here is two breakfast cereal companies are thinking of introducing a new cereal. One is a “crispy” cereal and the other is a “sweet” cereal. Check out the payoffs (profits) in the table below. The game has been set up so the firms don’t care which product they produce, so long as both firms don’t introduce the same product. The idea is there “isn’t enough room” in the market for two new crispy cereals or two new sweet cereals. The firms make their decisions simultaneously without communicating. Crispy Firm 1 Sweet Crispy Firm 1: -5 Firm 2: -5 Firm 1: 10 Firm 2: 10 Firm 2 Sweet Firm 1: 10 Firm 2: 10 Firm 1: -5 Firm 2: -5 First check for dominant strategies. What is Firm 1’s best response if Firm 2 chooses crispy? What is Firm 1’s best response if Firm 2 chooses sweet? Choose sweet Choose crispy Does Firm 1 have a dominant strategy? No. Their best response changes depending on their opponent’s strategy. What is Firm 2’s best response if Firm 1 chooses crispy? What is Firm 2’s best response if Firm 1 chooses sweet? Choose sweet Choose crispy Does Firm 2 have a dominant strategy? No. Their best response changes depending on their opponent’s strategy. Since we don’t have any dominant strategies, we’ll have to work harder to come up with the solution to this game. While a brut force method, you can always check “manually” to see if a certain combination is a Nash equilibrium. Let us try out a couple. Then we’ll show you an easier way. 4 Econ 500 – Game Theory Possibility #1 - Firm 1 chooses crispy, Firm 2 chooses crispy: Is it a Nash equilibrium? To find out, check to see if each player is making the best response to their opponent’s strategy. Given that firm 1 chooses crispy, is Firm 2’s best response to choose crispy? The answer is no. Firm 2 would want to change their strategy. That is enough to tell you this is not a Nash equilibrium, but let’s pile on. Given that firm 2 chooses crispy, is Firm 1’s best response to choose crispy? The answer is no. Firm 1 would want to change their strategy. Again, this is not a Nash equilibrium. Possibility #2 - Firm 1 chooses sweet, Firm 2 chooses crispy: Is it a Nash equilibrium? Again, to find out, check to see if each player is making the best response to their opponent’s strategy. Given that firm 1 chooses sweet, is Firm 2’s best response to choose crispy? Yes. They don’t want to change their strategy. Given that firm 2 chooses crispy, is Firm 1’s best response to choose sweet? Yes. They don’t want to change their strategy. Neither wants to change. Firm 1 choosing sweet and Firm 2 choosing crispy is a Nash equilibrium. You try out the other two possibilities. Possibility #3 - Firm 1 chooses sweet, Firm 2 choosing sweet Possibility #4 - Firm 1 chooses crispy, Firm 2 chooses sweet5 In this game, there are two Nash equilibria – both involve one firm choosing crispy and the other firm choosing sweet. How do we know which one will happen? In a strict game theory sense, we don’t. But let’s go outside the game and think about the “real world”. This is a game about coordination. What might we expect the firms to do in this case? Perhaps one firm will send out a press release that says they are introducing a sweet cereal. This would be an indication to the other firm that they should choose sweet. Might this have something to do with trade group meetings?6 Technically, the press release would have changed the game from a simultaneous move game to a sequential game. More in a bit. For now – all we can say is that we have a coordination problem. Aside: Is there an easier way to find Nash Equilibria? There is. Put yourself in the shoes of Firm 1 for a moment. Now, suppose you know Firm 2 was going to choose crispy. Put a circle around your best response. (I’ve labeled this 1.) Now, suppose you know Firm 2 was going to choose sweet. Put a circle around your best response. (I’ve labeled this 2.) Now, put yourself in the shoes of firm 2 for a moment. Imagine you know Firm 1 is going to choose crispy. Put a circle around your best response. (I’ve labeled this 3.) Now imagine you know Firm 2 is going to choose sweet. (I’ve labeled this 4.) Put a circle around your best response. If you have a combination of strategies that has two circles (one indicating player 1’s best response and the other indicating player 2’s best response), that combination of strategies is a Nash Equilibrium. See below. 5 Possibility 3 is not a Nash Equilibrium, while Possibility 4 is a Nash Equilibrium This game is similar, but not exactly the same as the “coordination” game between the husband and wife involving the opera and theatre. See below. 6 5 Econ 500 – Game Theory Crispy Firm 1 Sweet Crispy Firm 1: -5 Firm 2: -5 Firm 1: 10 Firm 2: 10 1 4 Firm 2 Sweet Firm 1: 10 Firm 2: 10 Firm 1: -5 Firm 2: -5 2 3 You should try out this trick on the prisoner’s dilemma game above. Confirm the Nash equilibrium is for both to confess. This is a bit quicker that trying them all out. Beach Location Model You and a competitor plan to sell stuff on a beach that is 200 yards long. The left side of the beach is labeled 0; the right side of the beach is labeled 200. Customers on the beach are spread evenly across the beach and will choose the closest vendor because each vendor’s product is assumed to be identical. Each vendor chooses where to locate. What is the Nash equilibrium of the game? 0 100 200 To write down the game chart for this game would take a very long time. You could locate at 0, 1, 2, 3, …, 198, 199, 200, as could your opponent. However, you can solve this game pretty simply. Consider you locating at 5 and your opponent locating at 6. Is this a Nash equilibrium? Given you are located at 5, is it your opponent’s best response to locate at 6? Yes. You will capture all the customers located from 0 to 5 (those customers on the far left of the beach) but your opponent will capture all the customers from 6 to 200 (everybody else) and enjoy toasty profits. Given that your opponent is located at 6, is it your best response to be located at 5? No. You’d be better to move to 7, and thereby capture all the customers from 7 to 200, leaving your opponent to serve only those customers from 0 to 6. Therefore, you locating at 5 and your opponent locating at 6 is not a Nash equilibrium. If you were at 7, your opponent would want to move to 8. If your opponent were as 8, you’d want to move to 9. And so on… The only Nash equilibrium to this game is for both of you to locate as close to the center of the beach as possible. Only then would neither of you have an incentive not to move – only then would you have a Nash equilibrium. Textbook BS? Why are fast food restaurants, gas stations, car dealerships, and hospitals (?) located right next to each other? It might be zoning, but it might be game theory. The implications for politics are clear and important. If the dots below are George Bush, Ralph Nader, Pat Buchannan, and Al Gore, which dot is which? Why weren’t Ralph and Pat nominated? After the primary is over, which way should George Bush move? Which way should Al Gore move? Does an incumbent president that doesn’t face a serious primary challenger have an advantage? Liberal Conservative 6 Econ 500 – Game Theory Employee Monitoring Game The story here is the workers can either work hard (work) or be lazy (shirk). The manager can either check up on the employee to see if they are working (monitor) or not (don’t monitor). When we did this in class we used W and L, but we just as well can use 1 and -1. • If the manager monitors a worker that was already working, the worker wins and the manager loses (wastes time monitoring an employee that was working). • If the manager monitors a worker that was shirking, the workers loses and the manager wins. • If the manager doesn’t monitor a worker that was working, the manager wins and the employee loses (the worker could have gotten away with shirking). • Lastly, if the manager doesn’t monitor a worker that wasn’t working, the manager loses and the employee wins. All this boils down to the foiling game: Monitor Manager Don’t Monitor Work Manager: -1 Worker: 1 Manager: 1 Worker: -1 Worker Shirk Manager: 1 Worker: -1 Manager: -1 Worker: 1 First, check for dominant strategies. You’ll find there is none. Do the circle trick or write them out. What is the manager’s best response if the worker works? What is the manager’s best response if the worker shirks? Don’t monitor Monitor What is the worker’s best response if the manager monitors? What is the worker’s best response if the manager doesn’t monitor? Shirk Work Now, check for Nash equilibrium. There are none. Don’t believe me? Pick any combination, for example, the worker monitors and the worker works. Is it a Nash equilibrium? Given the worker is working, manager’s best would be don’t monitor – the manager would want to change their behavior. You’ll find if you pick any other combination, it too, will not be a Nash equilibrium. How then do we “solve the game”? What would be the outcome? The best answer here is that the boss should randomly monitor the worker. If the worker knows when the boss will be monitoring, the monitoring won’t be effective. However, if the worker doesn’t know the boss will be monitoring, the effort level may increase all the time. When randomness is involved, the solution is called a mixed strategy equilibrium (as opposed to a pure strategy equilibrium). You don’t need to remember the terminology, but it might help to have the idea of the solution of the game. What does this have to do with the real world? I’d argue that monitoring employees is pretty real world. Lance Armstrong, we’ll be having a drug test next week. DUI checkpoints? Auditing theory? Poker? Bluffing all the time is a bad idea. But so is not bluffing all the time. 7 Econ 500 – Game Theory Product Choice, Revisited Another new one we didn’t discuss in class. Thus far, games have been played simultaneously. You can have more fun if players take turns (sequential games). Revisit the cereal game, only this time let’s have the firm take turns. To make things a bit more interesting, let’s suppose the sweet cereal product is more desirable (higher profits) than the crispy product. However, if both firms introduce the same product, both will lose money. Check out the payoffs and game below. The numbers in the payoffs are again profits. With sequential games, we have to be more careful about who is choosing when. We start on the left. First firm 1 chooses. Then firm 2 chooses. If firm 1 chooses crispy, firm 2’s choices are given on the upper portion of the game tree. If firm 1 chooses sweet, firm 2’s choices are given on the lower portion of the game tree. crispy crispy Firm 2 chooses sweet Firm 1: -5, Firm 2: -5 Firm 1: 10, Firm 2: 20 crispy Firm 1: 20, Firm 2: 10 sweet Firm 1: -5, Firm 2: -5 Firm 1 chooses sweet Firm 2 chooses To solve sequential games, work backward (use backwards induction). If Firm 2 finds it self on the upper portion of the game (if firm 1 has chosen crispy), what will they do? They will choose sweet (20 in profits rather than -5). If Firm 2 finds it self on the lower portion of the game (if firm 1 has chosen sweet), what will they do? They will choose crispy (10 in profits rather than -5). A good way to solve these games is to bold the choices we expect firm 2 to make and basically eliminate choices we don’t expect firm 2 to make. We bold in the ones they will make and ignore the others. See below. 8 Econ 500 – Game Theory crispy crispy Firm 2 chooses sweet Firm 1: -5, Firm 2: -5 Firm 1: 10, Firm 2: 20 crispy Firm 1: 20, Firm 2: 10 sweet Firm 1: -5, Firm 2: -5 Firm 1 chooses sweet Firm 2 chooses Now, given that firm 1 anticipates firm 2’s choices, firm 1 will choose sweet (knowing firm 2 will react by choosing sweet), resulting in firm 1 earning 20 in profits. (If instead, firm 1 had chosen crispy, firm 2 would have chosen sweet, and firm 1 would have earned only 10 in profits.) See below. crispy crispy Firm 2 chooses sweet Firm 1: -5, Firm 2: -5 Firm 1: 10, Firm 2: 20 crispy Firm 1: 20, Firm 2: 10 sweet Firm 1: -5, Firm 2: -5 Firm 1 chooses sweet Firm 2 chooses The outcome of the game will be Firm 1 chooses sweet, firm 2 chooses crispy. In fact, we’d say that Firm 1 choosing sweet and firm 2 choosing crispy is a sub-game perfect equilibrium. Notice the first mover advantage. By choosing first, Firm 1 ensures 20 in profits (by choosing the lucrative product). This is why there is said to be a first-mover advantage. Real world? Firms that are the first to introduce products may reap rewards. Ipods? See Besanko. (In)Credible Threats Suppose Firm 2 told firm 1 that no matter what firm 1 decided, firm 2 was going to introduce the sweet cereal. Firm 2 would be trying to convince firm 2 that it would produce sweet cereal, in hope that firm 1 would introduce the crispy cereal. If successful, firm 2 would get the 20 in profits instead of 10. 9 Econ 500 – Game Theory Would the threat be credible, however? That is, would firm 1 believe that Firm 2 would carry through on its threat? Probably not. Because if firm 1 chose sweet, firm 2 would be faced with choosing crispy and earning 10 in profits or choosing sweet and losing 5 in profits. It is very unlikely firm 2 would do this. The threat is not credible.7 Therefore, Firm 1 should again choose sweet. I am always reminded of the horrifying road trips I took when my mother threatened to turn this car right around if I didn’t stop throwing twizzlers at my sister (usually about 600 miles from home). Those threats were not credible. I wish they were - I’d have thrown more twizzlers. See the assignment. Sub-game Perfect Equilibrium It is pretty hard to come up with a good definition of a sub-game perfect equilibrium. One textbook suggests it is a Nash equilibrium where no player can improve at any stage of the game. I’m not sure there is much value in wrangling over the definition. Here is what is important, though. If you use backwards induction, and have each player choose optimally in any sub-game (any decision that they might possible face), the result of doing backwards induction is a sub-game perfect equilibrium, and an outcome that is highly likely. Infinitely Repeated Games Thus far, we have seen a number of prisoner’s dilemma style games where the “cheating” outcome prevailed even though there was a “cooperative” outcome that would have been better for the participants. However, this has occurred in one-shot games. We’d like to change the story now by having the same players repeatedly interact with one another. When we play repeated games, we assume that the game is played once a time period (once a year). Time period 0 refers to the current period, time period 1 refers to the period 1 year from today, and so on. As I’m sure you know, dollars in the future are not the same as dollars today, so we’ll have to divide by a discount factor. Firms will want to maximize the discounted present value of payoffs to the firm. Letting π stand for the payoff, i stand for the interest rate, and subscripts numbering the year, we have: PV = π 0 + π1 1+ i + π2 (1 + i ) 2 + π3 (1 + i ) 3 + π4 (1 + i ) 4 + ... + πT (1 + i )T It also turns out there is a math trick – the formula for perpetuity. As long as the payments are the same amount, the first payment comes one year from today, and the payments are repeatedly infinitely (forever), the formula for the present value simplifies:8 7 If somehow Firm 2 could become the first mover – and introduce the sweet cereal before firm 1 decided, that would be a different story – in fact a different game – and not the game being played here. 8 If you check Baye’s book, they give you a slightly different formula. They are assuming the first payment ⎛1+ i ⎞ ⎟π which is found by taking ⎝ i ⎠is coming today (t = 0). In that case, the formula is PV = ⎜ expression I have , adding π, and simplifying. 10 Econ 500 – Game Theory PV = π 1+ i + π (1 + i ) 2 + π (1 + i ) 3 + π (1 + i ) 4 + ... = π i Trigger Strategy We know that when prisoner’s dilemma games are played as one-shot game, the Nash equilibrium is for each player to cheat. But with repeated games, folks might do better. In order to discuss trigger strategies, you might find it is helpful to translate your game’s options into “cooperating” and “cheating”. In the context of the prisoner’s dilemma proper (two people locked up in separate cells), cooperating was to not confess while cheating was to confess. In the context of the cartel game, cooperating was choosing the high price while cheating was choosing the lower prices. With repeated games, there is a possibility the players can do better than repeatedly choosing to cheat. One such possibility is a trigger strategy. The basic idea of trigger strategy is to choose the cooperative strategy so long as your opponent also plays the cooperative strategy. If, however, at any time your opponent plays the non-cooperative strategy, this “triggers” you to switch to the “cheating” strategy, forever. You never return to the cooperative strategy. Figuring Out If Trigger Strategies Are Profitable: Begin by assuming that each player has agreed to play the trigger strategy. Is it an equilibrium? That is, does anyone have the incentive to change his or her strategy? Either you can continue to play the cooperative strategy, or you can cheat. If you continue to play the cooperative strategy, you will repeatedly get the payoff associated with the cooperative outcome. If you cheat, you will receive a larger payoff today (how much?), but you will receive a lower payment in the future (how much lower?) Therefore, if the trigger strategy is going to work (if we are to successfully leave the outcome where both players cheat), the discounted present value of the cooperative outcome forever must be higher than the present value of the one-time gain from cheating and the cheating outcome forever after that. See the assignment, and later the solutions. Repeated Games with a known end I duped you folks a bit on the assignment. It is said that with repeated games, if the end period of the game I known with certainty, the game can unravel to the extent that neither player will ever cooperate. The reason cooperation works in the infinitely repeated game is because there is a cost to cheating. When someone deviates from the trigger strategy, they receive the one-time game from doing so. But the deviation results in the loss of all the incremental payments that would have occurred if they cooperated instead of cheated. That is, they lose the difference between the present value of the cooperative outcome forever and the present value of the cheating outcome forever. With low enough discount rates, the cooperative outcome can occur. 11 Econ 500 – Game Theory Consider a game that will be played exactly 5 times. You might think that a trigger strategy might work. But consider the incentives in the 5th (last period).9 In the 5th period, there is no future. There is no cost to cheating, as there is no future cooperation to consider. At this point, the game is a one-shot game, and each will cheat in the 5th period. But now, consider what happens in the 4th period. Given that each player knows the other will cheat in the 5th period, is there any cost to cheating in the 4th period? Again there is “no future” and there is no cost to cheating in the 4th period. So each player will then cheat in the 4th period. And then the 3rd period. And it continues on up to the 1st period. So the story is, in a game with a known end, cooperation is very unlikely to occur. This caused much discussion in class. Some of you don’t buy it – suggesting that cooperation might occur. You might be right. However, I will say this. The trick on sequential games is to go backwards. What I can say is that the subgame perfect equilibrium in a repeated game with known end is to cheat every period (in the context of a trigger strategy). Does this have anything to do with firms firing employees who give their two weeks notice? If you are not offended by somewhat crude hand gestures, click on the link below to see my t-shirt. Way too much build up for you to be impressed now. Don’t forget about T. My t-shirt idea Repeated Games with unknown end This bit originally appeared as an announcement on BB. Something that came up after class - regarding the result that some of you didn't like about repeated games with known ends. The story on the repeated games was that if the last period is known, each player will have the incentive to cheat in the last period, and thus have the incentive to cheat in the period before that, and so on, until the game unravels and each person cheats throughout. Remember, to solve sequential games, you need to work backwards. The sub-game perfect equilibrium is to cheat the whole time. A caveat. A game theoretician would tell you that this is the equilibrium in the game. As I said, my undergraduates tend to cooperate for a while, but they usually pull the trigger before the last period. I'm not convinced that people would unravel to the extent to which the game theory guys say they would. But nonetheless, the idea is meaningful. And maybe some time, we can talk about tit-for-tat. But I digress... On to the new part... There is another way to get cooperation without having the game infinitely repeated you might find appealing. Instead of playing the game once a year for ever and ever, we can imagine a situation where we play today, and there is a probability (less than one) that we play again tomorrow. So instead of Coke and Pepsi being around forever, we can say there is a 0.995 probability that the two companies will be around tomorrow and play again. That means there is a 0.9952 probability they will be around the year after that. So long as there is a sufficiently high probability that the game will be played again, we can get cooperation. Repeating, even if we know there is say a 1% chance the game will not be played next period, 9 In game theory notation, the last period is usually indicated by a T (a capital T). Don’t forget this point if you look at my t-shirt! 12 Econ 500 – Game Theory we can still get cooperation. The reason this make sense is because with a probabilistic end to the game, the players don't *know* exactly when the game will end (until after it actually ends). When they are in the last period, they don't *know* they are in the last period. And thus they can't cheat in the last period. Perhaps that is more realistic and more intuitive that thinking of infinitely repeated games. I don't like thinking about infinite amounts of times. Coke and Pepsi won't be around until the end of time, but there is a very high probability they will both be around text time. The discounting we had in our problem 1 / (1 + i) isn't that much different from the probability the game will continue. In fact, instead of having to calculate the discounted present value of the future games, we could instead just calculate the expected value of the future payments - the payments multiplied by the probability they occur. They are both numbers less than one, and as we go out further into the future, they are going to be raised to higher and higher powers. Just as when the interest rate rises it makes players less likely to cooperate (because it "shortens" the future or makes those future payments less valuable), when the probability the game will *not* be repeated increases (it "shortens" the expected future or makes those future games less likely), players will be less likely to cooperate. As the probability the game will end becomes 1 (the probability the game continues is zero), we are back to a one-shot game and cheating becomes certain in (the only) first period. That tidbit is actually discussed in Baye's book if you want to take a closer look - but I should probably have talked about that in class tonight. 13 Econ 500 – Game Theory Appendix – More Games You’ve Seen Baggage Read the intro to Baye’s Chapter 10, then his commentary on the answer at the end of Chapter 10. The basic idea is that it would be good for the industry to limit carry-ons to expedite the boarding process, but if one airline took action unilaterally, they’d likely be penalized. This is a standard prisoner’s dilemma game. “Cooperating” is to adopt tighter standards, while “cheating” is to stick with the current standards. Current Airline A Tighter Current A: 0 B: 0 A: -5 B: 5 Airline B Tighter A: 5 B: -5 A: 2 B: 2 You should confirm that the Nash equilibrium is for both airlines to choose current. How can cooperation occur? Airlines call up the FAA and ask them to enforce “cartel” or “cooperation” by mandating that all airlines have the tight standard. Textbook BS? Many of the most effective cartels we know in the United State (where other cartels are illegal) are actually enforced by government. The American Medical Association restricts the number of doctors, increasing wages of doctors. The city of New Orleans restricts the number of taxicab by requiring a license (and limits the number), increasing wages of cabbies. Major League Baseball restricts the number of teams, increasing ticket prices. Restrictions on shrimp catches? Product Quality Also clipped out of Baye. Don’t Buy Consumer Buy Low Quality C: 0 F: 0 C: -10 F: 10 Firm High Quality C: 10 F: -10 C: 1 F: 1 Confirm that Nash equilibrium is Don’t Buy, Low Quality, and again we have a prisoner’s dilemma game. How can we get cooperation? If the game is repeated. The temptation is for the firm to take the one-time game for cheating. Any behavior that reduces this gain from cheating would make cooperating more likely. We know from before low discount rates will help. But there are other things, outside the game, that are pertinent. Might this be where firms advertise and create “brand name capital”? Spend lots of money on signs? Don’t these actions serve as ways to increase their cost of “cheating”? 14 Econ 500 – Game Theory Cartel, Pricing Game In class, our original presentation of the prisoner’s dilemma game used these payoffs. Low Firm A High Low A: 0 B: 0 A: -10 B: 50 Firm B High A: 50 B: -10 A: 10 B: 10 Last things Go watch the princess bride for yet another lesson on game theory. Recall that scene about which glass of wine has the poison? Second, if you haven’t, read Baye’s chapter 10. It occurred to me about 3 hours into writing these notes I have just recreated the chapter, and done so less thoroughly than Baye. . Finally, if you have some more time, read Besanko, Chapter 7. He has a lot to say about commitments and threats. If you are interested in managerial strategy proper, you’ll like it. 15 Econ 500 – Oligopoly Models (Cournot, Bertrand) Strategic Interactions between Firms Thus far, we have looked mostly at two extreme cases. On the one hand, we had perfect competition. Firms took the market price as given and acted as though they could sell as much as they wanted at the market price. In some regard, a firm didn’t have to pay much attention to what its rivals were doing. On the other hand, we looked at monopolists. By definition, they had no rivals. Again, a monopolist didn’t have to worry about what its rivals were doing either. What we will do next is take a look oligopoly – a situation where there is a small number of firms. Here, strategic interactions between firms will be important. Cournot Duopoly Model Assumptions: • • • • • • • Two Firms (Duopoly) Barriers to Entry Decisions are made on the basis of production Of course, the market price will depend on total production (of both firms) Each firm will treat the other firm’s output level as given when deciding what to produce Decisions are made simultaneously Products can be homogeneous or heterogeneous Suppose the overall market inverse demand is given by P = 30 – Q. Q = Q1 + Q2. That is, the total quantity of output produced is the sum of the output that is produced by firm 1 (Q1) and the output produced by firm 2 (Q2). For the moment, we imagine that both firms marginal cost of producing is 0. (MC1 = MC2 = 0). What we want to do first is come up with Firm 1’s reaction function. It will tell us how firm 1 will react to various output levels firm 2 will choose. Below I will walk you through how to find it. We will find a few spots on the reaction function. Then we will connect the dots. Keep in mind, we are just figuring out best responses. We’re doing game theory. Point #1: Suppose Q2 = 0. In this case, Firm 1 has the whole market demand curve to itself. The firm will act like a monopolist. We know how to answer this question from before. You could rewrite the demand curve P1 = 30 – Q1. If P1 = 30 – Q1, then MR1 = 30 – 2 * Q1. The firm sets MR= MC. In this case, MC1 = 0. Setting MR = MC (or MR1 = MC1) gives us: 30 – 2Q1 = 0 2Q1 = 30 Q1 = 15. So, if Q2 = 0, firm 1 will choose Q1 = 15. Firm 1’s best response to firm 2 producing nothing is to produce 15 units. 1 Econ 500 – Oligopoly Models (Cournot, Bertrand) P 30 15 D MC MR Q 15 30 Point #2 Suppose Q2 = 1. We have to do some thinking here. If Firm 2 has already produced 1 units, the price never be higher than $29 (P = 30 – Q = 30 – 1 = $29). If firm 1 were to produce 0, the price would be $29. If firm 1 were to produce 1, the price would fall to $28. If firm 1 were to produce 2, the price would fall to $28. If firm 1 were to produce 29 units, the price would fall to $0 (there would be 30 total units produced). It as though firm 1’s demand curve is the market demand curve, scooted over by the 1 unit firm 2 has produced. The expression for this demand curve is P1 = 29 – Q1. P 30 29 MR1 14.5 D1 D MC Q 29 30 But now, the firm is a monopolist with this remaining portion of the demand curve. What does the firm do? Set MR = MC. MR1 = 29 – 2 * Q1. MR1 = MC1 29 – 2 * Q1 = 0 2 * Q1 = 295 Q1 = 14.5 So if Q2 = 1, firm one chooses Q1 = 14.5. Notice, that as a result of Q2 increasing by 1 unit, Q1 decreases by 0.5 units. Or stated differently, firm 1’s best response to firm 2 increasing their production by 1 unit is to reduce their production by half a unit. 2 Econ 500 – Oligopoly Models (Cournot, Bertrand) Point #3 We could keep going forever. This one we didn’t talk about in class. Suppose Q2 = 15. If Firm 2 has already produced 15 units, the price will never be higher than $15 (P = 30 – Q = 30 - 15 = 15). If firm 1 were to produce 0, the price would be $15. If firm 1 were to produce 1, the price would fall to $14. If firm 1 were to produce 15, the price would fall to zero (there would be 30 total units produced). P 30 15 D MR1 D1 7.5 MC 15 Q 30 It as though the firm 1’s demand curve is the market demand curve, scooted over by the 15 units that firm 2 has produced. The expression for this demand curve is P1 = 15 – Q1. But again, the firm is a monopolist with this remaining portion of the demand curve. MR1 = 15 – 2 * Q1. What does firm 1 wish to do? MR1 = MC1 15 – 2 * Q1 = 0 2 * Q1 = 15 Q1 = 7.5 So if Q2 = 15, firm one chooses Q1 = 7.5. Point #4 Another we didn’t talk about in class, but a nice point. Suppose Q2 = 30. If firm 2 has already produced 30 units, the price has already been driven down to 0. Firm 1 will not want to produce at all. So if Q2 = 30, Q1 = 0. Firm 1’s reaction function. Put it all together. It seems like we have been going on for days, but we can finally draw a picture of Firm 1’s reaction function. The reaction function is a curve (or algebra) that tells us how Firm 1 would react to various quantities that Firm 2 would produce. We connect the dots on the 4 points we found above. It turns out it is a nice straight line. Watch the labels on the axes. Q1 on the horizontal, Q2 on the vertical.1 In fact, there is an algebraic expression as well. I’ll show you how in a page or two. Q1 = 15 – ½ * Q2 1 A very common mistake is to label the vertical axis P – don’t do this! 3 Econ 500 – Oligopoly Models (Cournot, Bertrand) It seems Firm 1’s reaction function starts (when Q2 = 0) with Firm 1 acting like a monopolist, and then decreases by a ½ unit for every extra unit of output firm 2 produces, until firm 2 produces so much output that firm 1 no longer wants to produce. Don’t lose track of the endpoints! Q2 Firm 1 is driven out of the market by firm 2 30 Firm 1’s reaction function 16 15 Firm 1 is a monopolist with the whole demand curve 7 7.5 15 30 Q1 What about Firm 2’s reaction function? Same drill. If Q1 = 0, Firm 2 reacts by acting like a monopolist. Thus, Q2 = 15. If Q1 = 1, Firm 2 acts as though its demand curve is P2 = 29 – Q2. It acts like a monopolist with the remaining demand curve and chooses Q2 = 14.5. If Q1 = 15. Firm 2 acts as though its demand curve is P2 = 15 – Q2. It acts like a monopolist with the remaining demand curve and chooses Q2 = 7.5. If Q1 = 30. Firm 2 chooses Q2 = 0. Déjà vu, anyone? Connect the dots. We can express this algebraically as well: Q2 = 15 – ½ Q1. Firm 2’s reaction function starts with the monopoly level of output and decreases ½ a unit for every one extra unit Firm 1 produces. We graph it on the same graph with Firm 1’s reaction function below. 4 Econ 500 – Oligopoly Models (Cournot, Bertrand) Q2 30 Firm 1’s reaction function 15 Equilibrium Firm 2’s reaction function 10 10 15 30 Q1 Equilibrium So know we know how each firm reacts to the other, but what will happen? Suppose Firm 1 assumes Firm 2 will produce some random amount, say 3 units? Firm 1’s reaction function says Firm 1 will want to produce 13.5 units: Q1 = 15 – ½ * Q2 = 15 – ½ * 3 = 13.5. Now if Firm 2’s optimal response to firm 1 producing 13.5 is to produce 3 units, we have ourselves equilibrium. But what does Firm 2 want to do if Firm 1 produces 13.5? Q2 = 15 – ½ * Q1 = 15 – ½ * 13.5 = 8.25 So this is not an equilibrium. What does Firm 1 want to do now given Firm 2 is producing 8.25? Q1 = 15 – ½ * Q2 = 15 – ½ * 8.25 = 10.875 But what does Firm 2 want to do now that firm 1 is choosing 10.875? Q2 = 15 – ½ * Q1 = 15 – ½ * 10.875 = 9.56 We’re getting closer and closer. If you keep going, you’ll find there is only one spot where each firm’s reaction is consistent what that of the other firm. You’ll get closer and closer to the points where the reaction functions intersect, which happens to be where Q1 = 10 and Q2 = 10. This will be the equilibrium. Take a look at the picture above. Notice, Firm 1’s reaction function says if Q2 = 10, then firm 1 will choose Q1 = 10: Q1 = 15 – ½ * Q2 = 15 – ½ * 10 = 10 Firm 2’s reaction function says if Q1 = 10, then firm 2 will choose Q2 = 10. Q2 = 15 – ½ * Q1 = 15 – ½ * 10 = 10. It is a Nash Equilibrium because each firm is making the preferred response to what the other firm is doing, and their responses are consistent with one another. The outcome of the Cournot Model is always found where the reaction functions intersect. 5 Econ 500 – Oligopoly Models (Cournot, Bertrand) Can you find the numerical answer? Once you have the reaction functions, you stick one into the other, do the algebra, and you can find the answer. In this case, Q1 = 15 – ½ * Q2. Q2 = 15 – ½ * Q1. Start with Firm 1’s reaction function Q1 = 15 – ½ * Q2. Now substitute in for Q2 Q1 = 15 – ½ * Q2 = 15 – ½ * (15 – ½ * Q1) Q1 = 15 – ½ * 15 + ¼ * Q1 ¾ * Q1 = 7.5 Q1 = (4/3) * 7.5 Q1 = 10 Now, use Firm 2’s reaction function to find Q2. Q2 = 15 – ½ * Q1 = 15 – ½ * 10 = 15 – 5 = 10 What else can we do? If you keep in mind that the reaction function is basically formed by connecting the dots between (i) the level of output the firm would choose if it were a monopolist - and - (ii) the level of output that drives down P below MC you can figure out lots of stuff. Suppose Firm 1’s MC increases to $10. P 30 10 MC D MR 10 15 20 Q 30 6 Econ 500 – Oligopoly Models (Cournot, Bertrand) What would happen if firm 2 produced nothing? Firm1 would again act like a monopolist MR = MC 30 – 2 * Q1 = 10 ⇒ ⇒ 2Q1 = 20 Q1 = 10 So now if Q2 = 0, Q1 = 10 How much would Firm 2 have to produce now to drive Firm 1 out of the market? If price gets down to MC, there will be no profit for Firm 1. Where does the demand curve run into the MC curve? At Q = 20. So now, if Q2 = 20, firm 1 chooses Q1 = 0. Compare the new reaction function to the old reaction function. As a result of an increase in Firm 1’s MC, the reaction function shifts (in a parallel fashion) towards the origin. In fact, it is still the monopoly output minus ½ a unit for every unit firm 2 produces. See picture below. Q2 30 Firm 1’s reaction function (old) 20 Firm 1’s reaction function (new) 10 15 Q1 30 Finally, stick put both firms together, and you can see the results of Firm 1’s MC increasing (while Firm 2’s remains the same). You sell that Firm 1 will end up producing less, while firm 2 will end up producing more. See picture below. This should jive with your intuition – the firm with a cost advantage should capture a larger share of the market than the firm with a cost disadvantage. Q2 Firm 1’s reaction function 30 Equilibrium (new) 15 Equilibrium (old) Firm 2’s reaction function 15 30 Q1 7 Econ 500 – Oligopoly Models (Cournot, Bertrand) What are other changes I can make? By similar logic you should be able to confirm: • • • • • A decrease in Firm 1’s MC of producing will shift Firm 1’s reaction function away from the origin. An increase in Firm 2’s MC of producing will shift Firm 2’s reaction function towards the origin. A decrease in Firm 2’s MC of producing will shift Firm 2’s reaction function away from the origin. An increase in the demand for the product will shift both firms’ reaction functions away from the origin. A decrease in the demand for the product will shift both firms’ reaction functions towards the origin Things for later How does the overall profit level of the two firms at the Cournot equilibrium compare to the profit level if the firm was a monopoly? If the firms were competitive? We’ll do this with the next example. Bored? Figure out the answer to exactly how much output will be produced after Firm 1’s MC increases to 10. What is expression for Firm 1’s new reaction function? Firm 2’s reaction function is unchanged. Just stick in Firm 2’s reaction function into Firm 1’s new reaction function and solve for Q1. Then use firm 2’s reaction function to find Q1. You should find Q1 = 3.33 and Q2 = 13.67, and P = $13. Adding MC to Cournot -- and a Shortcut Suppose we use the same demand curve we used in the previous lecture, but now go from having no marginal costs to a situation in which each firm has positive marginal costs. Suppose we now have: P = 30 – Q MC1 = MC2 = $10 Now the question is – how much will each firm produce? You could go through the whole process in developing each firm’s reaction function. First we assume Q2 = 0 and then ask what firm 1 will produce. Firm 1 will of course act like a monopolist and set MR = MC. Because P1 = 30 – Q1, MR1 = 30 – 2Q1, and setting MR = MC gives us 30 – 2Q1 = 10. Doing the math leads us to Q1 = 10. And on and on we’d go…If Q2 = 20, Q1 = 0… But it turns out, thankfully, there is a short cut. Suppose we more generally express the inverse demand curve as follows: P=a–b*Q Also, let c1 represent the marginal cost of producing for firm 1 and c2 represent the marginal cost of producing for firm 2. In our current case, a = 30, b = 1, c1 = 10, and c2 = 10. See the footnote below for another example, which is worked out to the bitter end.2 2 If the inverse demand curve were given by P = 60 – 3Q and MC1 = $6 and MC2 = $18, than a = 60, b = 3, c1 = 6, and c2 = 18. 8 Econ 500 – Oligopoly Models (Cournot, Bertrand) You could show that firm 1’s reaction function is: a − c1 1 Q1 = − 2 * Q2 2b And firm 2’s reaction function is: a − c2 1 Q2 = − 2 * Q1 2b I’ll write this info down on the test for you. It looks like a mess, but it is not that complicated. We found before that for every one unit firm 2 produces, firm 1 will want to produce ½ a unit less. That is the second term in firm 1’s reaction function. We also know that if firm 2 produces nothing, firm 1 will act like a monopolist with the whole demand curve. But what is a − c1 ? It is the amount of output firm 1 will produce if it is a monopolist. In the 2b 30 − 10 current case it is = 10 . So all that expression is telling you is that firm 1’s reaction function is firm 2 1’s monopoly level of output less ½ a unit for each unit the other firm produces. The logic would be exactly the same to figure out firm 2’s reaction function. Solving for the equilibrium level of output If you plug and chug, you’ll find: a − c1 1 30 − 10 1 − 2 * Q2 = − 2 * Q2 = 10 − 12 * Q2 2b 2 a − c2 1 30 − 10 1 Q2 = − 2 * Q1 = − 2 * Q1 = 10 − 12 * Q1 2b 2 Q1 = (Firm 1’s reaction function) (Firm 2’s reaction function) Once you get to the point where you have each firm’s reaction function, you can solve for the equilibrium level of output by plugging in Firm 2’s reaction function into firm 1’s reaction function. First write down firm 1’s reaction function. Because Q2 = 10 – ½ * Q1, we can substitute 10 – ½ * Q1 in for Q2.3 Q1 = 10 − 12 * Q2 Q1 = 10 − 1 2 *(10 − 12 *Q1 ) Q1 = 10 − 5 + 14 Q1 3 4 Be careful on the math here. A common mistake is to get the sign wrong on the ¼ Q1. Q1 = 5 Q1 = 43 * 5 = 6.67 Now use Firm 2’s reaction function to find Q2. Q2 = 10 − 12 * Q1 = 10 − 12 * 6.67 = 10 − 3.33 = 6.67 After you read the rest of these notes, you should be able to confirm that Q1 = 9 – ½ * Q2, Q2 = 7 – ½ * Q1. Q1 = 7.33, Q2 = 3.33, Q = 10.67, P = 28, Rev1 = 205.33, Cost1 = 44, Profit1 = 161.33, Rev2 = 93.33, Cost2 = 60, Profit2 = 33.33 3 People who like math – this is a system of two equations with to unknowns. There are many ways to solve this system. They will all yield the same result. 9 Econ 500 – Oligopoly Models (Cournot, Bertrand) Now, we can find a couple of other bits of information: If Q1 = 6.67, and Q2 = 6.67, Q = 13.33. P = 30 – Q = 30 – 13.33 = $16.67. Firm 1’s revenue = P * Q1 = $16.67 * 6.67 = $111.11 Firm 1’s costs = c1 * Q1 = 10 * 6.67 = $66.67 Firm 1’s profits = $111.11 - $66.67 = $44.44 Firm 2’s revenue = P * Q2 = $16.67 * 6.67 =$111.11 Firm 2’s costs = c2 * Q2 = $10 * 6.67 = $66.67 Firm 2’s profits = $111.11 - $66.67 = $44.44 Total profit of both firms (industry) = $88.88 Want some practice? See the previous footnote. What happens if P = 60 – 3Q, MC1 = $6, and MC2 = $18. The answers are in the footnote. How does this compare to a perfect cartel? If the firms formed a perfect cartel, together they would have agreed to act as a monopolist and divvied up the profits. In this case, Q = 10, P = 20, revenue = $200, costs = $100, profit = $100.00. They don’t get cartel profits, but competition doesn’t drive down profits to zero either. If they split production down the middle, each firm could produce 5, so each firm earns revenue of $100, has costs of $50, and profits of $50. 10 Econ 500 – Oligopoly Models (Cournot, Bertrand) Bertrand Duopoly Now, a different model of oligopoly called the Bertrand Model. Again, looking a the strategic interactions between firms. This one is much easier to “solve”, as you’ll see in a second. First, the assumptions: • • • • • • • • Two Firms (Duopoly) Barriers to entry Decisions are made on the basis of price (compare this to Cournot) Of course, the market price will depend on total production Each firm will treat the other firm’s price as given (compare this to Cournot) Decisions are made simultaneously Products are homogeneous or heterogeneous Consumers will purchase only from the low-price producer4 Before you continue, go back to the top of these notes and compare the assumptions here for the Bertrand model to those of the Cournot model. Perhaps a good example of an industry characterized by Bertrand would be two gas stations on the same corner of some intersection. The signs tell consumers the prices of gas – they can clearly see which firm is offering the lower price. It seems at least somewhat reasonable (more later) that consumers will find the two stations’ gas as homogeneous and thus will buy gas from the station offering the lowest price. Now, consider P = 30 – Q, MC1 = MC2 = $10. Let’s consider a case where the goods are completely homogeneous.5 What is the equilibrium? Suppose you rival firm chooses a price of $20.6 What is your best response? By the assumptions of the model, by choosing a price of $19.99, you will capture the entire market and earn large profits. Recall that we’ve assumed that all consumers will purchase from the low price provider. You would have a powerful incentive to undercut your rival’s price. But is this an equilibrium? What would your rival’s best response be to you charging $19.99? They would wish to charge $19.98. And so on… How low can the price go? The equilibrium of the game is for each firm to choose a price equal to MC. Why? If you were charging $10, and your rival was charging $10, neither of you would have an incentive to change your price. This is a Nash Equilibrium. If your rival was charging $10, if you increased your price to $10.01, you would lose all of your business, so clearly there is no incentive to do so. If your rival was charging $10 and you lowered your price to $9.99, you would capture all of the business, but you would be losing money as P < MC. There in no incentive to lower your price. (You’d be earning 0 economic profits at $10.00) Therefore, the equilibrium of the game is for each firm to choose P = MC. 4 If producers choose two different prices, the low-price producer will capture the entire market and the high-price producer will sell nothing. If they choose the same prices, we assume the firms will split the market evenly. 5 I think you’ll be able to work through the basic implications of how the model would be different if there were not true after you read these notes. 6 A bit different starting point than in class. It doesn’t matters so much, but let’s start with a price of $20, which is what a collusive cartel would like to pull off. 11 Econ 500 – Oligopoly Models (Cournot, Bertrand) What else can we figure out for the Bertrand Model? Because firms will be charging P = MC ($10), we can figure out how much output will be produced. P = 30 – Q 10 = 30 – Q Q = 20 When both firms are charging the same price, we assume the firms split the market evenly. Because 20 total units are being produced, Q1 = 10, Q2 = 10. Firm 1’s revenue = P * Q1 = $10 * 10 = $100.00 Firm 1’s costs = c1 * Q1 = $10 * 10 = $100.00 Firm 1’s profit = $100 - $100 = $0 Firm 2’s revenue = P * Q2 = $10 * 10 = $100.00 Firm 2’s costs = c2 * Q2 = $10 * 10 = $100.00 Firm 2’s profit = $100 - $100 = $0 Total profit of both firms = $0 This is a model where consumers are very prince sensitive and firms compete intensely on the basis of price. It takes only two firms competing to drive down prices to the perfectly competitive level. Big Picture Take this model, and any other model, with a grain of salt. Go back to the assumptions and consider the implications if they don’t match the real world. The point of the Bertrand model is with very price sensitive consumers and easy information about prices, there would be healthy price competition. However, one of the assumptions is that all consumers will choose the firm with the lowest price. That is, if one gas station charges $2.83 per gallon and the other charges $2.82, the second station will capture all the business. Is that realistic? What would happen if the second gas station doesn’t have enough capacity to capture all the market, perhaps because it doesn’t have enough pumps causing people to have to wait in line? Would the first firm lose all of its business? Of if one station was on the other side of a busy street? What would happen if the goods each firm was selling weren’t perfectly homogeneous (perfectly substitutable)? Might this explain why firms that might be subject to Bertrand conditions willingly undergo costs to differentiate their products? What if these firms play a “repeated” game? That is, they play this “game” day after day after day? Are they more likely to resist the temptation to reduce prices? All of these changes would lessen the cutthroat nature of the price competition and would likely result in higher prices, lower output levels, and higher profit levels. Nonetheless, the model is suggestive. 12 Econ 500 – Oligopoly Models (Cournot, Bertrand) Comparisons One of the reasons we went through the math of the Cournot Model with P = 30 – Q and MC1 = MC2 = $10 was so that we could compare all three models (cartel, Cournot, Bertrand) given the same demand curve and identical costs conditions. P = 30 – Q, MC1 = MC2 = $10 (Monopoly) Perfect Cartel Cournot Bertrand (Competition) P = 20 P = 20 P = 16.67 P = 10 P = 10 Q = 10 Q = 10 Q = 13.33 Q = 20 Q = 27 Industry profit = $100.00 Industry profit = $100.00 Industry profit = $88.88 Industry profit = $0 Industry profit = $0 While Cournot isn’t a perfect cartel, it clearly results in a relatively high price, a relatively low quantity, and relatively high profits. Bertrand, with just two firms competing vigorously on the basis of price drives down prices to competitive levels. What should I read? You might read Baye for the verbal description of Cournot, but they go crazy with isoprofit curves that don’t add anything. I’d stick with my notes. Baye takes you through reaction functions for the Bertrand model with differentiated (non-homogeneous) products if you are adventurous. Besanko discussed both, but does so in a cursory fashion. 13 Econ 500 - Bundling Bundling Bundling is the practice of selling two or more goods as a package. The examples and figures for this set of notes are clipped right out of the textbook. The story is about MGM, which when it distributed the films Gone With the Wind (GWW) and Getting Gertie’s Garter (GGG), it sold them as a bundle. The numbers in the table below will represent each theatre’s reservation price for each film – the maximum amount they would be willing to pay (for the right to show the firm at their theatre). Example - bundling doesn’t increase revenue Theatre A Theatre B GWW GGG $12000 $4000 $10000 $3000 Sell films separately GWW: Price = $12,000, Q = 1 (only theatre A), Revenue = $12,000. Price = $10,000, Q = 2 (both theatres), Revenue = $10,000. If the firm was to charge a single price, it will charge $10,000. GGG: Price = $4,000, Q = 1 (only theatre A), Revenue = $4,000. Price = $3,000, Q = 2 (both theatres), Revenue = $6,000. If the firm was to charge a single price, it will charge $3,000. Combined, the studio would enjoy revenue of $26,000. Bundle the films (sell as package) Now consider bundling the goods – that is, selling a package of the two movies. Theatre A Theatre B GWW GGG Bundle $12,000 $4,000 $16,000 $10,000 $3,000 $13,000 It stands to reason that Theatre A would be willing to pay $16,000 ($12,000 + $4000) for a bundle, while theatre B would be willing to pay $13,000 ($10,000 + $3,000). Bundle: Price = $16,000, Q = 1 (only theatre A), Revenue = $16,000 Price = $13,000, Q = 2 (both theatres), Revenue = $26,000. If the theatre were to bundle the movies, the studio would enjoy revenue of $26,000. Comparison In this case, bundling doesn’t increase revenue. The studio collects the same revenue whether it bundles at a price of $13,000, or sells GWW for $10,000 and GGG for $3,000 (separately). Each results in $26,000 of revenue. 1 Econ 500 - Bundling Example - bundling increases revenue Theatre A Theatre B GWW GGG $10000 $4000 $12000 $3000 Sell films separately GWW: Price = $12,000, Q = 1 (only theatre B), Revenue = $12,000. Price = $10,000, Q = 2 (both theatres), Revenue = $10,000. If the firm was to charge a single price, it will charge $10,000. GGG: Price = $4,000, Q = 1 (only theatre A), Revenue = $4,000. Price = $3,000, Q = 2 (both theatres), Revenue = $6,000. If the firm was to charge a single price, it will charge $3,000. Combined, the studio would enjoy revenue of $26,000. Bundle the films (sell as package) Now consider bundling the goods – that is, selling a package of the two movies. Theatre A Theatre B GWW GGG Bundle $10,000 $4,000 $14,000 $12,000 $3,000 $15,000 Theatre A would be willing to pay $14,000 for a bundle, while theatre B would be willing to pay $15,000. Bundle: Price = $15,000, Q = 1 (only theatre B), Revenue = $15,000 Price = $14,000, Q = 2 (both theatres), Revenue = $28,000. If the theatre were to bundle the movies, the studio would enjoy revenue of $28,000. Comparison In this case, bundling increases revenue above what would be earned by charging a single price. Here, bundling increase revenue by $2000. Why does bundling work here and not in the previous example? In the first example, the reservation prices of the theatres were positively correlated. Theatre A was willing to pay more for both movies than was Theatre B. In the second example, the reservation prices of the theatre were negatively correlated. Theatre A was willing to pay more for GGG, but it was Theatre B that was willing to pay more for GWW. It is easier to see the negative correlation graphically that to describe it verbally. We draw a picture, and put a persons (theatre’s) reservation price for good 1 (R1) on the horizontal axis and the reservation price for good 2 (R2) on the horizontal axis. Then we can see if these reservation price combinations are positively or negatively correlated. 2 Econ 500 - Bundling First example – unprofitable to bundle Second example – profitable to bundle positively correlated negatively correlated R2 R2 $12,000 $12,000 $10,000 $10,000 $3,000 $4,000 R1 $3,000 $4,000 R1 Again, if it is the case that person with the higher reservation one good is the person with the lower reservation price of the other good, it will be profitable to bundle. Consider cable or satellite TV. Here you purchase a bundle. The channel I would pay the most for is ESPN – my reservation price is high for ESPN. I don’t much care for A&E – my reservation price is low. But Dish Network doesn’t know this. I also bet it is the case that people who really like A&E don’t really care for ESPN. Dish Network doesn’t have to figure out who is who, just charge a bundled price. Where, then, do we expect to see bundling? We’d expect bundling in situations where consumers have heterogeneous demand curves and where firms can’t find an easy way to price discriminate. (If Dish Network knew I really liked ESPN, it might tell me that ESPN costs $32 a month). In the theatre example, perhaps some theatres will cater to a crowd that would like GWW, while other theatres will cater to a crowd that likes GGG, but the theatre can’t tell which is which. The more closely negatively correlated are the reservation prices, the more profitable bundling will be as a pricing strategy. When you get to the textbook, you might enjoy the section called bundling in practice. Mixed Bundling We often see in the real world, not only bundling, but a situation where the bundle is available but the goods are sold separately as well. This is called mixed bundling. Consider the following situation with four customers whose reservation prices for two goods are pictured below. 3 Econ 500 - Bundling R2 100 90 c1 = 20 A B 50 40 C c2 = 30 30 D 10 10 20 50 60 90 100 R1 There is a lot going on there. We have four customers, and their reservation prices are perfectly negatively correlated. We’ll confirm below, but (pure) bundling will be more profitable than charging a single price. We are also adding costs of production to the mix. The graph above indicates that marginal cost of producing good 1 is (constant and) equal to $20, while the marginal cost of producing good 2 is (constant and) equal to $30. Sell goods separately: Good 1: P1 = $90, Q1 = 1 Revenue1 = $90, Costs1 = $20, Profit1 = $60 P1 = $60, Q1 = 2, Revenue1 = $120, Costs1 = $40, Profit1 = $80 P1 = $50, Q1 = 3, Revenue1 = $150, Costs1 = $60, Profit1 = $90 (maximum profit) P1 = $10, Q1 = 4, Revenue1 = $40, Costs1 = $80, Profit1 = -$40 Good 2: P2 = $90, Q2 = 1 Revenue2 = $90, Costs2 = $30, Profit2 = $60 (maximum profit) P2 = $50, Q2 = 2, Revenue2 = $100, Costs2 = $60, Profit2 = $40 P2 = $40, Q2 = 3, Revenue2 = $120, Costs2 = $90, Profit2 = $30 P2 = $10, Q2 = 4, Revenue2 = $40, Costs2 = $120, Profit2 = -$80. Total profit from selling goods separately is $150 (when P1 = $50, P2 = $90) Pure Bundle: P = $100, Q = 4, Revenue = $400, Costs = $200 (the bundle costs $50 to produce), Profit = $200 As expected, pure bundling increased profits, as reservation prices are negatively correlated. Mixed Bundle: Offer both a bundle and the goods separately. P1 = $89.95, Q1 = 1, Revenue1 = $89.95, Cost1 = $20, Profit1 = $69.95 P2 = $89.95, Q2 = 1, Revenue2 = $89.95, Cost2 = $30, Profit2 = $59.95 Bundle = $100, Q = 2, Revenue = $200, Costs = $100, Profit = $100 Total profit from mixed bundling is $229.90 ($69.95 + $59.95 + $100). Notice this is higher than the profits from pure bundling. 4 Econ 500 - Bundling Why the Extra Profits? Where do the extra profits from mixed bundling come form? Take a look at consumer D. Under pure bundling, the consumer would pay $100 for the bundle. Recall the consumer’s reservation price for good 1 is $90, while their reservation price for good 2 is $10. The marginal cost of producing good 2, which is involved in producing the bundle, is $30, and exceeds the reservation price for good 2. It is almost as though the consumer is purchasing the bundle and (nearly) throwing away good 2. If the firm were to offer good 1 separately, at a price just below $90 (so the consumer has just a small amount of consumer surplus1), they could collect all the surplus on good 1 and avoid producing good 2. Doing so causes the firm to lose $10.05 in revenue (they would have gotten $100 from the bundle), but saves $20 in costs. This causes profits to increase by just less than $10. Intuitively, the firm doesn’t want to spend money producing the good if the consumer will “throw it away”. Likewise, the firm will target consumer A to purchase only good 2. Consumer A has a very low reservation price of good 1, one which is less than the marginal cost of producing good 1. The firm will be better off offering a price just below consumer A’s reservation price of good 2 ($89.95) and selling only good 2 to consumer A. It costs the firm a bit $10.05 of revenue again (they would have gotten $100 from the bundle), but saves $30 in costs by not having to produce good 1, which is almost “thrown away”. This causes profits to increase by just less than $20. R2 c1 Purchase only good 2. R2 > c2, but R1 < c1. Purchase bundle – reservation price of each goods exceeds cost of producing Purchase only good 1. R1 > c1, but R2 < c2. c2 D R1 More examples of bundling? Cable, extra value meals at McDonalds, buffets, option packages on cars (I had to buy the CD player to get the sun roof), tuition at universities (I wonder how much you would pay for Econ 311 sold separately), halloween candy variety packs, season ticket packages, etc. What should I read? You’ve got to stick with my notes here – neither or your books like this idea. 1 When the bundle is priced at $100, the consumer is left with no consumer surplus. If the single good was priced at exactly $90, the consumer would also be left with no consumer surplus. The consumer would be indifferent between buying the bundle or buying the single good. By lowering the price to $89.95, we have given the consumer surplus of $0.05, which (hopefully) ensures the consumer will purchase the single good, not the bundle. (In a practical setting, maybe more than a nickel would be required.) 5 Econ 500 - Notes on 1st and 2nd Degree Price Discrimination 1st Degree Price Discrimination The idea of first-degree price discrimination is to charge every customer his or her exact reservation price. For this reason, 1st degree price discrimination is sometimes called perfect price discrimination. If pulled off successfully, the consumer will have no consumer surplus – this is because each consumer has paid his or her entire reservation price.1 As a practical matter 1st degree price discrimination is relatively unlikely to be observed in the real world. This is because the firm must be able to identify the reservation price of each consumer exactly. This requires a ton of information.2 That being said, it is a bit more likely to be observed when consumers purchase only a single unit of the good (as opposed to a situation in which the typical consumer purchase multiple units of the good – more below). Example: To simplify the interpretation of the example below, let us go ahead and assume that each customer purchases only one unit of the good. Therefore, different spots on a market demand curve represent different consumer’s reservation prices.3 Check out the table below, and the picture that follows the table. Each depicts the same information. Consider first the table. By saying at P = $9, Q = 1, what this means is that there is one consumer who is willing to pay no more $9 for a unit of the good. Look at the graph and find that dot on the demand curve that represents that consumer. Back to the table. By saying at P = $8, Q = 2, we can discern there is a second consumer who is willing to pay no more than $8 for a unit of the good. And of course, a dot on the demand curve represents that consumer in the graph. By saying at P = $7, Q = 3, we can figure there is a third consumer who is willing to pay no more than $7 for a unit of the good. And another dot. Prior to learning about price discrimination, we would have given the firm only the option to charge all customers the same price. They could charge everyone $9, everyone $8, everyone $7, and so on. If the price was $9, the firm would sell 1, if the price was $8, the firm would sell 2, and at a price of $7, the firm would sell 3. In fact, you could calculate MR, and find the optimal price the firm would charge under these conditions. In fact, you definitely should do this.4 1 If you’ve forgotten, consumer surplus is the gap between the amount consumers are willing to pay (their reservation price) and the amount they have to pay. If a consumer is charged their reservation price, consumer surplus is zero. 2 It is helpful to consider situations where 1st degree price discrimination occurs (or firms attempt to do so). Examples include car salespersons, accountants (thing tax return preparation fees), attorneys, etc. It should be reasonable clear in the case of accountants and lawyers why these professionals might have a large amount of information about the consumers’ reservation price. 3 While the interpretation changes just a bit, the basic story is unchanged even if you consider the situation where the firm is charging one customer different prices for multiple units of the good. More below… 4 While the math doesn’t come out nice here, the firm will produce 4 units and charge a price of $6. Why Q = 4? At Q = 4, MR > MC, so surely the firm would produce the 4th unit and you’d be inclined to think the firm would produce more. But we know the firm will not produce the 5th unit because MR < MC (MR Econ 500 - Notes on 1st and 2nd Degree Price Discrimination Now on to 1st degree price discrimination. If, and it is a big if, the firm could identify which consumer was which – that is, if the firm could identify the reservation price of each consumer when they walked up to the store, the firm could increase revenue by charging each consumer their reservation price. So what is the optimal pricing strategy under these conditions, given the numerical example below? P $10 $9 $8 $7 $6 $5 $4 $3 $2 $1 Q 0 1 2 3 4 5 6 7 8 9 MC -$0.25 $0.50 $0.75 $1 $1.25 $1.50 $1.75 $2 $2.25 Or equivalently, the graphical depiction? P 9 8 7 6 5 4 3 MC 2 1 D 1 2 3 4 5 6 7 8 9 Q The answer is to charge the 1st consumer $9, the second consumer $8, the 3rd consumer $7, and so on. Where does the firm stop? Where the price is equal to MC. The firm could charge the 7th consumer (Q = 7) a price of $3, which still exceeds MC ($1.75). Doing so would increase the firm’s profit level by $1.25. Notice on the 8th unit, P = $2 and MC = $2, so producing this unit will not increase profits, but we’ll say go ahead and produce this last unit. = $1 and MC = $1.25). Let’s not worry about producing half units here – perhaps we are dealing with tables (as opposed to gallons of milk that are divisible). With Q = 4 and P = $6, total revenue is $6 * 4 = $24, total costs is $0.25 + $0.50 + $0.75 + $1 = $2.50, and profit = $21.50. Econ 500 - Notes on 1st and 2nd Degree Price Discrimination You should also be able to see why the firm would not want to sell to the 9th consumer at a price of $1.5 Given that we’ve settled on Q = 8, we just add up revenue (and then costs) by adding up the individual prices on each unit (and then individual marginal costs on each unit). Total Revenue is $9 + $8 + $7 + $6 + $5 + $4 + $3 + $2 = $44 Total cost is $0.25 + $0.50 + $0.75 + $1 + $1.25 + $1.50 + $1.75 + $2.00 = $9 Profit = $44 - $9 = $35 Notice, compared to the firm that charges only one price, the firm has higher profits under 1st degree price discrimination. That is, 1st degree price discrimination is profitable. Also note, each consumer has no consumer surplus. Finally, the firm produces more than a firm that charges only one price. Real World Difficulties As mentioned in a previous footnote, this would be difficult to pull off due to the informational requirements. The firm would need to know each customer’s reservation price. And yet, it is a nice starting point for our analysis, and it is the ideal to which firms strive to achieve. Reducing consumer surplus to zero results in the highest possible profit level for the firm. But even though the information requirements are heroic, this is to a large extent, what car salespersons try to do. The more information firms have about the reservation prices of consumers, the more likely they will be to pull this off. Accountants that have just prepared a tax return have some serious information on how much their customer is able to pay. Estate planning lawyers? Don’t wear your Rolex when you go to buy a car. Financial aid offers? How do they know what families can pay? Getting a bit more realistic, given their limited information, firms will try to approximate 1st degree price discrimination. We’ll focus on 2nd degree and 3rd degree price discrimination next – these are not as profitable as perfect (1st degree price discrimination), but are still more profitable that charging a single price. Before we get into these, let’s take a step back. There are at (at least) two ways in which a firm could 1st degree price discriminate. Case #1 – Each customer purchases one unit of the good, and thus different customers have different reservation prices, and firm attempts to charge each customer their reservation price. This is what we assumed at the beginning of these notes, to simplify the interpretation. (Recall we consider a case where a consumer purchased only one unit of the good.) Thus, each dot on the demand curve represented a different consumer. Case #2 – Consumers are identical, but they have different reservation prices for different quantities of goods. Consider electricity. You might be willing to pay more for the 1st unit of electricity (to run your refrigerator) than you would for the Xth unit of electricity (to run your hair dryer). The firm could attempt to charge your (different) reservation price for each individual unit (e.g. $4 for the 1st unit of electricity, $3.50 for the 2nd unit, …, $0.10 for the Xth unit of electricity). In that case, the chart, and the dots on the demand curve reflect that one consumer’s different reservation prices for different units of the good. When the firm can’t quite pull off case #1, but has some information on different customer’s different willingness to pay, but can only separate customers roughly into two groups with different elasticities, we 5 Of course, P = $1 and MC = $2.25, so producing this unit would reduce the firms profit by $1.25. Econ 500 - Notes on 1st and 2nd Degree Price Discrimination call this imperfect form (yet still profitable) of price discrimination 3rd degree price discrimination. You’ve already done the math on that one. When the firm can’t quite pull off case #2, but has some information on the average customer’s different willingness to pay for varying units, we call this imperfect form (and yet still profitable) of price discrimination 2nd degree price discrimination or block pricing. 3rd Degree Price Discrimination See the notes on 3rd degree price discrimination 2nd Degree Price Discrimination Again, the idea here is to charge an average (or representative) consumer different prices of different units of the good. This is sometimes called block pricing, and it really not much different from a bulk discount. In addition to the general difficulties with knowing reservation prices, even if the firm could do this perfectly, the firm would literally have to charge different prices of each unit of the good. The list of prices on your power bill would be very long. So the idea is to set up some blocks – some segments where the price changes. There will be separate prices for separate blocks, but not a separate price for each and ever unit.6 My impression is that, and this will bother you folks some in preparing for an exam, that there is no hard and fast rule where to select these blocks or for that matter, how many of them there should be. Nonetheless, the idea will be to use information on the demand curve when determining the prices for a given size block. This gets a lot trickier with non-identical consumers. However, you’ll get the main idea from the example below. Say I split the demand curve in to blocks of size 2. What would be the best price for the 1st two units? The demand curve (see the chart or graph above) tells me to sell 2 units, the price can be no higher than $8. To sell 4 units, the price can be no higher than $6. To sell 6 units, the price must be no higher than $4. To sell 8 units, the price must be no higher than $2. So the firm could offer the following pricing scheme: $8 for the 1st two units, $6 or the next 2 units, $4 for the next 2 units, and $2 for the next 2 units.7 If it does so, the firm would sell 8 units. Total revenue = $8 * 2 + $6 *2 + $4 * 2 + $2 * 2 = $40 Total cost is = $0.25 + $0.50 + $0.75 + $1 + $1.25 + $1.50 + $1.75 + $2.00 = $9 Profit = $31 Profit is better than charging a single price, but not as good as perfect price discrimination. 6 Another way the firm could pull this pricing strategy off would be to offer say a 1-pack of coke for $1.50 per can, a 6-pack of coke for $0.50 per can, a 12-pack of coke for $0.33 per can. When we combine the elements of Case #1 and Case #2, this pricing strategy can also separate costumers that purchase infrequently vs. those that purchase frequently. However, to make a point about the tradeoff between profits and the number of blocks, Coke doesn’t want to offer the 7-pack, 8-pack, 9-pack, 10-pack, etc. TP comes in the single roll, the 4-pack, but there is no 13-pack. 7 Or say $16 for a 2-pack, $28 for a 4-pack, $36 for a 6-pack, $40 for an 8-pack. Econ 500 - Notes on 1st and 2nd Degree Price Discrimination The firm capture much, but not all of the consumer surplus. See the picture below, where revenue is shaded. (With 1st degree price discrimination, revenue would have been all of the area below the demand curve). P 9 8 7 6 5 4 3 MC 2 1 D 1 2 3 4 5 6 7 8 9 Q You could try out figuring out the optimal prices for blocks of 3 units. You’ll have to be a bit careful on the 3rd block. More While the math gets tougher with non-identical consumers, you do see a good bit of this pricing scheme out there in the real world. Electricity is priced this way, we do see 6-packs and 12-packs with different prices (though there is an element there of separating different types of consumers there). If you get a chance (not on the test), read about two-part pricing in your book. This is the scheme where firms capture consumer surplus by charging an entry-fee and then a per-unit fee. Both can extract some consumer surplus. Examples here included country-club memberships (yearly fee + green’s free) and even cover charges at bars. Instead of changing the price of a beer on Friday night, they charge a cover charge on Friday night to extract some consumer surplus. What should I read? Baye discusses this in Chapter 11. Econ 500, Price Discrimination Shortcuts – A Pricing Rule of Thumb Many times, a firm won’t have an estimate of the entire demand curve, but they will have a pretty good idea of their elasticity, and have a pretty good idea of the marginal cost of producing. If so, they can come up with an optimal price. How would a firm know its elasticity? This could be from trail and error, past experience, feel, or perhaps something like an idea of a Rothschild index and an industry level elasticity. Some economist types have done some math for us. They’ve found out that ⎛ 1 + EF MR = P⎜⎜ ⎝ EF ⎞ ⎟⎟ ⎠Where EF is the firm level elasticity. It seems like its out of thin air, but it really is just math. We know something already about how the elasticity of demand changes along a linear demand curve. You really know what is going on. Remember a picture similar to this from the notes on elasticities? Px | EQx , Px | = ∞ (perfectly elastic) elastic | EQx , Px | = 1 (unit inelastic) at the midpoint of the demand curve inelastic | EQx , Px | = 0 (perfectly inelastic) MR Qx When the elasticity for the firm is -1 (the midpoint of the demand curve), we know that MR = 0. We can confirm from our formula above: ⎛ 1 + EF MR = P ⎜⎜ ⎝ EF ⎞ ⎛0 ⎞ ⎛ 1 + −1 ⎞ ⎟⎟ = P ⎜ ⎟= P ⎜ ⎟= 0 ⎝− 1 ⎠⎝ −1 ⎠⎠If the elasticity is -2, we have: ⎛ 1 + EF MR = P ⎜⎜ ⎝ EF ⎞ ⎛ 1 + −2 ⎞ ⎛ −1 ⎞ ⎟⎟ = P ⎜ ⎟= P ⎜ ⎟ = 0 .5 * P ⎝ −2 ⎠⎝− 2 ⎠⎠So MR is half as large as price. Let’s keep scooting up the demand curve. If the elasticity is -10, we have: ⎛ 1 + EF MR = P ⎜⎜ ⎝ EF ⎞ ⎛ 1 + −10 ⎞ ⎛ −9 ⎞ ⎟⎟ = P ⎜ ⎟= P ⎜ ⎟ = 0 .9 * P ⎝ − 10 ⎠⎝ − 10 ⎠⎠So MR is 90% of price. Keep scooting…If the elasticity if -100 (very near the vertical intercept), we have: 1 Econ 500, Price Discrimination ⎛ 1 + EF MR = P ⎜⎜ ⎝ EF ⎞ ⎛ 1 + −100 ⎞ ⎛ − 99 ⎞ ⎟⎟ = P ⎜ ⎟= P ⎜ ⎟ = 0.99 * P ⎝ − 100 ⎠⎝ − 100 ⎠⎠Now, we know for firms with market power (monopolists, monopolistic competition), that these firms set MR = MC.1 ⎛ 1 + EF MR = P⎜⎜ ⎝ EF ⎞ ⎟⎟ = MC ⎠Now solve for P. ⎛ 1 + EF P⎜⎜ ⎝ EF ⎛ E ⎞ ⎟⎟ = MC ⇒ P = MC ⎜⎜ F ⎝ 1 + EF ⎠⎛ E ⎞ ⎟⎟ ⎠⎞ F ⎟⎟ is our pricing rule of thumb. Ok – that is important. P = MC ⎜⎜ 1 E + F ⎠⎝ It says that the price selected by an optimizing firm with market power is a simple mark-up over MC, where the mark-up depends on only one thing – the elasticity of demand at the firm level. Again, if you know your firm’s MC and know the elasticity, you can set optimal prices without having to hire an economic consultant to estimate the whole demand curve. Let us apply it. Suppose EF = -2. In this case, the firm should charge a price double its marginal cost: ⎛ E P = MC ⎜⎜ F ⎝ 1 + EF ⎞ ⎛ −2 ⎞ ⎛−2⎞ ⎟⎟ = MC ⎜ ⎟ = MC ⎜ ⎟ = 2 * MC ⎝ 1 + −2 ⎠⎝ −1 ⎠⎠Suppose EF = -4. In this case, the firm should charge a price 33% above its marginal cost: ⎛ E P = MC ⎜⎜ F ⎝ 1 + EF ⎞ ⎛ −4 ⎞ ⎛−4⎞ ⎟⎟ = MC ⎜ ⎟ = MC ⎜ ⎟ = 1.33 * MC ⎝ 1 + −4 ⎠⎝ −3⎠⎠Keep this in mind when we later discuss price discrimination. In the second case, where the demand is more elastic (more sensitive to prices), firms charge a lower price (a smaller mark-up).2 1 Technically, this works for perfectly competitive firms as well. A perfectly competitive firm faces an infinitely elastic demand curve for their product. If you plug in infinitely (or a super large number not quite as big as infinite), you’ll find that MR = P, exactly what we found for a perfectly competitive firm. 2 Not sure you noticed, but this formula doesn’t work well when the absolute value of the firm level elasticity is less than one (e.g. -0.5). But recall, a firm will never choose a spot where the demand curve is inelastic. We know this because if the firm were to raise the price, it would increase revenues and decrease costs (less would be purchased), thus increasing profits. It will not stop until the demand curve becomes at least unit elastic (MC = 0) and likely until the elasticity is elastic (so long as MC > 0). 2 Econ 500, Price Discrimination 1st Degree Price Discrimination [Insert Discussion of 1st Degree Price Discrimination Here] 3rd Degree Price Discrimination 3rd Degree Price Discrimination involves charging different prices to different customers even though the marginal cost of serving these customers is the same. The idea is that different groups of consumers might have different sensitivities to price (different elasticities of demand). If so, it might be wise to increase the price to the consumers who are more insensitive to price and reduce the price to the consumers who are more sensitive to prices. In fact, we will show that using 3rd degree price discrimination will lead to higher profits for firms that using this pricing strategy. Examples: Classic examples are business travelers vs. leisure travelers when it comes to airline tickets. Who is less sensitive to prices? Business travelers are. Who pays higher prices? Business travelers. Another classic example is senior citizen (or student) discounts at the movie theatre. As seniors (students) are more sensitive to prices, they will pay lower prices than adults. Requirements to 3rd Degree Price Discriminate To successfully pull off this type of price discrimination, the firm needs to have three characteristics: (1) it must have some market power (it is not a perfectly competitive firm) (2) it must be able to separate consumers into groups (that have different price elasticities of demand) (3) it must be able to prevent resale amongst groups The economics of this one aren’t that tough. Suppose I told you there were two groups, call them group 1 and group 2. Suppose you didn’t know anything about these two groups except the fact that the marginal revenue you would get from selling an extra unit to group 1 was $7, while the marginal revenue you would get from selling an extra unit to group 2 was $3. Is the firm choosing wisely? No. If the firm was to sell one less unit to group 2, the firm would lose $3. But if the firm sold one more unit to group 1, the firm would gain $7. Costs would be unchanged, because the firm is still producing the same number of units. But switching a unit of the good from the low MR group to the high MR group would increase revenue (and profits). Of course, any time this situation was true (where MR1 ≠MR2), the firm would have the incentive to rearrange output between the two groups. Thus, eventually, the firm will want to choose where the marginal revenue of both groups is equal. That is, the firm should choose where MR1 = MR2. Now, suppose we’ve solved this problem, so MR1 = MR2 = $7, but MC is only $3. What should the firm do in this case? Produce more output for both groups. When should the firm stop overall? When MR1 = MR2 = MC. Eventually, we will be looking of a situation where MR1 = MR2 = MC. Long Drawn Out Numerical Example of 3rd Degree Price Discrimination Suppose one firm is the only firm that sells tickets for a concert (it has market power). Suppose market research has identified that students and professors have different demand curves (different elasticities of demand). How should the firm price to take advantage of price discrimination? Suppose we know that the demand curve for students is given by: 3 Econ 500, Price Discrimination QS = 200 – 4PS And the demand curve for professors is given by QP = 500 – PP Suppose the MC of selling tickets to both groups is 0. What are the optimal prices for the firms to charge the two groups? The firm should find a spot where MR1 = MR2 = MC. Because the MC of servicing each group are equal, the firm will end up at setting MR1 = MC and MR2 = MC.3 First, for the students. Start with the demand curve. Then figure out the inverse demand curve and MR. QS = 200 − 4 PS 4 PS = 200 − QS PS = 200 QS − = 50 − 14 QS 4 4 That is the inverse demand curve. Now we can find MR by multiplying the coefficient on Q by 2: MRS = 50 − 12 QS Now set MRS = MC S : 50 − 12 QS = 0 1 2 QS = 50 QS = 2 * 50 QS = 100 Plug this value into the inverse demand curve to find the price: PS = 50 − 14 QS = 50 − 14 *100 = 50 − 25 = 25 Now calculate revenue: REVS = PS * QS = 25 * 100 = 2500 Now for the professors. Again start with the demand curve and find the inverse demand curve: QP = 500 − 5P 5PP = 500 − QP 500 QP PP = − = 100 − 15 QP 5 5 3 Because MR1 and MR2 are both equal to MC, we know MR1 = MR2. 4 Econ 500, Price Discrimination Now use the inverse demand curve to find MR: MRP = 100 − 52 QP Set MRP = MCP 50 − 12 QP = 0 2 5 Q P = 100 QP = 52 *100 Q P = 250 Plug into the inverse demand curve to find the quantity: PP = 100 − 15 QP = 100 − 15 * 250 = 100 − 50 = 50 Calculate revenue: REVP = PP * Q P = 50 * 250 = 12,500 So overall, by selling to the group separately, we collect $15,000 worth of revenue, $12,500 coming from professor and $2500 coming from professors. Notice we charge a higher price ($50) to professors than we do to students ($25). Can this be displayed graphically? Yes, with a bit of a trick. We have two demand curves and two marginal revenue curves, so the picture can get pretty crowded, so we’ll use the trick of “flipping over” one set of curves. Start with student demand. It is drawn on the right side of the graph below. Imagine flipping over the demand curve and marginal revenue curve to the left side of the graph. If you only had the left side, you’d still what is going on. . P 50 Q D 200 MR 100 MR 100 D 200 Q 5 Econ 500, Price Discrimination P 50 Q D 200 MR 100 Now, we’ll leave students on the left side (backwards) and draw the professors’ demand curve on the right side of the graph and the MR curve for professors as well. P 100 50 25 MCS QS DS 200 DP MRS 100 MRP 100 250 500 MCP QP Finding the answer graphically is much easier. MR = MC for professor occurs at Q = 250. Professor will pay a price of $50. MR = MC for students occurs at Q = 100. Students pay a price of $25. Notice that even though the groups of consumers are paying different prices ($50 and $25), at the quantities ultimately selected by the firm, MR for each group is equal ($0 in both groups). Is 3rd Degree Price Discrimination more profitable than charging a single price? What we have done thus far is show what price and quantity the firm will charge each group if it chooses to price discriminate. What we need to show is that if the firm price discriminates, it will have higher profits than it does if it does not price discriminate. This is a bit more involved. Adding together demand curves: If the firm can charge only one price, we have to add the two demand curves together. Let’s let the letter T represent the total quantity demanded (or market quantity demanded). At prices above $50, though, tickets will be sold only to professors. In this case, the market demand curve would be given by QT = 500 – 5PT, which is simply the same demand curve we had for professors, only it is relabeled. Of course, the inverse demand curve would be given by PT = 100 – (1/5) * QT and the MR curve would be given by MRT = 100 – (2/5) * QT. 6 Econ 500, Price Discrimination At prices below $50, we must add the demand curves together, as both students and professor will be purchasing tickets. Here, a bit of a math trick. We take the professor demand curve QP = 500 – 5PP and the students demand curve QS = 200 – 4PS and add them together. Because we are charging both groups the same price, we relabel using T to denote the total. As crazy as it seems, that gives you the expression for the overall demand curve. QT = QP +QS = 500 − 5PT + 200 − 4 PT = 700 − 9 PT Don’t believe me? Let’s confirm this fact. Let’s first plug and chug assuming the formula is right (it is). Prices of $0 and $50 seem interesting. I’ll also try out $25, and also $26. Why $26? By comparing what happens at $26 to what happens at $25, we can see what happens when the price increases by $1. PT = 0, QT = 700 PT = 25, QT = 475 PT = 26, QT = 466 PT = 50, QT = 250 And because it will come in handy, let’s plug and chug for each price on the student and professor demand curve PS = 0, QS = 200 PS = 25, QS = 100 PS = 26, QS = 96 PS = 50, QS = 0 PP = 0, QP = 500 PP = 25, QP = 375 PP = 26, QP = 370 PP = 50, QP = 250 PT = 0, QT = 200 + 500 = 700 PT = 0, QT = 100 + 375 = 475 PT = 0, QT = 96 + 370 = 466 PT = 0, QT = 0 + 250= 250 Notice, at each price, is you simply add up QS and QP, you do get what our formula says. In fact, all our formula did was add up the quantities. And one more thing to make us feel like the adding up trick is working. When P increases by $1 (e.g. from $25 to $26), the students purchase 4 fewer units. When P increases by $1 (e.g. from $25 to $26), the professor purchase 5 fewer units. Doesn’t it stand to reason that when P increases by $1, the total quantity sold (so long as we’re on the lower portion of the demand curve) will fall by 9 units? Sounds right to me. Isn’t that exactly what the expression QT = 700 – 9PT tells us? P 100 77.78 50 DS 200 DA DT 500 700 Q If we solve for the inverse demand function here, we get 9 PT = 700 − QT 7 Econ 500, Price Discrimination 700 QT − 9 9 PT = 77.78 − 19 QT PT = So now, we have two chunks of the demand curve: the upper part (just the professors), for prices above $50, and the lower part (where both professors and students are purchasing tickets). At prices above $50, the relevant MR curve would be the one based on the professors demand curve only. P 100 77.78 50 MRP 200 DP DT 500 700 Q But at prices below $50, the relevant MR curve would be the one based on adding up the two demand curves. P 100 77.78 50 MRT 200 DP 500 DT 700 Q Combing this information, the effective MR curve is the combination of the upper portion of the red marginal revenue curve (professor’s demand) and the lower portion of the blue marginal revenue curve (the combined demand curve). Finally, we set this MR curve to MC, which is 0. We do end up on portion of the demand curve below $50, where the firm is selling to both professors and students. 8 Econ 500, Price Discrimination P 100 77.78 50 38.88 DT MRT 200 350 500 MC 700 Q Back to the math... Now that we know the firm will operate where P < $50, we know the “important” MR curve for the will be the one on the lower portion of the market demand curve (where P < $50). Because we know the demand curve, we can use our standard trick of multiplying the coefficient on Q by 2 to find MR: PT = 77.78 − 19 QT MRT = 77.78 − 92 QT Setting MRT = MCT : 77.78 − 92 QT = 0 2 9 QT = 77.78 QT = 92 * 77.78 QT = 350 Next, stick into the inverse demand curve to get price (using the combined curve): PT = 77.78 − 19 QT = 77.78 − 19 * 350 = 77.78 − 38.88 = 38.88 Finally calculate revenue: REVT = PT * QT = 38.88 * 350 = 13,608 9 Econ 500, Price Discrimination Big Picture Stuff Notice with a single price, the firm collects only $13,608, while when price discriminating, the firm collected $15,000. In both cases there are 350 units of production as well (so it is not a sneaky consequence of having MC = 0). Price discrimination is more profitable. But don’t forget about the conditions. The firm must be able to identify groups with different elasticities. Also notice that the two different groups may feel differently about how they feel about price discrimination. If there is only one price charged, everyone pays $38.88. There would be a lot of tickets sold to professors, but not so many students buying tickets. With price discrimination, the price paid by students decreases to $25, which is good for students, thus more students will end up going to the show. However, the price paid by professors increases to $50, not so good for professors, and fewer professors will end up going to the show. Professors would prefer there is no price discrimination, while students are made better off. Don’t forget that the firm has to be able to prevent resale. If the firm offers a discount to one group, and can’t prevent people buying at the discounted price and reselling to the other group, it won’t make sense to price discriminate. Airlines do this with your name on the ticket. The divide consumers into groups by requiring Saturday night stays and giving discounts to those who book travel far in advance (both not likely to be easy for business travelers). Movie theatres make students and seniors whip out the IDs. They also print student or senior on the tickets so that other can’t use these tickets. Why doesn’t it work at Blockbuster? 10 Econ 500 - Notes on Signaling Here is what I have done. I have started with the notes I give to my Econ 211 students when I discuss adverse selection. At the end of the day, I want you to focus on the signaling model, but also have a general understanding of the asymmetric information. Let me translate – signaling will definitely be on the final, while general asymmetric information / adverse selection Econ 211 stuff is just background. Asymmetric Information – Econ 211 Style Typically, even when we haven’t been very explicit about it, we have been assuming that both buyers and sellers in a market have the same information about the quality of the products they have been buying and selling. However some situations arise where the buyers and sellers have asymmetric information – one party knows more about the quality, say, of a good that is being sold. The classic example is a used car. The seller of the used cars knows more about the car than the potential buyers. They know if the car is a good car (a “plum”) or a bad car (a “lemon”). What are the implications of asymmetric information? Suppose buyers are willing to pay $4000 for a plum and $2000 for a lemon. Suppose buyers assume that if they buy a car, there is a 50/50 chance they will get a plum, a 50/50 chance they will get a lemon. Without knowing what type of car they will get, they might be willing to pay perhaps $3000 for a used car.1 Now, suppose you’re selling a car. You see the going price for used cars is $3000. Are you more likely to offer your car up for sale if it is a plum or if it is a lemon? $3000 is a good price for a lemon, but not such a good price for a plum. Other owners of cars would be making similar calculations. When you go out and look at the types of car that will be “on the market” at this price do you expect that there will be an equal number of plums and lemons? In fact, we would expect a large number of lemons and just a few plums (if any). Lemon owners will jump at this price, while plum owners will be less willing to sell their cars. Perhaps it will be an 80% lemon, 20% plum split. This is called adverse selection. The cars available for sale on the used market will be an adverse group (disproportionately lemons). Will consumers (who though they had a 50% change of getting a plum) be willing to pay $3000 now? Now there is an 80% chance they will end up with a lemon and only a 20% change they will end up with a plum. Since there is a smaller chance they will get a good car, the price they will be willing to pay will fall, say to $2400. This price will fall may further exacerbate the adverse selection problem – at a price of $2400 even more plum owners to hold back their cars for sale. Eventually, it could get to the point that many (if not all) of the cars on the used markets will be lemons. So what’s the point? With asymmetric information about the quality of cars, we would expect a disproportionately large number of lemons in the market for used cars. The lemons drive the good cars out of the used market. The used cars for sale are an adverse selection (of all used cars). How do we solve the problem – Econ 211 Style How do owners of plums convince sellers that they have a plum? How about offering a money back guarantee? Or a warranty where you agree to pay for repairs? Sellers of a lemon would not find these options desirable. While the seller would receive the plum price, buyers would realize the car is a plum. The owner would have to pay for the repairs or give the money back to the consumers. How about paying for expert information? You could have an expert, in this case a mechanic, take a look at the car and try to determine the quality. Often people log (and keep receipts) for regular maintenance for the car. You can call up carfax and see if the car has been involved in an accident. In this case, folks are actually literally searching for information to reduce the asymmetric information problem. Information is valuable. 1 Finance types – if it bothers you, I am assuming buyers are risk-neutral for simplicity. 1 Econ 500 - Notes on Signaling Can reputation (brand names) solve the problem – Econ 211 Style? You could go to a used car dealer who has a reputation at stake. If this dealer sells a bunch of lemons at high prices (claiming they are plums), soon everyone around town will know he is a disreputable dealer. Might this be why people who buy cars from strangers through the newspapers seem to often end up with crappy cars? Does a one-time seller of a used car in the newspaper have a reputation at stake? (It is a prisoner’s dilemma type game, but a repeated game.) If you think about this further, it doesn’t make sense to advertise unless you are a high quality seller. Say you advertise that you sell only plums on your used car lot. If you do in fact to do, consumers will find plums and be willing to pay high prices for cars. The money you’ve spent advertising can be thought of as investment in reputation. If you continue to sell high quality cars, this investment is effective. However, if you advertise and produce low quality goods, consumers will realize and stop buying cars from you. The money you have spent on advertisement is no longer valuable. Advertising then, can be a signal to potential consumers that you are a high quality producer. The same goes with signs and Chinese restaurants. The nature of the restaurant business is that it is reasonable easy to close a restaurant in one place and start a new restaurant another place (low sunk costs). So why do I like to eat at Chinese restaurants with big signs outside the restaurant? If the Chinese restaurant has a big sign that has the name of their restaurant and Thibodaux on the sign, I know that this sign has no value if they go out of business and try to set up a new restaurant down the road. The sign is an investment in their name brand, and it is specific to Thibodaux and the name of the restaurant. If they start serving awful food, that sign is no longer valuable. Whatever money was spent on the sign is lost (the sign is a sunk cost). Given that, would a firm that was a fly by night operation, expecting to be out of business in 3 months, choose to spend $6000 on a fancy sign? No. Those firms that are spending on signs are signaling quality, as again, it makes no sense to invest money in a low quality reputation. Therefore, you should avoid restaurants with cardboard signs in the windows! The more expensive the sign, the better, the more specific it is to the current location (says Thibodaux), the better it is. Might this be why banks usually have super fancy lobbies? Other examples of where reputation is important? EBay (why have the system of seller ratings?) Lawyers? And don’t forget the end-period problems. Another Example (Insurance) – Econ 211 Style In the case of used cars, the buyer had less information than the seller of the car. In this example, we will have the buyers having more information than the sellers. Consider the market for malpractice insurance. Suppose there are two types of doctors, both of whom are considering purchasing medical malpractice insurance. On type (Dr. Hibbard) is a low-risk doctor, who will not have many claims. The second type (Dr. Nick) is a high-risk doctor, who will have many claims. Suppose the insurance companies can’t tell who is who. That is, the buyers of insurance (Dr. Nick and Dr. Hibbard) have more information than the insurance companies about what type of doctors they are. Suppose Dr. Nick’s claims will average $30,000 a year, while Dr. Hibbard’s claims will average $4,000 a year, and they both know this. Now, suppose the insurance company sells insurance at a premium of $17,000. I have chosen this amount for if they both buy insurance, the insurance company will collect enough in premiums ($34,000) to just cover the claims (basically we are ignoring the administrative costs). But if the company charges this price – how will the insurance company do? 2 Econ 500 - Notes on Signaling The answer is not very well. Dr. Hibbard will not buy the insurance, while Dr. Nick will.2 The insurance company will collect $17,000 but pay out $30,000 in claims. The insurance company has adverse selection issues – all of the doctors that buy the insurance will be risky doctors. What must happen to the premiums? In this case, they must rise to $30,000. It is again called an adverse selection issues because all of the insured doctors will be “risky” doctors – an adverse group. Just as lemons drove plums out of the used car market, the risky doctors drove the low-risk doctors out of the insurance market. There again is an effort to acquire valuable information on the part of insurance companies. This explains why your car insurance company is very interested in collecting information on your driving record. Your claim history, accidents, and speeding tickets will provide companies information about whether you are a low risk driver or a high-risk driver. Of course, car insurance companies (and medical insurance companies) will charge different prices to different drivers (doctors) depending on what they think of your risk profile. But again, the problem arises because of the fact that drivers (doctors) have more information about their characteristics than the insurers. More examples of adverse selection – Econ 211 Style When lending money, people who are less likely to pay are required to pay higher interest rates. Suppose a lender is finding that they are not doing well – at the current interest rate they are not collecting enough to cover the losses on the non-payers. It seems logical to raise interest rates. But wait - could there be an adverse selection problem here? Does adverse selection have anything to do with why blood banks don’t pay people for blood? What would happen if one price were charged to everyone for medical insurance, regardless of whether they were a smoker or not? Who would buy insurance? Is there an adverse selection problem? Might this be the one of the reasons why insurance is typically offered through your employer? What are the odds that everyone who works at Nicholls State is a smoker? Should you be mad at the price you pay if you are not a smoker? Or just very healthy? I wrote a blog post once about where some parents of teenagers might willingly put cameras in cars that recorded what their kids were up to. Might *not* volunteering to have a video camera be put in your car and record your driving convey information to your insurance company? Used baseball players? If the team that the player is currently playing for is willing to “sell” the player, should you be worried? The research on this one suggest that pitchers who change teams (are “sold”) spend more time on the disabled list than pitchers who don’t change teams. 2 For simplicity, I am assuming that there is no legal requirement that doctor’s buy malpractice insurance. 3 Econ 500 - Notes on Signaling Signaling – Econ 500 style One important example of asymmetric information is when firms decide which employees to hire. In this case, firms have less information about how productive workers might be than the potential employees do. Clearly, if workers just ask potential employees if they are productive or not, all but the most honest (or most foolish) will say they are very productive. Because it is costly to hire and train workers, and because it might be several months before the firm can truly tell which employees are truly productive, it will not pay the firm to hire workers indiscriminately. We need another solution. The question becomes - is there something that potential employees can do to signal to firms that they are productive employees? Consider what happens when you are looking for a job. You can fill out a resume, get recommendation letters, and do some research on the firm. Think about what happens when it is time for an interview. You make sure you dress nicely. This is a signal, but not a very good one. While productive workers will dress nicely, it is easy for less productive workers to dress nicely as well. Wearing flip-flops will ensure you will not be hired, but dressing nicely is not enough. We need something else. One possibility is that employees could signify that they are highly productive by completing college. Let us explore this idea and make some assumptions to make it more extreme. Suppose for a second that you do not learn anything of value by going to college, which I hope is a dubious assumption. Is it possible that going to college can make sense if you do not learn anything while you are there? Stated a bit differently, is it possible that going to college could simply serve as a signal to perspective employees that you are a productive employee? Imagine that the firm comes up with a rule that is uses to try to determine the quality of applicants. The firm assumes that anyone who completed four years of college will be a highly productive employee (and will pay this worker a high wage), while the firm assumes that anyone who did not complete four years of college is less productive (and will pay this worker a low wage). At the end, we will come back and check to see that the firm’s rule matches the facts. This last step will be very important. Let us throw some numbers at this problem. Suppose there are two types of employees. Group I employees are not as productive as Group II employees are. Of course, employees know whether they belong to Group I or Group II, but firms cannot tell to which group potential employees belong. Group I Group II Marginal Product (per year) = 1unit Marginal Product (per year) = 2 units Price of Product = $10,000 Price of Product = $10,000 Value of Goods Produced (per year) = $10,000 Value of Goods Produced (per year) = $20,000 Career Length = 10 years Career Length = 10 year Value of Goods Produced (career) = $100,000 Value of Goods Produced (career) = $200,000 One possibility is simply to average the two types and pay workers $15,000 a year. This would be good for Group I workers but no so good for Group II workers. In fact, the firm might have an adverse selection problem – only Group 1 workers would want to work for the firm. Why?3 Now, consider using college as a signal. Suppose these different types of workers have different costs of completing four years of school. Both groups pay tuition and fees, have an opportunity cost of going to college, but both groups also have a 3 This is just like a $3000 price for a car. One group finds the price (or wage) desirable, the other does not. 4 Econ 500 - Notes on Signaling psychic cost of going to school (think of all the unpleasant parts of going to college). Perhaps Group II workers breeze through college and can complete four years of college in four actual years. Perhaps Group I workers struggle, have to repeat classes, it takes seven years to complete four years of college, or they just dislike doing homework more than Group II worker. To make things concrete, suppose we have the figures below. Group I Group II Cost of completing each year of school = $40,000 Cost of completing each year of school = $20,000 Given the set up, we can compare the costs and benefits of going to college. Workers know that if they complete four years of college, they will have signaled to firms they are productive workers and will get the higher wage. Recollect that we have assumed there is no benefit to going to school except that completing four years of school convinces firms that the worker is a productive one. If a worker completes four years, then, the firm will assume the employee is highly productive, and pay the worker the high wage of $20,000 a year. The employee will earn $200,000 over the course of their career with the firm. If the worker completes less than four year of school, the firm will assume the worker is not productive, and will pay the worker the low wage of $10,000 a year. The worker will earn $100,000 over the course of their career with the firm. Combing these two facts, the benefit of attending 4 years of school will be $100,000, whether the worker is truly productive or not. Keep in mind the benefit of going to college is the additional earnings that the worker gets ($200,000 - $100,000). It is the gap between the wage paid to Group II and the wage paid to Group I.4 The cost of going to college depends on whether you are a Group I worker or if you are a group II worker. The cost of completing four years of college if you are a Group I worker is $40,000 for each year for a total of $160,000. Does it make sense, then, for Group I workers to go to college? Should the worker incur $160,000 worth of costs for $100,000 worth of extra earnings? No. In fact, Group I workers will not go to college. Now check the math for a Group II worker. The cost of completing four years of college if you are a group II worker is $20,000 for each year for at total of $80,000. Does it make sense for Group II workers to go to college? Should the worker incur $80,000 worth of cots for $100,000 worth of extra earnings? Yes. In fact, Group II workers will go to college. So take a step back. Recall the firm used college as a signal. It assumed that workers that did not go to college were Group I workers and workers that did go to college were Group II workers. This is just what happens. Group I workers do not go to college and Group II workers do go to college. The firm sees a worker that has not gone to college, assumes they are a Group I worker, and the firm is correct. The firm sees a worker that has gone to college, assumes they are a Group II worker, and the firm is correct. The firm’s assumptions are correct. Thus, college can serve as a signal. Is this real or just textbook BS? Surely, you learn something valuable in college. However, almost as surely, part of what is happening with you going to college is that you are signaling to perspective employers that you are productive. How am I so sure? People who complete four years of college in the 4 Completing the 1st, 2nd, or 3rd year of schooling has no benefit specifically because we have assumed that nothing is learned in college. In this example, the only reason to go to college is to signal to firms that you are productive. Because the firm thinks worker that completed four years of college are productive, three years has no benefit. Likewise, by the same argument, there is no reason to complete the 5th or 6th year of college. 5 Econ 500 - Notes on Signaling real world earn much more than people who complete three years of college. Is this because the classes you take your senior year are super valuable? On the other hand, is that completing college indicates that you are smart, diligent, thorough, able, motivated, etc? Can you draw a picture? Yes. On the vertical axis, we have the costs and benefit of going to college. Again, keep in mind that the benefit of attending college is the additional wages you get ($200,000 - $100,000). And also, recall because the only reason we go to school is to send signals, there is not benefit for any schooling beyond the four years. Group I Group II Costs, Benefits Costs, Benefits Costs Costs > Benefits (no college) Benefits > Costs (go to college) $160,000 $100,000 Benefits 4 Costs $100,000 Benefits $80,000 Years Completed 4 Years Completed Of course, notice for the Group 1 workers, the costs of college exceed the benefits of going to college. For Group 2 workers, the benefits of college exceed the costs of college. Example where signaling does *not* work Let’s start with the same initial set up.5 Group I Group II Marginal Product (per year) = 1unit Marginal Product (per year) = 2 units Price of Product = $10,000 Price of Product = $10,000 Value of Goods Produced (per year) = $10,000 Value of Goods Produced (per year) = $20,000 Career Length = 10 years Career Length = 10 year 5 In class, I presented this material in a different order. The first case in your class notes will correspond to the second example here (signaling does not work). The second case in your class notes (salvaged signaling by making folks get an MBA) appears briefly in page 8 of these notes. Finally, the first case in these notes (signaling does work) did not appear in your class notes. If the pictures help, draw them, but they are not necessary to understand or tell the story. 6 Econ 500 - Notes on Signaling Value of Goods Produced (career) = $100,000 Value of Goods Produced (career) = $200,000 But now, let us change the cots of going to college Group I Group II Cost of completing each year of school = $20,000 Cost of completing each year of school = $10,000 Again, consider the possibility that a firm will believe that everyone who has competed four years of college is a group II (highly productive employee). Is this an equilibrium situation? The cost to Group I folks of completing four years of college is now $80,000, while the benefit is $100,000. They will go to college. The cost to Group II folks of completing four years of college is now $40,000, while the benefit is $100,000. They will go to college. Now, everyone goes to college, so when the firm hires college educated workers (and assumes they are group II workers), they will often be wrong. This is not an equilibrium. The firm would be hiring low productivity workers (and paying them high productivity wages. The firm would be disappointed, and would quickly revise its hiring decisions. Signaling does not work here. See the next section for a more general discussion of the characteristics of an effective signal. The picture for this case is illustrated below. Group I Group II Costs, Benefits Costs, Benefits Benefits > Costs (go to college) Benefits > Costs (go to college) Costs Benefits $100,000 $100,000 Benefits $80,000 Costs $40,000 4 Years Completed 4 Years Completed What is in a good signal? For signaling to work, it has to been less costly for productive workers to make the signal to the firm than it is for less productive workers to make the signal to the firm. In the first example (where signaling worked), it worked because it was sufficiently tougher (more costly) for less productive workers to send the signal that for more productive workers to send the signal. The signal has to be something that only highly productive workers find they want to engage in. Group II 7 Econ 500 - Notes on Signaling people wanted to go to college, Group I people did not want to go - because it was too costly for them to send the signal. In the second example (where signaling did not work), it did not work because it was too easy for the low productivity workers to send the signal. Both groups wanted to send the signal. This is like dressing nicely at the interview. Both groups will make the signal, so it does not help firms separate workers into groups. What might be other signals? Working long hours or staying late at work. It might be less costly for a productive employee to work 10 hours a day, perhaps because the productive worker is better at what they do or enjoys their work more than a less productive worker. Do you think using fancy paper for resumes can be used by workers to indicate they are highly productive workers? Can we salvage signaling in the second example? Go back up to the costs and benefits of going to college. Even in the second example, it is more costly for low ability workers to go to college ($20,000 per year of school) than for high ability workers. If we wanted to salvage signaling, how about just making a hiring rule based on competing more than 4 years of schooling? Suppose instead the firm assumes that workers that have 6 years of schooling are high productivity workers. Will this work?6 What should I read? Just my notes here 6 Now, the benefit of attending six years of school is $100,000 for each group. The cost of attending six years of schooling for Group I workers is $120,000 (they won’t attend) and the cost of attending six years of schooling for Group II workers is $60,000 (they will attend). Firms will assume that those that have completed six years are Group II workers and they will be correct. It is an equilibrium situation. Has attending college gotten easier in the last 30 years? Does that explain why are getting an MBA right now? 8 Econ 500 Notes – Training On-the-Job Training General training refers to the creation of skills or characteristics that are equally usable in all firms and industries. Example would include learning to drive a truck, general accounting and bookkeeping knowledge, math skills, computer skills, using Microsoft Word. Specific training refers to the creation of skills or characteristics that can be used in only the particular firm that provides the training. Examples would include specific information about the pharmaceutical trials for Viagra for someone who is a sales rep for Viagra. If you go to some other company and start selling Paxil, this knowledge is no longer valuable. Detailed knowledge of a proprietary computer system that is only used by one firm, or working on lecture notes for a class that is only offered by one college. There is an element of “textbook bs” with this distinction. It is difficult to come up with an example that is 100% specific or 100% general. Knowledge of Microsoft PowerPoint skills strikes me as being very general skills – and yet, if you work as a drug dealer, I’m not sure you’ll be making bullet point presentations for your promotional materials. Driving a truck seems general, but if you are working for a watchmaker, are those truck driving skills valuable? One certainly could suggest that in learning info about Viagra trials, likely a very specific skill, there might be a portion of this learning process that applies to the Paxil, drugs in general, sales in general, etc. I wouldn’t disagree. Nonetheless, we find it useful to make the distinction. To discuss the economics of training, we have to introduce one more bit of additional terminology. We call the firm’s marginal revenue product (MRP) the increase in firm’s total revenue associated with employment of a given worker. Think of it as the value of the workers productivity. A simple example first… Suppose hiring 3 workers at McDonalds enables 20 burgers an hour to be produced. Suppose hiring a 4th worker (one more worker) enables 25 burgers an hour to be produced. This workers marginal productivity, the extra output produced by the firm when the worker is hired, is 5 extra burgers. If these burgers can be sold for $2 a piece, the value of the workers productivity is $10 per hour. Thus for this 4th worker, we’d say the MRP is $10 per hour. More generally, the idea is that firms hire workers to make stuff. The firm then sells that stuff. The value to the firm of hiring the worker is dollar amount of the stuff that worker produces. It is based on the productivity of workers and the price of the good being produced. In general, firms will have to offer a wage equal to MRP, or they will have a difficulty attracting workers.1 General Training First, consider the productivity path of a worker with no training. If they receive no training, their productivity will never change (MRPU). The firm will have to offer them a wage that is commensurate with their productivity; else the worker will go to another firm that does (WU). As a result, both the wage of the worker and the time path of their MRP will be flat across time. Next, consider the productivity path of a worker who undergoes general training (MRPT). During the training period, the workers productivity will fall because time that previously was being used for “producing” will now be used to learn new skills. The worker will have their nose in a book or be in a classroom instead of being on the line or producing. After the training period, however, the worker will 1 We just skipped over about a month of labor economics class there, there are exceptions, etc. It turns out that firms will hire labor until the wage = MRP, so only for that last unit of labor hired, will the wage equal the MRP. If you are thinking it is impossible for the firm to earn profits if workers are always paid the value of what they produce, I suppose I ought to note that the MRP will exceed the wage for all units but the last unit of labor. If you are interested, come talk to me. Econ 500 Notes – Training have more skills and thus be more productive. See the picture below. MRP is first lower than a worker who underwent no training, but after the training period exceeds the MRP of a worker that underwent no training. This is not the hard part to figure out. What we want to figure out is what wages should be offered to these employees. You need to think backwards. Start in the post-training period and then figure out what to do in the training period. There seems to be two sensible possibilities. One possibility is for the firm to “pay” for training. The firm will pay the worker a wage above their productivity level during the training period and will then “recoup” the training costs in the post-training period by offering a wage below their productivity level. The firm would pay for training, but would also receive the rewards for the training. The other possibility is for the worker to “pay” for training. The worker will accept a lower wage in the training period, one that reflects the diminished productivity level, and then will receive a higher wage in the post-training period. In this case, the worker pays for the training, but would also receive the rewards for the training. So, what happens to wages of a worker who undergoes general training (wT)? Since the training the worker receives in general, it is valuable to all employers. Can the firm get away with paying the worker a wage that is less than their MRP after the training? The answer is no, because the worker would be able to go to another firm that will. As a result, the firm will find it has to pay the worker commensurate with their skill level after the training. The firm knows that the workers productivity will be lower during the training period. Given that the firm won’t be able to recoup the investment in the post-training period, will the firm come out “ahead” if it pays workers a wage that exceeds their productivity in the training period? The answer is no.2 So the firm will only pay workers that level of their (lower) productivity during the training period. The firm does not pay for training it all. Think of this reduction in wages as equivalent to taking the workers “off the clock” when they are learning general skills at work. The worker “pays” for training by having to accept a lower wage during the training period.3 From the employee’s perspective, the tradeoff is lower wages during the training period in exchange for higher wages in the post-training period. Therefore, on-the-job training is just like an investment from the perspective of the individual.4 See the picture on the next page. 2 If the firm paid workers a wage that exceeded their productivity in the training period, and then paid workers equal to their productivity in the post-training period, the firm would find it would have a lot of young workers (who would undergo the training period) and then leave the firm to work somewhere else. This would be an expensive proposition for the firm. 3 While writing up these notes, I kept thinking of big 6 consulting firms, where young workers do gain the on-the-job training. Might these workers “pay” for the training by having to work many hours and yet not receive (direct) compensation commensurate with that level of experience? 4 I’m sure you all appreciate that college is an investment – the costs come up from through tuition, the opportunity cost of time, etc, and the benefits come in the future through higher wages. You’ve been drilled to do the math on investment decisions throughout your academic careers, and the insight labor economists have is that schooling decisions are no different. What perhaps some of you hadn’t appreciated before this lecture (though I bet many of you had) is that on-the-job training can be viewed the same way. If the skills are valuable enough, it may be wise to invest in accepting a lower wage if the prospect of future wage growth, by way of on-the-job training, exists. This is the opposite of the idea of a “dead end job” and one you should consider in both your career decisions, and in hiring and wage offering decisions you might make as a manager. Econ 500 Notes – Training Specific Training Start again with someone who does not undergo training. Their productivity (MRPU) and their wage (wU) will both be flat, just as before. Next, consider the productivity path of a worker who undergoes specific training (MRPT). Just as before, during the training period, the workers productivity will fall. Just as before, after the training period, the worker will have more skills and thus be more productive. See the picture below. MRP is first lower than a worker who underwent no training, but after the training period exceeds the MRP of a worker that underwent no training. So far, the story is the same as with general training. Next, consider what happens to wages of a worker who undergoes specific training (wT). Since the training the worker receives is specific, it is valuable to only the present employer. Can the firm get away with paying the worker a wage that is less than their MRP after the training? The answer is yes, because if the worker tried to go to another firm, they would be treated as an untrained worker at the new firm (the training they have is not valuable to this new firm). The current firm (the one doing the training) can pay them the same wage that it would pay an untrained worker after the training.5 But if the worker will not receive a higher wage in the future, will they agree to accept a lower wage during the training period? Certainly not. They will have to be paid just as much as they would have earned if they were an untrained worker. Therefore, the wages trained workers will receive follows the same path of the wages that untrained workers receive (no decrease during the training period, but no increase after in the post-training period). So with specific training, it is the firm that “pays” for the training. Think of it as being as if workers are “on the clock” while they are learning the specific skills. 5 If the employee threatened to go to a new firm due to higher wages, the threat would be incredible. Econ 500 Notes – Training The investment decision is being made from the firm’s point of view. Should the firm “spend” the money up front on training in exchange for the benefits of more productive workers? We’ll expand on this question below. But of course, the firm will wish to do so if the benefits exceed the costs. One more twist on specific training Consider the incentives of the firm providing the specific training above. It pays the cost of training up front and gets the benefits (the gap between MRP and wages) in the future (post-training period). It should be intuitive that as the length of post-training period increases, it is more likely the investment will be profitable for the firm. If firms are constantly training new workers, and those workers for whatever reason leave immediately, it would be all costs and no benefits. The firm may want to do something to improve “retention” and reduce “turnover”. One thing it could do is offer a slight wage increase after the training period. Now the worker would have an additional incentive to say, as they would be earning a slightly better wage at the current firm than they could earn at another firm. This is called an efficiency wage. It would reduce the gap between the MRP and wage (the benefit to the firm of doing the training) per period, but may increase the average amount of time an employee would stay (mean that gap would be enjoyed by the firm for a larger number of periods). Therefore, it wouldn’t be inconsistent, even with the general idea that the firm doesn’t have to offer the employers a higher wage that the firm might want to offer the employees a higher wage after training. See the picture on the next page. The idea of an efficiency wage is a bit more general. Any time you offer an employee a higher wage than they could earn elsewhere, they employee has an extra incentive to stay at the current firm. If training, teams, etc, are important, it might make sense to do this. Google “Henry Ford” and “$5 a day wage” for a famous example of an efficiency wage reducing turnover. Econ 500 Notes – Training Econ 500 – Incentive Pay The Principal / Agent Problem This lecture is really about alternative pay schemes. The first thing that comes to mind is workers that are paid salaries, but there are other pay schemes that are observed out there in the "real world". Before we get into the details of the alternative pay schemes, and when we might see them, we should go back and talk about the generalities of princpals and agents. Principals are parties who hire others to help them achieve their objectives. Agents are parties who are hired (by principals) to advance the interests of others. Obviously, real estate agents and sports agents come to mind. If you are selling your house, you are the principal and hire the real estate agent (agent) to help you sell your house. If you are a professional athlete, you are the principal and you hire a sports agent to negotiate your contract or land you an endorsement deal. The Principal / Agent relationship only becomes a Principal / Agent problem when the goals or interests of each party are not perfectly aligned. The owners of a firm (principals) want employees to maximize profits. The employees want to maximize their utility. Employees are willing to help the firms to maximize profits in exchange for wages – so the goals of the owners and employees are not entirely inconsistent. However, a worker who earns a salary may not work very hard all day. They may play solitaire during the day, increasing their utility, but not helping to maximize profits. Thus, the goals of the principal and agent are not perfectly aligned. When goals / interests of firms and workers diverge, a principal agent problem exists. Again, the principal agent problem occurs when agents (workers) pursue some of their own objectives in conflict with achieving the goals of the principal. Profit maximizing output requires that employees work all agreed upon hours at agreed up effort. If not, output is reduced, and thus the costs of production increased. The activity we will focus on is shirking – taking unauthorized work breaks or giving less than agreed upon effort during work hours. Firms will have an incentive to find ways to reduce or eliminate principalagent problems. What we will look at next, then, are ways the firm can structure compensation in order to reduce the shirking problem. In general, these schemes are called incentive pay, or pay-for-performance. Possibilities include: • • • • • • Piece Rates Commissions and Royalties Raises and Promotions Bonuses Profit and Equity Sharing Tournament Pay Piece Rates A piece rate is compensation paid in proportion to the number of units of personal output. Found where workers control the pace of work and firms find it expensive to monitor effort. In order to pull off a piece rate, you must be able to observe and measure (count) personal output. While this seems obvious, if team production is involved, it is more difficult to determine who has produced what. See below. Examples – apple pickers, apparel workers, typists, table makers, tax prepares, lawyers 1 Econ 500 – Incentive Pay Take, for instance, the apple pickers. Apple pickers determine how quickly the pick apples. It is difficult to tell if apple pickers are exerting effort (you would have to be in the field with them). At the end of the day, it is easy to determine how many apples each person has picked. One person picks his or her own apples – not team production is involved. Contrast this situation to someone working on an assembly line in Detroit. It would not be necessary to pay the assembly line worker a piece rate. The assembly line would control the pace of output and the supervisor can likely easily monitor effort. Worker who are paid piece rats earn 10-15% more than hourly workers in same industry. Advantages of Piece Rates: • Increased Effort Drawback of Piece Rates: • • • • • Difficult to find appropriate piece rate “price” in rapidly changing industries. Increased likelihood of income variability – workers dislike income variability and may demand a compensating wage differential for this uncertainty. This will be particularly so if the “ups” and “downs” are beyond the workers control (e.g. bad apple crop). Likely to be ineffective with complex production or team production. It may be difficult to assign output to individuals. May not promote team activity or cooperation. Would you stop to help a co-worker who sprained an ankle? (John Hackett is bad samaritan.) May result in reduced quality. Might I pick up apples off the ground? Quality control / inspection efforts can mitigate this problem, but are costly. Commissions and Royalties Commissions and Royalties link pay to the value of sales. Found where work effort and hours are difficult to observe. In these cases, time rates (hourly or salary) would involve a lot of shirking. If someone tells you they will pay you $50 an hour to write a book, it would likely take many hours for you to write the book (hours are difficult to observe). If you were paid $1000 a month to sell insurance, regardless of how many policies you sell, you would likely not exert much effort (effort difficult to observe). Examples: Commissions – Realtors, Insurance, Stockbrokers, Sales Royalties - Authors, Films, Recording Artists Advantages of Commissions / Royalties • Increased Effort Drawbacks of Commissions / Royalties • Reduces, but does not eliminate the problem. If you paid your real estate agent no commission (a flat fee), they might urge you to take the first offer you get. If you paid your real estate agent 10%, every $1000 increase in the sales prices puts $100 in their pocket. This will provide more effort, but not as much effort as they would exert if you gave them a 100% commission. 2 Econ 500 – Incentive Pay However, if you gave the real estate agent a 100% commission, you just gave away your house. There is a tradeoff between the effort induced and compensation. In fact Besanko, a bit out of the box, suggests you can get folks a 100% commission, but make workers pay for the right to have the job. The worker would pay a “fee” for the right to be the salesperson. Raises and Promotions Raises and promotions are just that – raises and promotions. They are found where people are engaged in team production. It is difficult to monitor effort and measure output of individuals in the team. If you have ever been involved a group project and have been required to “divvy” up points among the members of your groups, you know this can be difficult. Two people moving a piano? First, think of someone who is being paid hourly. Given a standard wage rate and some preferences between work (income) and leisure (free time). The worker will wish to choose a certain number of hours. Now, consider paying someone that same amount of compensation only paid as a salary. If the worker could, the optimal choice would be to collect the salary and not work at all. In this story, it is difficult to determine how much effort if being put forth, so employees might be likely to shirk. While they will not be able to get away with putting forth zero effort, they will be likely to shirk. The question becomes – how can we reduce shirking in this case? One answer - by offering raises and promotions. Advantages of Raises / Promotions: • Increased Effort The tradeoff between leisure and income is not based only on this year’s salary; there is also a component of future compensation involved. Shirking today involves a reduced likelihood of a raise or a promotion. On the other hand, working hard today involves the increased likelihood of a raise or promotion. Salaried workers typically work more hours than hourly employees do. In short, shirkers do not get raises or promotions Drawbacks of Raises / Promotions • Raises and Promotions are sometimes difficult to undo (see below on bonuses) Bonuses Bonuses are extra payments – they can bed paid on personal or firm performance. Consider bonuses as extension of Raises / Promotions. They will be seen where team performance is involved and effort is difficult to observe. Advantages of Bonuses • Increased effort. See above Raises / Promotions above • Bonuses are not permanent. A raise will permanently increase the salary base. It is unusual to see someone receive a raise from $100K to $120K one year, then take a pay cut the following year. A raise is permanent. However, with bonuses, the “extra pay” is not permanent. You can pay $100K, give the employee a $20K bonus the first year, and if the second year the employee shirks, you can give no bonus (back to $100K). 3 Econ 500 – Incentive Pay Drawbacks of Bonuses (Personal) • Increased incentive for sucking up. If bonuses are paid based on something measurable (sales, number of apples picked), this is not a problem. However, if the bonus is paid on something less clearly measurable, that is determined by a supervisor, this provides the incentive for the employee to curry favor with the supervisor. To be fair, this is also true of raises and promotions • Induces activity that is counterproductive to the firm. If Alan Iverson is paid a bonus based on the number of points he scores a game, this will give him the incentive to shoot in situations where it would be better for the team if he were passing. If NSU gives professors additional compensation based on student evaluations, might this provide the incentive for professors to give good grades and cancel classes? The literature suggests that employees will undergo more of the activity that you gave them bonuses for. You have to ensure this activity is what you want to reward. Additional Disadvantages of Bonuses (Team) • Free Riding. In a team setting, the larger the group, the less each individual’s effort ultimately affects the profit level of the firm. As a result, individuals may “free-ride” – shirk and hope the other members of the group work hard. (On the other hand, the presence of group bonuses may cause co-workers to pressure free riders to work harder). If free riding is present, this of course reduces the effect that incentive pay has. The smaller the group, and the more likely each individual’s job performance is to affect the “bottom line”, the more effective will be the incentive scheme. This is why it makes more sense to give the CEO of Ford a bonus based on Ford’s profitability that someone who attaches tires to the cars. The CEO has more impact on profitability. Profit Sharing / Equity Compensation The dividing lines between bonuses, profit sharing, and equity compensation are fuzzy. While operationally a bit different (bonus, percentage of profits to employees, stock options), they have the same advantages and disadvantages of team bonuses. Tournament Pay Tournament pay is a compensation scheme that is based on relative performance. They are usually seen where extreme effort is desirable, and of course effort is difficult to monitor. Typically, first prize is very large, and then prizes drop of significantly. The chance at winning the extreme first prize is to encourage effort. At the Master’s golf tournament, first prize is $1.2 million, while second is $530K. Examples are professional golf tournaments, poker tournaments, NASCAR, and importantly, CEO pay. Consider what having “really high” CEO pay might cause to happen. People just below the CEO level will work really hard to try to become the CEO. People at junior management levels will also work really hart to try to become the CEO some day. People in the mailroom might try really hard to become junior management, and so on. The big prize at the top of the pyramid is said to promote effort throughout the organization. Other features – 2nd and 3rd prize. If the tournament is winner take all, people would get discouraged and would be unlikely to participate. In the CEO realm, we need to have highly paid Vice-Presidents. A nice thing is that because performance is relative, there is no problem with external factors. In the case of a piece-rate apple picking, a bad apple harvest could reduce income. With an apple-picking tournament based on relative apple picking, this problem is reduced. Participants are not “penalized” for circumstances beyond their control, nor are they award for thing that are beyond their control (a bumper crop of applies). 4 Econ 500 – Incentive Pay However, tournament pay is not perfect – there are disadvantages as well. One disadvantage might be that it will not promote cooperation in a team setting. If you and I are in a winner take all science project, might I light your science project on fire just before judging? Or if we are both candidates to be the new CEO and I have a great idea for your division, might I keep it to myself? If the winner becomes clear (if it is too tough to win), effort might be reduced. Do professional golfers give up (play more conservatively) when they are way behind Tiger Woods? Does this defeat the purpose of the big first prize? Might there be ludicrous risk taking to win the tournament? When I watch “Poker After Dark”, those players do very risky stuff that they would not do if it were not winner take all. Is the product enhanced? Or is the lack of 2nd prize causing effort to be lower? Race for the Chase? Jeff Gordon would have put Jimmy Johnson into the wall during last years Race for the Chase if not for the Chase part. A tournament within the tournament. You could write a book about tournament pay. What should I read? These notes are on a pretty low plane for MBA students – they are really just a slightly jazzed up version of notes I give my undergraduate labor economics classes. Besanko (Chatper 14) and Baye (Chapter 6) both have pretty nice discussions of incentive pay. Besanko in particular has some nice examples. See the Safelite car windows example, for instance. 5
© Copyright 2026 Paperzz