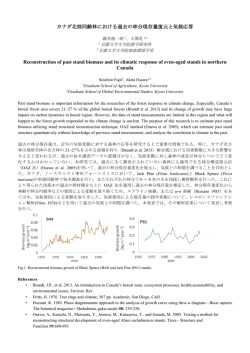
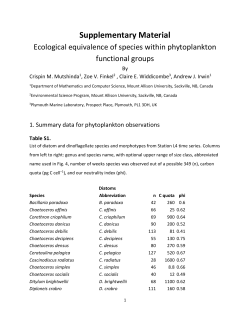
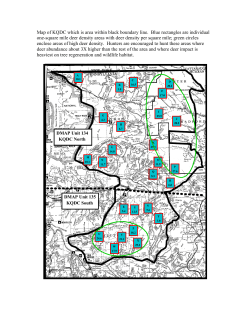
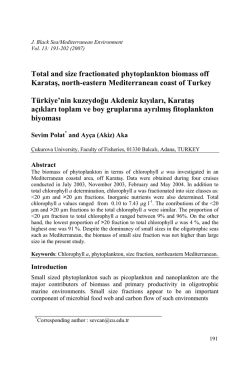
J. Black Sea/Mediterranean Environment
Vol. 19, No. 1: 23-45 (2013)
RESEARCH ARTICLE
Spatio-temporal patterns of abundance, biomass and
length-weight relationship of white grouper, Epinephelus
aeneus (Geoffroy Saint-Hilaire, 1817) (Pisces: Serranidae)
in the Gulf of Antalya, Turkey (Levantine Sea)
Elif Özgür Özbek1*, Turhan Kebapçıoğlu2, Mine Çardak3
1
Antalya Metropolitan Municipality, Department of International Relations, Directorate
of European Union Relations and Projects, Antalya, TURKEY
2
Faculty of Fisheries, Akdeniz University, 07058, Antalya, TURKEY
3
Faculty of Fisheries, Çanakkale Onsekiz Mart University, 17100, Çanakkale, TURKEY
*
Corresponding author: [email protected]
Abstract
The present paper reports the abundance and biomass of white grouper, Epinephelus
aeneus (Geoffroy Saint-Hilaire, 1817), (Pisces: Serranidae) according to depth levels and
seasons in the Gulf of Antalya, and the length-weight relationship parameters of 350
individuals. A total of 116 hauls were carried out, between August 2009 and April 2010,
seasonally in the Gulf of Antalya, at six stations and six depth levels (25, 50, 75, 100,
150, 200 m), using a commercial bottom trawl. E. aeneus was sampled from 60 hauls and
the frequency of occurrence was 51.72%. The overall average biomass of E. aeneus was
55.78 kg/km2 and the mean abundance was 60.60 ind./km2. The smallest total length (TL)
was 10 cm and the maximum TL was 101 cm. The mean TL was calculated as 34.99 cm.
The general length-weight relationship was described by the equation: W = 0.040*L2.657
(r2: 0.958; p<0.001). Mean TL and weight of the specimens, b-value and mean biomass
per abundance were highest in summer. The mean biomass per abundance was higher in
Sts. D, E and F than Sts. A, B and C, located in the eastern part of the gulf. The mean
abundance decreased as the depth level increased, however, mean biomass per abundance
and mean TL and weight of the individuals increased constantly from 25 m to 100 m
depth. The percentage of the mature fish decreased as the depth decreased.
Key words: Epinephelus aeneus, white grouper, seasonal trawl survey, Antalya,
Mediterranean Sea, length-weight relationship.
23
Introduction
Epinephelus aeneus (Geoffroy Saint-Hilaire, 1817) can be found throughout the
southern Mediterranean (up to 44°N in the Adriatic Sea) and along the west
coast of Africa to southern Angola, including islands of the Gulf of Guinea
(Thierry et al. 2008). Adults are found on rocky or mud and sand bottoms in
depths of 20 to 200 m; juveniles have been found in coastal lagoons and
estuaries (Heemstra and Randall 1993).
E. aeneus is of considerable economic importance in fisheries and caught with
hooks and lines and by trawls. The species is listed as Near Threatened both in
the Mediterranean Regional Red List and Global Red List of IUCN (Abdul
Malak et al. 2011). The species is also reported to be an excellent candidate for
mariculture because of the rapid growth rate and the potential for induced
spawning in captivity and good results of aquaculture have been achieved in
Israel (Hassin et al. 1997; Koven et al. 2007; Gorshkov 2010).
The maximum total length is reported as 120 cm and weight as 25 kg (Heemstra
and Randall 1993). It is a protogynous hermaphrodite species that is reported to
be mature first at 5 to 7 years, as a female (total length 50-60 cm, weight about
4kg) and sex change occurs at 10 to 13 years (total length 80-110 cm, weight 615 kg) in Tunisia (Bouain et al. 1983; Bruslé 1985). According to the Turkish
national regulation on commercial fisheries (2/1), the minimum length of the
capture of E. aeneus was 30 cm since 2011, and recently, it was changed to 45
cm and harvesting of smaller ones is prohibited by the regulation no. 2011/39.
Gökçe et al. (2003) studied the gonad histology and spawning pattern of this
species in Iskenderun Bay (Turkey) and reported that the spawning period
started in the beginning of June and continued till the end of August. According
to the Turkish national regulation on commercial fisheries (2/1), all methods of
grouper catching are prohibited between 15 June and 31 July. However, grouper
catch with set longlines is permitted during this period on condition that the
used fishhook is smaller than no. 9 (larger in size).
There has been no study on the spatial and temporal distribution of E. aeneus in
Turkey. However, previously a few studies have reported the presence of E.
aeneus in trawl hauls from Turkey (Başusta and Erdem 2000; Başusta et al.
2002; Çiçek et al. 2004) and CPUE and CPUA values for this species were
reported by JICA (1993), Gücü and Bingel (1994), and Salihoğlu and Mutlu
(2000).
24
Materials and Methods
This research was carried out between August 2009 and April 2010, seasonally
in the Gulf of Antalya, between the depths of 25-200 m, using a commercial
bottom trawl.
Study Area
The Gulf of Antalya is located in the Northeastern Levantine Basin and is
characterized by high temperature, salinity and oligotrophy (Figure 1).
Figure 1. Map of the Gulf of Antalya-Turkey (Levantine Sea), showing the sampling
area in grey color inside the rectangle (Turkish Republic of Northern Cyprus (TRNC),
Republic of Cyprus (RC))
The geographical coordinates of 29 trawling areas at six stations vary between
N36° 52’ 485 - 36° 23’ 000 - E31° 32’ 322 - 30° 29’ 488 (Figure 2). Samplings
were carried out at six depth levels (25, 50, 75, 100, 150, 200 m) at St. A and B.
Because of the narrow and steep continental shelf, trawling at 150 and 200 m
depth levels, however, could not be realized at Sts. C, D and E, and 200 m at St.
F. The research was conducted seasonally, both in “closed fishing” season
(August 2009) and “open fishing” seasons (November 2009, February 2010, and
April 2010) and in the no-trawl zones and open areas.
Turkish national regulation on commercial fisheries (2/1) covers a complex
scheme of open/closed zones and seasons for trawl fisheries. Bottom trawling is
prohibited during the fishing year within 2 NM off the coast and between 15
April and 25 September in the territorial waters where trawling is permitted.
25
Since 2005 till today, all sorts of trawling are prohibited in the territorial waters
between Antalya Province, Side District, Selimiye Lighthouse (36º45,928’ N31º 23,092’ E) and Alanya, Gazipaşa District, Kesik Cape (36º 09,964’ N32º23,418’ E) where St. A is located and also the Manavgat River reaches the
sea (covers the shaded area in Figure 2). The main commercial trawl area in the
Gulf of Antalya is represented by St. B where two main streams reach the sea.
Stations C and D are located off the Yacht Marina and Great Harbor of Antalya,
respectively, and both are in the closed zones for trawl. Of Sts. E and F, 25 and
50 m depth levels are located within and 75, 100 and 150 m are outside 2 NM
off the coast.
Figure 2. Map of the Gulf of Antalya-Turkey (Levantine Sea) showing the six sampling
stations (named A, B, C, D, E, F from east to west) and the location and depth levels of
29 trawl hauls. The shaded areas show “no-trawl zones”.
Sampling Methods
A total of 116 hauls were carried out at the depths of 25, 50, 75, 100, 150, 200
m, at six stations seasonally and duration of each haul was limited to an hour.
Trawling was carried out by a commercial fishing vessel “Akyarlar” which was
24.80 m long with 450 HP engine. The cod-end mesh size was 22 mm (knot to
knot). The samples were collected day time with 2.5 NM/h average towing
speed.
E. aeneus specimens were identified, sorted from the total catches and counted.
Subsequently, all fish obtained per station were measured (Total Length, TL) to
the nearest 0.5 cm immediately after the capture, and weighed (Wet Weight,
WW: ±1.0 g). The specimens smaller than 30 cm TL were released back to the
sea after measured and larger ones were donated to the governmental
organizations after landed.
26
At each sampling station, physico-chemical characteristics were measured by a
multiparameter probe (Hach-Lange HQ40D).
Data Analyses
Mean seasonal values of chemical-physical variables were obtained for each
station. The total catch from each haul was identified to species, counted,
weighed and the stock amount was calculated according to the swept area
method; the abundance and catch weight (Cw) divided by the swept area (a) for
each species and for each haul (Spare and Veneme 1992).
The swept area (a) for each hauling was estimated thus: a = D.h.X (h: length of
the head-rope, D: cover of distance, X: fraction of the head-rope length which
was equal to the width of the path swept by the trawl (accepted as 0.5). The
coordinates of the trawl operation was recorded by 30 seconds intervals by GPS
and the cover of distance was calculated by summing the distances between the
recorded coordinates.
Abundance (number of individuals per km2) and biomass (g per km2) per
sampling were calculated, and the mean values were computed according to
seasons, stations and depth levels. Length–weight relationships were assessed
from measurement total wet weight (g) and total length (cm) and the curve
parameters a and b were determined by log-transformation of raw data. Growth
curves obtained from straight line for regression between total weight and length
was: log W= log a + b * log L, where W is the weight of the fish in grams
(dependent variable), L is the total length in cm (independent variable), a is the
regression constant related to body form and b is the regression coefficient
indicating isometric growth when equal to 3. The theoretical equation of the
length-weight relationship followed the power function of the form: W= aLb,
where W is wet weight (g) and L is total length (cm). This relationship was
determined for the entire sampling seasons, stations and depth levels. To test the
null hypothesis of the isometric growth (H0: b =3), t-test was applied as
expressed by the equation according to Sokal and Rohlf (1987): ts = (b-3) / SE,
where ts is the t-test value, b the slope and SE the standard error of the slope (b).
All the statistical analyses were considered at significance level of 5% (p<0.05).
Euclidean distance dissimilarity matrix, based on the log-transformed
abundance and biomass, was tested by three-way orthogonal nonparametric
(permutation-based) MANOVA (PERMANOVA) for assessing differences at
seasons, stations and depth levels under a model in which all of them were fixed
factors using PRIMER 6+ PERMANOVA software package (Anderson et al.
2008).
Differences in total length and weight of the specimens and mean biomass per
abundance were tested among seasons, stations and depth levels by means of
one-way Analysis of Variance (ANOVA). Fisher’s LSD (Least Significant
Difference) test was used for pairwise comparison among seasons, stations and
27
depth levels by using STATISTICA software package (Version 7; Statsoft,
2004).
Differences in slopes and intercepts of length-weight relationships between
seasons, stations and depth levels were tested with Analysis of Covariance
(ANCOVA). Departures of slope from the general length-weight relationship
have been interpreted as a measure of differential body condition between size
classes, i.e. steeper slopes meaning better condition of large individuals
compared to smaller ones and vice versa. ANCOVA was performed using
GraphPad Prism (Version 5, GraphPad Software 2007).
Results
The sea water temperature was highly variable in the Gulf of Antalya seasonally
(max. 32.8°C in August 2009 and min. 15.0°C in February 2010). Mean sea
water temperatures were 28.83°C, 21.64°C, 18.02°C, and 18.80°C in summer,
autumn, winter and spring, respectively. Increasing salinity from St. A to St. F
indicated marked separation between the eastern and western parts of the Gulf.
Mean salinity values were 33.76, 34.06, 38.10, 37.96, 38.14 and 38.75 psu in the
Sts. A, B, C, D, E, and F, respectively.
During the entire research period, 369 individuals of E. aeneus were collected.
Valid length-weight measures were taken, however, for only 350 individuals. It
was sampled from 60 of 116 hauls and the frequency of occurrence was 51.72%.
The highest abundance was found in St. A at 75 m depth in winter. The highest
biomass was found in St. E at 75 m depth in winter. The abundance and biomass
per km2 of E. aeneus at six depth levels, six stations and in four seasons are
shown in Table 1.
Table 1. The abundance (ind./km2) and biomass (kg/km2) of E. aeneus caught in the Gulf
of Antalya according to depth levels, stations and seasons
St. Depth
A
A
A
A
A
A
B
B
B
B
B
B
25
50
75
100
150
200
25
50
75
100
150
200
Abundance (Ind./km2)
Aug.
Nov.
Feb.
Apr.
2009
2009
2010
2010
649.33 663.41 265.81
71.2
177.21
107.92
29.72
10.52 707.92
16.27
35.97
41.42
119.91 246.82
41.42
82.85
10.05
28.48
75.95
17.99
7.35
41.42
-
28
Aug.
2009
199.93
56.54
101.04
81.37
20.92
5.53
3.31
-
Biomass (kg/km2)
Nov.
Feb.
2009
2010
101.06
35.12
218.54
15.77 116.81
187.07
2.49
57.15
2.07
2.85
51.9
69.39
-
Apr.
2010
12.6
7.25
1.8
-
Table 1. Continued
St. Depth
C
C
C
C
D
D
D
D
E
E
E
E
F
F
F
F
F
25
50
75
100
25
50
75
100
25
50
75
100
25
50
75
100
150
Abundance (Ind./km2)
Aug. Nov.
Feb.
Apr.
2009 2009
2010
2010
284.8 314.04 97.64 429.63
41.01 87.26 33.34 89.15
18.47 85.44
31.07 47.14
25.32 203.21 18.99 88.19
13.14
208.02
56.96
17.75
70.1
59.44 370.23
99.68
29.72
77.38 85.44
68.35 116.34 130.19
65.72 46.34
30.38
13.14
73.23
15.9
25.79
12.9
-
Aug.
2009
133.85
28.71
12.66
139.33
23.52
22.29
82.47
384.82
395.65
123.89
-
Biomass (kg/km2)
Nov.
Feb.
Apr.
2009
2010
2010
173.46
35.64 100.67
88.71
10.84
38.63
15.Tem
60.52
27.96
34.18
56.34
2.85
17.64
277.12
406.31
484.59
44.86
12.32
84.73
62.25
403.56 776.27
180.72
185.31
11.17
46.1
69.64
64.48
-
The overall mean biomass (±se) of E. aeneus was 55.78±10.88 kg/km2 and mean
abundance (±se) 60.60±11.84 ind./km2 (Table 2). The mean abundance per
season ranged from 41.73±15.43 ind./km2 in spring to 77.04±28.03 ind./km2 in
autumn. Abundance increased between summer and autumn and then decreased
constantly towards spring (Table 2). The mean biomass per abundance was
highest in summer; however, there was no difference seasonally (p>0.05).
Table 2. The mean abundance (ind./km2) and biomass (kg/km2) of E. aeneus caught in
the Gulf of Antalya according to seasons (frequency of occurrence (F%), mean biomass/
mean abundance (W/N))
Season No. of hauls
Summer
Autumn
Winter
Spring
Total
29
29
29
29
116
Mean abundance
(±se)
ind./km2
58.22±24.14
77.04±28.03
65.42±25.98
41.73±15.43
60.60±11.84
Mean abundance
(±se)
kg/km2
24.0
62.61±19.63
31.8
64.33±22.39
27.0
61.16±28.35
17.2
35.00±15.26
100.0
55.78±10.88
%
%
F%
W/N
28.1
28.8
27.4
15.7
100.0
58.62
44.83
55.17
48.28
51.72
1.08
0.84
0.93
0.84
0.92
The highest mean abundance was seen in St. A (115.70±45.93 ind./km2),
however the highest mean biomass in St. E (164.70±54.91 kg/km2). St. F
showed the lowest mean abundance (7.05±3.85 ind./km2) and St. B the lowest
29
mean biomass (9.26±4.10 kg/km2) (Table 3). The mean biomass per abundance
was higher in Sts. D, E and F than Sts. A, B and C and difference among
stations were statistically significant (p<0.05).
Table 3. The mean abundance (ind./km2) and biomass (kg/km2) of E. aeneus caught in
the Gulf of Antalya according to stations (frequency of occurrence (F%), mean biomass/
mean abundance (W/N))
St.
No.of hauls
A
B
C
D
E
F
24
24
16
16
16
20
Mean abundance
(±se)
ind./km2
115.70±45.93
28.01±11.56
97.44±32.35
43.86±17.23
73.70±22.39
7.05±3.85
%
39.5
9.6
22.2
10.0
16.8
2.0
Mean abundance
(±se)
kg/km2
47.01±14.45
9.26±4.10
46.80±12.99
88.77±39.49
164.70±54.91
15.76±7.55
%
F%
W/N
17.4
3.4
11.6
22.0
40.7
4.9
50.00
41.67
75.00
56.25
75.00
25.00
0.41
0.33
0.48
2.02
2.23
2.24
The mean abundance decreased as the depth level increased. The highest mean
abundance was 172.71±39.93 ind./km2 at 25 m depth, while the highest mean
biomass was seen at 75 m depth (98.07±39.94 kg/km2) (Table 4). The mean
biomass per abundance increased clearly from 25 m to 100 m depth and
difference among depth levels were also statistically significant (p<0.05).
Table 4. The mean abundance (ind./km2) and biomass (kg/km2) of E. aeneus caught in
the Gulf of Antalya according to depth levels (frequency of occurrence (F%), mean
biomass/mean abundance (W/N))
Depth(m)
25
50
75
100
150
200
No. of hauls
24
24
24
24
12
8
ind./km2(±se)
172.71±39.93
48.80±11.62
52.38±29.58
17.29±4.68
0.00±0.00
5.18±5.18
%
59.0
16.7
17.9
5.9
0.0
0.6
kg/km2(±se)
44.16±11.61
55.00±14.92
98.07±39.94
72.26±26.45
0.00±0.00
0.31±0.31
%
16.4
20.4
36.4
26.8
0.0
0.0
F%
83.33
70.83
45.83
45.83
0.00
12.50
W/N
0.26
1.13
1.87
4.18
0.00
0.06
There was no difference in abundance and biomass among seasons; however the
differences among depth levels and stations were statistically significant (Table
5).
Of 369 collected individuals, 350 were measured. The wet-weight of the
smallest individual (10 cm) was 37.0 g. The maximum total length was
measured as 101 cm (10.50 kg) and the wet-weight as 11.0 kg (97 cm). For the
comparison of the length-weight relationship parameters with previous and
future studies that have been or will be realized in different seasons, depths and
areas, parameters were calculated separately for all seasons, stations and depth
levels (Tables 6, 7 and 8). All relationships were highly significant (p<0.001).
All R2-values were greater than 0.80.
30
The general length-weight relationship was described by the equation: W=
0.040* L2.657 (r2: 0.958; p<0.001; Table 6). Seasonal values of slope (b) ranged
from a minimum of 2.523 in autumn to a maximum of 2.922 in summer (Table
6).
The difference in total length and weight of the specimens were statistically
significant among seasons, stations and depth levels (p<0.01). According to the
results of the Fisher’s LSD (Least Significant Difference) test for pairwise
comparison, there were seasonal differences only between summer and other
seasons in total length and between summer-autumn and summer-spring in
weight of the specimens. Mean TL and weight were highest in summer (Table
6; Figure 3). All the stations differed significantly from each other except for
Sts. A-B and Sts. E-F in mean TL. Mean weight values were higher in Sts. D, E
and F comparing to Sts. A, B and C and also St. D differed significantly from
St. E (Table 7; Figure 3). The four depth levels (25, 50, 75 and 100 m) differed
significantly from each other in mean TL and weight. Mean TL and weight
increased constantly from shallow to deep waters (Table 8; Figure 3).
The results of ANCOVA (Table 9) showed that the slopes of the seasonal
length-weight relationships differed significantly from each other (except for the
pairs summer-spring and autumn-winter), showing a higher value in summer,
then decreasing in autumn and increasing in winter and spring. The slopes of
the LWR according to the depth levels differed significantly from each other
(except for the pair 50-75 m). The b-value increased as the depth increased. Sts.
A and B differed significantly from Sts. D and E, and St. C from St. E. The
slopes of Sts. A and F were not different but intercepts were significantly higher
in St. A. From east towards the western part of the Gulf, the mean TL and the bvalue increased (Table 8).
In order to explore size related differences in spatial pattern, three size classes
were formed, representing the immature (class 1: 10- 49 cm), mature female
(class 2: 50- 79 cm) and mature male (class 3: 80- 101 cm) individuals,
regarding the reference information (Bouain et al. 1983; Bruslé 1985) on the
reproductive biology of E. aeneus. The highest percentage of the mature fish
was at 100 m depth (44.4% females; 29.6% males) and the percentage decreased
as the depth decreased. At 25 m depth level, 99.5% of the individuals were
immature (Figure 4). At Sts. A, B, and C, more than 92% of the individuals
were immature. The highest percentage of mature males was at St. E (26.2%
females; 21.5% males) (Figure 5).
31
df
3
5
5
15
15
18
54
115
SS
1.6458
60.393
154.39
54.481
75.214
66.429
131.92
570.06
Abundance
MS F
0.54859 0.22455
12.079 4.9441
30.877 12.639
3.6321 1.4867
5.0143 2.0525
3.6905 1.5106
2.443
P (perm)
0.886
0.002
0.001
0.151
0.027
0.126
SS
18.57
287.03
626.49
376.33
542.32
336.21
1069.8
3468.6
Biomass
MS F
6.1899 0.31243
57.406 2.8975
125.3 6.3244
25.089 1.2664
36.155 1.8249
18.678 0.94279
19.812
P (perm)
0.811
0.013
0.001
0.215
0.051
0.55
N
Summer 82
Autumn 108
Winter 89
Spring 71
Total 350
Season
Mean
40.248
34.184
33.131
32.459
34.987
20.734
20.401
21.443
18.311
20.480
S.D.
17.2
10.0
14.0
15.0
10.0
Min.
TL (cm)
Max.
100.0
95.0
97.0
101.0
101.0
Mean
1,409.904
1,013.676
1,089.438
859.225
1,094.440
32
2,316.729
1,915.184
2,165.884
1,972.275
2,090.443
S.D.
W (g)
50.0
37.0
50.0
55.0
37.0
Min.
Max.
11000.0
9500.0
10500.0
10500.0
11000.0
a
0.015
0.065
0.051
0.021
0.040
LWR parameters
SE
95% C.I.
b
(b)
(b)
2.922 0.053 2.817-3.028
2.523 0.049 2.426-2.620
2.608 0.066 2.476-2.740
2.824 0.056 2.714-2.935
2.657 0.030 2.598-2.715
r
0.974
0.962
0.947
0.974
0.958
2
0
-
GT
S.E.: standard error; C.I.: confidence interval; r2 = coefficient of determination; GT = growth type (0 = Isometry, + = Positive allometry, - = Negative allometry))
Table 6. Descriptive statistics and L-W relationship parameters for E. aeneus according to seasons
(N: sample size; TL = total length (cm); W: weight (g); min: minimum; max: maximum; S.D.: standard deviation; a = intercept; b = slope of the linear regressions;
Source
Season
Station
Depth
Seas. x St.
Seas. x Depth
St. x Depth
Residual
Total
(df: degree of freedom, SS: sum of squares, MS: mean square, F: F-value, P (perm): calculated probability value; number of iterations = 1000)
Table 5. Results of PERMANOVA for abundance (individuals per km2) and biomass (kg per km2) with seasons, stations and depth levels as
fixed factors: bold number shows P<0.05
Table 7. Descriptive statistics and L-W relationship parameters for E. aeneus according to stations
126
38
75
35
65
11
A
B
C
D
E
F
12.506
11.261
9.131
26.451
27.286
13.481
S.D.
10.0
12.0
15.0
11.0
17.5
38.0
Min.
Mean
S.D.
Min.
95.0 398.683 1,147.964 37.0
59.0 310.658 506.465 50.0
60.0 496.733 400.719 100.0
101.0 2,189.286 3,330.316 50.0
97.0 2,812.846 3,013.437 55.0
80.0 2,209.091 1,485.062 550.0
Max.
Weight (g)
10500.0
2750.0
2100.0
10600.0
11000.0
5000.0
Max.
0.108
0.105
0.048
0.022
0.018
0.009
a
LWR parameters
SE
95% C.I.
b
(b)
(b)
2.352 0.074 2.205-2.499
2.363 0.111 2.138-2.587
2.584 0.105 2.376-2.793
2.830 0.085 2.657-3.003
2.887 0.032 2.824-2.950
3.028 0.183 2.614-3.442
Table 8. Descriptive statistics and L-W relationship parameters for E. aeneus according to depth levels
25.546
24.813
33.543
44.471
52.155
56.500
Mean
TL (cm)
0.890
0.927
0.893
0.971
0.993
0.968
r
2
0
0
GT
N
185
73
65
27
D (m)
25
50
75
100
25.302
38.636
45.708
65.674
Mean
8.570
17.376
27.203
21.973
S.D.
10.0
15.5
18.0
16.7
Min.
TL (cm)
Mean
S.D.
Min.
Max.
a
33
60.0 254.795 232.879 37.0 1650.0 0.197
100.0 1,110.440 1,909.215 75.0 10600.0 0.025
101.0 2,240.538 3,037.729 65.0 10500.0 0.017
97.0 4,045.185 2,850.083 50.0 11000.0 0.008
Max.
Weight (g)
LWR parameters
SE
95% C.I.
b
(b)
(b)
2.159 0.060 2.040-2.278
2.788 0.070 2.647-2.928
2.891 0.032 2.828-2.954
3.082 0.057 2.964-3.200
0.875
0.957
0.993
0.991
r
2
0
GT
(N: sample size; TL = total length (cm); W: weight (g); min: minimum; max: maximum; S.D.: standard deviation; a = intercept; b = slope of the linear regressions;
S.E.: standard error; C.I.: confidence interval; r2 = coefficient of determination; GT = growth type (0 = Isometry, + = Positive allometry, - = Negative allometry))
N
Stations
(N: sample size; TL = total length (cm); W: weight (g); min: minimum; max: maximum; S.D.: standard deviation; a = intercept; b = slope of the linear regressions;
S.E.: standard error; C.I.: confidence interval; r2 = coefficient of determination; GT = growth type (0 = Isometry, + = Positive allometry, - = Negative allometry))
Figure 3. Mean total length (cm) ± SE and mean weight ± SE values according to
season, station and depth levels
34
Table 9. Results of analysis of covariance (ANCOVA) showing pairwise differences
between seasons, depth levels and stations of the length-weight relationships
Significant differences are indicated in the probability (p) in bold.
ANCOVA - Comparison
Between Seasons
Summer-Autumn
Summer-Winter
Summer-Spring
Autumn-Winter
Autumn-Spring
Winter-Spring
Between Depth Levels
25m-50 m
25m-75 m
25m-100 m
50m-75 m
50m-100 m
75m-100 m
Between Stations
St. A-St. B
St. A-St. C
St. A-St. D
St. A-St. E
St. A-St. F
St. B-St. C
St. B-St. D
St. B-St. E
St. B-St. F
St. C-St. D
St. C-St. E
St. C-St. F
St. D-St. E
St. D-St. F
St. E-St. F
Slope
Intercept
F
p
F
P
27.424 <0.0001
12.319 0.001
1.595
0.209 0.385 0.536
1.114
0.293 0.900 0.344
13.574 0.000
5.043
0.026
42.334 <0.0001
93.452 <0.0001
54.195 <0.0001
2.011
0.159 0.030 0.863
6.721
0.011
7.627
0.007
0.005
0.942 0.058 0.810
2.686
0.103 0.315 0.575
16.985 <0.0001
39.349 <0.0001
2.865
0.093 5.141 0.025
2.183
0.143 1.246 0.267
10.891 0.002
31.642 <0.0001
3.959
0.053 2.538 0.118
3.323
0.071 3.165 0.078
9.517
0.002
1.938
0.168 2.223 0.140
0.583
0.447 0.108 0.743
0.315
0.578 0.393 0.534
0.521
0.473 1.577 0.213
35
Figure 4. The percentages of three size classes according to depth levels, representing
the immature (class 1: 10–49 cm), mature female (class 2: 50–79 cm) and mature male
(class 3: 80–101 cm) individuals, regarding the reference information (Heemstra and
Randall 1993) on the reproductive biology of E. aeneus
Figure 5. The percentages of three size classes according to stations, representing the
immature (class 1: 10-49 cm), mature female (class 2: 50–79 cm) and mature male (class
3: 80–101 cm) individuals, regarding the reference information (Heemstra and Randall
1993) on the reproductive biology of E. aeneus
36
Discussion
Epinephelus aeneus is of considerable economic importance in fisheries and
caught with spears, hooks and lines and in trawls in the Gulf of Antalya. Its
abundance, biomass, size structure and LWR parameters varied seasonally and
spatially. The selectivity of the trawl mesh-size affect the size distribution of the
catch and the mesh size of cod-end (22 mm; knot to knot) that we use could
have led to an underestimation of the overall population abundance. On the
other hand, for the purpose of studying spatial and temporal patterns of
population size structure and body condition, it is a useful sampling method.
There has been no study on the spatial and temporal distribution of E. aeneus in
Turkey. Previously, the presence of E. aeneus in trawl hauls was reported from
İskenderun Bay (Başusta and Erdem 2000), Yumurtalık Bay, Adana (Başusta et
al. 2002), and from Babadıllimanı Bight, Mersin (Çiçek et al. 2004).
JICA (1993) reported E. aeneus from the South Aegean Sea in the list of top 10
ranked species of fish with respect to CPUA (kg/km2) at the depth of 20-100 m
in summer, 1991. The species was not included in the similar lists for the Sea of
Marmara, North Aegean Sea or West and East Mediterranean Sea. Similarly, in
the list of top 20 species of the highest biomass, Gücü and Bingel (1994)
reported CPUE values of E. aeneus from some stations in İskenderun and
Mersin Bays (NE Mediterranean Sea). Salihoğlu and Mutlu (2000) reported this
species in the species lists of the trawl hauls in İskenderun and Mersin Bays and
North Cyprus (NE Mediterranean Sea). For the comparison to the previous
studies, the overall average biomass of E. aeneus was calculated both, according
to the Catch per Unit Trawling Area (kg/km2) and Catch per Unit Trawling
Effort (g/hour) for four depth levels (25, 50, 75, 100 m) and for overall depth
levels, removing 150 and 200 m where the species was not frequently abundant
(Table 10).
The highest biomass of E. aeneus for the NE Mediterranean Sea was reported
from North Cyprus (Salihoğlu and Mutlu 2000). The present study reports the
second highest biomass and the first detailed information on the spatial and
temporal distribution of E. aeneus from the NE Mediterranean Sea.
37
Aug. 2009- April 2010
Aug. 2009- April 2010
Aug. 2009- April 2010
Aug. 2009- April 2010
Aug. 2009- April 2010
Average of 24 hauls in Gulf of Antalya - Turkey
Average of 24 hauls in Gulf of Antalya - Turkey
Average of 24 hauls in Gulf of Antalya - Turkey
Average of 24 hauls in Gulf of Antalya - Turkey
Average of 96 hauls in Gulf of Antalya - Turkey
38
18-22
21-25
0-25
25-50
50-100
0-100
50-75
0-100
0-100
25-100
100
75
50
25
14-90
Sep. 1996
Dec. 1996
July- Dec.1996
July- Dec.1996
July- Dec.1996
July- Dec.1996
Sep. 1998
April- Oct.1998
March-June 1999
Depth (m)
20-100
15-35
7-46
7-17
25-45
36-39
40-46
20-22
83-90
Nov.1996
Date
Summer, 1991
Oct. 1983
Oct.1984
Oct.1984
Oct.1984
Nov. 1996
Nov. 1996
Nov. 1996
Nov. 1996
Location
S Aegean Sea
İskenderun Bay- Turkey (NE Med. Sea)
Mersin Bay- Turkey (NE Med. Sea)
Mersin Bay- Turkey (NE Med. Sea)
Mersin Bay- Turkey (NE Med. Sea)
Mersin Bay- Turkey (NE Med. Sea)
İskenderun Bay- Turkey (NE Med. Sea)
İskenderun Bay- Turkey (NE Med. Sea)
N Cyprus (NE Med. Sea)
Average of 14 hauls in İskenderun and Mersin Bays and North
Cyprus (NE Med. Sea)
Mersin Bay- Turkey (NE Med. Sea)
Mersin Bay- Turkey (NE Med. Sea)
Average of 5 hauls in Mersin Bay- Turkey
Average of 5 hauls in Mersin Bay- Turkey
Average of 4 hauls in Mersin Bay- Turkey
Average of 14 hauls in Mersin Bay- Turkey
Mersin Bay- Turkey (NE Med. Sea)
Average of 18 hauls in Mersin Bay- Turkey
Average of 12 hauls in Mersin Bay- Turkey
600 g/30 min
200 g/30 min
160 g/30 min
0
0
57 g/hour
70 g/30 min
4 g/hour
0
44.16 kg/km2
3089.24 g/hour
55.00 kg/km2
3948.92 g/hour
98.07 kg/km2
6791.05 g/hour
72.26 kg/km2
4634.86 g/hour
67.37 kg/km2
4616.01 g/hour
874 g/hour
CPUA-CPUE
77 kg/km2
4150 g/hour
435 g/hour
1192 g/hour
418 g/hour
100 g/30 min
60 g/30 min
1200 g/30 min
10000 g/30 min
Present Study
Present Study
Present Study
Present Study
Present Study
Salihoğlu and Mutlu 2000
Salihoğlu and Mutlu 2000
Salihoğlu and Mutlu 2000
Salihoğlu and Mutlu 2000
Salihoğlu and Mutlu 2000
Salihoğlu and Mutlu 2000
Salihoğlu and Mutlu 2000
Salihoğlu and Mutlu 2000
Salihoğlu and Mutlu 2000
Salihoğlu and Mutlu 2000
Source
JICA 1993
Gücü and Bingel 1994
Gücü and Bingel 1994
Gücü and Bingel 1994
Gücü and Bingel 1994
Salihoğlu and Mutlu 2000
Salihoğlu and Mutlu 2000
Salihoğlu and Mutlu 2000
Salihoğlu and Mutlu 2000
Table 10. Comparison of the mean biomass of E. aeneus to the previous studies
CPUA= Catch per Unit Trawling Area (kg/km2); CPUE= Catch per Unit Trawling Effort (g/time))
The parameter b represents growth allometric rate, and indicates isometric
growth when equal to 3. The slopes of length-weight relationships varied widely
between ecosystems (Table 11). None of the studies, however, investigated its
temporal and spatial fluctuations according to the size class, which indicate
relative body condition between seasons, depth levels or stations. In this study,
differences in allometric coefficients were recorded between seasons, depth
levels and stations. While isometric growth was observed in summer, negative
allometric coefficient was found in other three seasons. This suggested seasonal
differences in size structure of the population. Smaller individuals showed a
lower allometric coefficient while bigger individuals showed a higher
coefficient. The overall value (2.657), on the other hand, was the lowest value
compared to the previous studies, probably due to the higher abundance of the
small size individuals in the present study. In addition, various factors may be
responsible for the differences in parameters of the length-weight relationships
among seasons, such as temperature, salinity, food (quantity, quality and size),
sex, and stage of maturity (Pauly 1984; Weatherley and Gill 1987).
Table 11. Descriptive statistics and L-W relationship parameters for Epinephelus aeneus
compared with previous studies
(N: sample size; TL = total length (cm); min: minimum; max: maximum; S.D.: standard deviation,
*standard error; a = intercept; b = slope of the linear regressions; GT = growth type (0 = Isometry,
+= Positive allometry, - = Negative allometry)
Study area
Senegal-W. Africa
Cape Verde-C. Atlantic
Ocean
Benin –W. Africa
İskenderun Bay-Turkey
(NE Med.)
Turkey (NE Med.)
Gökova Bay-Turkey
(Aegean Sea)
Gulf of Antalya-Turkey
(NE Med.)
n
TL (cm)
Mean
S.D.
LWR
parameters
a
b
0.0053
3.230
GT
Source
Min.
Max.
14
39.0
56.0
0.00168
3.580
2
9
18.6
68.0
0.0207
2.850
3
1
89
34.26
10.97
17.40
67.5
0.0152
2.90
-
4
24
30.98
8.44
16.0
42.2
0.0120
2.987
0
5
36
21.0
0.45*
16.0
27.8
0.0098
3.043
0
6
350
34.987
20.480
10.0
101.0
0.040
2.657
-
7
Source: 1) Cury and Worms 1982, 2) Magnússon and Magnússon 1987, 3) Fiogbe 2003, 4) Can et
al. 2002, 5) Sangun et al. 2007, 6) Ceyhan et al. 2009, 7) Present study
In this study, no data on the reproduction of this species were obtained because
the samplings were carried out by a commercial fishing vessel and due to the
lack of a special permission to land the groupers, the specimens under 30 cm TL
were released back to the sea after measured and larger ones were donated to the
governmental organizations after landed in accordance with the Turkish national
regulation on commercial fisheries. Also, due to the limited time and lack of
necessary conditions in the fishing vessel, gonads, otoliths or the stomachs of
the fish could not be sampled.
39
Gökçe et al. (2003) reported the spawning period of E. aeneus to start in the
beginning of June and continue till the end of August, in İskenderun Bay,
Turkey (NE Mediterranean Sea), similar to the findings for E. aeneus and E.
marginatus in Tunisia (Bouain and Siau 1983), Italy (Pelagie Islands, south
Med. Sea) (Marino et al. 2001) and Spain (Zabala et al. 1997). Mean TL and
weight of the specimens, b-value and mean biomass per abundance were highest
in summer and it could possibly be related to the presence of mature individuals
with higher gonado-somatic ratio.
Juveniles of E. aeneus tend to occur in coastal lagoons and estuaries (Heemstra
and Randall 1993). In accordance to this, the mean biomass per abundance was
higher in Sts. D, E and F than Sts. A, B and C which were in the eastern part of
the gulf and the salinity was lower comparing to the west due to three main
streams and Manavgat River reaching the sea. At Sts. A, B, and C, more than
92% of the individuals were immature. The highest abundance, represented by
small individuals was sampled from the 25 m depth of St. A and the individuals
with lowest mean TL were found in Sts. A and B. Any sort of trawling is
prohibited in St. A since 2005 till today, however fishing with spears, hooks and
lines are used to catch this species. Higher abundance and biomass in St. A
compared to St. B, which is the main commercial trawl area of the Gulf, may be
interpreted as the recovery of the “no-trawl zone”. The possible fishing effect
can be seen in St. B with the lowest mean biomass, mean biomass per
abundance and mean total-length value. Sts. C and D are closed zones for trawl,
but popular areas for commercial and sportive fishing by hooks and lines due to
their proximity to the Yacht Marina and Great Harbor of Antalya. The second
highest abundance was found in St. C and the second highest biomass in St. D.
The mean length values of both stations were higher than Sts. A-B, but lower
than Sts. E-F. Although the depth levels of 75, 100 m of St. E and 75, 100, 150
m of St. F were located outside 2 NM off the coast due to the limited trawl area,
the commercial trawlers generally do not prefer these regions for trawl.
However, both stations are mostly preferred for small-scale fisheries. The
highest biomass and mean individual weight were found in St. E, presenting the
highest percentage of the mature males.
The mean abundance decreased as the depth level increased, however, mean
biomass per abundance and mean TL and weight of the individuals increased
constantly from 25 m to 100 m depth. The highest percentage of the mature fish
was at 100 m depth and the percentage decreased as the depth decreased. At 25
m depth 99.5% of the individuals were at the size of immature fish. Similar
distribution patterns of juvenile E. marginatus individuals in shallow and larger
individuals in deeper waters were reported previously from the Mediterranean
Sea (Bodilis et al. 2003a, 2003b; Foulquié and Dupuy de la Grandrive 2007).
In the Strait of Sicily, Bianchini et al. (2007) performed 3557 trawl hauls and
reported that the catch of groupers was low both in number (27 fish, i.e. less
40
than 1 grouper per 120 h of fishing) and weight (275 kg, or 77 g/h in a fishery
that catches over 50 kg/h). They found five species of goupers and six
specimens of E. aeneus in three hauls, all at depths around 50 m with the largest
specimen at 34.40 kg. They concluded that trawling did not seem to represent a
significant risk for the grouper population of the Strait of Sicily because in
general groupers live and take shelter in rough, untrawlable grounds. However,
the adults of E. aeneus are found on rocky or mud and sand bottoms in depths of
20 to 200 m and the high catchability rate of this species found in this study
shows that trawling seem to represent a risk for the population of this species in
the Gulf of Antalya.
Ünal et al. (2009) reported that 16% of the fishing operations throughout the
season was focused especially on groupers in Gökova Bay. They recorded the
total catch of all goupers as 1448 kg with a CPUE value of 3.78 kg per vessel
and the ratio of groupers caught below legal size as 13.3% and immature
individuals as 85%. E. aeneus constituted 11% of the total landing volume and
the highest economic value (31%) in Gökova Bay, 2006. They mentioned the
insufficent scientific studies to prepare a sustainable management of groupers
and suggested to determine the reproduction areas and declare these areas “No
Take Zones” which is going to affect postively not only the species but also
whole ecoystem they live in. Similarly, Lakkis and Sabour (2007) reported a
decrease in the grouper stocks in the Syrian and Lebanese coastal waters and
highlighted the importance of protected areas and marine reserves together with
the regulations in fishing activities.
Thiao et al. (2012) recently reported the collapse of E. aeneus stock due to the
booming small-scale fishery sector in Senegal and mentioned the necessity of a
balance between conservation and exploitation to maintain ecological viability
while considering the socio-economic importance of the small-scale fisheries.
There is no closed area or season for longline and gillnets in the Gulf of Antalya
and species selectivity is impossible with the currently used gears. Although,
using speargun, fish trap, fyke nets etc. are prohibited to catch groupers, illegal
fishing is practiced. Ünal et al. (2009) reported that the amount of illegally
caught groupers is almost equal or larger than the legal annual catch amount in
Gökova Bay. Therefore, land-based combating was adviced as a more effective
and low-cost solution. More detailed studies are necessary on the biology and
ecology of this species in the region; however, this is so far the most detailed
study on spatio-temporal distribution and length-weight relationship of E.
aeneus in Turkey. The results of this study are epected to be useful for future
decisions on declaration of “No Take Zones” or protected areas in the Gulf of
Antalya.
41
Acknowledgements
The authors greatly indepted to Assoc. Prof. Dr. Saadet F. Karakulak and Prof. Dr.
Gülşen Altuğ for their valuable comments and support, and Captain Akın Akyar and the
crew of the commercial trawl vessel “Akyarlar” for their help in collecting the samples.
The authors would like to thank the anonymous reviewers for their valuable comments
and suggestions to improve the manuscript.
Antalya Körfezi’nde Kum gridası, Epinephelus aeneus
(Geoffroy Saint-Hilaire, 1817) (Pisces: Serranidae)’un bolluk,
biyokütle ve boy-ağırlık ilişkisinin mevsimsel ve mekansal
değişimi
Özet
Bu çalışmada, Epinephelus aeneus (Geoffroy Saint-Hilaire, 1817), (Pisces:
Serranidae)’un, Antalya Körfezi’nde mevsim, istasyon ve derinliklere göre bolluk ve
biyokütlesi ve elde edilen 350 bireyin boy-ağırlık ilişkisi bildirilmektedir. Ağustos 2009Nisan 2010 tarihleri arasında mevsimsel olarak, altı istasyonda ve altı farklı derinlikte
(25, 50, 75, 100, 150, 200 m), toplam 116 trol çekiminin 60’ında (% 51,72) E. aeneus
örneklenmiş olup, ortalama bolluk 60,60 birey/km2, biyokütle ise 55,78 kg/km2 olarak
hesaplanmıştır. En küçük birey 10 cm ve en büyük total boylu (TB) birey 101 cm
ölçülmüş olup, ortalama total boy 34,99 cm hesaplanmıştır. Boy-ağırlık ilişkisine ait
denklem, W= 0.040* L2.657 (r2: 0.958; p<0.001) olarak ifade edilmiştir. Bireylerin
ortalama TB ve ağırlığı, b-değeri ve ortalama biyokütle/bolluk yazın en yüksektir.
İstasyon D, E ve F’de ortalama biyokütle/bolluk, körfezin doğusunda bulunan
istasyonlara (İst A, B, C) göre daha yüksektir. Derinlik arttıkça, ortalama bolluk azalmış,
fakat, ortalama biyokütle/bolluk ve bireylerin ortalama TB ve ağırlığı 25 m’den 100 m’ye
doğru gittikçe artmıştır. Ergin bireylerin yüzdesi, derinlik azaldıkça azalmıştır.
References
Abdul Malak, D., Livingstone, S. R., Pollard, D., Polidoro, B. A., Cuttelod, A.,
Bariche, M., Bilecenoglu, M., Carpenter, K. E., Collette, B. B., Francour, P.,
Goren, M., Kara, M. H., Massutí, E., Papaconstantinou, C., Tunesi, L. (2011)
Overview of the conservation status of the marine fishes of the Mediterranean
Sea. IUCN, Gland, Switzerland and Malaga, Spain, 68 pp.
Anderson, M. J., Gorley, R. N., Clarke, K. R. (2008) PERMANOVA+ for
PRIMER: Guide to software and statistical methods. PRIMER-E, Plymouth,
UK, 214 pp.
Başusta, N., Erdem, Ü. (2000) A study on the pelagic and demersal fishes of
Iskenderun Bay. Turk J. Zool. 24: 1-19.
42
Başusta, N., Kumlu, M., Gökçe, M. A., Göçer, M. (2002) Seasonal change and
productivity index of species by trawled in Yumurtalık Bay. E.U. Journal of
Fisheries and Aquatic Sciences 19 (1-2): 29-34 (in Turkish).
Bianchini, M. L., Giusto, G. B., Morara, U., Nardone, G. D., Sinacori, G.,
Ragonese, S. (2007) Trawl catches of groupers in the Strait of Sicily. In: 2nd
Symposium on Mediterranean Groupers, May 10th – 13th 2007 (eds., P.
Francour, J. Gratiot), Nice, pp. 35-36.
Bodilis, P., Ganteaume, A., Francour, P. (2003a) Presence of 1 year-old dusky
groupers along the French Mediterranean coast. J. Fish Bio. 62: 242-246.
Bodilis, P., Ganteaume, A., Francour, P. (2003b) Recruitment of the dusky
grouper (Epinephelus marginatus) in the north-western Mediterranean Sea.
Cybium 27 (2): 123-129.
Bouain, A., Siau, Y. (1983) Observations on the female reproductive cycle and
fecundity of three species of groupers (Epinephelus) from the Southeast
Tunisian seashores. Marine Biology 73: 211-220.
Bouain, A., Siau, Y. Quignard, J. P. (1983) The groupers off the southeastern
coasts of Tunisia, first part: systematic and ecobiology. Pêche Marit. 62 (1262):
276-280.
Bruslé, J. (1985) Exposé synoptique des données biologiques sur les mérous
Epinephelus aeneus (Geoffroy Saint-Hilaire, 1809) et Epinephelus guaza
(Linnaeus, 1758) de I’Océan Atlantique et de la Méditerranée. FAO Synop.
Pêches 129: 64 pp.
Can, F., Başusta, N., Çekiç, M. (2002) Weight-length relationships for selected
fish species of the small-scale fisheries off the south coast of Iskenderun Bay.
Turk J. Vet. Anim. Sci. 26: 1181-1183.
Ceyhan, T., Akyol, O., Erdem, M. (2009) Length-weight relationships of fishes
from Gökova Bay, Turkey (Aegean Sea). Turk J. Zool. 33: 69-72.
Çiçek, E., Avşar, D., Yeldan, H., Özütok, M. (2004) General characteristics of
teleost fish fauna trawled from Babadıllimanı Bight (Mersin, Türkiye). E.U.
TrJFAS. 21 (3-4): 223-227 (in Turkish).
Cury, P., Worms, J. (1982) Pêche, biologie et dynamique du thiof (Epinephelus
aeneus E. Geoffroy Saint-Hilaire, 1817) sur les côtes sénégalaises. Doc. Sci.
Cent. Rech. Océanogr. Dakar-Thiaroye (82): 88 pp.
Fiogbe, E. D. (2003) Morphometric relationships of commercially important
fish species from Benin. In: Fish Biodiversity: Local Studies as Basis for Global
Inferences (eds., M. L. D. Palomares, B. Samb, T. Diouf, J. M. Vakily, D.
Pauly), ACP-EU Fish. Res. Rep. 14: 25-30.
43
Foulquié, M., Dupuy de la Grandrive, R. (2007) Abundance of juvenile dusky
groupers Epinephelus marginatus (Lowe, 1834) in Syrian coastal waters, first
observations and preliminary data. In: 2nd Symposium on Mediterranean
Groupers, May 10th – 13th 2007 (eds., P. Francour, J. Gratiot), Nice, pp. 77.
Gökçe, M. A., Cengizler, İ., Özak, A. A. (2003) Gonad histology and spawning
pattern of the white grouper (Epinephelus aeneus) from Iskenderun Bay
(Turkey). Turk J. Vet. Anim. Sci. 27: 957-964 (in Turkish).
Gorshkov, S. (2010) Long-term plan for domestication of the white grouper
(Epinephelus aeneus). Israel. Isr. J. Aquacult.- Bamidgeh 62 (4): 215-224.
GraphPad Software (2007) GraphPad Prism (Version 5). Available at
www.graphpad.com. (accessed 05 Nov. 2011)
Gücü, A. C., Bingel, F. (1994) Trawlable species assemblages on the continental
shelf on the North Eastern Levant Seas (Mediterranean) with an emphasis on
Lessepsian migration. Acta Adriat. 35: 83-100.
Hassin, S., de Monbrison, D., Hanin, Y., Elizur, A., Zohar, Y., Popper, D. M.
(1997) Domestication of the white grouper, Epinephelus aeneus 1. Growth and
reproduction. Aquaculture 156 (3-4): 305-316.
Heemstra, P. C., Randall, J. E. (1993) FAO Species Catalogue. Vol. 16.
Groupers of the World (Family Serranidae, Subfamily Epinephelinae). An
annotated and illustrated catalogue of the grouper, rock cod, hind, coral grouper
and lyretail species known to date. FAO Fisheries Synopsis, No. 125, Vol. 16.
Rome, FAO, 382 pp.
JICA (1993) Report of demersal fisheries resource survey in the Republic of
Turkey. JICA, AFF, JR (63), Ankara, 579 pp.
Koven W., Ben-Atia I., Lutzky S., Nixon O., Tandler A. (2007) Food particle
size and photoperiod are critical factors in first feeding white grouper
(Epinephelus aeneus) larvae. In: 2nd Symposium on Mediterranean Groupers,
May 10th – 13th 2007 (eds., P. Francour, J. Gratiot), Nice, pp. 109-111.
Lakkis S., Sabour W. (2007) Distribution and ecology of groupers in SyroLebanese coastal waters: are they endangered or menaced ? In: 2nd Symposium
on Mediterranean Groupers, May 10th – 13th 2007 (eds., P. Francour, J. Gratiot),
Nice, pp. 117-119.
Magnússon, J., Magnússon, J. V. V. (1987) ICEIDA/Cape Verde Islands
Fisheries Project, survey of demersal fish resources in the waters off Cape
Verde Islands. IV. Report: summary of information on species. Icelandic
International Development Agency/Marine Research Institute, 114 pp.
44
Marino, G., Azzurro, E., Massari, A., Finoia, M. G., Mandich, A. (2001)
Reproduction in the dusky grouper from the southern Mediterranean. Journal of
Fish Biology 58: 909-927.
Pauly, D. (1984) Fish population dynamics in tropical waters: a manual for use
with programmable calculators. ICLARM Studies and Reviews 8. International
Center for Living Aquatic Resources Management, Manila, Philippines, 325 pp.
Salihoğlu, İ., Mutlu, E. (2000) National marine research and monitoring
programme, Mediterranean, Marmara Sea, Turkish Straits System, Black Sea
and atmosphere sub-projects. 1995-1999 Period Synthesis Report. TUBITAK,
Ankara, Turkey, 449 pp (in Turkish).
Sangun, L., Akamca, E., Akar, M. (2007) Weight-length relationships for 39
fish species from the north-eastern Mediterranean coast of Turkey. Turkish
Journal of Fisheries and Aquatic Sciences 7: 37-40.
Sokal, R. R., Rohlf, F. J. (1987). Introduction to Biostatistics. 2nd Ed., Freeman,
New York, 363 p.
Spare, P., Veneme, S. C. (1992) Introduction to tropical fish stock assessment
(Part 1). FAO Fish. Tech. Pap., Rome.
StatSoft Inc. (2004) Statistica (data analysis software system), Version 7.
Available at www.statsoft.com (accessed 29 Dec. 2011)
Thiao, D., Chaboud, C., Samba, A., Laloë, F., Cury, P. M. (2012) Economic
dimension of the collapse of the ‘false cod’ Epinephelus aeneus in a context of
ineffective management of the small-scale fisheries in Senegal. African J. Mar.
Sci. 34 (3): 305-311.
Thierry, C., Sadovy, Y., Fennessy, S., Choat, J. H., Ferreira, B., Bertoncini, A.
A., Craig, M. T., Rocha, L. (2008) Epinephelus aeneus. In: IUCN 2011, IUCN
Red List of Threatened Species. Available at www.iucnredlist.org (accessed
04 Jan. 2012).
Ünal, V., Erdem, M., Göncüoğlu, H., Güçlüsoy, H., Tosunoğlu, Z. (2009)
Management paradox of groupers (Epinephelinae) fishing in the Gökova Bay
(Eastern Mediterranean), Turkey. JFAE. 7 (3/4): 904- 907.
Weatherley, A. H., Gill, H. S. (1987) The Biology of Fish Growth. Academic
Press, London, 443 pp.
Zabala, M., Garcia-Rubies, A., Louisy, P., Sala, E. (1997) Spawning behaviour
of the Mediterranean dusky grouper Epinephelus marginatus (Lowe, 1834)
(Pisces, Serranidae) in the Medes Islands Marine Reserve (NW Mediterranean,
Spain). Sci. Mar. 61 (1): 65-77.
Received: 04.01.2012
Accepted: 25.01.2011
45
© Copyright 2026 Paperzz