NAIST-IS-DT0061021
Doctor’s Thesis
A Study on Generic and User-Focused
Automatic Summarization
Tsutomu Hirao
August 21, 2002
Department of Information Processing
Graduate School of Information Science
Nara Institute of Science and Technology
Doctor’s Thesis
submitted to Graduate School of Information Science,
Nara Institute of Science and Technology
in partial fulfillment of the requirements for the degree of
DOCTOR of ENGINEERING
Tsutomu Hirao
Thesis committee:
Yuji Matsumoto, Professor
Shunsuke Uemura, Professor
Kiyohiro Shikano, Professor
Kentaro Inui, Associate Professor
A Study on Generic and User-Focused
Automatic Summarization∗
Tsutomu Hirao
Abstract
Due to the rapid growth of the Internet and the emergence of low-price and
large-capacity storage devices, the number of online documents is exploding. This
situation makes it difficult to find and gather the information we really need.
Therefore, many researchers have been studying technologies to overcome this
difficulty. Examples include Automatic Summarization, Information Retrieval
(IR), Information Extraction (IE), and Question-Answering (QA). In recent years,
Automatic Text Summarization has attracted the attention of a lot of researchers
in this field. This technology produces overviews that are easier and faster to
browse than the original documents.
This thesis discusses the following three topics in automatic text summarization:
1. High performance “generic” single-document summarization with many features (Chapter 2).
2. “Generic” multi-document summarization by extending the single-document
summarization method (Chapter 3).
3. “User-focused” summarization as evidence of answer in Question-Answering
Systems (Chapter 4).
∗
Doctor’s Thesis, Department of Information Processing, Graduate School of Information
Science, Nara Institute of Science and Technology, NAIST-IS-DT0061021, August 21, 2002.
i
ii
ABSTRACT
Chapter 2 proposes a method of “generic” single-document summarization
based on Support Vector Machines. It is known that integrating heterogeneous
sentence features is effective for summarization. However, we cannot manually
find optimal parameter values for these features when many features are available.
Therefore, machine learning has attracted attention in order to integrate heterogeneous features effectively. However, most machine learning methods overfit the
training data when many features are given. In order to solve this difficulty, we
employ Support Vector Machines, which are robust even when the number of
features is large. Moreover, we do not know what the effective features are. To
address this problem, we analyze the weights of features and clarify them.
Chapter 3 proposes a “generic” multi-document summarization method using
Support Vector Machines. Multi-document summarization is almost the same
as single-document summarization, except that we need to consider extra features for the former. Therefore, we face the same problem as in single-document
summarization: how to handle many relevant features. We expand the singledocument summarization method based on Support Vector Machines to multidocument summarization. It is said that a summary from multi-documents has
redundancy, i.e., there are redundant sentences. Therefore, we investigate the effectiveness of Maximum Marginal Relevance (MMR) which is one of the generally
used methods for minimizing redundancy.
In Chapter 4, we propose a “user-focused” summarization method, QuestionBiased Text Summarization (QBTS), which produces evidence of the QuestionAnswering system’s answer. Question-Answering systems output the exact answer to a question not a document. By using QA systems, we can reduce the
time taken to select information. However, QA system’s outputs, i.e., answers,
are not always correct. Therefore, we propose a summarization method which
focuses on not only the question, but also on prospective answers to the question
to justify the correctness of the QA system’s answer.
Keywords:
natural language processing, automaric text summarization, important sentence
extraction , machine learning, Support Vector Machines, question-answering, in-
ABSTRACT
trinsic evaluatin, extrinsic evaluation
iii
Acknowledgements
I would like to express my sincere appreciation to Professor Yuji Matsumoto
of Nara Institute of Science and Technology for supervising this dissertation. I
greatly appreciate the continuous support and timely advice he has given to me.
His encouragement helped shape the direction of my work.
I would like to express my gratitude to Professor Shunsuke Uemura and Professor Kiyohiro Shikano of Nara Institute of Science and Technology for their
valuable suggestions and helpful comments.
I am indebted to Associate Professor Kentaro Inui of Nara Institute of Science
and Technology for constructive and fruitful discussions.
I am also indebted to Professor Akira Kumamoto of Kansai University, who
was my supervisor when I was an undergraduate student at Kansai University.
I am grateful to my colleagues in the computational linguistics laboratory at
Nara Institute of Science and Technology. My thanks are especially to Messrs.
Taku Kudo and Hiroya Takamura. They gave me valuable comments and useful
software.
I completed this dissertation at the Intelligent Communication Laboratory
(ICL) of NTT Communication Laboratories (NTT CS Labs.). I would like to
gave my appreciation to Dr. Ken’ichiro Ishii, Director of NTT CS Labs. and
Dr. Noboru Sugamura, Vice-director of NTT CS Labs., Dr. Toshiro Kita, the
former Executive Manager of the ICL, Dr. Tsuneaki Kato, our former group
leader and Dr. Shigeru Katagiri, Executive Manager of the ICL, for providing me
the opportunity to complete this dissertation at NTT CS Labs.
I wish to thank my colleagues in the ICL, especially Dr. Eisaku Maeda, Dr.
v
vi
ACKNOWLEDGEMENTS
Hideki Isozaki and Dr. Yutaka Sasaki. Dr. Maeda supported me and gave me
valuable comments. Dr. Isozaki and Dr. Sasaki encouraged me and discussed
many problems with me. Without their guidance, this dissertation would not
have been written. My appreciation also goes to members of the ICL. Especially,
Dr. Hirotoshi Taira, Mr. Hideto Kazawa and Mr. Jun Suzuki encouraged me to
work and research.
I would also like to thank Dr. Taichi Nakamura, Dr. Osamu Iwaki, Dr. Tsuyoshi
Kitani of NTT DATA Corporation. They supported me and gave me valuable
comments. My thanks also goes to Mr. Toru Takaki, Mr. Akira Kitauchi and Mr.
Jun’ichiro Kita of NTT DATA Corp. They encouraged me and gave me valuable
comments.
Special thanks are also due to all of the people who gave me valuable comments
and continuous encouragement. They include Atsushi Yamada, Manabu Okumura, Takahiro Fukushima, Hajime Mochizuki, Hidetsugu Nanba, Chikashi Nobata, Satoshi Sekine, Ralph Grishman, Tadashi Nomoto, and Kazuhiro Takeuchi.
Although I cannot list all of their names, I would like to express my thanks to all
of them.
Finally, I thank my wife, Chihiro, for giving me generous support and understanding in every part of my life, and would also like to extend my gratitude to
my parents, Shunjiro and Yoko Hirao, for all of the long-time support they have
given to me, visible and invisible.
Contents
Abstract
i
Acknowledgements
v
1 Introduction
1
2 Applying Support Vector Machines to Single-Document Summarization
2.1 Introduction . . . . . . . . . . . . . . . . . . . . . . . . . . . . . .
2.2 Using Support Vector Machines for Important Sentence Extraction
2.2.1 Support Vector Machines (SVMs) . . . . . . . . . . . . . .
2.2.2 Sentence Ranking by using Support Vector Machines . . .
2.2.3 Features for Single-Document Summarization . . . . . . .
2.3 Experimental Evaluation . . . . . . . . . . . . . . . . . . . . . . .
2.3.1 Corpus . . . . . . . . . . . . . . . . . . . . . . . . . . . . .
2.3.2 Measures for Evaluation . . . . . . . . . . . . . . . . . . .
2.3.3 Compared Summarization Methods . . . . . . . . . . . . .
2.3.4 Results . . . . . . . . . . . . . . . . . . . . . . . . . . . . .
2.4 Discussion . . . . . . . . . . . . . . . . . . . . . . . . . . . . . . .
2.5 Results for English Documents . . . . . . . . . . . . . . . . . . . .
2.6 Summary . . . . . . . . . . . . . . . . . . . . . . . . . . . . . . .
7
7
8
8
11
11
17
17
18
20
20
23
30
32
3 Applying Support Vector Machines to Multi-Document Summarization
35
3.1 Introduction . . . . . . . . . . . . . . . . . . . . . . . . . . . . . . 35
3.2 Document Sets . . . . . . . . . . . . . . . . . . . . . . . . . . . . 36
vii
viii
CONTENTS
3.3 Multi-Document Summarization based on Support Vector Machines
3.4 Features for Multi-Document Summarization . . . . . . . . . . . .
3.5 Experimental Evaluation . . . . . . . . . . . . . . . . . . . . . . .
3.5.1 Corpus . . . . . . . . . . . . . . . . . . . . . . . . . . . . .
3.5.2 Compared Summarization Methods . . . . . . . . . . . . .
3.5.3 Results . . . . . . . . . . . . . . . . . . . . . . . . . . . . .
3.6 Discussion . . . . . . . . . . . . . . . . . . . . . . . . . . . . . . .
3.6.1 The Effective Features . . . . . . . . . . . . . . . . . . . .
3.6.2 The Effectiveness of the Multi-Document Features . . . . .
3.6.3 Minimize Redundancy by Maximum Marginal Relevance
(MMR) . . . . . . . . . . . . . . . . . . . . . . . . . . . .
3.7 Summary . . . . . . . . . . . . . . . . . . . . . . . . . . . . . . .
36
37
40
40
40
43
45
45
48
49
52
4 Question-Biased Text Summarization for Question-Answering Systems
53
4.1 Introduction . . . . . . . . . . . . . . . . . . . . . . . . . . . . . . 53
4.2 Preparation: QA Systems . . . . . . . . . . . . . . . . . . . . . . 54
4.2.1 TREC-Style QA Task . . . . . . . . . . . . . . . . . . . . 55
4.2.2 QA Test Collection . . . . . . . . . . . . . . . . . . . . . . 55
4.3 Question-Biased Text Summarization Method . . . . . . . . . . . 56
4.3.1 Question-Biased and Query-Biased . . . . . . . . . . . . . 56
4.3.2 Definition of Passages . . . . . . . . . . . . . . . . . . . . 57
4.3.3 Using Hanning Windows to Determine Passage Importance 57
4.3.4 Using the Passage Score in Summarization . . . . . . . . . 60
4.4 Experimental Evaluation . . . . . . . . . . . . . . . . . . . . . . . 61
4.4.1 Compared Summarization Methods . . . . . . . . . . . . . 61
4.4.2 Experimental Settings . . . . . . . . . . . . . . . . . . . . 63
4.4.3 Measures for Evaluation . . . . . . . . . . . . . . . . . . . 65
4.4.4 Results . . . . . . . . . . . . . . . . . . . . . . . . . . . . . 66
4.5 Discussion . . . . . . . . . . . . . . . . . . . . . . . . . . . . . . . 67
4.5.1 Accuracy . . . . . . . . . . . . . . . . . . . . . . . . . . . 67
4.5.2 Distribution of Answer Strings . . . . . . . . . . . . . . . . 69
4.6 Related Work . . . . . . . . . . . . . . . . . . . . . . . . . . . . . 70
4.7 Summary . . . . . . . . . . . . . . . . . . . . . . . . . . . . . . . 71
CONTENTS
ix
5 Conclusion
5.1 Summary . . . . . . . . . . . . . . . . . . . . . . . . . . . . . . .
5.2 Future Direction . . . . . . . . . . . . . . . . . . . . . . . . . . .
73
73
75
Bibliography
79
List of Publications
87
List of Figures
1.1 A sample document (MAINICHI NEWS) used for TSC. . . . . . .
1.2 An example of extract from TSC’s data. . . . . . . . . . . . . . .
1.3 An example of abstract from TSC’s data. . . . . . . . . . . . . . .
2.1
2.2
2.3
2.4
2.5
Support Vector Machines. . . . . . . . .
Definition of keywords density. . . . . . .
Example of a dependency structure tree.
Distribution of feature’s weight. . . . . .
Quality Questions . . . . . . . . . . . . .
.
.
.
.
.
.
.
.
.
.
.
.
.
.
.
.
.
.
.
.
9
13
15
26
31
3.1 Reranking algorithm by MMR . . . . . . . . . . . . . . . . . . . .
3.2 The effect of MMR. . . . . . . . . . . . . . . . . . . . . . . . . . .
3.3 Examples of redundant phrases. . . . . . . . . . . . . . . . . . . .
50
51
52
4.1
4.2
4.3
4.4
4.5
4.6
4.7
.
.
.
.
.
.
.
58
59
60
63
65
67
69
5.1 Evaluation results using Quality Questions. . . . . . . . . . . . . .
76
Examples of keywords density . . . . . . . . .
The Hanning window function . . . . . . . . .
An example of passages in a text . . . . . . .
Example of human resource mapping . . . . .
An examples of a question-answering task . .
F-measure of each method with ten questions
F-measure of each method with four questions
xi
.
.
.
.
.
.
.
.
.
.
.
.
.
.
.
.
.
.
.
.
.
.
.
.
.
.
.
.
.
.
.
.
.
.
.
.
.
.
.
.
.
.
.
.
.
.
.
.
.
.
.
.
.
.
.
.
.
.
.
.
.
.
.
.
.
.
.
.
.
.
.
.
.
.
.
.
.
.
.
.
.
.
.
.
.
.
.
.
.
.
.
.
.
.
.
.
.
.
.
.
.
.
.
.
.
.
.
.
.
.
.
.
.
3
4
4
.
.
.
.
.
.
.
List of Tables
2.1
2.2
2.3
2.4
2.5
2.6
2.7
2.8
2.9
2.10
2.11
2.12
Details of TSC’s data sets. . . . . . . . . . .
Details of Nomoto’s data sets. . . . . . . . .
Performance of each method (TSC data). . .
Precision of each genre (TSC data). . . . . .
Pseudo-utility of each genre (TSC data). . .
Precision (Nomoto’s data). . . . . . . . . . .
Precision for three genres (TSC data). . . .
Pseudo-utility for three genres (TSC data). .
The number of features with high weight. . .
Effective features and their pairs (positive) .
Effective features and their pairs (negative) .
Evaluation results at DUC-2002 . . . . . . .
.
.
.
.
.
.
.
.
.
.
.
.
18
18
21
22
22
23
24
24
25
27
28
32
An example of cross-tabulation list. . . . . . . . . . . . . . . . . .
Description of data set . . . . . . . . . . . . . . . . . . . . . . . .
Concordance between important sentences selected by editors . .
Interpretation of K . . . . . . . . . . . . . . . . . . . . . . . . . .
Performance of each methods . . . . . . . . . . . . . . . . . . . .
Proportion of sentences in A ∩ B . . . . . . . . . . . . . . . . . .
Proportion of sentences in B ∩ C . . . . . . . . . . . . . . . . . .
Proportion of sentences in C ∩ A . . . . . . . . . . . . . . . . . .
Proportion of sentences in A ∩ B ∩ C . . . . . . . . . . . . . . . .
Effective features and their pairs in multi-document summarization
(positive) . . . . . . . . . . . . . . . . . . . . . . . . . . . . . . .
3.11 Effective features and their pairs in multi-document summarization
(negative) . . . . . . . . . . . . . . . . . . . . . . . . . . . . . . .
38
41
42
42
43
44
44
45
45
3.1
3.2
3.3
3.4
3.5
3.6
3.7
3.8
3.9
3.10
xiii
.
.
.
.
.
.
.
.
.
.
.
.
.
.
.
.
.
.
.
.
.
.
.
.
.
.
.
.
.
.
.
.
.
.
.
.
.
.
.
.
.
.
.
.
.
.
.
.
.
.
.
.
.
.
.
.
.
.
.
.
.
.
.
.
.
.
.
.
.
.
.
.
.
.
.
.
.
.
.
.
.
.
.
.
.
.
.
.
.
.
.
.
.
.
.
.
.
.
.
.
.
.
.
.
.
.
.
.
.
.
.
.
.
.
.
.
.
.
.
.
.
.
.
.
.
.
.
.
.
.
.
.
46
47
LIST OF TABLES
xiv
3.12 SVM’s performance degradation after removing multi-document
features . . . . . . . . . . . . . . . . . . . . . . . . . . . . . . . .
49
4.1
4.2
4.3
4.4
64
66
68
68
Examples of questions and answers . .
Experimental results . . . . . . . . . .
Distribution of correct strings . . . . .
Experimental results for four questions
.
.
.
.
.
.
.
.
.
.
.
.
.
.
.
.
.
.
.
.
.
.
.
.
.
.
.
.
.
.
.
.
.
.
.
.
.
.
.
.
.
.
.
.
.
.
.
.
.
.
.
.
.
.
.
.
.
.
.
.
Chapter 1
Introduction
Due to the rapid growth of the Internet and the emergence of low-price and largecapacity storage devices, the number of online documents is exploding. We are
currently facing tsunami of online information. This situation makes it difficult
to find and gather the information we really need. Therefore, many researchers
have been studying technologies to overcome this difficulty. Examples of their
efforts include Automatic Summarization, Information Retrieval (IR), Information Extraction (IE), and Question-Answering (QA). In recent years, Automatic
Summarization has attracted the attention of a lot of researchers. This technology produces overviews that are easier and faster for humans to browse than the
original documents. Moreover, some workshops on this technique have been held
in the U.S.: TIPSTER Text Summarization Evaluation (SUMMAC)[Mani98b]
(1998) and Document Understanding Conference (DUC) (2001–), and in Japan:
Text Summarization Challenge (TSC)[Fukushima01] (2001–).
We can classify summaries into extracts and abstracts [Mani01]. An extract
is a summary consisting of material copied from the original document. An
abstract is a summary at least some some part of which is not present in the
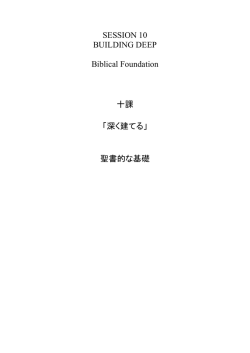
original document. Figure 1.1 shows a part of an article from the MAINICHI
NEWS used as a source document at TSC. Figure 1.2 shows an extract with nine
selected sentences, i.e., the summarization rate based on the number of sentences
is 30%, from TSC’s data. Figure 1.3 shows an abstract whose summarization rate
based on the number of characters is 20%. These summaries are semantically
1
2
CHAPTER 1
equal but their expressions are different.
In recent years, studies were started to realize an abstract by sentence generation or another such natural language processing technique rather than an
extract [Barzilay99]. However, to generate a summary like a human-made one is
quite difficult. Therefore, many researchers extract sentences and revise them by
deleting or inserting terms or phrases [Mani99, Nanba00]. These approaches are
reasonable and suitable. In this way, many automatic summarization techniques
are based on extraction methods. Therefore, it is important to achieve high performance in the extraction of important sentences. In this dissertation, we focus
on sentence extraction-based summarization methods.
Since the 1950s, many researchers have been studying single-document summarization by sentence extraction, e.g., [Luhn58, Edmundson69, Brandow95,
Zechner96, Nobata01]. Conventional methods focus on sentence features and
define significance scores. The features include keywords, sentence positions, certain linguistic clues, and so on. However, it is hard to find optimal parameter
values for these features when many features are available. Recently, summarization method using machine learning has been studied as a means to integrate
heterogeneous features effectively. Mani et al. [Mani98a] and Lin [Lin99] employed decision tree learning (C4.5)[Quinlan93], whereas Aone et al. [Aone98]
and Kupiec et al. [Kupiec95] employed the Bayesian classifiers. However, these
machine learning methods cannot handle heterogeneous features effectively when
the effective features are not known. In order to solve this difficulty, this dissertation employs Support Vector Machines [Vapnik95] that are robust even when
the number of features is large. The experimental results show that our method
achieves a higher performance than other methods. Moreover, to address the
question: “What are effective features?” we analyze the weights of features and
clarify them. The result shows that effective features differ with document genre.
Recently, multi-document summarization has became a major topic in automatic summarization[Mani01]. Therefore, TSC and DUC employ a multidocument summarization task. Multi-document summarization by sentence extraction is almost the same as single-document summarization, except that we
need to consider extra features for the former [Goldstein00]. Therefore, we face
the same problem as in single-document summarization: how to handle many rel-
3
◇教室開き、熱気球や雷作り
技術立国ニッポンが危ない――理科嫌いの子供の増加や大学の理工系志願者の伸び悩みな
ど「理工系離れ」が深刻になっている。こうした傾向にストップをかけようと、大学や教育
施設一体となった動きが出ている。大学側などは、この夏、子供向けに科学の面白さをPR
するプログラムを続々登場させた。文部省も十四日、理数系に強い高校生への支援策を開始
する一方、専門家の懇談会からの報告を受け、魅力ある理工系大学作りに乗り出した。
工学院大学(東京都新宿区)では、この夏初めて小、中学生、教師向けに「大学の先生と
楽しむ理科教室」と銘打った公開講座を開く。八王子キャンパスで、熱気球やロケットを飛
ばしたり、雷を起こす実験など五十二のテーマをもうけ、教授陣が指導に当たる。
同大の志願者数はここ数年減少に転じ、昨年度は対前年比で二二%(約二千七百人)減。
一昨年度も一七%の減少だった。
「出願者の減少はショック。子供は潜在的に実験が好きなは
ず。理工系離れに歯止めをかけるためには、理科の先生たちの研修も必要だ。公開講座は遅
きに失したが、今後も開催していきたい」(同大学)
東京農工大学(府中市)は、昨年六月から月一回の「子供科学教室」を開始。小学校四年
から中学二年生を対象にリニアモーターカーの原理を学んだり、紙飛行機や竹とんぼを作る
実験授業を行っている。また、北陸先端科学技術大学院大学(石川県)では昨年から年二回、
地元の中学一年生を招き、コンピューターを使った科学の一日体験授業を開催。授業終了後
には学長が、生徒一人ひとりに「未来博士」の賞状を手渡し、好評を得ている。
教育施設でも同様の動きが出ている。国立オリンピック記念青少年総合センター(東京都
渋谷区、佐藤次郎所長)は、前東大学長の有馬朗人・理化学研究所理事長の発案で、八月二
日から六日まで、
「夏休み中学生科学実験教室」を開く。都内で初の合宿形式だ。講師陣には
東大、東工大などの名誉教授や、高校の教師がずらり。八十人の定員に予想外の約二千人の
応募があった。有馬理事長は「理科離れというが、ほんとうに子供は理科ぎらいなのか自分
で確かめたかったので、企画した。理科離れを防ぐと同時に自然科学の面白さを子供たちに
教えたい」と話す。
こうした動きの背景にあるのが、若者の理工系離れ。大学の理工系学部への志願者は一九
八六年度には七十四万八千人で、志願者全体の二五・六%を占めていたが、バブル経済の進
展とともに比率が低下。九三年度は一九・五%にまで落ちた。一方、理工系から製造業以外
に就職する学生は増加。特に、金融保険業への就職者は八六年度の〇・九%から九〇年度は
二・八%まで上昇。メーカーなど製造業は危機感を募らせている。
今年二月、文部省が日本人初の宇宙飛行士、毛利衛さんら専門家をメンバーに、理工系大
学の魅力を向上させるため発足させた懇談会は、十四日、報告書をまとめた。それによると、
理工系のPR策として(1)研究者、教員などを「サイエンスボランティア」として登録、
教育施設に派遣する(2)
「こどもサイエンスフォーラム」を開催し、科学論文賞や科学写真
コンテストなどのイベントを創設する――などを提案。同省は初版三千部を印刷、大学や経
団連などに配布し、大学内からの改革を呼びかける。
Figure 1.1: A sample document (MAINICHI NEWS) used for TSC.
CHAPTER 1
4
技術立国ニッポンが危ない――理科嫌いの子供の増加や大学の理工系志願者の伸び悩みなど
「理工系離れ」が深刻になっている。こうした傾向にストップをかけようと、大学や教育施設
一体となった動きが出ている。文部省も十四日、理数系に強い高校生への支援策を開始する
一方、専門家の懇談会からの報告を受け、魅力ある理工系大学作りに乗り出した。工学院大
学(東京都新宿区)では、この夏初めて小、中学生、教師向けに「大学の先生と楽しむ理科
教室」と銘打った公開講座を開く。東京農工大学(府中市)は、昨年六月から月一回の「子
供科学教室」を開始。国立オリンピック記念青少年総合センター(東京都渋谷区、佐藤次郎
所長)は、前東大学長の有馬朗人・理化学研究所理事長の発案で、八月二日から六日まで、
「夏休み中学生科学実験教室」を開く。こうした動きの背景にあるのが、若者の理工系離れ。
大学の理工系学部への志願者は一九八六年度には七十四万八千人で、志願者全体の二五・六
%を占めていたが、バブル経済の進展とともに比率が低下。メーカーなど製造業は危機感を
募らせている。
Figure 1.2: An example of extract from TSC’s data.
理科嫌いの子供の増加や大学の理工系志願者の伸び悩みなど「理工系離れ」が深刻になって
いる。こうした傾向にストップをかけようと、理工系の大学では、この夏、子供向けに科学
の面白さをPRするプログラムを続々登場させた。文部省も、専門家の懇談会からの報告を
受け、魅力ある理工系大学作りに乗り出した。背景には若者の理工系離れがある。大学の理
工系学部への志願者はバブル経済の進展とともに比率が低下、八六年度は二五・六%であっ
たが、九三年度は一九・五%にまで落ちた。また、理工系から製造業以外に就職する学生は
増加傾向にあり、製造業は危機感を募らせている。
Figure 1.3: An example of abstract from TSC’s data.
5
evant features. Accordingly, we employ Support Vector Machines, which achieve
high performance in single-document summarization, for multi-document summarization. In addition, we propose the method of selecting significant words
from a document set based on the Minimum Description Length (MDL) principle as a feature specific to multi-document summarization. Our experiment
results show that our method has the highest performance compared with other
methods. Furthermore, we investigate the effectiveness of reducing redundancy
because it is said that reducing redundant sentences from a multi-document summary is effective [Carbonell98, Goldstein00]. However, we found that reducing
redundant sentences by Maximum Marginal Relevance (MMR) [Carbonell98] is
not good for a multi-document summary from a single-source document set.
Information Retrieval (IR) systems, such as Internet search engines also use
summaries. A summary helps us to judge the relevance of a document. Many researchers have studied summarization methods for relevance judgments in such a
situation [Tombros98, Mochizuki00, Hand97]. Such a summary is called a “Query
Relevant Text Summary (QRTS). ” In recent years, Question-Answering has become a major topic in IR and IE. The Text REtrieval Conference (TREC) 1
has employed the QA task since 1998 [Voorhees00]. Question-Answering systems
involve the extraction of the answer to a question from a large-scale document
corpus. However, their outputs (answers), are not always correct. Therefore,
we need a method to select correct answers from the outputs. To overcome this
problem, we propose a method of summarization which can judge answer correctness. We call this method “Question-Biased Text Summarization (QBTS).” This
method focuses not only on the questions but also on prospective answers to the
question. We show that our method is useful for Question-Answering systems.
The first two summarization methods presented in this dissertation are classified as generic summarization because summaries were made without any biases.
The last summarization method is classified as user-focused summarization because summaries are based on a user’s interest expressed by the question.
We employ two kinds of evaluation procedure. The first is an intrinsic evaluation for single-document and multi-document generic summarization. This
1
http://trec.nist.gov
6
CHAPTER 1
evaluation method is a direct evaluation method because human subjects read
the summaries and compare them with ideal summaries or compute precision,
recall, and F-measure by comparing machine-made summaries with human-made
summaries. This dissertation evaluates machine-made summaries by precision
because we are following the TSC’s evaluation measure.
The second is an extrinsic evaluation for user-focused summarization. This
method is an indirect evaluation method that assesses the accuracy of a method
from its overall accuracy when applied to a certain task, such as relevance judgment in an IR task and answer correctness judgment in a QA task. We employ
QA tasks for extrinsic evaluation because we want to know how useful our summaries are for QA systems.
Chapter 2
Applying Support Vector
Machines to Single-Document
Summarization
2.1
Introduction
Sentence extraction based summary means extracting only sentences that bear
important information from a document. Since some sentences are lost, it may
lack coherence. However, extraction of important sentences is one of the basic
technologies to realize a summary that is useful for humans to browse. Therefore, this technique plays an important role in automatic text summarization
technology.
Many researchers have been studying important sentence extraction since late
1950s [Luhn58]. Conventional methods focus on features in a sentence and define
significance scores. The features include keywords, sentence position, and other
linguistic clues. Edmundson [Edmundson69] and Nobata et al. [Nobata01] propose scoring functions to integrate heterogeneous features. However, we cannot
tune the parameter values by hand when the number of features is large.
When a large quantity of training data is available, machine learning is effective for the tuning. In recent years, machine learning has attracted attention in
7
CHAPTER 2
8
the field of automatic text summarization. Aone et al. [Aone98] and Kupiec et al.
[Kupiec95] employ Bayesian classifiers, whereas Mani et al. [Mani98a], Nomoto
et al. [Nomoto97], Lin [Lin99], and Okumura et al. [Okumura99a] use decision
tree learning. However, most machine learning methods overfit the training data
when many features are given. Therefore, we need to select features carefully.
Support Vector Machines (SVMs) [Vapnik95] are robust even when the number of features is large. Therefore, SVMs have shown good performance in text
categorization [Joachims98], chunking [Kudo01], and dependency structure analysis [Kudo00].
In this chapter, we present an important sentence extraction technique based
on SVMs. We conducted experiments by using the Text Summarization Challenge
(TSC) [Fukushima01] corpus and Nomoto’s corpus [Nomoto97].
We compared four methods (SVM-based method with the linear kernel and
the polynomial kernel, decision tree learning method and Lead-based method) at
three summarization rates (10%, 30%, and 50%) in TSC corpus, at 15% summarization rates in Nomoto’s corpus. In the result of TSC corpus, It was found that
effective features depend on document genre.
The remainder of this chapter is organized as follows. Section 2.2 describes
our single-document summarization method based on Support Vector Machines.
In Section 2.3, we present the experimental results. Section 2.4 shows the genre
dependency of summarization and effective features for each genre. In Section
2.5, we show the evaluation results at Document Understanding Conference 2002.
2.2
Using Support Vector Machines for Important Sentence Extraction
2.2.1
Support Vector Machines (SVMs)
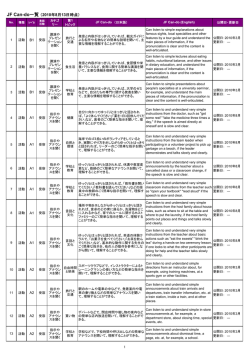
SVM is a supervised learning algorithm for two-class problems. Figure 2.1 shows
the conceptual structure of SVM.
2.2 USING SUPPORT VECTOR MACHINES FOR IMPORTANT SENTENCE
EXTRACTION
9
xm
margin
wx + b = 1
Positive
Support Vector
wx + b = 0
Negative
wx + b = -1
Figure 2.1: Support Vector Machines.
Training data is given by
(x1 , y1), · · · , (xu , yu ),
xj ∈ Rn , yj ∈ {+1, −1}.
Here, xj is a feature vector of the j-th sample; yj is its class label, positive (+1)
or negative (−1). SVM separates positive and negative examples by a hyperplane
given by
w · x + b = 0, w ∈ Rn , b ∈ R,
(2.1)
In general, such a hyperplane is not unique. The SVM determines the optimal hyperplane by maximizing the margin. The margin is the distance between
two hyperplane that separate negative examples and positive examples; i.e., the
distance between w · x + b = 1 and w · x + b = −1. The SVM tries to find the
hyperplane that maximize the margin. The examples on w · x+b = ±1 are called
the Support Vectors and represent the positive or negative examples.
The hyperplane must satisfy the following constraints:
yi (w · xj + b) − 1 ≥ 0.
CHAPTER 2
10
The size of the margin is 2/||w||. In order to maximize the margin, we assume
the following objective function:
1
J (w) = ||w||2
w,b
2
s.t. yj (w · xj + b) − 1 ≥ 0.
(2.2)
Minimize
By solving a quadratic programming problem, the decision function f(x) =
sgn(g(x)) is derived, where
g(x) =
u
λi yi xi · x + b.
(2.3)
i=1
Since training data is not necessarily linearly separable, slack variables (ξj )
are introduced for all xj . These ξj give a misclassification error and should satisfy
the following inequalities:
yi (w · xj + b) − (1 − ξj ) ≥ 0.
Hence, we assume the following objective function to maximize the margin:
1
J (w, ξ) = ||w||2 + C
ξj
2
j=1
u
Minimize
w,b,ξ
(2.4)
s.t. yj (w · xj + b) − (1 − ξj ) ≥ 0.
Here, ||w||/2 indicates the size of the margin, uj=1 ξj indicates the penalty
for misclassification, and C is the cost parameter that determines the trade-off for
these two arguments. By solving a quadratic programming problem, the decision
function f(x) = sgn(g(x)) is derived in the same way as in linear separation
(equation (2.3)).
The decision function depends only on support vectors (xi where λi = 0).
Training examples, except for support vectors, (xi where λi = 0), have no influence on the decision function.
2.2 USING SUPPORT VECTOR MACHINES FOR IMPORTANT SENTENCE
EXTRACTION
11
SVMs can handle non-linear decision surfaces by simply substituting every
occurrence of the inner product in equation (2.3) with kernel function K(xi · x).
In this case, the decision function can be rewritten as follows:
g(x) =
u
λi yi K(xi , x) + b.
(2.5)
i=1
Note that the kernel function must satisfy the Mercer’s condition [Vapnik95,
Cristianini00].
In this paper, we use polynomial kernel functions, which are found to be very
effective in the study of other tasks in natural language processing [Joachims98,
Kudo01, Kudo00]:
K(x, y) = (x · y + 1)d .
2.2.2
(2.6)
Sentence Ranking by using Support Vector Machines
Important sentence extraction can be regarded as a two-class problem. However,
the proportion of important sentences in training data will be different from that
in test data. The number of important sentences in a document is determined
by a summarization rate which is given at run-time. A simple solution to this
problem is to rank sentences in a document, then select top N sentences. We use
g(x) as the normalized distance from the hyperplane to x to rank the sentences.
The theoretical justification of using g(x) for ranking is described in [Kazawa02].
2.2.3
Features for Single-Document Summarization
We define the boolean features discussed below in relation to a sentence Si . We
took past studies into account and added a new feature that represents the
TF·IDF value considering dependency structure and presence of Named Entities in a sentence. We use 546 boolean variables for each Si , where x =
(x[1], · · · , x[546]). A real-valued feature normalized between 0 and 1 is represented by 10 boolean variables. Each variable corresponds to an internal
[j/10,(j + 1)/10), where j = 0 to 9. For example, F (Si ) = 0.75 is represented by
“0000000100” because 0.75 belongs to [7/10,8/10).
CHAPTER 2
12
Position of sentences
We define two feature functions for the position of Si . First, Posd(Si )(1 ≤ r ≤ 10)
is Si ’s position in a document where r indicates elements number of example xi .
Second, Posp(Si )(11 ≤ r ≤ 20) is Si ’s position in a paragraph. The first sentence
obtains the highest score, the last obtains the lowest score:
BD(Si )
,
|D|
BP (Si )
.
Posp(Si ) = 1 −
|P |
Posd(Si ) = 1 −
Here, |D| is the number of characters in the document D that contains Si ;
BD(Si ) is the number of characters before Si in D(Si ); |P | is the number of
characters in the paragraph P that contains Si , and BP (Si ) is the number of
characters before Si in the paragraph.
Length of sentences
We define a feature function concerning the length of sentence as
Len(Si ) = |Si |.
Here, L(Si )(21 ≤ r ≤ 30) and |Si | is the number of characters of sentence Si .
TF·IDF
We define the feature function TI(Si )(31 ≤ r ≤ 40) that weights sentences based
on TF·IDF term weighting as
TI(Si ) =
tf (t, Si ) · w(t, D).
t∈Si
Here, TI(Si ) is the summation of weight w(t, D) of terms that appear in Si .
tf (t, Si ) is the term frequency of t in Si .
2.2 USING SUPPORT VECTOR MACHINES FOR IMPORTANT SENTENCE
EXTRACTION
Term
KW1
Term
Term
KW2
dist2
Term
13
KW3
dist3
Figure 2.2: Definition of keywords density.
In addition, we define the term weight w(t, D) based on TF·IDF:
tf (t, D)
w(t, D) = 0.5 1 +
tfmax (D)
|DB|
· log
df(t)
.
Here, tf (t, D) is the term frequency of t in D, tfmax(D) is the maximum term
frequency in D and df(t) is the frequency of documents that contains term t.
|DB| is the number of documents in the database.
We use the term t that was judged to be a noun or an unknown word by
the morphological analyzer ChaSen[Matsumoto00]. Here, we used MAINICHI
newspaper articles published in 1994, 1995 and 1998.
Density of keywords
We define the feature function Den(Si )(41 ≤ r ≤ 50), which represents density
of keywords in a sentence, following[Kwok01]:
Den(Si ) =
t∈KW (Si )
w(t, D)
d(Si )
.
d(Si ) is defined as follows:
d(si ) =
|KW (Si )|
k=2
(distk )2
|KW (Si )| − 1
.
Here, KW (Si ) is the set of keywords in the sentence Si . |KW (Si)| is the
number of keywords in the sentence Si . distk is the distance between k-th keyword
and (k − 1)-th keyword in Si .
CHAPTER 2
14
Because d(Si ) represents the mean of square distance, density is high if its
value is small. Figure 2.2 shows an example in which |KW (Si )| is 3, dist2 = 2
and dist3 = 1.
The keyword is the term t that satisfies the following:
µ + 0.5σ ≤ w(t, D).
Note that µ is the mean and σ is the standard deviation of all w(t, D) in D.
Similarity between Headline and Sentence
We define feature function Sim(Si )(51 ≤ r ≤ 60), which is similarity between
headlines of documents that contain Si , as follows:
Sim(Si ) =
v (Si ) · v(H)
.
v (Si ) v(H)
Here, v(H) is a boolean vector in the Vector Space Model (VSM), the elements
of which represent terms in the headline. v (Si ) is also a boolean vector, the
elements of which represent terms in the sentence.
TF·IDF considering dependency structure
We define feature functions TIdep (Si )(61 ≤ r ≤ 70) and TIwid (Si )(71 ≤ r ≤ 80)
considering the dependency structure of the sentence:
TIdep =
w(t, Si )
t∈td
TIwid =
w(t, Si ).
t∈tw
Here, td is the set of terms in all bunsetsu that modify the last bunsetsu in
the deepest path in the dependency tree. tw is the set of terms in all bunsetsu
that directly modify the last bunsetsu. For example, in Figure 2.3, bunsetsu2,
2.2 USING SUPPORT VECTOR MACHINES FOR IMPORTANT SENTENCE
EXTRACTION
15
Bunsetsu1
Bunsetsu2
Bunsetsu3
Bunsetsu4
Bunsetsu5
Bunsetsu6
Figure 2.3: Example of a dependency structure tree.
bunsetsu3, bunsetsu4, and bunsetsu6 form the deepest path in the dependency
tree. bunsetsu4 and bunsetsu5 directly modify the last bunsetsu. We use
Cabocha1 for dependency structure analysis.
Named Entities
x[r] = 1(81 ≤ r ≤ 88) indicates that a certain Name Entity class appears in Si .
The number of Named Entity classes is eight [Sekine00] as follows:
PERSON, LOCATION, ORGANIZATION, ARTIFACT, DATE, MONEY,
PERCENT, TIME.
We use Isozaki’s NE recognizer [Isozaki01].
Conjunctions
x[r] = 1(89 ≤ r ≤ 138) if and only if a certain conjunction is used in the sentence.
The number of conjunctions is 50.
1
http://cl.aist-nara.ac.jp/˜taku-ku/software/cabocha
CHAPTER 2
16
Functional words
x[r] = 1(139 ≤ r ≤ 151) indicates that a certain functional word appears in Si .
The number of functional words is 13 as follows:
から (kara), が (ga), で (de), と (to), に (ni), にて (nite), の (no), へ
(he), より (yori), を (wo), ん (nn), は (ha), も (mo).
Modality
x[r] = 1(152 ≤ r ≤ 155) indicates which major category of modality Si belongs
to, whereas x[r] = 1(156 ≤ r ≤ 176) indicates which minor category of modality
Si belongs to.
Major and minor category definition [Fukumoto91, Tamura98]:
Major Category: Opinion
Minor Category: Opinion, Confirm, Request
Major Category: Assertive
Minor Category: Assertive, Inference, Reason, Judgment, Obligation
Major Category: Predicative
Minor Category: Predicative,Potential, Rumor, Manner, Existence,
Continuation, Stative, Causative, Present, Past
Major Category: Other
Minor Category: Other, Symbol, Signature
We use Fukumoto’s rules [Fukumoto91] and Tamura’s rules [Tamura98] to
determine Si ’s modality.
Rhetorical relation
x[r] = 1(177 ≤ r ≤ 180) indicates that Si has a certain rhetorical relation
with its predecessor Si−1 . The rhetorical relations are: Connection, Conversion,
Conclusion, and Evidence. We use Tamura’s rules [Tamura98].
2.3
EXPERIMENTAL EVALUATION
17
Verb classes
x[r] = 1(181 ≤ r ≤ 546) indicates that Si has a verb which belongs to certain
class. A verb is classified into one of 36 basic classes by Goi-taikei[Ikehara97].
However, some verbs belong to multiple basic classes. We classified verbs into
366 classes taking multiple meanings into account.
2.3
2.3.1
Experimental Evaluation
Corpus
We used the data set of the TSC [Fukushima01] summarization collection and
Nomoto’s data set [Nomoto97] for our evaluation.
TSC was held as a subtask of NII-NACSIS Test Collection for IR Systems
(NTCIR-2). The corpus consists of 180 Japanese documents2 from the MAINICHI
Newspapers of 1994, 1995, and 1998. In each document, important sentences were
manually tagged at summarization rates of 10%, 30%, and 50%. Table 2.1 shows
the statistics3 .
Nomoto’s data consists of 75 Japanese documents from NIKKEI Newspaper
of 1994. For each document there is information on the number of assessors who
judged whether each sentence in the document is important or not and on the
number of assessment agreements for each sentence. We employ the sentences
that have agreement rate with more than half of assessors. As a result the summarization rate is found to be 15%. Table 2.2 shows the statistics.
Note that the summarization rates are calculate by the number of sentences
in a document instead of the number of characters.
2
Each document is represented in SGML style with sentence and paragraph separators attached.
3
“National” indicates domestic news article.
CHAPTER 2
18
Genre
Table 2.1: Details of TSC’s data sets.
General National Editorial Commentary Total
# of documents
# of sentences
# of important
sentences (10%)
# of important
sentences (30%)
# of important
sentences (50%)
16
76
41
47
180
342
1721
1362
1096
4521
34
172
143
112
461
103
523
414
330
1370
174
899
693
555
2321
Table 2.2: Details of Nomoto’s data sets.
Genre
General Editorial Column Total
# of documents
25
25
25
75
440
558
426 1424
# of sentences
62
82
60
204
# of important sentences (15%)
2.3.2
Measures for Evaluation
In the TSC corpus, the number of sentences to be extracted is explicitly given
by the TSC committee. When we extract sentences according to that number,
Precision, Recall, and F-measure become the same value. We call this value
Precision, which is defined as follows:
Precision = b/a × 100,
where a is the specified number of important sentences and b is the number
of true important sentences that are in the system’s output. In addition, we use
Nomoto’s data in the same way as the TSC’s data, i.e., the number of sentences
that systems should extract is known.
2.3
EXPERIMENTAL EVALUATION
19
Moreover, we use Pseudo-utility for our evaluation on TSC data. This evaluation measure is more detailed than Precision. TSC data has three summarization
rates, 10%, 30%, and 50%. Here, we classified sentences in a document into four
ranked classes; the most important rank is (1) and the least important rank is
(4):
(1) sentences that are contained in the 10% summarization rate,
(2) sentences that are not contained in the 10% but are contained in the 30%,
(3) sentences that are not contained in the 30% but are contained in the 50%,
(4) others.
Note that in order to use this measure, an extract must satisfy the following
condition: an extract in the 10% must be contained in the 30% and an extract
in the 30% must be contained in the 50%.
Weights of sentences according to the rank are: sentences belonging to rank
(1) is assigned 1/10, sentences belonging to rank (2) is 1/30, sentences belonging
to rank (3) is 1/50, and sentence rank (4) is 0. Therefore, Pseudo-utility is defined
as follows.
pseudo-utility(10) =
pseudo-utility(30) =
pseudo-utility(50) =
sys1
10
+
sys2
30
rnk1
10
sys2
30
+
sys3
50
× 100
sys1
3
+
+ sys
10
50
× 100
rnk1
2
+ rnk
10
30
sys1
2
3
+ sys
+ sys
10
30
50
× 100
rnk1
rnk2
rnk3
+
+
10
30
50
(2.7)
Here, sysi is the number of sentences extracted by a system as rank(i), rnki
is the number of sentences extracted by a human as rank(i).
For example, suppose that a sentence Sa is ranked (1), Sb and Sc , are ranked
(2), Sd and Se ranked (4). When a system outputs Sb as an important sentence
×
at 10% summarization rate, Precision is 0/1 and Pseudo-utility = 0/10+1/30+0/50
1/10
100 = 33.3.
CHAPTER 2
20
2.3.3
Compared Summarization Methods
We compared three methods: decision tree learning, lead, and SVM. At each
summarization rate, we trained classifiers and classified test documents.
Decision tree learning method
The first machine learning based summarization method employed decision tree
learning [Nomoto97, Mani98a]. Therefore, we compared decision tree learning
with our method. We used C4.5 [Quinlan93] with the default settings for our
experiments. We used the all features described in section 2.2.3. Sentences were
ranked according to their certainty factors given by C4.5. We refer to this method
as C4.5.
Lead-based method
The first N sentences of a document were selected. N was determined by the
summarization rates. We refer to this method as Lead.
SVM-based method
This is our method as outlined in section 2.2. We used the second-order polynomial kernel and linear kernel, and set C (in equation (2.4)) as 0.001. We used
TinySVM4. We refer to these methods as SVM(Lin) and SVM(Poly), respectively.
2.3.4
Results
Results (TSC data)
Table 2.3 shows the Precision and Pseudo-utility of TSC data by five-fold cross
validation with 180 documents. Note that we neglected 41 documents that did not
satisfy constraints for using Pseudo-utility. The mark ‘∗’ indicates that SVM(Lin)
or SVM(Poly) performed better than Lead with 5% statistical significance and
‘∗∗’ indicates with 1% statistical significance.
4
http://cl.aist-nara.ac.jp/˜taku-ku/software/TinySVM/
2.3
EXPERIMENTAL EVALUATION
21
Table 2.3: Performance of each method (TSC data).
Summarization
rate
Methods
Precision
pseudo-utility
10%
Lead
C4.5
SVM(Lin)
SVM(Poly)
37.4
38.3
39.9
46.2∗∗
43.6
50.1
51.9∗
57.4∗∗
30%
Lead
C4.5
SVM(Lin)
SVM(Poly)
44.2
40.3
46.9
48.3∗
59.0
53.9
62.0
63.9∗
50%
Lead
C4.5
SVM(Lin)
SVM(Poly)
56.1
57.6
62.1∗∗
62.8∗∗
64.2
62.2
68.0
70.5∗∗
For all summarization rates, SVM(Poly) achieved the highest performance.
SVM(Poly) performed better than SVM(Lin) because SVM(Poly) can handle the
occurrence of two features. The reason for the lower performance of C4.5 is that
C4.5 cannot handle large feature set, i.e., it makes overfittings.
Note that when some features are reduced, removing binary conversion or verb
classes, the precision of the C4.5 is higher than the Lead in the most cases. The
precision is 40.6, 45.9, 55.6 at 10%, 30%, 50% summarization rate, respectively.
However, the performance is lower than that of the SVMs.
Let us now look at pseudo-utility. At 10% summarization rate, the Pseudoutility of SVM and C4.5 exceed Precision greatly. However, Lead has little differences between Precision and Pseudo-utility. This is because Lead cannot handle
the distribution of important sentences in a document.
Table 2.4 shows Precision of each genre and Table 2.5 shows Pseudo-utility
of each genre. In the General and National genres, the difference between Lead
and SVM (both Lin and Poly) is small. However, in editorial and commentary,
SVM(Poly) performed better than Lead with statistical significance. Because
CHAPTER 2
22
Table 2.4: Precision of each genre (TSC data).
General
National
Editorial
Commentary
10%
47.9
51.8
34.1
22.9
SVM (Lin)
30%
50%
54.5 61.2
53.9
64.3
∗
43.0
57.8∗∗
36.5
62.6∗∗
SVM (Poly)
10%
30%
50%
53.1
53.7
65.4
61.6∗ 54.3
63.6
36.4
43.2∗ 58.3∗∗
27.4∗ 41.0∗ 64.5∗∗
10%
47.9
51.8
31.6
15.9
Lead
30%
50.5
54.3
37.6
32.4
50%
60.4
61.5
51.0
50.4
Table 2.5: Pseudo-utility of each genre (TSC data).
General
National
Editorial
Commentary
SVM (Lin)
10%
30%
50%
59.0
68.9
70.4
64.3
70.1
70.9
∗∗
41.2
54.3
63.0∗∗
∗∗
34.6
49.9
65.1∗
SVM (Poly)
10%
30%
50%
65.6
69.5
76.2
71.1∗
70.9
72.0
∗
∗
43.3
53.3
67.4∗∗
∗∗
∗
38.8
56.4
68.1∗∗
10%
59.4
58.9
34.6
16.6
Lead
30%
69.9
70.8
43.1
45.3
50%
71.1
72.4
52.1
55.7
General and National have typical newspaper style, lead sentences are important
and consequently Lead achieved high performance. However, in Editorial and
Commentary, Lead’s performance was not good because structures of editorial
and commentary documents are different from those of General and National. In
editorial and commentary, important sentences are not always lead sentences.
Results (Nomoto’s data)
Table 2.6 shows the Precision of Nomoto’s data by five-fold cross validation with
75 documents. SVM(Poly) achieved the highest performance which is the same
as the result for TSC data. Let us look more closely at each genre. In General,
SVM(Poly) has the highest performance but the differences of performance with
Lead are small. In Editorial, SVM(Poly) has the highest performance and the
differences with Lead are large. In Column, all methods had a low performance
because documents belongs to this kind of genre do not have clearly important
sentences. The number of sentences in column that had high agreement by human
subjects is small.
2.4
DISCUSSION
23
Table 2.6: Precision (Nomoto’s data).
SVM (Lin)
Average 37.8
General 54.3
Editorial 32.7
Column 26.3
SVM (Poly)
40.5
59.3
37.0
25.3
Lead
37.3
56.3
29.4
26.1
C4.5
33.8
47.2
33.6
25.4
Although the SVM’s performance was best, the differences were not statistically significant. This is because Nomoto’s data set is small and the variance of
each method is large.
2.4
Discussion
Table 2.4 and Table 2.5 in the previous section show that the performance of each
method is different according to the genre of document. Especially, it is more
difficult to achieve high performance in Editorial and Commentary than in the
other genres.
We considered that the poor scores of Editorial and Commentary mean effective features are different according to the genre of document. Therefore, we
conducted the following experiment by using SVM to clarify genre dependency 5 :
1. Extract 36 documents at random from genre i for training.
2. Extract 4 documents at random from genre j for test.
3. Repeat 1 and 2 ten times for all combinations of (i, j).
Note that we used TSC data because it is the lager data set and has three
summarization rates.
Table 2.7 and Table 2.8 show the results of Precision and Pseudo-utility, respectively. When the genre of test data is different from that of training data,
5
We did not use general genre because the number of documents in this genre was too small
for this kind of experiments.
CHAPTER 2
24
Table 2.7: Precision for three genres (TSC data).
Learning \ Test
National
Editorial
Commentary
National
10% 30% 50%
Editorial
10% 30% 50%
Commentary
10% 30% 50%
60.3
51.2
37.1
34.8
37.5
22.0
28.2
22.1
30.3
57.2
48.9
44.9
65.6
59.4
62.3
38.9
51.6
40.5
54.6
63.4
57.3
37.2
39.5
44.6
62.2
61.1
64.9
Table 2.8: Pseudo-utility for three genres (TSC data).
Learning \ Test
National
Editorial
Commentary
National
10% 30% 50%
Editorial
10% 30% 50%
Commentary
10% 30% 50%
70.2
61.4
48.1
38.0
45.9
30.1
36.9
31.3
42.4
72.6
64.3
58.2
73.4
67.5
66.0
46.1
63.5
48.5
57.4
71.5
60.6
51.6
48.4
56.3
65.1
64.5
65.7
performance is not very good. However, when the genre of test data and training
data is the same, even if there are few data, we can get the highest performance.
This result implies that effective features are different by genre.
Now, we examine effective features in each genre. Since we used the secondorder polynomial kernel in the SVM-based method, we can expand g(x) (x =
(x[1], · · · , x[n])) as follows:
g(x) = b +
u
u
wi + 2
i=1
wi
i=1
n n
u
i=1
wi
n
xi[k]x[k] +
k=1
xi [h]xi[k]x[h]x[k],
h=1 k=1
where u is the number of support vectors and wi equals λi yi .
We can rewrite it as follows when all vectors are boolean:
g(x) = W0 +
n
k=1
W1 [k]x[k] +
(2.8)
2.4
DISCUSSION
25
Table 2.9: The number of features with high weight.
Summarization rate
Genre
10% 30% 50%
National
14
9
21
63
33
4
Editorial
Commentary 103 121 7
n−1 n
W2[k, h]x[h]x[k],
(2.9)
h=1 k=h+1
where
W0 = b +
u
wi ,
i=1
W1 [k] = 3
W2 [h, k] = 2
u
i=1
u
wi xi [k],
wi xi [h]xi[k].
(2.10)
i=1
Therefore, W1 [k] indicates the significance of an individual feature (k) and
W2 [h, k] indicates the significance of a feature pair (k ∧ h). When |W1[k]| or
|W2 [h, k]| is large, the feature or the feature pair has a big influence on the
optimal hyperplane.
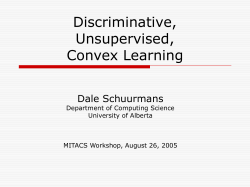
Figure 2.4 shows the distribution of W1 [k] and W2[h, k]. Note that all weight
was normalized by dividing its positive highest value. Also, Table 2.9 shows the
number of features that have weight of more than 0.5. In National, there are
a small number of features that have non-zero value. However, in Editorial and
Commentary, there are many features that have non-zero value. This result shows
Editorial and Commentary need more features than National.
Now, we show effective features for positive top-10 and negative top-10 in
Table 2.10 and Table 2.11, respectively. Effective features (positive) common to
three genres at three rates are sentence positions and effective features (negative)
CHAPTER 2
26
National
1
Summarization rate = 10%
Summarization rate = 30%
Summarization rate = 50%
0.8
Normalized weight
0.6
0.4
0.2
0
-0.2
-0.4
-0.6
-0.8
-1
0
2000
4000
6000
8000 10000 12000 14000
Feature
Editorial
1
Normalized weight
Summarization rate = 10%
Summarization rate = 30%
Summarization rate = 50%
0.5
0
-0.5
-1
0
2000
4000
6000 8000 10000 12000 14000
Feature
Commentary
1
Summarization rate = 10%
Summarization rate = 30%
Summarization rate = 50%
0.8
Normalized weight
0.6
0.4
0.2
0
-0.2
-0.4
-0.6
-0.8
-1
0
2000
4000
6000
Feature
8000
10000
12000
Figure 2.4: Distribution of feature’s weight.
2.4
DISCUSSION
27
Table 2.10: Effective features and their pairs (positive)
Summarization rate 10%
0.9≤Posd≤
0.9≤Posd≤
0.9≤Posd≤
0.9≤Posd≤
0.9≤Posd≤
0.9≤Posd≤
0.9≤Posd≤
0.9≤Posd≤
0.9≤Posd≤
0.9≤Posp≤
National
1.0 ∧ ga (が)
1.0 ∧ NE:DAT
1.0 ∧ NE:ORG
1.0
1.0 ∧ 0.9≤Posp≤ 1.0
1.0 ∧ 0.9≤Sim≤ 1.0
1.0 ∧ Predic (Major)
1.0 ∧ Past (Minor)
1.0 ∧ ni (に)
1.0 ∧ 0.9≤Sim≤ 1.0
Editorial
0.9≤Posd≤ 1.0 ∧ ga (が)
0.9≤Posd≤ 1.0
0.9≤Sim≤ 1.0 ∧ wo (を)
de (で) ∧ NE:ORG
0.9≤Sim≤ 1.0 ∧ ga (が)
0.9≤Posp≤ 1.0 ∧ ga (が)
0.9≤Posp≤ 1.0 ∧ 0.9≤Sim≤1.0
0.9≤Posd≤ 1.0 ∧ NE:ORG
0.9≤Sim≤ 1.0
0.9≤TIwid ≤ 1.0 ∧ Opinion (Major)
Commentary
0.8≤Posd< 0.9 ∧ 0.6≤TIdep <0.7
NE:ART
0.2≤Den<0.3 ∧ Predic (Major)
0.8≤Posd< 0.9 ∧ wa (は)
0.9≤Posd≤ 1.0 ∧ ni (に)
0.9≤Posd≤ 1.0 ∧ Present (Minor)
0.9≤Posd≤ 1.0 ∧ NE:DAT
0.0≤Posd< 0.1 ∧ ga (が)
0.7≤Len< 0.8 ∧ 0.1≤TIwid <0.2
0.6≤Len< 0.7 ∧ 0.8≤TIdep <0.9
Summarization rate 30%
National
0.9≤Posd≤ 1.0
0.9≤Posd≤ 1.0 ∧ ga (が)
0.9≤Posd≤ 1.0 ∧ Predic (Major)
0.9≤Sim≤ 1.0
0.9≤Posd≤ 1.0 ∧ 0.9≤Sim≤ 1.0
0.9≤Posd≤ 1.0 ∧ NE:DAT
0.9≤Posd≤ 1.0 ∧ NE:ORG
0.9≤Posd≤ 1.0 ∧ wo (を)
0.9≤Posd≤ 1.0 ∧ NE:LOC
0.9≤Posd≤ 1.0 ∧ wa (は)
0.9≤Posp≤
0.9≤Posd≤
0.9≤Posd≤
0.9≤Posp≤
0.9≤Posd≤
0.0≤Posd<
0.9≤Posp≤
0.9≤Posd≤
0.9≤Posd≤
0.9≤Posp≤
Editorial
1.0 ∧ ga (が)
1.0
1.0 ∧ NE:ORG
1.0 ∧ NE:ORG
1.0 ∧ ni (に)
0.1 ∧ wo (を)
1.0 ∧ 0.9≤Sim≤1.0
1.0 ∧ ga (が)
1.0 ∧ 0.9≤Posp≤1.0
1.0
Commentary
0.9≤Posp≤ 1.0 ∧ wa (は)
0.0≤TIwid <0.1 ∧ wa (は)
NE:ART
kara (から) ∧ ni (に)
0.4≤TIdep < 0.5 ∧ 0.4≤Sim<0.5
Verb : 5
0.2≤Posd< 0.3 ∧ 0.9≤Posp≤1.0
wo (を) ∧ NE:ART
0.9≤Posp≤ 1.0 ∧ 0.9≤TI≤1.0
0.9≤Sim≤ 1.0 ∧ ni (に)
Summarization rate 50%
National
ga (が)
0.8≤Posd< 0.9
wo (を)
0.9≤Sim≤ 1.0
wo (を) ∧ wa (は)
0.9≤Posd≤ 1.0
0.9≤Posp≤ 1.0 ∧ wo (を)
0.2≤TIdep < 0.3 ∧ wo (を)
ni (に)
mo (も)
Editorial
0.0≤Posp< 0.1
0.0≤Posd< 0.1
wo (を)
0.9≤Posp≤ 1.0 ∧ ga (が)
0.9≤Posp≤ 1.0 ∧ ni (に)
0.0≤Posp< 0.1 ∧ Predic (Major)
ni (に)
0.9≤Posp≤ 1.0 ∧ wo (を)
0.6≤Len< 0.7
Opinion (Major)
Commentary
wo (を)
ga (が)
0.9≤Posp≤1.0
wa (は)
0.9≤Posp≤ 1.0 ∧ wa (は)
0.9≤Posp≤1.0 ∧ Predic (Major)
0.4≤Len< 0.5
0.2≤Len<0.3
0.9≤Posp≤ 1.0 ∧ ga (が)
wo (を) ∧ Predic (Major)
CHAPTER 2
28
Table 2.11: Effective features and their pairs (negative)
Summarization rate 10%
National
0.0≤Sim< 0.1
0.9≤Posd≤ 1.0 ∧ 0.0≤Sim<0.1
0.0≤TIwid < 0.1 ∧ wo (を)
0.6≤Posp< 0.7
0.7≤Posd< 0.8 ∧ 0.9≤Posp≤ 1.0
0.9≤Posd≤ 1.0 ∧ 0.6≤Posp< 0.7
0.5≤Posd< 0.6
0.9≤TIwid ≤ 1.0 ∧ Connection
0.9≤Posp≤ 1.0 ∧ 0.0≤Sim<0.1
0.9≤Posd≤ 1.0 ∧ 0.0≤Den< 0.1
Editorial
0.0≤Den< 0.1 ∧ Predic (Major)
0.2≤TI< 0.3 ∧ wa (は)
0.3≤TI≤ 0.4 ∧ NE:LOC
0.3≤TIdep <0, 4 ∧ NE:ORG
0.0≤Posd<0.1 ∧ mo (も)
0.4≤TI< 0.5 ∧ 0.3≤TIwid <0.4
0.1≤TIwid < 0.2 ∧ Past (Minor)
0.4≤TIwid < 0.5 ∧ wo (を)
助詞:「と」∧ NE:LOC
wa (は) ∧ Other (Minor)
Commentary
0.2≤TIwid <0.3 ∧ wo (を)
0.1≤TIwid <0.2 ∧ NE:ORG
wa (は) ∧ NE:LOC
NE:DAT ∧ Past (Minor)
0.9≤Posp≤1.0 ∧ 0.7≤Sim<0.8
0.5≤Posd<0.6 ∧ ga (が)
0.3≤TI<0.4 ∧ 0.2≤TIdep <0.3
0.3≤TI<0.4 ∧ 0.9≤Sim≤1.0
0.5≤TI≤0.6 ∧ ga (が)
0.9≤Posp≤1.0 ∧ 0.2≤TI<0.3
Summarization rate 30%
National
0.0≤Sim<0.1
0.9≤Posd≤1.0 ∧ 0.0≤Sim<0.1
0.8≤Posd<0.9 ∧ 0.0≤Den<0.1
0.5≤Posd<0.6
0.3≤Posd<0.4
0.8≤Posd<0.9 ∧ 0.1≤TI<0.2
0.0≤Sim<0.1 ∧ Predic (Major)
0.5≤Posd<0.6 ∧ ga (が)
0.6≤Sim<0.7 ∧ de (で)
de (で) ∧ wo (を)
Editorial
wo (を) ∧ mo (も)
0.0≤Den<0.1 ∧ Predic (Major)
0.1≤Len<0.2
0.0≤TIwid <0.1 ∧ NE:DAT
ga (が) ∧ NE:DAT
ga (が) ∧ wa (は)
0.9≤Posd≤1.0 ∧ 0.3≤TIdep <0.4
0.1≤Den<0.2 ∧ NE:LOC
0.4≤TIwid <0.5 ∧ 0.7≤Sim<0.8
ga (が) ∧ Connection
Commentary
0.1≤TIwid <0.2 ∧ NE:ORG
0.2≤Den<0.3 ∧ de (で)
0.5≤TI<0.6 ∧ wa (は)
0.3≤TIdep <0.4 ∧ wo (を)
0.5≤Sim<0.6 ∧ Connection
0.9≤Posp≤1.0 ∧ 0.1≤TIwid <0.2
ga (が) ∧ Verb:29
de (で) ∧ wa (は)
ni (に) ∧ Verb:29
0.1≤Posd<0.2 ∧ Connection
Summarization rate 50%
National
0.0≤Len<0.1
0.0≤Posd<0.1
0.1≤Len<0.2
0.0≤TI<0.1
0.0≤Sim<0.1
0.2≤TI<0.3
Other (Minor)
Other (Major)
0.3≤TIdep <0.4
0.9≤Posd≤1.0 ∧ 0.0≤Sim<0.1
Editorial
0.6≤Posp< 0.7
0.1≤Len< 0.2
Past (Minor)
0.0≤Den< 0.1 ∧ Past (Minor)
0.0≤Den< 0.1 ∧ Predic (Major)
mo (も)
mo (も) ∧ Predic (Major)
0.0≤Den< 0.1
0.3≤Posd< 0.4
0.1≤TI<0.2
Commentary
0.1≤Len<0.2
Other (Minor)
Past (Minor)
Other (Minor)
NE:PERSON
0.0≤Den<0.1
0.6≤Posp< 0.7
0.0≤Len<0.1
0.4≤Posp< 0.5
Past (Minor) ∧ Predic (Major)
2.4
DISCUSSION
29
are TF·IDF and its variation. In detail, an effective feature or its pairs is different by genre of document. This result supports the finding that we can get
highest performance when test and training genre are the same. At 10% and 30%
summarization rates, effective features are pairs. At 50% summarization rate, effective features are singles. This suggests that SVM(Poly) performs better than
SVM(Lin) at summarization rates of 10% and 30%, but is the same as SVM(Lin)
at a summarization rate of 50%.
In National, Named Entities (e.g., DATE, ORGANIZATION), functional
word “ga”, and similarity between headline and modality: Predicative, are effective. Since, National has a typical newspaper style, the beginning of a document
is important. Then, many important sentences contain DATE or ORGANIZATION and their modality is Predicative. Moreover, the functional word “ga” is
important as it is used when a new event is introduced. In addition, the headline
reflects the content of document.
In Editorial, sentence position at the beginning of a paragraph is effective.
The reason for this result is that introduction of a sub-topic or a main-topic is
written at that positions. In addition, modality:Opinion, TF·IDF considering
dependency structures, and length of sentence are also effective. These features
imply the text structure of editorial and commentary is different from that of
National.
In Commentary, Named Entity:ARTIFACT, functional word “wa”, and TF
·IDF variations are effective. Often Commentary refers to new technology or
products, so ARTIFACT is important. Moreover, the end of a document is effective. This result indicates that the document structure of commentary is also
different from that of National.
In short, we confirmed that effective features or their pairs are dependent on
document genres. Moreover, the features Named Entity and TF·IDF considering
dependency structure that are introduced by us have high weight. Therefore,
these features are significant for important sentence extraction.
CHAPTER 2
30
2.5
Results for English Documents
In this section, we describe the evaluation of our system, which participated in
Document Understanding Conference 2002 (DUC-2002).
We participated in the Single-Document Summarization task at DUC-2002 to
confirm the effectiveness of our SVM-based summarization method for English
documents. Note that we employ a smaller feature set for English documents
than for Japanese documents. Feature set we used are:
• Position of sentence,
• Length of sentence,
• Sentence score using TF·IDF,
• Similarity between sentence and headline,
• Prepositions,
• Verbs.
We trained classifiers by using data at DUC-2001 and classified sentences
contained in the test data (567 documents). The word limit of summaries is 100
words. Randomly chosen documents of 295 were evaluated.
Table 2.12 shows the results of a subjective evaluation of 13 systems which
participated in the Single-Document Summarization task at DUC-2002, and two
reference results. In the table, “Lead” denotes the result from a Lead-based
baseline system provided by the DUC Committee, while “Human” denotes the
result from human subjects.
“Mean Coverage” and “Length-Adjusted Coverage” indicate content-based
metrics for summaries. A higher score means better performance. “Count of
Quality Questions” and “Mean Score for Quality Questions” indicate readability
metrics, such as grammaticality, coherence and organization. A lower score means
better performance. Figure 2.5 shows the “Quality Questions” used to evaluate
summaries.
2.5
RESULTS FOR ENGLISH DOCUMENTS
31
• Within-sentence judgments
Q1. About how many capitalization errors are there?
Q2. About how many sentences have incorrect word order?
Q3. About how many times does the subject fail to agree in number with the verb?
Q4. About how many of the sentences are missing important constituents (e.g. the
subject, main verb, direct object, modifier) - causing the sentence to be
ungrammatical, unclear, or misleading?
Q5. About how many times are unrelated fragments joined into one sentence?
• Within - or across - sentence judgments
Q6. About how many times are determiners used incorrectly?
Q7. About how many pronouns are there whose antecedents are incorrect, missing, or
come only later?
Q8. For about how many noun phrases are there whose referent is impossible to
determine clearly?
Q9. About how many names or noun phrases are there that should have been
pronominalized?
Q10. About how many dangling connectives are there?
Q11. About how many instances of unnecessarily repeated information are there?
Q12. About how many sentences strike you as in the wrong place because they indicate
a strange time sequence, suggest a wrong cause-effect relationship, or just don’t
fit in topically with neighboring sentence?
Figure 2.5: Quality Questions
CHAPTER 2
32
Table 2.12: Evaluation results at DUC-2002
System-ID
Mean Coverage
15
16
17
18
19
21
23
25
Our System
28
29
30
31
Lead
Human
0.332
0.303
0.082
0.323
0.389
0.370
0.335
0.290
0.383
0.380
0.361
0.057
0.360
0.370
0.505
Length-Adjusted
Coverage
0.232
0.214
0.299
0.228
0.293
0.247
0.272
0.220
0.272
0.261
0.251
0.339
0.240
0.255
0.336
Count of Quality
Questions
0.986
1.441
0.758
0.997
0.698
0.885
0.582
3.200
1.014
1.013
1.210
2.637
1.153
0.718
0.505
Mean Score for
Quality Questions
0.551
0.644
0.408
0.565
0.448
0.561
0.425
1.281
0.552
0.537
0.660
1.040
0.676
0.490
0.354
Our system achieved second place in “Mean Coverage”, fourth in “LengthAdjusted Coverage”, eighth in “Count of Quality Questions” and sixth in “Mean
Score for Quality Questions”. Moreover, our system outperformed Lead in “Mean
Coverage” and “Length-Adjusted Coverage”, but was less successful in “Count
of Quality Questions” and “Mean Score for Quality Questions”. This result
shows that our summaries contain important information but they have moderate
readability due to a lack of coherence.
2.6
Summary
This chapter presented an SVM-based important sentence extraction technique.
Experimental evaluations were conducted on a Lead-based method, a decision
tree learning method, and a Support Vector Machines-based method, with TSC’s
corpus and Nomoto’s corpus. The experimental results show that the SVM-based
method outperforms the other methods in both corpora for all summarization
2.6
SUMMARY
33
rates. Moreover, we clarified the effective features for three genres, showing that
important features vary according to the genre. In addition, we showed the
effectiveness of our method for English documents by using the results of DUC2002.
Chapter 3
Applying Support Vector
Machines to Multi-Document
Summarization
3.1
Introduction
In recent years, multi-document summarization has attracted attention. We expect that multi-document summarization will be useful for Topic Tracking systems. Multi-document summarization has become a hot topic at recent summarization workshops such as the Document Understanding Conference (DUC)1 and
the Text Summarization Challenge (TSC)2 [Fukushima01]. Important sentence
extraction from a set of documents is similar to that from a single document.
That is, the significance of a sentence is defined by certain clues. However, it
is difficult to tune parameter values by hand when the number of these features
is large. Therefore, we adopt Support Vector Machines that show good performance for single-document summarization (Section 2). We conduct experiments
using three variations of document sets with three summarization rates for each
of twelve events published in the MAINICHI newspaper of 1999. These sets were
manually chosen by newspaper editors. Our experiments show that our method
1
2
http://www-nlpir.nist.gov/projects/duc/
http://lr-www.pi.titech.ac.jp/tsc/
35
CHAPTER 3
36
gives better results than the Lead-based method and the TF·IDF method. Moreover, we clarify that reducing redundancy is not always effective for extracting
important sentences from a set of multiple documents taken from a single source.
The remainder of this chapter is organized as follows. Section 3.2 describes
the characteristic of document set used for our experiments. In Section 3.3 we
present an SVM-based method of important sentence extraction from a set of
documents. In Section 3.5, we show experimental results. Section 3.6 shows the
effect of Maximum Marginal Relevance (MMR) for reducing redundancy.
3.2
Document Sets
The document sets for multi-document summarization can be classified into two
classes [Okumura99b]:
1. A document set related to a set of specific words, i.e., IR results.
2. A document set related to a specific event.
[Fukuhara00] discusses class 1. Document sets in the first class are usually
very large and often contain non-relevant documents. Therefore, it is difficult to
make an ideal summary for the class 1 document set.
[Stein99, Goldstein00] discuss class 2. TSC and DUC employ this class. Extraction of a document set related to a certain event is a major topic of Topic
Detection and Tracking (TDT). The class 2 document set has a high semantical
cohesion. Therefore, we can make an ideal summary for a document set. In this
chapter, we describe a multi-document summarization method for class 2. Such a
document set belongs to “Single-Event” in McKeown’s taxonomy [McKeown01].
3.3
Multi-Document Summarization based on
Support Vector Machines
We can regard important sentence extraction as a two-class problem. However,
the proportion of important sentences in training data may be different from that
3.4
FEATURES FOR MULTI-DOCUMENT SUMMARIZATION
37
in test data. This situation is similar to that in single-document summarization.
Therefore, we use g(x) to rank sentences.
3.4
Features for Multi-Document Summarization
In multi-document summarization, we have to judge whether a certain sentence
is important in the document set. Therefore, we add extra features for multidocument summarization. We employ the features for single-document that are
used in section 2.2.3. The additional features for multi-document are described
below. Note that every real-valued feature is normalized between 0 and 1 and is
represented by 10 boolean variables as we used in the single-document case.
Sentence Position in a Document Set
First, the documents in document set E are sorted by their date stamps. Then,
we define a feature function Post(Si ) for the position of a sentence Si in E. The
first sentence in the sorted E obtains the highest score and the last sentence
obtains the lowest score.
Post(Si ) = 1 − BE(Si )/M(E).
Here, M(Si ) is the number of characters in E. BE(Si ) is the number of
characters before Si in the sorted E.
MDL-based Significant Word Selection
We would like to find a set of significant words useful for important sentence extraction from a document set. [Swan99] proposed a method of significant words
selection from a document set based on χ2 metrics, and [Ohira99] proposed another method based on AIC metrics. In this chapter, we propose an MDL-based
significant word selection method.
CHAPTER 3
38
Table 3.1: An example of
c
t
n11
¬t n21
cross-tabulation list.
¬c
n12
n22
For each words t in the document set E, we make a cross-tabulation list
(See Table 3.1). n11 indicates the number of documents that contain t in a
certain document set c, n12 indicates the number of documents that contain t in
the complement of c. n21 indicates the number of documents in c that do not
contain t. n22 indicates the number of documents in the complement of c that
do not contain t. c is the subset of E. In addition, N = n11 + n12 + n21 + n22 .
Here, we can consider two hypotheses. The first hypothesis asserts that t and
c are independent (IM). The second asserts that t and c are dependent (DM).
We address the question: “Which hypothesis is correct?” by using the Minimum
Description Length (MDL) principle. The MDL values of DM and IM are defined
as follows:
kDM
logN
2
kIM
MDLIM (t, c) = −MLLIM (t, c) −
logN
2
MDLDM (t, c) = −MLLDM (t, c) −
(3.1)
(3.2)
Here, kDM and kIM are the numbers of free parameter, kDM = 3, kIM = 2.
N is the number of all documents contained in the database. The database in
this chapter is MAINICHI 1999 which contains 112,401 documents. MLLDM
and MLLIM indicate Maximum Log-Likelihood (MLL) of DM and IM. These are
defined as follows:
MLLDM (t, c) = (n11 + n12 ) log(n11 + n12 ) + (n11 + n21 ) log(n11 + n21 )
+ (n21 + n22 ) log(n21 + n22 ) + (n12 + n22 ) log(n12 + n22 )
− 2N log N
3.4
FEATURES FOR MULTI-DOCUMENT SUMMARIZATION
39
MLLIM (t, c) = n11 log n11 + n12 log n12 + n21 log n21 + n22 log n22
− N log N
If the MDL value of DM is smaller than the MDL value of IM, t depends on
c. When the difference of MDL is larger than 1, DM is better than IM [Ohira99]:
MDLIM (t, c) − MDLDM (t, c) ≥ 1.
The words t that satisfy the above condition are characteristic to c. Here, we
consider two classes as c. The first is all documents that are related to a certain
event, that is E. The second is a subset of E, which includes only documents
written on the same day. We refer to this document set as Ci . In order to
detecting topic shifts, we use Ci . In the case of c = E, we refer to the word
set that contains words satisfy the above constrains as T (E), and in the case of
c = Ci , we refer to word set as T (Ci ).
We defined the feature function that is the weighting of sentences based on
TF·IDF as
TIE (Sj ) =
tf (t, Sj ) · w(t, Di )
t∈T (Sj )∩T (E)
TIC (Sj ) =
t∈T (Sj
)∩T (C
tf (t, Sj ) · w(t, Di )
i)
Note that Sj ∈ C and Sj ∈ E.
Genres of Documents
Sometimes various documents in different genres mention a certain event. However, some genres are useless for summarization. Therefore, we define booleanvalued features for document genres. Here, the documents are classified into seven
genres:
News, Editorial, Commentary, Review, General, Feature, Science.
CHAPTER 3
40
3.5
Experimental Evaluation
3.5.1
Corpus
We chose 12 events from MAINICHI 1999. For each event, one expert (editor
of newspaper articles) collected relevant documents. Then, three experts (A, B,
C) selected important sentences from each document set for three summarization
rates: 10%, 30%, and 50%. We refer to the sets selected by expert A as Set A,
by expert B as Set B, by expert C as Set C. Table 3.2 shows the statistics.
We examined the concordance among important sentences selected by experts
by Precision and Kappa coefficient (K)[Carletta97]. Precision is a/b, where a is
the number of important sentences agreed among experts, and b is the number
of important sentences. K is defined as follows:
K=
P (A) − P (E)
1 − P (E)
Here, P (A) indicates the proportion of times that the experts agree and P (E)
indicates the proportion of times that one would expect them to agree by chance.
Table 3.3 shows the results. In addition, the interpretation of K values is shown
in Table 3.4.
Note that the Precision of agreements between experts increases according to
the summarization rate. Accordingly, in Table 3.3, Set B and Set C have the
highest Precision, and the lowest Precision is given by Set A and Set C. On the
other hand, K is high when summarization rate is low. Although the K values are
not good, but at the summarization rate of 10%, their agreement is “moderate”
(K 0.4). n On the other hand, K of General in Nomoto’s data [Nomoto97] is
0.34 at the summarization rate of 10%. This results implies our data set is more
reliable than Nomoto’s.
3.5.2
Compared Summarization Methods
We compared three methods: Lead-based method, TF·IDF-based method, and
SVM-based method. At each summarization rate, we trained classifiers and then
classified the test documents.
3.5
EXPERIMENTAL EVALUATION
41
Table 3.2: Description of data set
# of
docs
# of
sentences
#of important
sentences
10% 30% 50%
12/26
12
165
17
50
83
01/14
11/04
23
445
45
134
228
02/03
02/08
17
320
32
96
160
Primakov discharged
05/13
05/20
16
213
22
64
107
Korea sea patrol fights with
a North Korea suspicious ship
06/10
08/27
18
179
18
54
90
Koln summit opened
06/19
06/22
8
160
16
48
80
Stepashin discharged
08/10
08/13
11
282
29
85
141
10/09
10/31
14
281
29
85
142
03/24
12/19
35
605
66
197
328
04/12
08/16
16
232
24
70
116
10/13
12/01
35
605
66
197
328
11/16
12/28
26
479
49
145
241
231
4013
409
1213
2023
Topic
Ancient coin found
in Nara
Brazil’s currency
devaluation
King Hussein received
a bone marrow transplant
Faulty points found in
shinkansen tunnel
Suspicious ships found in
Japan Sea
India tested a new
intermediate-range missile
Military carry out a coup
in Pakistan
H2 launch ended in failure
Total
Start
End
(M/D)
(M/D)
01/20
CHAPTER 3
42
Table 3.3: Concordance between important sentences selected by editors
Summarization rate
Combination
10%
30%
50%
Precision K
Precision K
Precision K
A∩B
0.465
0.40 0.521
0.32 0.661
0.32
0.517
0.46 0.560
0.37 0.686
0.37
B∩C
C∩A
0.451
0.39 0.474
0.25 0.603
0.20
0.328
0.42 0.341
0.31 0.461
0.30
A∩B∩C
Table 3.4: Interpretation of K
0.0
0.21
0.41
0.61
0.81
K
<
−
−
−
−
−
0
0.20
0.40
0.60
0.80
1.0
Reliability
POOR
SLIGHT
FAIR
MODERATE
SUBSTANTIAL
NEAR PERFECT
Lead-based Method
In the case of the single-document summarization, the Lead-based method simply
first selects some sentences from a given document. However, it is not clear
what the Lead-based method is for a set of documents. In this chapter, we rank
sentences by Post (see Section 3.4) and select top-ranked sentences. We refer to
this method as Lead.
TF·IDF-based Method
Sentences are ranked by TIE (see Section 3.4) and top-ranked sentences are selected.
3.5
EXPERIMENTAL EVALUATION
43
Table 3.5: Performance of each methods
Summarization
Precision
Methods
rate
Expert A Expert B Expert C
Lead
39.2
38.4
45.7
TF·IDF
39.7
36.9
37.6
10%
SVM
51.1
46.6
50.7
Lead
43.3
42.3
44.1
TF·IDF
47.3
43.6
46.8
30%
SVM
52.0
50.1
49.3
Lead
58.6
59.9
57.2
50%
TF·IDF
63.2
60.6
64.6
SVM
67.5
66.3
67.0
SVM-based Method
This is our method as outlined in Section 3.3. We set the cost parameter C as
0.001 and use the second-order polynomial kernel. Sentences are ranked by g(x).
We use TinySVM3.
3.5.3
Results
By following TSC’s evaluation measure, we use Precision (Section 2.3.2).
Table 3.5 shows the performance of each method at each summarization rate.
SVM classifiers are trained by eleven document sets and then are applied to one
document set. This procedure is repeated 12 times (leave-one-out).
In each set at each summarization rate, SVM achieved the highest Precision.
At the 10% summarization rate, Lead was almost better than TF·IDF-based
method. At 30% and 50% summarization rates, TF·IDF was better than Lead.
Especially, at the low summarization rate, SVM is noticeably superior to other
two methods. It is interesting that SVM is more effective in multi-document
summarization than in single-document summarization. In the single-document
3
http://cl.aist-nara.ac.jp/˜taku-ku/software/TinySVM/
CHAPTER 3
44
Table 3.6: Proportion of sentences in A ∩ B
Summarization rate:
Method
10% 30%
50%
Lead
63.9 53.6
63.7
69.0
TF·IDF 57.6 57.4
70.7
SVM(A) 73.8 62.9
SVM(B) 73.1 61.1
72.5
70.1
SVM(C) 73.2 58.9
Table 3.7: Proportion of sentences in B ∩ C
Summarization rate:
Method
10% 30%
50%
Lead
61.5 53.9
63.2
69.2
TF·IDF 55.9 54.4
66.7
SVM(A) 69.5 58.0
73.1
SVM(B) 69.4 60.6
73.5
SVM(C) 72.0 59.0
case, the difference between SVM and Lead is less than in multi-document case.
In the multi-document case, SVM is better than Lead by almost 10 points at all
summarization rates.
Additionally, we examined the proportion of important sentences common
among experts. Tables 3.6 to 3.9 show the results. SVM(A) is the SVM classifier
trained by expert A at the specified summarization rate. SVM(B) is expert B,
SVM(C) is that by expert C. These results show that SVM outperforms other
two methods. Especially at 10% and 30%, SVM is significantly superior to other
two methods. It is important that SVM outperforms the other two methods at
low summarization rates because their reliability by K is high.
In short, the SVM-based method is superior to both Lead and TF·IDF-based
method. In addition, SVM is good at extracting important sentences agreed
among experts.
3.6
DISCUSSION
45
Table 3.8: Proportion of sentences in C ∩ A
Summarization rate:
Method
10% 30%
50%
Lead
75.3 58.1
63.2
74.1
TF·IDF 62.0 64.0
73.4
SVM(A) 82.0 65.7
SVM(B) 80.7 63.8
75.8
75.0
SVM(C) 83.0 64.7
Table 3.9: Proportion of sentences in A ∩ B ∩ C
Summarization rate:
Method
10% 30%
50%
Lead
78.2 65.0
67.2
77.3
TF·IDF 66.9 69.2
76.0
SVM(A) 85.1 72.7
78.3
SVM(B) 86.7 70.6
79.8
SVM(C) 85.5 70.3
3.6
3.6.1
Discussion
The Effective Features
We investigate effective features and their pairs by using the method described in
Section 2.4. Table 3.10 shows the positive top-10. Table 3.11 shows the negative
top-10.
At 10% summarization rate, positive effective features and their pairs are as
follows:
• The feature indicates the sentence position at the beginning of document,
• The feature indicates that the sentence has high TF·IDF (include validation) values,
CHAPTER 3
46
Table 3.10: Effective features and their pairs in multi-document summarization
(positive)
Set A
Summarization rate=10%
0.9≤Posd≤1.0 ∧ NE:DATE
0.9≤Posd≤1.0 ∧ 0.9≤Len≤1.0
0.9≤Posd≤1.0 ∧ NE:LOC
0.9≤Posd≤1.0 ∧ 0.9≤TI≤1.0
0.9≤Posd≤1.0 ∧ NE:PERSON
0.9≤Posd≤1.0 ∧ Past (Minor)
0.9≤Len≤1.0 ∧ 0.9≤Den≤1.0
0.9≤Posd≤1.0 ∧ 0.9≤TId ≤1.0
0.9≤Posd≤1.0 ∧ wo (を)
0.9≤Sim≤1.0 ∧ NE:PERSON
Summarization rate=30%
0.9≤Sim≤1.0
0.9≤Sim≤1.0 ∧ wo (を)
0.9≤Posd≤1.0 ∧ NE:DATE
0.9≤Sim≤1.0 ∧ wa (は)
0.9≤Sim≤1.0 ∧ News
0.8<Posd≤0.9 ∧ News
0.9≤Sim≤1.0 ∧ Predic (Major)
0.9≤Post≤1.0
0.9≤Posd≤1.0 ∧ NE:LOC
0.6<Post≤0.7 ∧ Past (Minor)
Summarization rate=50%
Predic (Major) ∧ News
wa (は) ∧ News
Past (Minor) ∧ News
wa (は) ∧ Other (Major)
wa (は)
wa (は) ∧ Other (Minor)
0.2<Sim≤0.3 ∧ 0.1<Post≤0.2
0.1<Post≤0.2
0.4<Sim≤0.5 ∧ 0.6<Post≤0.7
0.9≤Post≤1.0
Set B
Summarization rate=10%
0.9≤Posd≤1.0 ∧ NE:DATE
0.9≤Posd≤1.0 ∧ 0.9≤TI≤1.0
0.9≤Posd≤1.0 ∧ 0.9≤Len≤1.0
0.9≤Posd≤1.0 ∧ 0.9≤Posp≤1.0
0.9≤Posd≤1.0 ∧ 0.9≤Sim≤1.0
0.9≤Posd≤1.0 ∧ 0.9≤TId ≤1.0
0.9≤Len≤1.0 ∧ 0.9≤Sim≤1.0
0.9≤Posd≤1.0 ∧ NE:PERSON
0.9≤Posd≤1.0 ∧ wo (を)
0.9≤TI≤1.0 ∧ 0.9≤Sim≤1.0
Summarization rate=30%
0.9≤Posd≤1.0 ∧ NE:DATE
0.9≤Posd≤1.0 ∧ 0.9≤Posp≤1.0
0.9≤Posd≤1.0 ∧ NE:PERSON
0.9≤Posd≤1.0 ∧ wo (を)
0.9≤Posd≤1.0
0.9≤Posd≤1.0 ∧ NE:LOC
NE:LOC ∧ wo (を)
0.9≤Posd≤1.0 ∧ 0.9≤TI≤1.0
0.9≤Posd≤1.0 ∧ wa (は)
0.9≤Posd≤1.0 ∧ News
Summarization rate=10%
0.9≤Posd≤1.0 ∧ NE:DATE
0.9≤Posd≤1.0 ∧ Past (Minor)
0.9≤Posd≤1.0 ∧ 0.9≤Posp≤1.0
0.9≤Posd≤1.0 ∧ NE:LOC
0.9≤Posd≤1.0 ∧ 0.9≤Sim≤1.0
0.9≤Posd≤1.0 ∧ 0.9≤TI≤1.0
0.9≤Posd≤1.0 ∧ 0.9≤Len≤1.0
0.9≤Posd≤1.0 ∧ NE:PERSON
0.9≤Sim≤1.0 ∧ NE:DATE
0.9≤Posd≤1.0 ∧ Predic (Major)
Summarization rate=30%
0.9≤Posd≤1.0 ∧ NE:LOC
0.9≤Posd≤1.0 ∧ Past (Minor)
0.9≤Posd≤1.0
0.9≤Posd≤1.0 ∧ NE:DATE
0.9≤Posd≤1.0 ∧ News
0.9≤Posd≤1.0 ∧ wa (は)
0.9≤Posd≤1.0 ∧ wo (を)
0.9≤Posd≤1.0 ∧ Predic (Major)
0.9≤Posd≤1.0 ∧ 0.9≤Posp≤1.0
0.9≤Posd≤1.0 ∧ ga (が)
Summarization rate=50%
wa (は)
wa (は) ∧ Other (Major)
wa (は) ∧ Other (Minor)
ga (が)
wa (は) ∧ 0.0≤Post≤0.1
0.9≤Posp≤1.0 ∧ wa (は)
0.3<TI≤0.4 ∧ 0.0≤Den≤0.1
0.1<Den≤0.2 ∧ ga (が)
NE:PERSON ∧ wa (は)
0.0≤TIE ≤0.1 ∧ 0.1<TIC ≤0.2
Set C
Summarization rate=50%
0.9≤Posp≤1.0 ∧ wa (は)
wa (は)
ni (に)
0.4<TI≤0.5 ∧ 0.0≤Den≤0.1
wa (は) ∧ ni (に)
NE:PERSON ∧ Editorial
Predic (Major)
0.9≤Posp≤1.0 ∧ 0.2<TIC ≤0.3
Past (Minor)
0.9≤TI≤1.0
3.6
DISCUSSION
47
Table 3.11: Effective features and their pairs in multi-document summarization
(negative)
Set A
Summarization rate=10%
0.9≤Posd≤1.0 ∧ 0.1<TIE ≤0.2
0.9≤TI≤1.0 ∧ wa (は)
0.9≤Posd≤1.0 ∧ Connection
0.9≤TId ≤1.0 ∧ NE:ORG
0.1<TIE ≤0.2 ∧ NE:LOC
0.9≤Posd≤1.0 ∧ 0.0≤Den≤0.1
0.9≤Posd≤1.0 ∧ 0.1<TIC ≤0.2
0.5<TI≤0.6 ∧ 0.9≤Sim≤1.0
0.0≤Den≤0.1 ∧ 0.9≤Sim≤1.0
Editorial
Summarization rate=30%
0.9≤Posd≤1.0 ∧ 0.1<TIE ≤0.2
0.5<Posd≤0.6 ∧ ni (に)
Feature
0.2<TIE ≤0.3 ∧ ni (に)
0.1<TIE ≤0.2 ∧ de (で)
0.2<Post≤0.3
0.0≤TI≤0.1
ni (に) ∧ Connection
0.3<Sim≤0.4 ∧ News
0.9≤Posp≤1.0 ∧ Connection
Summarization rate=50%
0.2<Sim≤0.3 ∧ News
Editorial
0.7<Post≤0.8
Predic (Minor) ∧ Feature
0.0≤TIE ≤0.1
Past (Minor) ∧ Feature
Other (Minor) ∧ News
0.2<Sim≤0.3
0.0≤Posd≤0.1
wa (は) ∧ Feature
Set B
Summarization rate=10%
0.9≤Posd≤1.0 ∧ 0.0≤Den≤0.1
0.9≤Posd≤1.0 ∧ 0.4<Len≤0.5
0.9≤Den≤1.0 ∧ 0.8≤Sim≤0.9
0.9≤Posd≤1.0 ∧ 0.0≤TIE ≤0.1
0.9≤Posd≤1.0 ∧ Connection
0.9≤Den≤1.0 ∧ 0.4<Post≤0.5
0.9≤Posd≤1.0 ∧ 0.6<Post≤0.7
de (で) ∧ mo (も)
0.9≤Sim≤1.0 ∧ 0.3<TIC ≤0.4
0.9≤TI≤1.0 ∧ 0.8<Sim≤0.9
Summarization rate=30%
0.1<TIE ≤0.2 ∧ 0.1<TIC ≤0.2
0.3<TIE ≤0.4 ∧ ga (が)
0.9≤Posp≤1.0 ∧ 0.0≤Post≤0.1
0.5<Sim≤0.6 ∧ 0.9≤Post≤1.0
0.3<Posd≤0.4 ∧ NE:PERSON
0.0≤Sim≤0.1
0.7<Posd≤0.8 ∧ NE:LOC
NE:ORG ∧ wa (は)
0.9≤Posd≤1.0 ∧ 0.0≤Den≤0.1
NE:ORG ∧ NE:LOC
Summarization rate=10%
0.9≤Posd≤1.0 ∧ 0.1<TIE ≤0.2
0.9≤Posd≤1.0 ∧ Connection
0.9≤Posd≤1.0 ∧ 0.1<TIC ≤0.2
0.9≤Sim≤1.0 ∧ Connection
0.9≤Posd≤1.0 ∧ Other (Major)
0.9≤Posd≤1.0 ∧ Other (Minor)
0.9≤Posd≤1.0 ∧ 0.3<Len≤0.4
NE:LOC ∧ Connection
0.9≤Posd≤1.0 ∧ 0.3<TI≤0.4
0.9≤Posp≤1.0 ∧ Connection
Summarization rate=30%
0.5<Posd≤0.6 ∧ NE:LOC
Feature
0.6<Sim≤0.7 ∧ NE:LOC
0.9≤Posd≤1.0 ∧ 0.1<TI≤0.2
Predic (Major) ∧ Connection
NE:PERSON ∧ wo (を)
Past (Minor) ∧ Connection
NE:PERSON ∧ News
0.9≤Posd≤1.0 ∧ 0.1<TIC ≤0.2
0.3<Post≤0.4 ∧ wo (を)
Summarization rate=50%
News
0.0≤Posd≤0.1 ∧ Other (Major)
0.0≤Posd≤0.1 ∧ Other (Minor)
0.0≤Posd≤0.1 ∧ 0.9≤Posp≤1.0
0.0≤Posd≤0.1
0.0≤Posp≤0.1 ∧ Other (Major)
0.0≤Posp≤0.1 ∧ Other (Minor)
0.1<TIE ≤0.2 ∧ 0.1<TIC ≤0.2
0.0≤TIE ≤0.1 ∧ News
0.0≤TIE ≤0.1
Set C
Summarization rate=50%
0.0≤TIE ≤0.1
0.1<TI≤0.2
0.0≤Posd≤0.1
0.3<Len≤0.4
0.0≤Posd≤0.1 ∧ News
Feature
0.0≤TIC ≤0.1
NE:PERSON ∧ News
0.3<Len≤0.4 ∧ wo (を)
0.2<TI≤0.3
CHAPTER 3
48
• The feature indicates that the sentence is similar to the headline,
• The feature indicates that the sentence has Named Entities (DATE, LOCATION, PERSON),
• The feature indicates that the sentence has Predicative modality.
This reason is that most genres contained in a document set are typical news,
therefore, the beginning of the document includes important topic information.
In particular, because documents sets were related to specific events, Named
Entities (e.g. DATE, LOCATION, PERSON) are important. These effective
features are common to the case of 30% summarization rate.
At 50% summarization rate, effective features differ from the 10% and 30%
summarization rate cases. Functional words (ha, ga) are important as these words
are used when new information is introduced.
On the other hand, Table 3.11 shows the features that prevent a sentence
from becoming an important sentence. We can see features that appear in the
unimportant sentence at beginning of document, implying that a sentence appearing at in the beginning of a document is not always important. In addition,
the real-valued features with low scores also appear in unimportant sentences.
Moreover, our extra features, e.g., TIE and TIC , obtain high weight.
3.6.2
The Effectiveness of the Multi-Document Features
Table 3.12 shows degradation of SVM’s performance by removing multi-document
features. At 10% and 30% summarization rates, precisions are worse than in Table
3.5, but at the 50% summarization rate, Precisions are almost equal to those in
Table 3.5. The degradation is not very large because most important sentences
in the document set are also important sentences in a document. Therefore,
the topics of each document in a document set are the same as the topic of a
document set.
3.6
DISCUSSION
49
Table 3.12: SVM’s performance degradation after removing multi-document features
Summarization
Set A
Set B
Set C
rate
10%
48.5 (−2.6) 46.3 (−0.3) 50.0 (−0.7)
50.8 (−1.2) 48.0 (−2.1) 48.6 (−0.7)
30%
67.5 (±0) 65.7 (−0.6) 67.0 (±0)
50%
3.6.3
Minimize Redundancy by Maximum Marginal Relevance (MMR)
Generally, it is said that a document set includes redundant sentences. In order to minimize redundancy, Carbonell proposed Maximum Marginal Relevance
(MMR). The MMR deal with two factors: the first is a significance score of a sentence and the second is a similarity between the sentence and sentences already
selected for summary. In this chapter, we examine the effectiveness of MMR in
our summarization method.
Figure 3.1 shows a reranking algorithm based on MMR. In the figure, R is
the set of sentences in a given document set. A is the set of sentences selected
for summary. s(x) is a sigmoid function defined as follows:
s(x) =
1
.
1 + exp(−βx)
Here, we set β as 1. We use the sigmoid function to normalize the output of
the decision function g(x). Sim(Si, Sj ) gives similarity (cosine measure) between
sentence Si and sentence Sj based on the Vector Space Model (VSM). The first
term of MMR gives the significance score by the decision function. The second
term is the penalty score which is defined by the cosine measure between the
target and selected sentences. λ is a trade-off parameter. By using MMR, we
should be able to minimize redundancy.
Figure 3.2 shows the effect of MMR for different values of λ. At 10% and
30% summarization rates, MMR is hazardous. At the 50% summarization rate,
CHAPTER 3
50
A = {};
R = {S1 , S2 , · · · , S };
N =The number of sentences as output;
While(|A| < N){
S ∗ = MMR(A, R);
A = A ∪ {S ∗ };
R = R − {S ∗};
}
Output A, where
⎧
s(g(Si ))
⎪
⎨ argmax
Si ∈R MMR(A, R) =
⎪
⎩ argmax λs(g(Si )) − (1 − λ) max Sim(Si , Sj )
Si ∈R
Sj ∈A
Figure 3.1: Reranking algorithm by MMR
performance is slightly improved. This result implies that summaries at 10% and
30% summarization rates have no redundant sentences, while 50% rate summaries
have some redundant sentences. It is often said that redundancy minimization is
effective for multi-document summarization, but it is not effective in our experiments. The reason is that the source documents do not have much redundancy.
If we had used multi-source document sets, the result would be different.
We used the cosine measure as the similarity of sentences. However, it is not
necessarily a good measure of redundancy because two sentences that have many
common words may describe completely different things.
In our experiment, data sets have a few redundant sentences, but that have
many redundant phrases.
DISCUSSION
51
Summarization rate = 10%
52
SVM(A)
SVM(B)
SVM(C)
51
50
Precision
49
48
47
46
45
44
43
42
41
1
0.95
0.9
λ
0.85
0.8
Summarization rate = 30%
52
SVM(A)
SVM(B)
SVM(C)
51
Precision
50
49
48
47
46
45
1
0.95
0.9
0.85
0.8
λ
Summarization rate = 50%
68
67.5
67
Precision
3.6
66.5
66
65.5
SVM(A)
SVM(B)
SVM(C)
65
64.5
1
0.95
0.9
λ
0.85
Figure 3.2: The effect of MMR.
0.8
CHAPTER 3
52
ブラジルの通貨レアルの切り下げと中央銀行総裁の辞任によるショッ
クが,· · ·.
宮沢喜一蔵相は14日の閣議会見で,ブラジルの通貨レアル切り下げ
で,· · ·.
ブラジルの通貨レアル切り下げを受けた中南米は13日,· · ·.
Figure 3.3: Examples of redundant phrases.
3.7
Summary
We described a method of multi-document summarization based on Support Vector Machines. The experiments showed that our method outperforms a Leadbased method and a TF·IDF-based method. In addition, we showed effective
features and confirmed the effectiveness of multi-document features. Moreover,
we showed the effect of MMR. We found that MMR is not suitable for singlesource document sets.
Chapter 4
Question-Biased Text
Summarization for
Question-Answering Systems
4.1
Introduction
Recently, with current information retrieval (IR) systems, such as Internet search
engines as a backdrop, user-focused summarization [Mani98a] has been applied
to judging the relevance of the outputs of IR systems [Miike94, Tombros98,
Mochizuki00]. Summaries allow us to judge the relevance of IR results without
having to look through whole documents. It is, however, important to consider
the situation in which the summaries are to be used. This is especially so because,
as has frequently been pointed out, defining an ideal summary of a document is
not realistic. Therefore, we take an approach where the situation in which the
summaries are used is considered in defining and evaluating the summaries.
We propose a text summarization method that is applicable to Question Answering (QA) systems and show that a summary is useful in justifying the answer
given to a question by a QA system. We also present a method for summarizing a document by selecting these sentences with high weights as computed by
moving a window of fixed-size from the beginning to the end of the document.
The importance of each sentence is computed by the Hanning window to take the
53
CHAPTER 4
54
density of words contained in the question and prospective answering account.
In addition, we use a task-based method to evaluate results from our method
and from conventional methods. It is known that human subjects (or assessors)
make divergent judgment of the relevance of IR results [Jing98, Mochizuki00].
This means that simply borrowing the framework of relevance judgment in IR
to evaluate the results of text summarization is not enough to avoid fluctuations
in the evaluation. Therefore, a more appropriate task should be employed in
the evaluation of summaries. In QA tasks, the answers to questions have little
ambiguity as long as the questions are carefully selected and correctly understood.
We compare our method with conventional methods, with respect to usefulness
in application to QA tasks.
The remainder of this chapter is organized as follows. Section 4.2 introduces
Question-Answering as preparation. In Section 4.3, we describe the QuestionBiased Text Summarization (QBTS) that is useful for QA systems. In Section
4.4, we show the experimental results. In Section 4.5, we discuss the effectiveness
of our method in question-answering task. Section 4.6 shows the comparison with
related works.
4.2
Preparation: QA Systems
Question-Answering involves the extraction of an exact answer to a question
from a large-scale document corpus. For instance, if a QA system is given as the
question “When was Queen Victoria born?” it should answer “in 1832”. The
QA task differs from both IR and Information Extraction (IE). IR systems find
documents on the basis of a query but the output is simply a ranked series of
documents, rather than a direct answer to a question. IE systems find strings
in documents then extract the strings, but they simply extract parts that are
predefined by templates and their operation is domain-dependent.
4.2
PREPARATION: QA SYSTEMS
4.2.1
55
TREC-Style QA Task
The QA Track of TREC-81 is defined as follows [Voorhees00].
• Participants are given a collection of documents and a set of test questions.
• The document collection is the TREC-8 ad hoc set of articles, which contains approximately 528,000 articles.
• The questions are 200 fact-based, short-answer questions.
• It is guaranteed that, for each questions, at least one document in the
collection would contain an answer.
• For each question, participants are to return a ranked list of five pairs of
form <document-id, answer-string> pairs.
• Answer strings are limited to either 50 or 250 bytes.
4.2.2
QA Test Collection
We use the QA test collection NTT-QA-2000-08-23-FRUN [Sasaki00], a set of
questions prepared for use with newspaper articles in Japanese that complies
with the QA track definitions. This test collection includes one-year MAINICHI
Newspaper collection from 1994, which consists of approximately 110,000 articles.
The collection consists of fifty questions that are intended to obtain 50 bytes
answer strings. The following additional conditions are applied:
• The answers are Japanese Named Entities according to the strict IREX
definition or are numerical expressions.
2
• The questions are complete sentences and include no abbreviations.
• The default place is Japan and the default year is 1994.
1
2
Text REtrieval Conference, http://trec.nist.gov/
Information Retrieval and Extraction Exercise, http://cs.nyu.edu/cs/projects/proteus/irex/
CHAPTER 4
56
• The questions should be such that human subjects are easily able to determine whether the answers are correct or not.
QA systems output short passages as answers to questions after extracting
the passages from given documents. However, the information carried in such
short passages is insufficient for a user to judge the correctness of the answers.
Therefore, the application of our method of text summarization in QA systems
is generation of justifications of the answers. These justifications take the form
of summaries of documents.
4.3
Question-Biased Text Summarization Method
This section describes a method for Question-Biased Text Summarization (QBTS)
on the basis of the importance of passages.
4.3.1
Question-Biased and Query-Biased
We make the following distinction between a query and a question.
• An answer or answers correspond to a question, and may take the form of
a word or a sequence of words in the document.
• A ranked series of documents that are relevant to the query is expected as
the response to a query rather than an exact answer.
Some researchers have studied query-biased text summarization for IR systems [Miike94, Mani98a, Tombros98, Mochizuki00, Hand97]. Berger et al. [Berger00]
and Chali et al. [Chali99] used questions for user-focused summarization. In
these studies, Query-Biased Text Summarization was applied to QA tasks; however, there was no focus on the answers. Our approach, Question-Biased Text
Summarization is a type of user-focused text summarization that focuses on the
prospective answers to a question as well as on the question itself.
From here, we describe an appropriate method for implementing the QBTS
approach. The relative importance of sentences is determined on the basis of important passages, i.e. sequences of characters in a document. The consideration
4.3
QUESTION-BIASED TEXT SUMMARIZATION METHOD
57
of passages can lead to the extraction of sentences that are relevant to questions
and answers.
4.3.2
Definition of Passages
Generally, a “passage” means a sequence of characters in a document. Passage
retrieval, as opposed to document retrieval, has recently become a popular topic
of study [Salton93, Callan94, Kaszkiel97, Hearst93, Mochizuki99].
Passages are categorized into the following three classes[Mochizuki99]:
• Formatted structures supplied by the author [Salton93];
• Windows of a fixed or variable size [Callan94, Kaszkiel97];
• Semantic discourse structures in a document [Hearst93].
Formatted structures include chapters, sections, and paragraphs. Fixed or
variable size windows open onto strings with a certain number of characters
(bytes) in a document. Passages (in the sense of semantic discourse structures)
are the segments into which documents may be divided by semantic discourse
analysis. There is a method for the dynamic determination of passages in accordance with a query [Mochizuki99].
In our method, a combination of a formatted structure and a string of fixed
size are adopted as the concept of a passage. That is, a document is first separated into paragraph. A window of fixed size is then applied to each paragraph.
These paragraphs are not identical to discourse segments but in most cases they
represent a certain kind of semantic segment.
4.3.3
Using Hanning Windows to Determine Passage Importance
In passage retrieval, the importance of a passage is determined by the occurrence
of keywords in the passage. The weight is usually calculated by using TF·IDF,
which does not reflect the word density (Fig. 4.1). However, a dense occurrence of
CHAPTER 4
58
Low density of term occurrence
Word1
Word2
Word3
Word2
High density of term occurrence
Word1 Word2 Word3
Word2
Passage
Figure 4.1: Examples of keywords density
keywords can express a tight connection among the keywords [Takaki99, Keen91].
In QA systems, the distances between a word sequence that indicates a candidate
answer and the keywords selected from a question are very important [Prager00].
Therefore, we define an evaluation function that assigns a higher weight as
the keywords occurring densely in a passage. The Hanning window satisfies this
requirement [Kurohashi97].
Let W be the window size, l be the central position in the window and i be the
position in the document. The Hanning window function fH (i, l) is then defined
as follows (Fig. 4.2):
1
2
def
fH (i, l) =
1 + cos2π i−l
W
0
(|i − l| ≤ W/2)
(|i − l| > W/2)
(4.1)
The score S(l) of the center l is then defined as :
l+W/2
def
S(l) =
fH (i, l) · a(i)
(4.2)
i=l−W/2
where a(i) is defined in the following. Let Q be the set of content words in
a question3 . In addition, let N be the set of Named Entities in the passage that
match the type of the question4 . The IREX definition of Named Entities is used
3
A morphological analyzer should be applied to the question in Japanese .
When, for example, the question is “Who is ...”, then N is the set of person names in the
document.
4
4.3
QUESTION-BIASED TEXT SUMMARIZATION METHOD
59
fH (i,l)
1
0.8
0.6
0.4
0.2
i
0
l
l-W/2
l+W/2
Figure 4.2: The Hanning window function
and Named Entities were automatically extracted by a tool for Japanese language
Named Entity extraction.
⎧
idf (q) if q(∈ Q) appears f rom i
⎪
⎪
⎪
⎪
⎪
⎨
def
(4.3)
a(i) =
α
if n(∈ N ) appears f rom i
⎪
⎪
⎪
⎪
⎪
⎩
0
otherwise
idf(q) is given by:
def
idf(q) = log
D
df(q)
(4.4)
where df(q) is the document frequency of a word q and D is the number of
documents in the corpus. Note that α is a weight for Named Entities, i.e.,
prospective answers.
CHAPTER 4
60
Document
Paragraph
Hanning Window
Word
Figure 4.3: An example of passages in a text
This evaluation function is based on a naive idea: the more content words
appear in the passage as well as in the question and the Named Entities in the
passage that match the question type, the more important the passage is; a dense
occurrence of the content words is also preferable.
4.3.4
Using the Passage Score in Summarization
Now, we present an algorithm that generates a summary on the basis of passage
scores by using the Hanning window , given a question sentence, a corpus, and a
summarization rate.
Step 1 Select content words Q from the question and Named Entities N that
match the question type from the corpus.
Step 2 Let p1 , · · · , pn be the set of paragraphs in a document and P = {p1 , · · · , pn }.
4.4
EXPERIMENTAL EVALUATION
61
Step 3 For each pi ∈ P , apply Steps 4 and 5.
Step 4 Move the Hanning window from the beginning of a paragraph to the end
of the paragraph, one character at a time(Fig. 4.3), and calculate the score
S(l) for 1 ≤ l ≤| pi |, where | pi | is the number of characters in pi .
Step 5 Let Spi be the maximal score S(l) with 1 ≤ l ≤| pi | and the set of
important sentences Ipi be sentences that are completely within window
W . If the window contains several sentences, all of them are important
sentences.
Step 6 Select several sentences as the summary from Ip1 , ..., Ipn by inspecting
the score Spi such that the summary satisfies the specified summarization
rate.
4.4
Experimental Evaluation
To confirm the performance of our method, we have conducted experiments on
automatic text summarization. Each of two methods of evaluation is possible:
intrinsic evaluation or extrinsic evaluation. In the former method, human subjects read the summaries and compare them with the (ideal) correct summaries.
In the latter method is, on the other hand, an indirect method of evaluation that
is used to assess the accuracy of a method from its overall accuracy when applied
to a task.
We adopt extrinsic evaluation, since the intention of this work is to use text
summarization in Question-Answering systems. That is, if a human subject is
able to answer a question with respect to a document by merely reading the
summary of the document, we judge that the summary is correct.
4.4.1
Compared Summarization Methods
We compare three methods, the Lead-based and TF·IDF-based described below,
and a Hanning window-based method. The latter is the method we outlined
CHAPTER 4
62
in section 3. For reference, we employ the full documents (as Full), i.e., no
summarization, for our experiments.
Lead-based method
This method selects the first Cs characters in a document with Ct characters so
as to achieve summarization rate that are as close as possible to 10%, 30%, and
50%. These results are referred to as L(10), L(30), and L(50), respectively.
The summarization rate Rs is defined as follows:
def
Rs =
Cs
× 100
Ct
(4.5)
TF·IDF-based method
This method selects important sentences from a document on the basis of TF·IDF
[Zechner96]. The sentence score Sc (s) is defined as follows:
def
Sc (s) =
tf (t, s) · w(t)
(4.6)
t∈T l
where tf (t, s) is the term frequency of a word t in a sentence s; w(t) is defined
as:
def
w(t) =
β · tf (t, d) · idf(t) if t ∈ Q
tf (t, d) · idf(t)
otherwise
(4.7)
where Q is a set of words in the question and tf (t, d) is the term frequency of a
word t in document d. Note that if a word t is contained in a question Q, TF·IDF
is multiplied by β(= 7), following the result of [Mochizuki00], i.e. query-biased
text summarization.
We evaluate the method for summarization rates of 10%, 30%, and 50%. The
results are referred to as T(10), T(30), and T(50), respectively.
4.4
EXPERIMENTAL EVALUATION
Full
Q3 G1
Q6 G10
Q11 G9
..
..
.
.
Q43 G2
63
L(10)
G2
G1
G10
..
.
P(10)
G3
G2
G1
..
.
T(10)
G4
G3
G2
..
.
L(30)
G5
G4
G3
..
.
···
···
···
···
..
.
T(50)
G10
G9
G8
..
.
G3
G4
G5
G6
···
G1
Figure 4.4: Example of human resource mapping
Hanning window-based method
This is our method as outlined in Section 4.3. The window size W is 50 and
the weight for Named Entities α is set to 2.1. We evaluate the method for
summarization rates of 10%, 30%, and 50%. The results are referred to as P(10),
P(30), and P(50), respectively. Note that when a document has few passages
that are relevant to the question, the result is shorter.
4.4.2
Experimental Settings
Ten questions (Table 4.1) are selected from the NTT-QA-2000-08-23-FRUN collection on the basis that more than ten documents should contain the answer.
For each question, we select ten documents that contain the answer and have the
first ten keywords contained in the question scored, for each of the documents,
by TF·IDF.
The human subjects are 80 graduate-school students in engineering and science fields from various universities in Tokyo area. All are native speakers of
Japanese. The 80 subjects are separated into 10 groups G1 ,...,G 10, each of which
consisted of eight subjects. Each group assesses a summarization method only
once per question (Fig. 4.4). For each question, each human subject is given ten
summaries, then answers the question by reading the summaries (Fig. 4.5).
CHAPTER 4
64
Table 4.1: Examples of questions and answers
Question
ID
Question
Answer
Q3
What is the name of the declaration signed
by APEC?
Bogor Declaration
Q6
What was the first commercial airplane
fully manufactured in Japan
YS11
Q11
Who was the successor of the
Minister Morihiro Hosokawa?
Tsutomu Hata
Q13
Who was first leader
of the Shinshinto Party?
Toshiki Kaifu
Q14
Who became the Governor of the Bank
of Japan in December
Yasuo Matsushita
Q16
Who is the Serbian President?
Milosevic
Q22
Which bank became an affiliate of
the Mitsubishi Bank?
Nippon Trust Bank
Q35
When did a Concorde come to
Kansai Airport this year?
5 September
Q36
When did Kim Il Sung die?
8 July
Q43
What is the amount of the National Budget
FY 1994 endorsed by Government?
73,081,600,000,000 Yen
4.4
EXPERIMENTAL EVALUATION
65
Q13
Who was the first leader of
the Shinshinto Party?
Summary10
Summary2
Summary1
Human
subject
Summaries
for Q13
Summary1: Answer -> Toshiki Kaifu
Summary2: Answer -> Tsutomu Hata
Summary3: Answer -> × (no answer)
Summary10: Answer -> Toshiki Kaifu
Figure 4.5: An examples of a question-answering task
4.4.3
Measures for Evaluation
The evaluation measures are the precision (P), recall (R), and F-measure (F).
Definitions are as follows, where a is the number of documents with answers that
are provided by human subject, b is the number of documents containing the
right answers in Full, and c is the number of documents with correct answers
that are provided by human subjects.
precision =
recall =
c
a
(4.8)
c
b
F-measure =
(4.9)
1 + γ2
1
+ γ 2 R1
P
(4.10)
We set γ to 1. We also measure the average time needed by a subject to
answer each question.
CHAPTER 4
66
Table 4.2: Experimental results
F-measure
Precision
Recall
characters
Sentences
Time
(min:sec)
4.4.4
Full
87
94
84
1324
30.95
L(10)
58
91
47
143
3.32
T(10)
40
81
28
149
1.83
P(10)
65
92
54
108
2.06
L(30)
74
94
66
397
9.05
T(30)
51
87
39
398
5.85
P(30)
74
94
66
202
3.90
L(50)
76
93
68
667
15.18
T(50)
69
92
57
661
10.84
P(50)
71
86
64
266
5.15
7:41
2:21
2:28
2:49
3:56
4:23
3:09
5:13
5:08
4:03
Results
Before stating the results, we will give a quick assessment of the degree of deviation in ability among the human subjects.
Let the null hypothesis be “There is no difference among the F-measures of
the eight groups”. We tested the null hypothesis at a significance level of 5% by
using a One-Way ANOVA5. This result had a statistical significance of 0.00065
(< 0.05). The null hypothesis was thus rejected, i.e., there were differences in
ability among the groups. After checking the performance levels of the human
subjects, we found that the F-measures of some were very low for all of the
questions. Assuming that these subjects were unable to understand the tasks, we
evaluated the results by excluding the results of these human subjects. We again
tested the statistical significance of the null hypothesis. The result was now 0.099
(> 0.05), This allowed us to say “There are no statistically significant differences
in ability among the groups”. Each group then consisted of three to six human
subjects.
Table 4.2 shows the precision, recall, F-measure, average number of characters
in the summaries, and average number of sentences in the summaries. Figure 4.6
shows F-measure on each summarization rate.
5
ANOVA stands for ANalysis Of VAriance between groups.
4.5
DISCUSSION
67
80
L
T
QT
70
F-measure
60
50
40
30
0
10
20
30
summarization rate(%)
40
50
60
Figure 4.6: F-measure of each method with ten questions
4.5
4.5.1
Discussion
Accuracy
When the summarization rate is 10%, P(10) produced the best precision, recall
and F-measure, other than Full (i.e., no summarization). Looking at the Fmeasures, we can see that P(10) outperforms L(10) by 0.7 and T(10) by 3.5.
Interestingly, the precision of P(10) is higher by a smaller margin, i.e., it is
higher than L(10) by 1 and T(10) by 11. Since the recall of P(10) is only
higher than those of L(10) and T(10) by 7 and 26 respectively, it is considered
that the recall strongly affected the F-measures.
This is because P(10) tend to include the correct answer string and to better
maintain the context than the other methods. This indicates that our method is
effective for Question-Answering systems.
The data on processing time show that a summarization rate of 10% can
CHAPTER 4
68
Table 4.3: Distribution of correct strings
occurrences position from
document rate
the document’s beginning
0% — 10%
0.56
0.24
10% — 30%
0.07
30% — 50%
50% — 100%
0.13
Table 4.4: Experimental results for four questions
F-measure
precision
recall
Full
90
93
88
L(10)
51
90
39
T(10)
58
97
42
P(10)
77
91
70
L(30)
72
95
62
T(30)
61
92
48
P(30)
85
93
79
L(50)
75
93
65
T(50)
75
94
64
P(50)
78
92
73
contribute the speeding up of the time taken to process each question. This
can be understood in terms of the numbers of characters and sentences in the
summaries. P(10) requires a longer processing time than L(10) because the
Lead-based method produces results that are easier to read than P(10), which
selects sentences from different paragraphs.
When the summarization rate is 30%, P(30) and L(30) show comparable
value of precision, recall, and F-measure. This means that the first 30% of the
articles tend to contain keywords that are required to answer the questions.
When the summarization rate is 50%, L(50) produces the best values on all
three measures. However, there are only slight differences between the methods
because all three summaries contain more keywords. When a subject receives
a long summary, he tends to be successful in answering the question. However,
looking at the figures for precision, our method’s score is lower than that of any
other methods. This means that our long summaries tend to have little readability
because summary sentences are extracted from multiple paragraphs.
4.5
DISCUSSION
69
90
L
T
QT
80
F-measure
70
60
50
40
0
10
20
30
summarization rate(%)
40
50
60
Figure 4.7: F-measure of each method with four questions
4.5.2
Distribution of Answer Strings
Table 4.3 shows the positions of answers from the beginning of the documents.
The table shows that 80% of the answers are located in the first 30% of all
documents. However, note that the answers must be justified by the contexts in
the summaries. The recall for L(30) is accordingly 66%, as this is lower than
80%. When questions for QA are created, the questions tend to be about topics
to do with events. This problem will be considered in our future work.
Table 4.4 shows the results of only four questions, for each of which the correct answer is widely distributed throughout the documents. Figure 4.7 shows
F-measure on each summarization rate. The performance of the Lead-based
method is naturally worse. Moreover, when the TF·IDF-based method is compared to our proposed method, our method always produces better performance.
Therefore question-biased text summarization is more useful than query-biased
text summarization for QA systems.
CHAPTER 4
70
4.6
Related Work
Salton et al. have proposed a text relationship map, which is a network of paragraphs connected with high similarities [Salton96]. Passages within paragraphs
were not used, however, in this study. Fukumoto et al. have presented a method
based on the extraction of important paragraphs containing words with high
domain-dependencies [Fukumoto00]. The method, however, does not use passage
scores, and is thus like Salton et al’s. Barzilay et al. have heuristically extracted
important sentences by using word positions and representative words, but did
not consider paragraphs [Barzilay97].
Luhn have proposed a way of computing scores for sentences with densely
occurring important words [Luhn58]. The method considers the co-occurrence
of words within distances of four words and uses the rate of important words
to unimportant words in the co-occurring words. The Hanning window provides
a more sophisticated treatment with respect to distances of co-occurrence for
words.
The evaluation of a method for text summarization based on a Question Answering task has been outlined in this chapter. This is not the first trial to present
a task-based evaluation of text summarization. Jing et al., Hand and Mani et al.
have used of user-focused summarization to judge the relevance of results in IR
tasks [Jing98, Hand97, Mani98a]. The QA task is a sort of IR task, but there
is an inherent difference between IR and QA tasks. More specifically, QA tasks
require an output of a small number of exact answers in the form of strings or
passages while the IR task requires the output of (possibly a huge number of)
relevant documents. This leads to a difference in the size of focus of the summarization task. Morris et al. have evaluated a summarization task by using GMAT
[Morris92]. Mani et al. have evaluated summaries in terms of how much content
relevant to the query is preserved in the original documents [Mani98b]. Both of
these studies both involve QA task-based summarization; however, they are not
question-biased.
4.7
SUMMARY
4.7
71
Summary
This chapter presented a Question-Biased Text Summarization approach in which
the Hanning window is applied to a Question Answering task. Summarization experiments were conducted on the Lead-based method, a TF·IDF-based method,
and a Hanning window-based method, i.e. our proposed method, with the summarization rate at 10%, 30%, and 50%. The results were evaluated by 45 human subjects with the same educational backgrounds. The experimental results
showed that our method outperforms the other methods at the summarization
rate of 10%. This indicates that our method produces the best matches among
the three methods in terms of summarizing the outputs of Question Answering
systems.
Chapter 5
Conclusion
5.1
Summary
In this dissertation, we discussed the following three topics in generic and userfocused automatic text summarization.
1. A high performance generic single-document summarization with many features (Chapter 2).
2. Generic multi-document summarization by extending the single-document
summarization method (Chapter 3).
3. User-focused summarization as evidence in Question-Answering Systems
(Chapter 4).
In Chapter 2, we described a method of single-document summarization based
on important sentence extraction by using Support Vector Machines with many
relevant features. These features include our original features (e.g., “Named
Entity” and variations of TF·IDF) as well as other well-known features.
We conducted experiments using the Text Summarization Challenge (TSC)
corpus and Nomoto’s corpus [Nomoto97]. We compared our method with the
Lead-based method and the decision tree learning (C4.5) method at three summarization rates (10%, 30%, and 50%) in the TSC corpus, and at 15% summarization rate in Nomoto’s corpus. Drawing on results from the TSC corpus, our
73
74
CHAPTER 5
method performed better than the Lead-based method with statistical significance, however, the differences were not statistically significant when compared
to Nomoto’s corpus, although the SVM’s performance was better than both the
Lead-based method and decision tree learning method. This is because Nomoto’s
data set is small and the variance of each method is large.
Furthermore, we demonstrated that summarization depends on document genres. This observation implies that effective features differ by document genre. By
analyzing feature weights of features, we clarified effective features for each document genre. For example, in National, sentence position at the beginning of
the document, Named Entities (DATE, ORGANIZATION), and the functional
word “ga” were effective; in Editorial, position at the beginning of the paragraph,
modality:Opinion, and length of sentence are effective; in Commentary, Named
Entity (ARTIFACT), functional word “wa”, and TF·IDF variations are effective.
In Chapter 3, we described a method using Support Vector Machines for summarizing multi-documents based on sentence extraction. We employed features
used in single-document summarization (in Chapter 2) and introduced extra features: sentence position in a document set, variations of TF·IDF and document
genres, for multi-document summarization. The variations of TF·IDF were defined by the MDL-based significant word selection method that we proposed.
Our experimental results from 12 document sets showed that our method performed better than both the Lead-based method and TF·IDF-based method. In
addition, we confirmed the effectiveness of the extra features. Our method is
especially good at extracting important sentences agreed among experts (human
subjects). Moreover, the data sets used for our experiments have higher reliability
than those of past studies. Furthermore, we examined the influence of Maximum
Marginal Relevance (MMR) in minimizing redundancy. The result showed that
MMR is not effective for summarizing a set of documents at low summarization
rates from a single source.
In Chapter 4, we described a summarization method by important sentence extraction that is useful for Question-Answering Systems. This method, “QuestionBiased Text Summarization (QBTS),” allows us to judge the correctness of each
answer. The importance of each sentence is computed by the Hanning window
to calculate the density of words contained in the question and prospective an-
5.2
FUTURE DIRECTION
75
swering account. QBTS is different from Query Relevant Text Summarization
(QRTS) because the former depends not only on the question but also on the
prospective answers. To evaluate our method, we employed an extrinsic evaluation of a question-answering task. That is, if a human subject is able to answer
a question with respect to a document by merely reading the summary of the
document, we judge that the summary is correct. The evaluation results showed
that our summaries are more useful for QA systems than those of the Lead-based
method and TF·IDF-based method.
5.2
Future Direction
Our summarization methods described in this dissertation performed well, while
they are based on sentence extraction. That is, they are extracts. Important sentence extraction is one of the basic technologies for realizing an abstract. Therefore, this technique plays an important role in automatic text summarization
technology. Generally, however, extracts are less readable than abstracts; sometimes, poor readability leads to misunderstanding. Therefore, we have to consider
readability.
Figure 5.1 describes the readability evaluation results of the SVM-based sentence extraction system and the Lead-based system by using “Quality Questions”at DUC-2002. The description of “Quality Questions” is shown in Figure
2.5.
Although both systems are based on the sentence extraction technique, the
readability of text provided by SVM’s is lower than Lead in many cases. This
occurs because Lead extracts consecutive sentences in a document from the beginning. When that happens, they keep semantical coherence between sentences.
On the other hand, when extracting non-consecutive sentences, they may lack
that coherence. For example, the score difference between SVM and Lead is
large for Q7, Q8, Q10 and Q12. Here, Q7 and Q8 deal with referential relationships of words, i.e., anaphoric relationships; Q10 and Q12 are semantical
relationships between sentences. The poor scores on Q7 and Q8 denote that we
need anaphora resolution for our summaries, while for Q10 and Q12, we have to
CHAPTER 5
76
0.3
Lead
SVM
Score for Quality Questions
0.25
0.2
0.15
0.1
0.05
0
Q1
Q2
Q3
Q4
Q5
Q6
Q7
Q8
Q9
Q10
Q11
Quality Questions
Figure 5.1: Evaluation results using Quality Questions.
Q12
5.2
FUTURE DIRECTION
77
revise the summaries either by deleting dangling connectives, inserting terms or
clauses, or paraphrasing terms or clauses appropriately. These operations that
revise extracts are important future projects.
Bibliography
[Aone98] Aone, C., Okurowski, M. and Gorlinsky, J.: Trainable Scalable Summarization Using Robust NLP and Machine Learning, Proc. of the 17th International Conference on Computational Linguistics and 36th Annual Meeting
of the Association for Computational Linguistics, pp. 62–66 (1998).
[Barzilay97] Barzilay, R. and Elhadad, M.: Using Lexical Chains for Text Summarization, Proc. of the ACL Workshop on Intelligent Scalable Text Summarization, pp. 2–9 (1997).
[Barzilay99] Barzilay, R., McKeown, K. and Elhadad, M.: Information Fusion
in the Context of Multi-Document Summarization, Proc. of the 37th Annual Meeting of the Association for Computational Linguistics, pp. 550–557
(1999).
[Berger00] Berger, A. and Mittal, V. M.: Query-Relevant Summarization using
FAQs, Proc. of the 38th Annual Meeting of the Association for Computational
Linguistics, pp. 294–301 (2000).
[Brandow95] Brandow, R., Mitze, K. and Rau, L. F.: Automatic Condensation
of Electronic Publications by Sentence Selection, Information Processing &
Management, Vol. 31, No. 5, pp. 675–685 (1995).
[Callan94] Callan, J. P.: Passage-Level Evidence in Document Retrieval, Proc.
of the 17th Annual International ACM SIGIR Conference on Research and
Development in the Information Retrieval, pp. 302–310 (1994).
[Carbonell98] Carbonell, J. and Goldstein, J.: The Use of MMR, Diversity-Based
Reranking for Reordering Document and Producing Summaries, Proc. of the
79
80
BIBLIOGRAPHY
21th Annual International ACM SIGIR Conference on Research and Development in the Information Retrieval, pp. 335–336 (1998).
[Carletta97] Carletta, J., Isard, A., Isard, J., Kowtko, J., Doherty-Sneddon, G.
and Anderson, A.: The Reliability of A Dialogue Structure Coding Scheme,
Computational Linguistics, Vol. 23, No. 1, pp. 13–31 (1997).
[Chali99] Chali, Y., Matwin, S. and Szpakowicz, S.: Query-Biased Text Summarization as a Question-Answering Technique, Proc. of the AAAI Fall Symposium on Question Answering Systems, pp. 52–56 (1999).
[Cristianini00] Cristianini, N. and Shawe-Taylor, J.: An Introduction to Support
Vector Machines, Cambridge University Press (2000).
[Edmundson69] Edmundson, H.: New methods in Automatic Extracting, Journal
of ACM, Vol. 16, No. 2, pp. 246–285 (1969).
[Fukuhara00] Fukuhara, T., Takeda, H. and Nishida, T.: Multiple-Text Summarization for Collective Knowledge Formation, Dynamic Knowledge Interaction, pp. 223–246 (2000).
[Fukumoto91] Fukumoto, J. and Yasuhara, H.: Japanese Structure Analysis (in
Japanese), The Special Interest Group Notes of IPSJ (NL-085-11), pp. 81–88
(1991).
[Fukumoto00] Fukumoto, F. and Suzuki, Y.: Extracting Key Paragraph based
on Topic and Event Detection – Towards Multi-Document Summarization,
Proc. of the ANLP/NAACL2000 Workshop on Automatic Summarization,
pp. 31–39 (2000).
[Fukushima01] Fukushima, T. and Okumura, M.: Text Summarization Challenge
Text summarization evaluation in Japan, Proc. of the NAACL2001 Workshop
on Automatic summarization, pp. 51–59 (2001).
[Goldstein00] Goldstein, J., Mittal, V. and Carbonell, J., J.and Callan: Creating
and Evaluation Multi-Document Sentence Extract Summaries, Proc. of the
9th International Conference on Information and Knowledge Management,
pp. 165–172 (2000).
BIBLIOGRAPHY
81
[Hand97] Hand, T.: A Proposal for Task-based Evaluation of Text Summarization Systems, Proc. of the ACL Workshop on Intelligent Scalable Text Summarization, pp. 31–38 (1997).
[Hearst93] Hearst, M. A. and Plaunt, C.: Subtopic Structuring for Full-Length
Document Access, Proc. of the 16th Annual International ACM SIGIR Conference on Research and Development in the Information Retrieval, pp. 59–68
(1993).
[Ikehara97] Ikehara, S., Miyazaki, M., Shirai, S., Yokoo, A., Nakaiwa, H.,
Ogura, K., Ooyama, Y. and Hayashi, Y.: Goi-Taikei – A Japanese Lexicon (in Japanese), Iwanami Shoten (1997).
[Isozaki01] Isozaki, H.: Japanese Named Entity Recognition based on Simple
Rule Generator and Decision Tree Learning, Proc. of the 39th Annual Meeting
of the Association for Computational Linguistics, pp. 306–313 (2001).
[Jing98] Jing, H., Bazilay, R., McKeown, K. and Elhadad, M.: Summarization
Evaluation Methods: Experiments and Analysis, In AAAI Intelligent Text
Summarization Workshop, pp. 51–59 (1998).
[Joachims98] Joachims, T.: Text Categorization with Support Vector Machines:
Learning with Many Relevant Features, Proc. of the 10th European Conference on Machine Learning, pp. 137–142 (1998).
[Kaszkiel97] Kaszkiel, M. and Zobel, J.: Passage Retrieval Revisited, Proc. of the
20th Annual International ACM SIGIR Conference on Research and Development in the Information Retrieval, pp. 302–310 (1997).
[Kazawa02] Kazawa, H., Hirao, T. and Maeda, E.: Ranking SVM and Its Application to Sentence Selection (in Japanese), Proc. of 2002 Workshop on
Information-Based Induction Science (IBIS2002), pp. 37–42 (2002).
[Keen91] Keen, E.: The Use of Term Position Devices in Ranked Output Experiments, The Journal of Document, Vol. 47, No. 1, pp. 1–22 (1991).
82
BIBLIOGRAPHY
[Kudo00] Kudo, T. and Matsumoto, Y.: Japanese Dependency Structure Analysis Based on Support Vector Machines, Proc. of Empirical Methods in Natural
Language Processing and Very Large Corpora, pp. 18–25 (2000).
[Kudo01] Kudo, T. and Matsumoto, Y.: Chunking with Support Vector Machine,
Proc. of the 2nd Meeting of the North American Chapter of the Association
for Computational Linguistics, pp. 192–199 (2001).
[Kupiec95] Kupiec, J., Pedersen, J. and Chen, F.: A Trainable Document Summarizer, Proc. of the 18th Annual International ACM SIGIR Conference on
Research and Development in the Information Retrieval, pp. 68–73 (1995).
[Kurohashi97] Kurohashi, S., Shiraki, N. and Nagao, M.: A Method for Detecting Important Descriptions of a Word Based on Its Density Distribution in
Text (in Japanese), Transactions of Information Processing Society of Japan,
Vol. 38, No. 4, pp. 845–853 (1997).
[Kwok01] Kwok, C., Etzioni, O. and Weld, D.: Scaling Question Answering to
the Web, Proc. of the 10th International World Wide Web Conference, pp.
150–161 (2001).
[Lin99] Lin, C.-Y.: Training a Selection Function for Extraction, Proc. of the 8th
International Conference on Information and Knowledge Management, pp.
55–62 (1999).
[Luhn58] Luhn, H.: The Automatic Creation of Literature Abstracts, IBM Journal of Research and Development, Vol. 2, No. 2, pp. 159–165 (1958).
[Mani98a] Mani, I. and Bloedorn, E.: Machine Learning of Generic and UserFocused Summarization, Proc. of the 15th National Conference on Artificial
Intelligence, pp. 821–826 (1998).
[Mani98b] Mani, I., David, H., Gary, K., Lynette, H., Leo, O., Theérèse, F.,
C., M. and Beth, S.: The TIPSTER SUMMAC Text Summarization Evaluation Final Report, Technical report MTR98W0000138, The MITRE Corporation (1998).
BIBLIOGRAPHY
83
[Mani99] Mani, I., Gates, B. and Bloedorn, E.: Improving Summaries by Revising Them, Proc. of the 37th Annual Meeting of the Association for Computational Linguistics, pp. 558–565 (1999).
[Mani01] Mani, I.: Automatic Summarization, John Benjamins Publishing Company (2001).
[Matsumoto00] Matsumoto, Y., Kitauchi, A., Yamashita, T., Hirano, Y., Matsuda, H., Takaoka, K. and Asahara, M.: Morphological Analysis System
ChaSen version 2.2.1 Manual, Technical report, Nara Institute Science and
Technology (2000).
[McKeown01] McKeown, K. R., Barzilay, R., Evans, D., Hatzivassilogou, V.,
Yen Kan, M., Schiffman, B. and Teufel, S.: Columbia Multi-Document Summarization: Approach and Evaluation, Proc. of the Document Understanding
Conference 2001, pp. 223–246 (2001).
[Miike94] Miike, S., Ito, E., Ono, K. and Sumita, K.: A Full-Text Retrieval
System with a Dynamic Abstract Generation Function, Proc. of the 17th
Annual International ACM SIGIR Conference on Research and Development
in the Information Retrieval, pp. 152–161 (1994).
[Mochizuki99] Mochizuki, H., Iwayama, M. and Okumura, M.: Passage-Level
Document Retrieval Using Lexical Chains (in Japanese), Journal of Natural
Language Processing, Vol. 6, No. 3, pp. 101–125 (1999).
[Mochizuki00] Mochizuki, H. and Okumura, M.: Evaluation of Summaries Based
on Lexical Chains Using Infromation Retrieval Task (in Japanese), Journal
of Natural Language Processing, Vol. 7, No. 4, pp. 63–77 (2000).
[Morris92] Morris, A. H., Kasper, G. and Adams, D. A.: The Effects and Limitations of Automated Text Condensing on Reading Comprehension, Information Systems Research, Vol. 3, No. 1, pp. 17–35 (1992).
[Nanba00] Nanba, H. and Okumra, M.: Producing More Readable Extracts by
Revising Them, Proc. of the 18th International Conference on Computational
Linguistics, pp. 1071–1075 (2000).
84
BIBLIOGRAPHY
[Nobata01] Nobata, C., Sekine, S., Murata, M., Uchimoto, K., Utiyama, M.
and Isahara, H.: Sentence Extraction System Assembling Multiple Evidence,
Proc. of the 2nd NTCIR Workshop on Research in Chinese & Japanese Text
Retrieval and Text Summarization, pp. 319–324 (2001).
[Nomoto97] Nomoto, T. and Matsumoto, Y.: The Reliability of Human Coding
and Effects on Automatic Abstracting (in Japanese), The Special Interest
Group Notes of IPSJ (NL-120-11), pp. 71–76 (1997).
[Ohira99] Ohira, S., Hoashi, K., Matsumoto, K., Hashimoto, K. and Shirai, K.:
Proposal and Evaluation of Significant Word Selection Method based on
AIC (in Japanese), Proc. of the Symposium of Natural Language Processing (1999).
[Okumura99a] Okumura, M., Haraguchi, Y. and Mochizuki, H.: Some Observations on Automatic Text Summarization Based on Decision Tree Learning
(in Japanese), Proc. of the 59th National Convention of IPSJ (5N-2), pp.
393–394 (1999).
[Okumura99b] Okumura, M. and Nanba, H.: Automated Text Summarization:
A Survey (in Japanese), Journal of Natural Language Processing, Vol. 6,
No. 6, pp. 1–26 (1999).
[Prager00] Prager, J., Brown, E. and Coden, A.: Question-Answering by Predictive Annotation, Proc. of the 23rd Annual International ACM SIGIR Conference on Research and Development in the Information Retrieval, pp. 184–191
(2000).
[Quinlan93] Quinlan, J.: C4.5: Programs for Machine Learning, Morgan Kaufmann (1993).
[Salton93] Salton, G., Allan, J. and Buckley, C.: Approaches to Passage Retrieval
in Full Text Information Systems, Proc. of the 16th Annual International
ACM SIGIR Conference on Research and Development in the Information
Retrieval, pp. 49–56 (1993).
BIBLIOGRAPHY
85
[Salton96] Salton, G., Singhal, A., Buckley, C. and Mitra, M.: Automatic Text
Decomposition Using Text Segments and Text Themes, Proc. of the ACM
Conference on Hypertext, pp. 53–65 (1996).
[Sasaki00] Sasaki, Y., Isozaki, H., Taira, H., Hirota, K., Kazawa, H., Hirao, T.,
Nakajima, H. and Kato, T.: An Evaluation and Comparison of Japanese
Question Answering Systems (in Japanese), TECHNICAL REPORT IECE,
NLC-2000-24, pp. 17–24 (2000).
[Sekine00] Sekine, S. and Eriguchi, Y.: Japanese Named Entity Extraction Evaluation - Analysis of Results -, Proc. of the 18th International National Conference on Computational Linguistics, pp. 1106–1110 (2000).
[Stein99] Stein, G., Strazalkowski, T. and Wise, G.: Summarizing Multiple Documents using Text Extraction and Interactive Clustering, Proc. of the Pacific
Association for Computational Linguistics 1999, pp. 200–208 (1999).
[Swan99] Swan, R. and Allan, J.: Extracting Significant Time Varying Features
from Text, Proc. of the 8th International Conference on Information and
Knowledge Management, pp. 38–45 (1999).
[Takaki99] Takaki, T. and Kitani, T.: Relevance Ranking of Documents Using
Query Word Co-occurences (in Japanese), Transactions of Information Processing Society of Japan, Vol. 40, No. SIG 8, pp. 74–84 (1999).
[Tamura98] Tamura, N. and Wada, K.: Text Structuring by Composition and
Decomposition of Segments (in Japanese), Journal of Natural Language Processing, Vol. 5, No. 1, pp. 59–78 (1998).
[Tombros98] Tombros, A. and Sanderson, M.: Advantages of Query Biased Summaries in Information Retrieval, Proc. of the 21st Annual International ACM
SIGIR Conference on Research and Development in the Information Retrieval, pp. 2–10 (1998).
[Vapnik95] Vapnik, V.: The Nature of Statistical Learning Theory, New York
(1995).
86
BIBLIOGRAPHY
[Voorhees00] Voorhees, E. M. and Tice, D.: Building a Question-Answering Test
Collection, Proc. of the 23rd Annual International ACM SIGIR Conference
on Research and Development in the Information Retrieval, pp. 192–199
(2000).
[Zechner96] Zechner, K.: Fast Generation of Abstracts from General Domain
Text Corpora by Extracting Relevant Sentences, Proc. of the 16th International Conference on Computational Linguistics, pp. 986–989 (1996).
List of Publications
Journal Papers
[1] Hirao, T., Kitauchi, A. and Kitani, T.: “Text Segmentation based on Lexical Cohesion and Word Importance (in Japanese),” Transaction of Information Processing Society of Japan, Vol.41, No.SIG3, pp.24-36, May 2000.
[2] Hirao, T., Sasaki, Y. and Isozaki, H.: “Question-Biased Text Summarization and Its Evaluation (in Japanese),” Journal of IPSJ, Vol.42, No.9,
pp.2259-2269, September 2001.
[3] Hirao, T., Kazawa, H., Isozaki, H., Maeda, E. and Matsumoto, Y.: “Machine Learning Approach to Multi-Document Summarization (in Japanese),”
Journal of Natural Language Processing, 2002. (to appear).
Conference Papers
[1] Hirao, T., Sasaki, Y. and Isozaki, H.: “An Extrinsic Evaluation for QuestionBiased Text Summarization on QA tasks,” In Proceedings of the NAACL
Workshop on Automatic Summarization, pp.61-68, June 2001.
[2] Hirao, T., Isozaki, H., Maeda, E. and Matsumoto, Y.: “Extracting Important Sentences with Support Vector Machines,” In Proceedings of the 19th
COLING, pp. 342-348, August 2002.
87
88
LIST OF PUBLICATIONS
List of Other Publications
[1] Hirao, T. and Kitani, T.: “Text Summarization based on Word Importance
(in Japanese),” IPSJ SIG-FI, FI-49-6, pp.41-47, 1998.
[2] Hirao, T., Kitauchi, A. and Kitani, T.: “Text Segmentation Based on Word
Importance and Lexical Cohesion (in Japanese),” IPSJ SIG-NLP,NLP-1306, pp.41-48, 1999.
[3] Hirao, T., Hatayama, M., Yamada, S. and Takeuchi, K.: “Text Summarization based on Hanning Window and Dependency Structure Analysis,”
In Proceedings of the 2nd NTCIR workshop, pp.242-247, 2001.
[4] Hirao, T., Maeda, E. and Matsumoto, Y.: “Important Sentence Extraction
Based on Support Vector Machines (in Japanese),” IPSJ SIG-FI, FI-63-16,
pp.121-127, 2001.
[5] Hirao, T., Sasaki, Y., Isozaki, H. and Maeda, E.: “NTT’s Text Summarization System for DUC-2002” In Proceedings of the Document Understanding
Conference 2002, pp. 104-107, 2002.
[6] Sasaki, Y., Isozaki, H., Taira, H., Hirota, K.,Kazawa, H., Hirao, T., Nakajima, H. and Kato, T.: “An Evaluation and Comparison of Japanese Question Answering Systems (in Japanese),” Technical Report of IEICE, NLC2000,
pp.17-24, 2000.
[7] Sasaki, Y., Isozaki, H., Taira, H., Hirao, T., Kazawa, H., Suzuki, J., Kokuryo,
K. and Maeda, E.: “SAIQA: A Japanese QA System Based on Large-Scale
Corpus (in Japanese),” IPSJ SIG-NLP, NLP-145, pp 77-82,2001.
Abbreviations
IEICE The Institute of Electronics, Information and Communication Engineers
NAACL North American Chapter of Association for Computational Linguistic
COLING International Conference on Computational Linguistic
LIST OF PUBLICATIONS
IPSJ Information Processing Society of Japan
SIG-NLP Special Interested Group on Natural Language Processing
SIG-FI Special Interested Group on Foundation of Informatics
89
© Copyright 2026 Paperzz