Chapter 5
Alloys of the Al-Cu-Mn-(Mg, Fe, Si) System
This chapter considers the phase composition of alloys with copper and manganese
as the main components. Many casting and wrought alloys of the 2XX.0 and 2XXX
series belong to this system. As these alloys often contain magnesium, silicon and
iron (as alloying elements or impurities), in most cases the analysis of at least
quaternary diagrams is required. First and foremost, this is the Al-Cu-Mg-Mn
diagram that is essential for the correct analysis of the phase composition of
important commercial alloys of the 2024 type. In these alloys, manganese has a
significant effect on the phase composition, which makes insufficient the use of the
ternary Al-Cu-Mg phase diagram only.
5.1. Al-Cu-Mn PHASE DIAGRAM
This phase diagram can be used to correctly analyze the phase composition of
224.0-type casting alloys and 2219-type wrought alloys at low concentrations of
magnesium, iron, and silicon impurities in them (Table 5.1). The use of only the
binary Al-Cu diagram is inadequate due to pronounced effects of Mn on the phase
composition and solidification reactions.
The aluminum corner of the Al-Cu-Mn diagram contains the AI2CU and Al6Mn
phases and a ternary compound usually designated as T. The ternary T phase has
a homogeneity range of 12.8-19% Cu and 19.8-24% Mn. Two formulae of the
compound - Al2oCu2Mn3 (15.3% Cu, 19.8% Mn) and Ali2CuMn2 (12.8% Cu,
22.1% Mn) - are possible within the limits of this concentration range. Up to 0.1%
Mn dissolves in the AI2CU phase, and about 0.2% Cu, in Al6Mn.
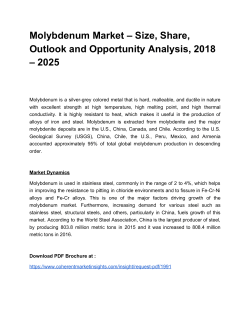
The invariant reactions occurring in Al-rich ternary alloys are hsted in Table 5.2,
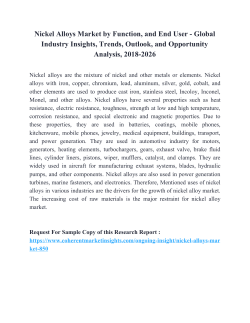
and the respective monovariant reactions - in Table 5.3. The Al-Cu-Mn diagram in
the Al-rich region is shown in Figure 5.1. Due to the close temperatures of the
ternary and binary (Al-Cu) eutectics, an addition of manganese does not noticeably
decrease the solidus of commercial alloys.
The mutual solubility of copper and manganese in soHd aluminum is given in
Table 5.4. These data suggest that in the range of 2XX.0 and 2XXX-series alloys the
equiUbrium solubiUty of Mn in (Al) is significantly lower than that in 3XXX-series
159
160
Multicomponent
Phase Diagrams: Applications for Commercial Aluminum
Alloys
Table 5.1. Chemical composition of some commercial alloys whose phase composition can be analyzed using Al-Cu-Mn phase diagram
Grade
Cu, %
Other
Mn, %
Mg,
224.0
AM5(rus)
2219
4.5-5.5
4.5-5.3
5.8-6.8
0.2-0.5
0.6-1.0
0.2-0.4
%
0.05
0.02
Si, %
Fe, %
0.06
0.3
0.2
0.1
0.3
0.3
Table 5.2. Invariant reactions in ternary alloys of Al-Cu-Mn system (Mondolfo, 1976; Drits et al., 1977)
Reaction
L + Al4Mn=^Al6Mn + Al2oCu2Mn3
L + Al6Mn=>(Al) + Al2oCu2Mn3
L=>(Al) + Al2Cu + Al2oCu2Mn3
Point in
Figure 5.1a
T, °C
Pi
P2
E
625
616
547.5
Concentrations in liquid phase
Cu, %
Mn, %
15.6
14.8
32.5
2.1
0.9
0.6
Table 5.3. Mono variant reactions in ternary alloys of Al-Cu-Mn system
Reaction
Line in
Figure 5.1a
T, °C
L=>(Al) + Al2Cu
L =^ (Al) + Al2oCu2Mn3
L=>(Al)-HAl6Mn
e2-E
P2-E
ei-P2
548-547
616-547
658-616
Table 5.4. Limit solid solubility of Cu and Mn in (Al) in Al-Cu-Mn alloys (Drits et al., 1977)
r, °c
623.5
616
610
600
550
547.5
525
500
450
400
(Al) + AlgMn + Al2oCu2Mn3
Cu, %
Mn, %
1.4
1,3
1.3
1.1
0.85
1.17
1.0
1.0
0.9
0.6
0.95
0.65
0.5
0.4
0.44
0.4
0.2
0.1
(Al) + AI2CU + Al2oCu2Mn3
Cu, %
Mn, %
5.5
4.95
4.05
2.55
1.5
0.2
0.2
0.2
0.15
0.1
Alloys of the Al-Cu-Mn~(Mg, Fe, Si) System
161
c
30 02
40
(a)
AI+Al20Cu2Mn3
Al
(b)
2
4
Cu,%
Figure 5.1. Phase diagram of Al-Cu-Mn system: (a) liquidus; (b) solidus.
alloys. However, this does not affect much the supersaturation of (Al) in Mn during
nonequiUbrium soUdification. In particular, according to our data on casting alloys
containing 5% Cu, the concentration of manganese in the solid solution supersaturated during soUdification can reach 2%. Major deviations from the equiUbrium
during soUdification are due to the formation of the nonequiUbrium (Al) -f- AI2CU
eutectics and a supersaturated soUd solution of Mn in (Al). The decomposition of the
latter during homogenization or another heat treatment associated with the heating
to over 300-350°C leads to the formation of Mn-containing dispersoids, mainly
represented by Al2oCu2Mn3.
162
5.2.
Multicomponent
Phase Diagrams: Applications for Commercial Aluminum
Alloys
A l - C u - M g - M n P H A S E DIAGRAM
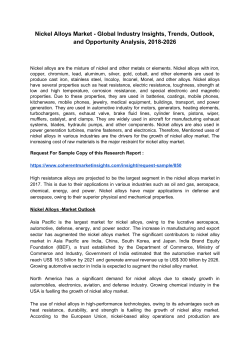
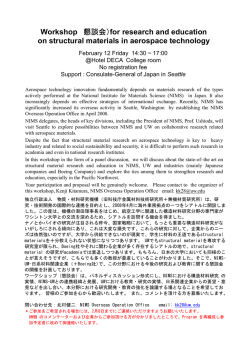
In spite of the importance of this system for the analysis of many 2XX.0- and 2XXXseries commercial alloys (Table 5.5), it remains poorly examined. Distribution of
phases in the solid state (Figure 5.2a) and Hquidus projection (Figure 5.2b) given by
Mondolfo (1976) as well as invariant soUdification reactions Usted in Table 5.6 are
largely hypothetical. According to this version of the phase diagram, only the phases
from the constituent binary and ternary systems can be in equilibrium with (Al)
in the quaternary system (see Sections 3.2, 4.1, 5.1). All monovariant lines of the
quaternary phase diagram lie close to the Al-Cu-Mg face of the concentration
tetrahedron, and the corresponding invariant points of the quaternary system
are close to those of the Al-Cu-Mg ternary system. As the effect of manganese on
the liquidus and solidus can be considered neghgible, the Al-Cu-Mg diagram can
serve as a reference in determining these temperatures for quaternary alloys (see
Section 3.2).
Table 5.5. Chemical composition of some commercial alloys whose phase composition can be analyzed using Al-Cu-Mg-Mn diagram
Grade
201.0
206.0
2037
2048
2224
2024
2001
Cu, %
4.0-5.0
4.2-5.0
1.4-2.2
2.8-3.8
3.8-4.4
3.8-4.9
5.2-6.0
Other
Mg, %
Mn, %
0.2-0.4
0.2-0.5
0.1-0.4
0.2-0.6
0.3-0.9
0.3-0.9
0.15-0.50
0.15-0.35
0.15-0.35
0.3-0.8
1.2-1.8
1.2-1.8
1.2-1.8
0.20-0.45
Si, %
Fe, %
0.05
0.1
0.5
0.15
0.12
0.5
0.20
0.1
0.15
0.5
0.2
0.15
0.5
0.20
Table 5.6. Invariant reactions in quaternary alloys of Al-Cu-Mg-Mn system (Mondolfo, 1976)
Reaction
Point in
Concentrations in liquid phase
Figure 3.4b
^
Cu, %
Mg, %
Si, %
L=^(Al) + Al2Cu + Al2CuMg + Al2oCu2Mn3
L + MnAl6=>(Al) + Al2CuMg + Al2oCu2Mn3 or
L + Al2oCu2Mn3 => (Al) + Al2CuMg + MnAlg
L + AlCuMg2=>(Al)-f Al6CuMg4 + Al6Mn
L=>(Al) + Al6CuMg4 + Alio(MgMn)3 + Al8Mg5
L + Al6Mn=^(Al)4-Al8Mg5 + Alio(MgMn)3
Ei
Pi*
-32
~6
-0.5
-503
P2
E2
P3
-10
-2.5
<2.5
-25
-30
<32
-0.3
-0.2
<0,2
-467
-447
* Mondolfo gives the second reaction (Mondolfo, 1976)
T,°C
163
Alloys of the Al-Cu-Mn~(Mg, Fe, Si) System
A12CU
^'f "^9
^'^^"^9^
Al20Cu2Mn3V
(a)
AlBMgs
Alio(MgMn)3
AleMn
Al2Cu E1 Al2CuMg
(b)
Figure 5.2. Phase diagram of Al-Cu-Mg-Mn system: (a) distribution of phase fields in the sohd state and
(b) polythermal projection of Hquidus.
Within the concentration Umits typical of commercial alloys ( < 1 % Mn),
manganese completely goes into the soHd solution during nonequiUbrium soHdification. In following heating, e.g. homogenization, Mn-containing dispersoids are
formed and the phase composition approaches equihbrium as shown in Figure 5.2a.
As copper and magnesium participate in the formation of two Mn-containing phases
(Al2oCu2Mn3 and Alio(MgMn)3), the precipitation of these dispersoids can decrease
the amount of free copper and magnesium in the solid solution available for
164
Multicomponent Phase Diagrams: Applications for Commercial Aluminum Alloys
the formation of precipitates based on AI2CU and Al2CuMg, which may affect
strengthening upon aging.
5.3. Al-Cu-Fe-Mn PHASE DIAGRAM
The Al-Cu-Fe-Mn phase diagram can be used in analyzing the effect of iron
impurity on the phase composition of 2219-type alloys at a low concentration of
silicon (Table 5.1). This quaternary diagram is also required for the construction of
five-component phase diagrams of systems containing manganese.
No true quaternary phases are formed in the aluminum corner of the Al-CuFe-Mn system. However, as the A^Mn and Al6(FeCu) phases are isomorphic, a
continuous series of soHd solutions is formed between them. The resultant phase field
is designated as (AlCu)6(FeCuMn) (Mondolfo, 1976). Mondolfo (1976) reports that
(AlCu)6(FeCuMn) crystals extracted from an alloy containing 7.76% Cu, 0.75%
Mn, and 1.5% Fe have an orthorhombic crystal structure with lattice parameters (2 = 0.7473 nm, Z? = 0.6452 nm, c = 0.8794 nm. These values are in good agreement with the lattice parameters of the Al6Mn and Al6(FeCu) phases (Sections 1.2
and 3.3).
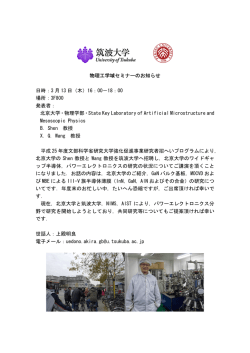
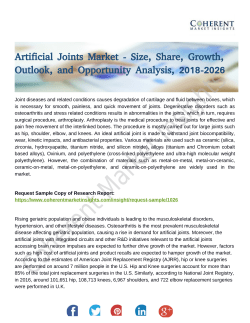
Figure 5.3 shows the distribution of phase regions in the solid state (a) and a
polythermal projection of the soHdification surface (b) in the aluminum corner of the
Al-Cu-Fe-Mn system.
This quaternary system is characterized by two invariant five-phase reactions
involving (Al) as shown in Table 5.7. The mono variant reactions are given in
Table 5.8. It should be noted that the monovariant line Cs-ps (Figure 5.3b) changes
its character from eutectic in point Cs (L =^ (Al) + AlsFe + Al6Mn) to peritectic in
point p3 (L -h AlsFe => (Al) -f- Al6(FeCu)).
The presence of the (AlCu)6(FeCuMn) phase within a broad compositional range
strongly impedes the analysis of alloys belonging to this system, because without
direct experimental determination it is difficult to assess how much of copper, iron,
and manganese is bound in this phase. Additional challenges are presented by nonequihbrium solidification of quaternary alloys in this system. In particular, the
following deviations from the equihbrium phase composition can occur: (a) formation of a supersaturated solid solution of Mn in (Al); (b) incomplete peritectic
reaction (Table 5.7); and (c) formation of nonequilibrium eutectics involving the
AI2CU phase at a comparatively low concentration of copper. The ternary Al-CuMn phase diagram cannot give correct answers because it does not take into account
reactions between Cu, Mn, and Fe. For example, the concentration of Mn in a
supersaturated solid solution of a quaternary alloy can be much lower than in the
Al-Cu-Mn system (Section 5.2), because some manganese binds to Fe-containing
phases during soHdification.
Alloys of the Al-Cu-Mn-(Mg,
Fe, Si)
165
System
A!6Mn
Al20Cu2Mn3
Al3Fe
(a)
Al6
Al2Cu
Al7
Ale - Al6(CuFeMn); Al7 - Al7CuFe2
AleMn
p3P2\e2^,2Q^
Al3Fe
Al7
(b)
Ale - Ale(CuFeMn); Al7 - Al7Fe2Cu
Figure 5.3. Phase diagram of Al-Cu-Fe-Mn system: (a) distribution of phase fields in the solid state and
(b) polythermal projection of liquidus.
Table 5.7. Invariant reactions in quaternary alloys of Al-Cu-Fe-Mn system
Reaction
Point in
Concentrations in liquid phase
Figuie 5.3b
Fe, %
Mn, %
^
Cu, %
L =^ (Al) + AI2CU + Al7Cu2Fe + AlsoCusMug
E
L + AUMn* =^ (Al) + AlyCusFe + AlsoCusMns P
* (AlCu)6(CuFeMn)
31-33
15-20
<0.5
<1
<0.5
<1
T, °C
>537
<587
166
3
&0
£
r^
m
rt
i/~>
rm
OO ^-H ( ^
»n ^
U-)
ir-- r - r o
CO oo oo cN
IT)
^O
un i n m m lo vo
m r- r- v i o ' ^
TjIT)
3
C1( (U
a
I
D,
W W m PH OH
I I I L L
;3
OJ (U OH
r-
< 1T
il
It +
CO
»0
i
CNI
>0
«n
vo
oo
to
o
u< o
< <o < < <
+ Pu + + +
+
3 3 3^
U < <
m
m
O
OO
ON m
1 J.
I
r- r-- r- rCO
ly^
I
CX) VO
T t '—
; W
r-
u
vo
f^
; ^ tiH
to vo m vo vo
I
s
5^
/—s /—s
/
\
^-^
/
V
^^< <<
0)
cd
"o
VH
03
1
s
Multicomponent Phase Diagrams: Applications for Commercial Aluminum Alloys
OQ
+++ ++
< < < < < 1
1)^ it fr ir H'
J J J J HJ
Alloys of the Al-Cu-Mn-(Mg,
AI2CU
Fe, Si) System
167
Al2oCu2Mn3
AlsMn
AhsMnsSia
(a)
AI2CU
Al20Cu2Mn3
AieMn
AI2C1
(b)
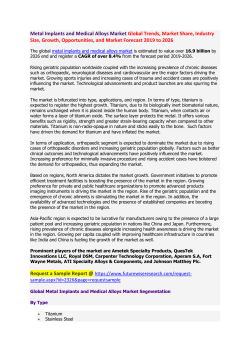
Figure 5.4. Phase diagram of Al-Cu-Mn-Si system: (a) distribution of phase fields in the solid state and
(b) poly thermal projection of liquidus.
5.4.
Al-Cu-Mn-Si PHASE DIAGRAM
The phase diagram of this system can be used for the analysis of phase composition
of alloys containing copper, manganese, and siUcon at a low content of iron
impurity, examples of such alloys are given in Table 5.9. This quaternary diagram is
also required for the evaluation of quinary alloys, i.e. the Al-Cu-Fe-Mn-Si system.
As in the case of the previous system, this phase diagram is also largely
hypothetical. The distribution of phases in the soUd state (Figure 5.4a) and hquidus
projection (Figure 5.4b), as well as solidification reactions (Tables 5.10 and 5.11), are
given according to the assessment by Mondolfo (1976). According to this variant,
only the phases from the constituent ternary systems can be in equihbrium with (Al)
168
Multicomponent Phase Diagrams: Applications for Commercial Aluminum Alloys
Table 5.9. Chemical composition of some commercial alloys whose phase composition can be analyzed
using Al-Cu-Mn-Si diagram
Grade
2003
2025
2021
Cu, %
4.0-5.0
3.5-5.0
5.6-6.8
Mn, %
Other
Si, %
0.3-0.8
0.4^1.2
0.2-0.4
<0.3
0.5-1.2
0.2
Mg, %
Fe, %
0.02
0.05
0.02
0.30
1.0
0.30
Table 5.10. Invariant reactions in quaternary alloys of Al-Cu-Mn- -Si system (Mondolfo, 1976)
Reaction
Point iin
Figure 5.4b
L => (Al) + AI2CU + (Si) + Al 15Mn3Si2
E
L + Al2oCu2Mn3 => (Al) -f A^Cu + Ali5Mn3Si2 P2
L + Al6Mn => (Al) + Al2oCu2Mn3 + Ali5Mn3Si2 Pi
Concentrations in liquid phase
Cu, ' Vo
Mn, %
Si, %
-25
-20
-15
-1
-1
-1.5
-5
-3
^4
r, °c
-517
-547
-597
in the Al-Cu-Mn-Si system. As manganese only slightly affects the liquidus and
solidus temperatures, the Al-Cu-Si diagram can be the reference in determining
these temperatures (Section 3.1).
In the range of Al-Cu alloys, depending on the ratio between siUcon and
manganese, no more than two of the following three phases - Al2oCu2Mn3, AI15
Mn3Si2, and (Si) - can be in equilibrium with (Al) and AI2CU. All these phases can
form during the solidification (mainly by eutectic reactions) and also precipitate
from (Al). In Al-Si alloys, only AI2CU and Ali5Mn3Si2 can be in equiUbrium with
(Al) and (Si). The AI2CU phase can be both of soHdification and secondary origin,
and the ternary compound mainly forms upon solidification as eutectic or primary
structure constituent.
Under nonequihbrium conditions, as in other systems with manganese, a supersaturated solid solution of Mn in (Al) can be formed during sohdification and
coohng in the solid state. As the concentration of silicon increases, the amount of the
Ali5Mn3Si2 phase formed during solidification goes up.
5.5. Al-Cu-Fe-Mn-Si PHASE DIAGRAM (FOR Al-Cu AND Al-Si ALLOYS)
The phase diagram of this quinary system provides sufficient information for
the correct analysis of the phase composition of many commercial alloys of
O
>
c3
c3
fl
o
(/3
r- r- !>• r^
IT)
ON
'-H
(^
IT)
r- Or-N
Fe, Si) System
•"
il
-^
'^
r+
^
ir^
r-
oo
ri-
^
IT)
W
00
W
^
PTH C L ;
^
PLH
^
CIH
^
£ 00 ^
3 r ^ "5
"^ .^ f^ o ri ^
^ ^
^-s .-^ J ^
^
H-I H-l H-l hJ H J hJ
^
J
ON
U^
9 L
(N
T^
<N
^
^
rjIT)
I
c
^
«N
12 5 U
.cr I ^
<N f^
HJ
H-l H-l h-l hJ
tr tr 1^ tr tr
^
u r P: ^ or
?
oo r- o\ oo vo
"^ r- "^ «r> ^
m » o ^o ^ ^
r^
I/O
r~-
^
»0
r- r~- r- r^
»n
^ ^ - ^ ^ V_^ -s.^ -^^ ^
< < << < ^^
^ It' -fr tr tr + +
^-V ^ ^
ou
<
< ^+ <^ u< 2.S
t tr
+ + + + + «^
+ +<t + i i
^^
U is k I- L l^ IN
W
uo »r> m u^ '^ v o ^o
<N
lo r- -"^ r-~ r-- ^
^
U-^
Alloys of the Al-Cu-Mn-(Mg,
V
o
3
tJO
s
cd
•£
,c
33
2
13
fc
,^
OS
>
o
o
ffl
169
170
Multicomponent
Phase Diagrams: Applications for Commercial Aluminum
Alloys
Table 5.12. Chemical composition of some commercial alloys whose phase composition can be analyzed
using Al-Cu-Fe-Mn-Si phase diagram
Grade
Cu, %
Mn, %
Si, %
Fe, %
Other
Mg, %
2003
2021
2219
308.0
383.0
208.2
4.0-5.0
5.6-6.8
5.8-6.8
4.0-5.0
2.0-3.0
3.5-4.5
0.3-0.8
0.2-0.4
0.2-0.4
0.3-0.1
0.3
0.2
0.2
0.30
0.5
0.5
0.3
5.0-6.0
9.5-11.5
2.5-3.5
0.3
1.0
1.3
0.8
Ni, %
0.10
0.10
0.10
1.0
0.02
0.02
0.02
0.1
0.1
Zn, %
0.3
0.03
0.2
2XXX-, 2XX.0-, and BXX.O-series that do not contain magnesium and nickel
(Tables 5.1, 5.5, and 5.12).
Assuming that only phases from the constituent quaternary systems can be in
equilibrium with (Al) in the Al-Cu-Fe-Mn-Si system, we suggest the distribution
of phase regions for Al-Si-rich and Al-Cu-rich alloys belonging to this system
according to the method described in Appendix 3.
Silicon-rich alloys. According to the quaternary diagrams Al-Fe-Mn-Si, Al-CuFe-Si, and Al-Cu-Mn-Si, only three phases - AI2CU, AlsFeSi, Ali5Mn3Si2 - can be
in equihbrium with (Al) and (Si). This conforms to one of the two following
invariant reactions:
L + AlsFeSi ^ (Al) + (Si) + AbCu + Ali5(FeMn)3Si2 or
L =^ (Al) -f (Si) -f AI2CU + AlsFeSi + Ali5(FeMn)3Si2.
Figure 5.5 presents the second variant. The assumed composition of the eutectic
point is as follows: ^--25% Cu, ^ 5 % Si, ~ 1 % Mn, and ~0.4% Fe, and the reaction
occurs at '^516°C. The Al-Si-rich portion of the phase diagram is characterized by
a wide homogeneity range of the Ali5(FeMn)3Si2 phase (Figure 5.5a). If the
concentrations of iron and manganese are small, i.e. the silicon phase forms earlier,
and if the concentration of copper exceeds 4%, then only eutectic reactions occur
during equiUbrium solidification of quinary Si-rich alloys, as illustrated in
Figure 5.5b and Tables 5.13 and 5.14.
It should be noted that the suggested version differs from that given by Phragmen
(1950) according to whom the Al7Cu2Fe phase, not AlsFeSi, is in equihbrium with
(Al) and (Si), which leads to the hypothetical eutectic equilibrium:
L ^ (Al) + (Si) -f AI2CU + Al7Cu2Fe + Ali5(FeMn)3Si2.
Alloys of the Al-Cu-Mn-(Mg,
Fe, Si) System
171
AIsFeSI
(a) AI2CU
Aii5Mn3Si2
AlsFeSi
(b) AI2CU ®2
Ali5Mn3Si2
Figure 5.5. Phase diagram of Al-Cu-Fe-Mn-Si system in the range of Al-Si alloys: (a) distribution of
phase fields in the sohd state and (b) polythermal projection of hquidus.
Copper-rich alloys. In the quaternary systems Al-Cu-Fe-Mn, Al-Cu-Fe-Si, and
Al-Cu-Mn-Si the following phases - (Si), Al7Cu2Fe, Al2oCu3Mn2, AlsFeSi, and
Ali5Mn3Si2 - can be in equiUbrium with (Al) and AI2CU. This suggests the
occurrence of three invariant reactions in the Al-Cu-rich region of the quinary
system (Table 5.15).
These invariant reactions in Table 5.15 differ from those given by Mondolfo
(1976), according to whom the eutectic transformation L =^ (Al) + (Si) + AI2CU +
172
Multicomponent
Phase Diagrams: Applications for Commercial Aluminum
Alloys
Table 5.13. Monovariant reactions in quinary alloys of Al-Cu-Fe-Mn-Si system with
participation of (Al) and (Si) phases
Reaction
Line in
Figure 5.5b
T, °C
L => (Al) + (Si) + AI2CU + AlsFeSi
L =» (Al) -H (Si) + AbCu + Al,5(FeMn)3Si2
L + AlsFeSi => (Al) -f (Si) + Ali5(FeMn)3Si2
Ci-E
e2-E
I^E
525-516
517-516
575-516
iransiorms ic) L => (^Aij -t- y^\) -I- Aii5i^reMn;3:M2-I-A isreiM
Table 5.14. Bivariant reactions in quinary alloys of Al-Cu -Fe-Mn-Si system with
participation of (Al) and (Si) phases
Reaction
Field in Figure 5.5b
r, °c
L=>(Al) + (Si)-+-Al2Cu
L =^(A1) +(Si) + AlsFeSi
L =» (Al) + (Si) -H Ali5(FeMn)3Si2
Al2Cu-ei-E-e2
AlsFeSi-p-E-Ci
Ali5Mn3Si2-e2-E-p
515-516
576-516
575-516
Table 5.15. Invariant reactions in quinary alloys of Al-Cu-Fe-Mn-Si system with participation of (Al)
and AI2CU phases
Reaction
L => (Al) + AI2CU + (Si) + AlsFeSi
+ Alis(FeMn)3Si2
L + Al7Cu2Fe => (Al) + A^Cu + AlsFeSi
+ Alis(FeMn)3Si2;
L + Al2oCu3Mn2 =» (Al) + A^Cu
+ Alis(FeMn)3Si2
+ Al7Cu2Fe
Point in
Figure 5.6b
Concentrations in liquid phase
Cu, %
Fe, %
Mn, %
r, °c
Si, %
-25
-0.4
-5
-516
-25
-0.4
-4
-533
-20
-0.3
-3
-546
Al7Cu2Fe-f Ali5(FeMn)3Si2 takes place. Mono- and bivariant reactions in this
system are listed in Tables 5.16 and 5.17, respectively.
Figure 5.6 presents a version of this system based on the constitution of the
constituent quaternary diagrams, by taking into account a wide homogeneity range
of the Ali5(FeMn)3Si2 phase.
5.6. Al-Cu-Mg-Mn-Si PHASE DIAGRAM (FOR Al-Cu AND Al-Si ALLOYS)
This quinary system makes it possible to analyze the phase composition of many
commercial 2XXX-, 2XX.0-, 6XXX-, and 3XX.0-series alloys with minor content of
Alloys of the Al-Cu-Mn-(Mg,
Fe, Si) System
173
Al20Cu2Mn3
Aii5Mn3Sl2
(a) Al7Cu2Fe
AlsFeSI
(SI)
Al20Cu2Mn3
(b) Al7Cu2Fe
p2 ea
(Si)
Figure 5.6. Phase diagram of Al-Cu-Fe-Mn-Si system in the range of Al-Cu alloys: (a) distribution of
phase fields in the solid state and (b) poly thermal projection of liquidus.
iron and nickel (Table 5.18). It is especially important for the analysis of 2214-type
alloys, in which Cu, Mg, Mn, and Si are intentional additions and have a significant
effect on the phase composition.
Assuming that only those phases that are available in the constitutive quaternary
systems can be in equilibrium with (Al) in the Al-Cu-Mg-Mn-Si system, we suggest
the distribution of phase regions for Al-Si and Al-Cu alloys according to the
method described in Appendix 3.
174
Multicomponent
Phase Diagrams: Applications for Commercial Aluminum
Alloys
Table 5.16. Monovariant reactions in quinary alloys of the Al-Cu-Fe-Mn-Si system with participation of
(Al) and AI2CU phases
Reaction
Line in
Figure 5.6b
r,°c
L ^ (Al) + AI2CU + (Si) + Ali5(FeMn)3Si2
L =» (Al) + AI2CU + (Si) + AlsFeSi
L => (Al) + AI2CU + AlsFeSi + Ali5(FeMn)3Si2
L + Al2oCu3Mn2 =^ (Al) + AI2CU + Al,5(FeMn)3Si2
L => (Al) + AI2CU + Al2oCu3Mn2 + Al7Cu2Fe
L + Al7Cu2Fe ^ (Al) + AI2CU + AlsFeSi
L ^ (Al) + AI2CU + Ali5(FeMn)3Si2 + Al7Cu2Fe
e2-E
e3-E
P2-E
Pi-Pi
ei-Pi
P2-P2
P1-P2
517-516
525-516
533-516
547-546
537-546
534-533
546-533
Table 5.17. Bivariant reactions in quinary alloys of the Al-Cu-Fe-Mn-Si system with participation of
(Al) and AI2CU phases
Reaction
Field in Figure 5.6b
T, °C
L ^ (Al) + AI2CU + Al7Cu2Fe
L => (Al) + AI2CU + Al2oCu2Mn3
L => (Al) + AI2CU + Ali5(FeMn)3Si2
L ^ (Al) + AI2CU + AlsFeSi
L ^ (Al) + AI2CU + (Si)
Al7Cu2Fe-ei-Pi-P2 -P2
Al2oCu2Mn3- Pi-Pi ^ 1
Pi -^2-E-P2-Pi
P2 -P2-E-«3
(Si)-^3-E-e2
545-533
547-546
547-533
525-516
525-516
Table 5.18. Chemical composition of some commercial alloys whose phase composition can be analyzed
using Al-Cu-Mg-Mn-Si phase diagram
Grade
Cu, %
Mn, %
Si, %
Other
Mg, %
Fe, %
2038
2017
2214
222.1
6066
6111
6013
B319.1
328.1
392.1
0.8-1.2
2.5-4.5
3.9-5.0
9.2-10.7
0.7-1.2
0.5-0.9
0.6-1.1
3.0-4.0
1.0-2.0
0.4^.8
0.1^.4
0.4-1.0
0.4^1.2
0.5
0.6-1
0.15-0.45
0.2-0.8
0.8
0.2-0.6
0.2-0.6
0.5-1.5
0.2-0.8
0.5-1.2
2
0.9-1.8
0.7-1.1
0.6-1.0
5.5-6.5
7.5-8.5
18-20
0.4-1
0.4^.8
0.2-0.8
0.2-0.35
0.8-1.4
0.5-1.0
0.8-1.2
0.15-0.5
0.25-0.6
0.9-1.2
0.6
0.7
0.3
1.2
0.5
0.4
0.5
0.9
0.8
1.1
Ni, %
0.5
0.5
0.25
0.5
Zn, %
0.25
0.25
0.25
0.8
0.25
0.25
0.25
1.0
1.5
0.4
Alloys of the Al-Cu-Mn-(Mg,
Fe, Si)
175
System
Silicon-rich alloys. According to the Al-Mg-Mn-Si, Al-Cu-Mg-Si, and Al-CuMn-Si quaternary diagrams, only four phases - Mg2Si, AI2CU, Al5Cu2Mg8Si6, and
Ali5Mn3Si2 - can be in equilibrium with (Al) and (Si). This suggests the possibihty
of two invariant reactions shown in Table 5.19 (Mondolfo, 1976). Bi- and monovariant reactions which can proceed in Al-Si-rich alloys are given in Figure 5.7b and
Tables 5.20 and 5.21. The distribution of the phases in the soUd state is characterized
by the presence of only two five-phase regions as shown in Figure 5.7a.
Copper-rich alloys. In the quaternary systems Al-Cu-Mn-Mg, Al-Cu-Mn-Si,
and Al-Cu-Mg-Si, the following phases - (Si), Al2oCu3Mn2, Ali5Mn3Si2, Mg2Si,
Al2CuMg, and Al5Cu2Mg8Si6 - can be in equiUbrium with (Al) and AI2CU. We
Table 5.19. Invariant reactions in quinary alloys of Al-Cu-Mg-Mn-Si system with (Al) and (Si) phases
Reaction
Point in
Figure 5.7b
L=^(Al) + (Si) + Al2Cu
+ AlsCusMggSie + AlisMnsSis
L+ Mg2Si + (Si) =» (Al) + AlsCusMggSie
+ Ali5Mn3Si2
Concentrations in Hquid phase
r, °c
Si, %
Cu, %
Mg, %
Mn, %
~6
-28
-2
-1
-505
-10
-14
~3
-1
-528
Table 5.20. Monovariant reactions in quinary alloys of Al-Cu-Mg-Mn-Si system
with (Al) and (Si) phases
Reaction
Line in
Figure 5.7b
r, °c
L =^ (Al) + (Si) + AI2CU + AlsCusMggSie
L =^ (Al) + (Si) + AI2CU + Ali5Mn3Si2
L =^ (Al) -f (Si) + Al5Cu2Mg8Si6 + Ali5Mn3Si2
L ^ (Al) + (Si) + Mg2Si + Ali5Mn3Si2
L + (Si) + Mg2Si =» (Al) + Al5Cu2Mg8Si6
Ci-E
e3-E
P-E
e2-P
p-P
507-505
517-505
528-517
567-528
529-528
Table 5.21. Bivariant reactions in quinary alloys of Al-Cu-Mn-Mg-Si system with (Al) and (Si) phases
Reaction
Field in Figure 5.7b
T, °C
L=^(Al) + (Si) + Al2Cu
L =^ (Al) + (Si) + Al5Cu2Mg8Si6
L =^ (Al) + (Si) + Ali5Mn3Si2
L=^(Al) + (Si) + Mg2Si
Al2Cu-ei-E-e3
p-P-E-ei
All 5Mn3Si2-e3-E-P-e2
Mg2Si-e2-P-pi
525-516
529-516
573-517
555-528
176
Multicomponent Phase Diagrams: Applications for Commercial Aluminum Alloys
Mg2Sl
Al5Cu2Mg8Si6
(a) Al2Cu
Ali5Mn3Si2
Mg2Si
A~Ae2
/
/
\
Al5Cu2Mg8Si6
\ p
/
< ^
ei/\
[E/'
' \ . ' ' ' \ / \ / \
(b)
Al2Cu
63
Ali5Mn3Si2
Figure 5.7. Phase diagram of Al-Cu-Mg-Mn-Si system in the range of Al-Si alloys: (a) distribution of
phase fields in the solid state and (b) polythermal projection of hquidus.
suggest a variant of polyhedration of this system shown in Figure 5.8. Table 5.22 lists
invariant reactions that occur in Al-Cu-rich alloys of this system. Note that the
eutectic reaction E2 differs from that given by Mondolfo, with the Ali5Mn3Si2
phase participating instead of Al2oCu3Mn2. In our version of the phase diagram, we
take into account that the Al2oCu3Mn2 phase disappears through a peritectic
reaction from the Al-Cu-Mn-Si system (P2 in Table 5.10). Mono- and bivariant
reactions which can proceed in Al-Cu-rich alloys are given in Tables 5.23 and 5.24,
respectively.
Alloys of the Al-Cu-Mn-(Mg,
Fe, Si)
177
System
Al2CuMg
Mg2Si
Al5Cu2Mg8Si6
(a)
SI
All5Mn3Sl2
Al20Mn3Cu2
Al2CuMg
Q2i
Al5Cu2Mg8Si6
(b)
Si
Al20Cu2Mn3
Figure 5.8. Phase diagram of Al-Cu-Mg-Mn-Si system in the range of Al-Cu alloys: (a) distribution of
phase fields in the solid state and (b) poly thermal projection of liquidus.
Table 5.22. Invariant reactions in quinary alloys of Al-Cu--Mg-Mn-Si system with (Al) and AI2CU phases
Reaction
L =^ (Al) + AI2CU + (Si) + Al5Cu2Mg8Si6
+ Ali5Mn3Si2
L + Mg2Si ^ (Al) + AI2CU + Al5Cu2Mg8Si6
+ Ali5Mn3Si2
L => (Al) + AI2CU + AbCuMg + Mg2Si
+ Ali5Mn3Si2
L + Al2oCu3Mn2 =» (Al) + A^Cu + Mg2Si
+ Ali5Mn3Si2
Point in
Figure 5.8b
Concentrations in liquid phase
Si, %
Cu, %
Mg, %
T, °C
Mn, %
Ei
'6
~28
-2
-505
Pi
'3
-31
-3
-511
E2
'0.3
-30
-7
-500
P2
'0.4
-30
-6
-502
178
Multicomponent
Phase Diagrams: Applications for Commercial Aluminum
Alloys
Table 5.23. Monovariant reactions in quinary alloys of Al-Cu-Mg-Mn-Si system with (Al) and AI2CU
phases
Reaction
Line in Figure 5.8b
r, °c
L => (Al) + AI2CU + (Si) + AlsCusMggSie
L =^ (Al) + AI2CU + (Si) + Ali5Mn3Si2
L ^ (Al) + AI2CU + Al5Cu2Mg8Si6 4- Ali5Mn3Si2
L ^ (Al) + AI2CU + AbCuMg + Mg2Si
L =^ (Al) + AI2CU + A^CuMg + Al2oCu3Mn2
L =^ (Al) + AI2CU + Ali5Mn3Si2 + A^CuMg
L + Mg2Si =^ (Al) + AI2CU + Al5Cu2Mg8Si6
L + Al2oCu3Mn2 ^ (Al) + A^Cu + Ali5Mn3Si2*
L =^ (Al) + AI2CU + Mg2Si + Ali5Mn3Si2
ei-Ei
e4-Ei
Pi-Ei
e2-E2
e3-P2
P2-E2
Pi-Pi
P2-P2
e5-E2
and 65--Pi
507-505
517-505
511-505
505-500
503-502
502-500
512-511
547-502
514-500
514-511
* May transform to a eutectic reaction
Table 5.24. Bivariant reactions in quinary alloys of the Al-Cu-Mn-Mg-Si system with (Al) and AI2CU
phases
Reaction
Field in Figure 5.8b
T, °C
L=>(Al) + Al2Cu + (Si)
L ^ (Al) + AI2CU + Al5Cu2Mg8Si6
L =^ (Al) + AI2CU + Ali5Mn3Si2
L => (Al) + AI2CU 4- AbCuMg
L=:>(Al) + Al2Cu + Mg2Si
L => (Al) + AI2CU + Al2oCu3Mn2
(Si)-ei-Ei-^4
Pi-Pi-Ei-^i
P2-e4-Ei-Pi-e5-E2-P2
Al2CuMg-e3-E2-e2
Pi-e2-E2-€5-Pi
Al2oCu3Mn2-p2-P2-e3
525-505
512-505
547-505
505-499
515^99
547-514
5.7. Al-Cii-Mn-<Mg, Si) WROUGHT AND CASTING ALLOYS (2XXX, 2XX, AND
3XX SERIES)
The easiest alloys for the analysis are those containing only copper and manganese.
However, they are not too many (Table 5.1), as commercial alloys usually have
impurities of Fe and Si. The isothermal sections at 540 and 200°C appear to be the
most characteristic sections and are shown in Figure 5.9a, b. The section at 540°C
shows that 224.0-type alloys in T4 state contain only Al2oCu2Mn3 as an excess phase,
whereas 2219-type alloys have also the AI2CU phase. The section at 200°C
demonstrates that in T7 state all alloys of this group are three-phase alloys.
During solidification, copper participates in eutectic reactions. The resultant
eutectics is usually divorced and appears as AI2CU veins at dendritic cell boundaries.
Polythermal section at 0.6% Mn in Figure 5.9c demonstrates that this eutectics is
nonequilibrium in 224.0-type alloys. Manganese, on the contrary, can be completely
Alloys of the Al-Cu-Mn-(Mg,
Fe, Si) System
179
(AI)+T+Al6Mn
Mn.% 3
(AI)+Al6Mn
(a)
(AI)+Al2Cu
Mn,%3
(AI)+Al6Mn|
Cu, %
(AIHT
(AI)kT+Al2Cu
224.aj^^^ j b j j
2
(b)
I
3 \4 5 6
l)+Al2Cu
7
8
9 10
Cu, %
40g
(AI)+Al6Mn
(C)
AI-0.6%Mn
Figure 5.9. Isothermal (a, b) and polythermal (c) sections of Al-Cu-Mn phase diagram: (a) 540°C; (b)
200°C; and (c) 0.6%Mn with compositional ranges of AM5rus, 224.0, and 2219 alloys (note that the Mn
content in a 2219 alloy in (c) is above the grade limit). T - Al2oCu2Mn3.
dissolved in (Al) during nonequilibrium solidification, even though its maximum
equihbrium solubiUty in (Al) at room temperature does not exceed 0.05%. During
high-temperature anneals, nonequiUbrium AI2CU particles dissolve in (Al), while
Al2oCu2Mn3 dispersoids precipitate as a result of decomposition of the aluminum
solid solution supersaturated in Mn (in accordance with Figure 5.9a). These
dispersoids remain virtually unchanged during downstream processing and use.
So, the as-quenched structure consists of the aluminum soHd solution supersaturated
180
Multicomponent Phase Diagrams: Applications for Commercial Aluminum Alloys
T=200 °C
8
7
6
O 3
2
1
0
0.2
^
1
AI2CU
M"^
T "'""''
0.4
0.6
0.8
Mn, % at 6.5% Cu
1
Figure 5.10. Calculated dependence of volume fractions of phases on Mn content in AM5 (rus) (Table 5.1)
alloy at 6.5% Cu (200°C)
with copper and (AlCuMn) dispersoids of sub-micron size. During subsequent aging,
copper precipitates from the sohd solution, forming hardening, metastable phases
0'^ and 9' (AI2CU). Figure 5.10 shows that additions of Mn decrease the amount of
copper available for hardening as part of copper is bound in the Al2oCu2Mn3 phase.
For example, the volume fractions of Al2oCu2Mn3 and AI2CU particles are 3 and
5 vol.%, respectively, in an annealed AM5 alloy of the average composition (5% Cu,
0.8% Mn, Table 5.1).
An impurity of iron (>0.1%) in 224.0-type alloys results in the formation of Fecontaining phases (Backerud et al., 1990). At low silicon concentration, the appearance of the Al7Cu2Fe phase is most likely. This phase is formed through eutectic
reactions listed in Tables 5.7 and 5.8, and its maximum volume fraction is about
1.2 vol.% at a concentration of 0.3% of Fe.
The effect of manganese on the phase composition of a 224.0-type alloy (5% Cu,
0.2% Fe) is shown in Figure 5.11a, and the combined influence of iron and
manganese can be traced in an isothermal section at 5% Cu in Figure 5.11b. At a
temperature of homogenization (540°C), 224.0- and AM5-type alloys (Table 5.1),
irrespective of the Fe:Mn ratio, fall into the phase region (Al) + Al7FeCu2 +
Al2oCu2Mn3 in Figure 5.11b.
The analysis of alloys containing silicon starts with the Al-Cu-Mn-Si phase
diagram. Figure 5.12 giving some of the relevant sections. The isothermal sections
at 0.5% Mn (Figure 5.12a, b) show that silicon should be completely dissolved in the
solid solution during homogenization of 2003-type alloys containing relatively
small amounts of silicon (see compositions in Table 5.9). At higher Si concentrations,
e.g. in 208.2-type alloys (Table 5.12), silicon participates in the formation of
Ali5Mn3Si2 and (Si) phases (Figure 5.12b). Note that silicon considerably decreases
the solidus of Al-Cu alloys. Therefore, the maximum homogenization temperature
Alloys of the Al~Cu-Mn-(Mg,
Fe, Si)
181
System
T, "C
Al - 5% Cu - 0.2% Fe
0.5
(a)
640 •C
Fe, % 1
1 c^
1 3
(AI)+Al7Cu2Fe+T
1^
O.Shi.
(Al)
tii S
0.02tn
(b)
1 (^
AI-5%CU 0-225
11
(Al)+T
/
^
1
Mn, %
Figure 5.11. Polythermal (a) and isothermal (b) sections of Al-Cu-Mn-Fe phase diagram at 5% Cu:
(a) 0.2% Fe and (b) 540°C.
should be strictly controlled and lowered in the case of alloys containing more than
1% Si (see Figure 5.12b).
The effect of silicon on the soHdification sequence in 2XX.0-series alloys is
illustrated in Figure 5.12c with an isopleth at 5% Cu and 1.5% Mn. The higher than
usual concentration of Mn is necessary to show the peritectic reaction L + A^Mn =^
(Al) + Al2oCu2Mn3 + Ali5Mn3Si2 (Pi in Figure 5.4b and Table 5.10) and to assure
182
Multicomponent Phase Diagrams: Applications for Commercial Aluminum Alloys
2.9
-oCO
a+(Si)
a+^Si)
0.60
0.19
0.08
Al6Mn\ Al6Mn+T
(a)
8
Cu. %
AleMi
AI-0.5%Mn 1
(b)
Cu.
Figure 5.12. Isothermal (a, b) and polythermal (c, d) sections of Al-Cu-Mn-Si phase diagram: (a) 0.5%
Mn, 450°C; (b) 0.5% Mn, 540X; (c) 5% Cu and 1.5% Mn; and (d) 3% Si and 0.5% Mn. a - AlisMngSia,
T - Al2oCu2Mn3, 9 - AI2CU. All phase fields in (a) and (b) contain also (Al).
Alloys of the Al-Cu-Mn-(Mg,
Fe, Si) System
183
T, X
L+(AI)
628
L+(AI)+Al6Mn+a
^•^ -^^\A'i
0597
510
(C)
AI-5%Cu-1.5%Mn
SI, %
)517
(d)
AJ-0.5% Mn-3% SI
Cu,%
Figure 5.12 {continued)
184
Multicomponent Phase Diagrams: Applications for Commercial Aluminum Alloys
the primary solidification of (Al). With this, the poly thermal section in Figure 5.12c
can also be used for the analysis of more complex alloys containing copper and
manganese. In alloys containing less than 2% Si, the (Al) + Al6Mn eutectics solidifies
next to primary (Al) grains. However, the Al6Mn phase is not retained in the soUd
state as it disappears during peritectic reactions shown in Tables 5.10 and 5.11
(Pi-Pi, P2-P1, Pi). The same isopleth shows that Al2oCu2Mn3 is present only in
alloys with less than 1% Si. By taking into account that most of 1.5% Mn (almost all
of it in low-silicon alloys) remains in aluminum soHd solution during nonequiUbrium sohdification, this section can be used to determine the phase composition of
dispersoids, e.g. an alloy with 5% Cu, 1.5% Mn, and 0.7% Si does not contain
Al2oCu2Mn3 precipitates.
Manganese present in Cu-containing, low-iron 308.0-type alloys (Table 5.12) can
form only one phase - Ali5Mn3Si2. According to the Al-Cu-Mn-Si phase diagram,
this phase is formed either by binary or ternary eutectic reaction (p2-Pi-P2-E-e2
region or e2-E Hne in Figure 5.4b and Table 5.11). The equiUbrium solidification
(at a copper concentration less than 4.5%) ends with the formation of the ternary
eutectics. At a higher copper concentration (upper limit of a 308.0 alloy), and at any
copper concentration under nonequilibrium conditions, the sohdification ceases with
the invariant eutectic reaction L => (Al) + AI2CU + (Si) -f Ali5Mn3Si2 at 517°C (point
E in Figure 5.4b and Table 5.10). Figure 5.12d shows relevant polythermal sections
at 3% Si and 0.5% Mn. By further increasing the concentration of Si (>4%), the
(Al)-fAli5Mn3Si2 eutectics is substituted for the (Al)-f(Si) eutectics, otherwise
the boundaries in Figure 5.12d remain unchanged.
To analyze the effects of iron and silicon impurities on the phase composition of
2219-type alloys (compositions in Table 5.12), one should use the Al-Cu-Fe-Mn-Si
phase diagram. It follows from the phase distribution in the solid state (Figure 5.6a)
that the combined presence of Fe and Si in most cases leads to the formation of the
Ali5(FeMn)3Si2 phase, mainly of the eutectic origin.
The combined effect of copper and magnesium can be followed by isothermal
sections of the Al-Cu-Mg-Mn phase diagram at 0.5% Mn (i.e. at the average
manganese concentration in most 2XX.0- and 2XXX-type alloys). The section at
500°C in Figure 5.13a shows that in a 206.0-type alloy (Table 5.5), containing copper
and magnesium at the upper limit, a minor amount of eutectic-origin AI2CU and
Al2CuMg particles can be preserved after quenching, in addition to Al2oCu2Mn3
dispersoids. After aging, this alloy contains AI2CU and Al2CuMg phases in the form
of metastable precipitates (Figure 5.13b).
At a higher magnesium content, e.g. in a 2224-type alloy (Table 5.5), the phases
AI2CU, Al2CuMg, Al2oCu2Mn3, and Al6Mn can be found after solution treatment
(Figure 5.13a). At least one of the Mn-containing phases is also present as
dispersoids. The same selection of phases forms the phase composition after aging as
Alloys of the Al-Cu-Mn-(Mg,
Cu, %
Fe, Si) System
185
(AI)+e+Al20+S
(Al)+Al6
(a) AI-0.5%Mn
\
Cu.% (AI)+Al20+e
7
i
i
\
i
i
I
t i
Mg, %
(Al)+Al20+S
~Pf/
4J(Ai)+Ai2o+s+e / Z ^
-(AI)+AI6+T+AI10
^AI)+AI10+T
(AI)+Allo+p+T
.(AI)+AllO+p
AI-0.5%Mn
(b)
Mg, %
Figure 5.13. Isothermal sections of Al-Cu-Mg-Mn phase diagram at 0.5% Mn: (a) 500°C and (b) 200°C.
Compositional range of a 206.0 alloy is shown.
186
Multicomponent
Phase Diagrams: Applications for Commercial Aluminum
Alloys
shown in Figure 5.13b, though the AI2CU and Al2CuMg phases (mostly in
metastable modifications) are now represented by secondary precipitates.
The calculated dependences of the volume fractions {Qy) of phases on Mn and Mg
concentration in 2024 alloy are given in Figure 5.14. It is interesting to note that the
increased Mn concentration not only increases the amount of Al2oCu2Mn3
dispersoids (which is expected) but also considerably decreases the amount of the
main hardening phase Al2CuMg.
The phase composition of 2014-type alloys at a low concentration of iron
impurity can be analyzed using the distribution of phase fields in the soUd state
shown in Figure 5.8a. As this alloy has a broad compositional range (see Table 5.18),
its phase composition in the solid state can vary. In equilibrium with (Al), besides
the AI2CU phase, can be all six phases - Mg2Si, (Si), Al5Cu2Mg8Si6, Ali5Mn3Si2,
AI-4.3% Cu-1.5% Mg-Mn (2024)
7
*"<*.....,^/UZCulll9
6
5 .1
^^
' ^^^^^^
' -^-^^^
-'*** *"*".'
0 ^
^*
1
AQ0Cii2Mn3
2
1
^ ^ ^
^
-^ ^
^
^
§•'
AKMn
|_,.^,,g>j*;^^^
^
0
(a)
0.4
0.8
1.2
Mln,%
AM.3% Cu-0.6% Mn-Mg (2024)
(b)
Mg,%
Figure 5.14. Calculated dependences of volume fractions of phases on Mn (a) and Mg (b) content in a
2024 alloy at 4.3% Cu (<100°C): (a) 1.5%Mg; (b) 0.6%Mn.
Alloys of the Al~Cu-Mn-(Mg, Fe, Si) System
187
Al2CuMg, and Al2oCu3Mn2 - occurring in the corresponding region of the Al-CuMn-Mg-Si system.
Alloys of the 6XXX series containing copper and manganese and an excess of
Si over Mg2Si, e.g. a 6066 alloy in Table 5.18, can be in first approximation analyzed
using the Si-rich part of the Al-Cu-Mg-Mn-Si phase diagram (Figure 5.7a). As the
AI2CU phase is not Hkely to be formed in these alloys, only three phases can be
in equilibrium with (Al) and (Si), i.e. Mg2Si, Al5Cu2Mg8Si6, and Ali5Mn3Si2. An
impurity of iron can completely dissolve in the last phase. The same applies to
casting 3XX.0-series alloys with copper and manganese (Table 5.18) with only one
difference - the AI2CU phase does form in these alloys.
A number of phases in the as-cast (nonequiUbrium) state can be larger than that
under equiUbrium conditions, but the sequence of soUdification reactions is in
general agreement with the corresponding phase diagrams. Tables 5.25 and 5.26 give
as an example the sohdification reactions identified during nonequilibrium solidification of 206.2 and 2024 alloys (Backerud et a l , 1986, 1990). These alloys belong to
the Al-Cu-Mg-Mn system but the presence of Fe and Si impurities requires the
analysis of the six-component system. Even small amounts of Fe (0.03%) and Si
(0.05%) in a 206.2 alloy cause the formation of phases containing these elements
(Table 5.25). The first reactions are in agreement with the Al-Cu-Fe-Mn phase
diagram (Figure 5.3, Tables 5.7 and 5.8) with the sequential formation of (Al),
Al6(MnCuFe), Al2oCu2Mn3, and Al7Cu2Fe phases. The solidification ends with the
formation of AI2CU, Mg2Si, and Al2CuMg phases, though the analysis of quinary
Al-Cu-Fe-Mg-Mn (Figure 5.6) and Al-Cu-Mg-Mn-Si (Figure 5.8) phase diagrams
suggests that there should be more than one reaction with participation of these
phases. The version suggested by Backerud et al. (1986) may be a consequence of
very small amounts of Mg2Si and Al2CuMg phases in the as-cast structure.
The as-cast structure of a 2024 alloy that contains more magnesium (1.56%), iron
(0.23%), and silicon (0.21%) exhibits particles of the Ali5(MnCuFe)3Si2 phase that is
Table 5.25. Solidification reactions under nonequilibrium conditions in a 206.2 alloy (4.36% Cu, 0.30%
Mg, 0.26% Mn, 0.05% Si, and 0.03% Fe) (Backerud et al, 1990)
Reaction
L=^(A1)
L=»(Al) + Al6(MnCuFe)
L + Al6(MnCuFe) ^ (Al) + AlsoCusMug
L =» (Al) + Al2oCu2Mn3 + A^Cu + AlyCusFe
L =j. (Al) + AI2CU + AbCuMg + Mg2Si
Solidus
Temperatures (°C) at a cooling rate
0.3 K/s
4.5 K/s
651-649
649-625
625-529
529-521
651-641
641-618
618-527
527-505
505-495
495
521
188
Multicomponent Phase Diagrams: Applications for Commercial Aluminum Alloys
Table 5.26. Solidification reactions under nonequilibrium conditions in a 2024 alloy (4.44% Cu, 1.56%
Mg, 0.55% Mn, 0.21% Si, and 0.23% Fe) (Backerud et al., 1986)
Temperatures CQ at a cooling rate
Reaction
L=^(A1)
L =^ (Al) + Ali5(MnCuFe)3Si2
L =^ (Al) + Ali5(MnCuFe)3Si2 + AboCusMna
L + Al2oCu2Mn3 =» (Al) + Ali5(MnCuFe)3Si2 + A^Cu
L=>(Al) + Al2Cu + Mg2Si
L =^ (Al) + AI2CU + Al2CuMg 4- Mg2Si
Solidus
0.8 K/s
13 K/s
637-633
633-613
551-538
637-627
613
544
486
480
486
480
formed after primary (Al) grains (Table 5.26). As iron is completely bound in this
phase, the early solidification reactions can be analyzed using the Al-Cu-Mn-Si
phase diagram (Figure 5.4, Tables 5.10 and 5.11). Therefore, the binary eutectic
reaction L=^(A1) +Ali5Mn3Si2 shall transform to the ternary one L=:>(Al) +
Al2oCu2Mn3 + Ali5Mn3Si2 following the Hne P1-P2 in Figure 5.4b. Then the AI20CU2
Mn3 must disappear through the peritectic reaction L-h Al2oCu2Mn3 =^ (Al) HAli5Mn3Si2 +AI2CU (P2 in Figure 5.4b). These reactions are in good agreement with
those listed in Table 5.26. The next reactions can be analyzed using the Al-Cu-MgSi phase diagram (Figure 3.4) as manganese and iron are already consumed by the
earlier formed phases.
Figure 5.15 demonstrates some typical microstructures of cast Al-Cu-Mn alloys
showing Cu- and Mn-containing phases.
In 3XX.0-series alloys the main Mn-containing phase is Ali5(MnFe)3Si2. This
phase can be formed during a binary eutectic reaction after the formation of
primary (Al) grains in the compositional range of a 319.1 alloy (Backerud et al.,
1990). Table 5.27 shows solidification reactions that are observed during nonequiUbrium soHdification of a 319.1 alloy (Backerud et al., 1990). The first reactions
are in good agreement with the Al-Fe-Mn-Si phase diagram (Section 1.4,
Figure 1.5). Table 5.27 shows that the AlsFeSi phase is formed during a ternary
eutectic reaction. It means that the liquid composition falls onto the P2-P1 hne in
Figure 1.5 and Table 1.16. One can then expect the peritectic reaction L + AlsFeSi =>•
(Al)-f(Si)-f-Ali5(FeMn)3Si2 corresponding to point Pi (Table 1.15) and after that
a reaction with participation of the Ali5(FeMn)3Si2 phase rather than AlsFeSi as
shown in Table 5.27 after Backerud et al. (1990) This discrepancy might be the effect
of nonequiUbrium sohdification, i.e. incomplete peritectic reaction.
At lower temperatures (when manganese and iron are almost completely bound to
the relevant phases) the rest of the solidification sequence can be analyzed using the
Al-Cu-Mg-Si phase diagram. The soHdification ends with the eutectic reaction
Alloys of the Al-Cu-Mn-(Mg,
Fe, Si)
System
189
^
(b)
Figure 5.15. Typical microstructures of Al-Cu~Mn alloys: (a) as-cast AM5 alloy (Al-5%Cu-l%Mn)
alloy, optical microscope, x200, veins of (Al) + AI2CU nonequilibrium eutectics, Mn in (Al); (b) ingot of an
Al-2%Cu-2% Mn alloy annealed at 550°C for 3h, TEM, dispersoids of the AlaoCusMns phase; (c) sheet
of a 2219 alloy, T7, SEM, particles of AI2CU phase (eutectic origin), not dissolved in (Al) during anneahng
at 540°C; and (d) ingot of an Al-5%Cu-l%Mn-0.6%Fe alloy, T4, SEM, particles of the AleCMnCuFe)
and Al7Cu2Fe phases (eutectic origin), not dissolved in (Al) during anneahng at 540°C.
190
Multicomponent Phase Diagrams: Applications for Commercial Aluminum Alloys
(d)
Figure 5.15 {continued)
Alloys of the Al~Cu-Mn-(Mg,
Fe, Si)
System
191
(a)
(b)
Figure 5.16. Microstructure of an AK5M alloy (Al-5%Si-1.3%Cu-0.5%Mg-0.4%Mn-0.5%Fe) alloy:
(a) as-cast, Ali5(MnFe)3Si2 skeleton, (Si) particles (gray), and multiphase colony (Al) + (Si) +
Ali5(MnFe)3Si2 [+AI2CU + Q], optical microscope, mechanical poUshing and (b) T4 (annealed 500° C,
10 h), unchanged Ali5(MnFe)3Si2 skeleton, globular (Si) particles, Cu- and Mg-containing phases
are dissolved in (Al), optical microscope, electrolytic polishing.
192
Multicomponent
Phase Diagrams: Applications for Commercial Aluminum
Alloys
Table 5.27. Solidification reactions under nonequilibrium conditions in a 319.1 alloy (5.7% Si, 3.4% Cu,
0.36% Mn, 0.1% Mg, and 0.62% Fe) (Backerud et al., 1990)
Reaction
L=^(A1)
L =^ (Al) +
L => (Al) +
L=^(Al) +
L =» (Al) +
L =^ (Al) +
Solidus
Temperatures (°C) at a cooling rate
Ali5(MnCuFe)3Si2
Ali5(MnCuFe)3Si2 + AlsFeSi
Al5FeSi + (Si)
AlsFeSi + (Si) +AI2CU
(Si) + Al5Cu2Mg8Si6 + AI2CU
0.25 K/s
5K/S
609-583
583-554
610-585
585-548
554^516
516-505
505-492
492
554-542
542-504
504-468
468
L=:>(Al) + (Si) + Al5Cu2Mg8Si6-f AI2CU as is suggested by Backerud et al., (1990)
(Table 5.27) or at even lower temperature with the eutectic reaction L=>-(A1) +
(Si)-hAl5Cu2Mg8Si6-hAl2Cu + Ali5Mn3Si2 (Table 5.19).
The effect of high-temperature anneaUng on the morphology and phase
composition of excess phases is demonstrated in Figure 5.16 for an AK5M2 casting
alloy (similar to 319.0 alloy).
© Copyright 2026 Paperzz