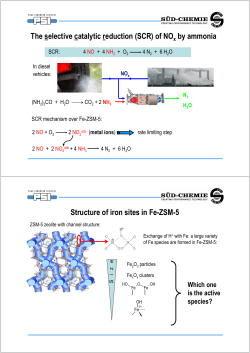
Magic Numbers in Large Hydrated Alkali Metal Clusters: K+ and Cs+ Matthew L. Ackerman, Jason D. Rodriguez, Dorothy J. Miller, and James M. Lisy University of Illinois at Urbana-Champaign K+(H2O)n Mass Spectrum n = 20 50000 45000 40000 Beam Intensity (cps) 35000 30000 25000 20000 15000 10000 5000 0 50 150 250 350 450 550 Mass (amu) 650 750 850 950 K+(H2O)n IRPD Spectra DAA 3.00E-18 DA 2.50E-18 23 2.00E-18 22 1.50E-18 21 1.00E-18 20 19 5.00E-19 18 17 16 0.00E+00 3600 3620 3640 3660 3680 3700 3720 -1 Frequency (cm ) 3740 3760 3780 3800 K+(H2O)n IRPD Spectra 1.60E-18 1.40E-18 1.20E-18 21 1.00E-18 8.00E-19 20 6.00E-19 4.00E-19 2.00E-19 19 0.00E+00 3600 3620 3640 3660 3680 3700 3720 -1 Frequency (cm ) 3740 3760 3780 3800 Lorentzian Fits K+(H2O)n Peak Centers 3726 3724 3722 3720 3718 3716 Frequency (cm-1) 3714 3712 Magic Number at n = 20 3710 3708 3706 3704 3702 3700 3698 3696 3694 3692 15 16 17 18 19 20 # of Waters 21 22 23 24 Cs+(H2O)n Mass Spectrum 200000 n = 20 180000 160000 Beam Intensity (cps) 140000 120000 100000 80000 60000 40000 20000 0 140 240 340 440 Mass (amu) 540 640 740 Cs+(H2O)n IRPD Spectra DAA 3.00E-18 2.50E-18 2.00E-18 1.50E-18 1.00E-18 5.00E-19 0.00E+00 3600 3620 3640 3660 3680 3700 3720 -1 Frequency (cm ) 3740 3760 3780 3800 Cs+(H2O)n IRPD Spectra 1.60E-18 1.40E-18 1.20E-18 1.00E-18 21 8.00E-19 6.00E-19 20 4.00E-19 2.00E-19 19 0.00E+00 3600 3620 3640 3660 3680 3700 3720 -1 Frequency (cm ) 3740 3760 3780 3800 Lorentzian Fits Cs+(H2O)n Peak Centers 3722 Frequency (cm-1) 3717 3712 Magic Numbers at n = 20, 22 3707 3702 3697 3692 15 16 17 18 19 20 # of Waters 21 22 23 24 Conclusions 3.00E-18 DAA 2.50E-18 2.00E-18 DA H3O+(H2O)20 n = 20 1.50E-18 Li+(H2O)20 1.00E-18 + Na (H2O)2 0 5.00E-19 K+(H2O)20 + Cs (H2O)2 0 0.00E+00 3600 3620 3640 3660 3680 3700 3720 3740 3760 3780 3800 Frequency (cm-1) 3.00E-18 2.50E-18 n = 21 + H3O (H2O)21 2.00E-18 Li+(H2O)21 1.50E-18 + Na (H2O)21 1.00E-18 K+(H2O)21 5.00E-19 + Cs (H2O)21 0.00E+00 3600 3620 3640 3660 3680 3700 Frequency (cm-1) 3720 3740 3760 3780 3800 • There are no IR signatures of the magic number observed in the mass spectrum; only AAD bands arise in the magic number region for K+ and Cs+ • No observed relationship between appearance/ disappearance of AD bands and increased/ decreased intensity in mass spec Multi-photon Absorption in Cs+(H2O)n clusters • Dip in intensity when monitoring loss of 1 water • For n = 22, loss of 2 waters has a higher cross section than loss of 1 water • Significant dissociation when monitoring loss of 3 or more waters • Multi-photon absorption! 9E-19 8E-19 n = 16 7E-19 6E-19 5E-19 4E-19 3E-19 2E-19 1E-19 0 3640 3660 3680 3700 3720 3740 3760 3780 3800 Frequency (cm-1) 1.2E-18 1E-18 n = 22 8E-19 6E-19 4E-19 2E-19 0 3640 3660 3680 3700 3720 Frequency (cm-1) 3740 3760 3780 3800 Mechanism of Multi-photon Absorption • The OH stretch potential energy curve is sufficiently anharmonic that a single oscillator cannot absorb more than one photon • However, the free OH oscillators in the cluster are highly uncoupled Each one can absorb a photon • There are generally uneven numbers of DA and DAA waters in a given cluster, so it is critical to understand these processes when analyzing the action spectra of these clusters K+(H2O)17 Calculated Global Minimum Structure 8 DAA Water 1 DA Water Schulz, F. and Hartke, B Theor Chem ACC, 114 (2005) Poisson Statistics • I = Ioe-sF ~ Io(1-sF) • (I/Io) = 1-sF • sF = 1-(I/Io) = Depletion of Parent Cluster • Poisson Distribution – P(x) = (h)xe-h/(x!) P(x) = (sF)xe-sF/(x!) Experimental Data n= 6 Loss Channel 1W 2W 3W Measured 26.21106 3.929942 0.302638 Poisson 25.25124 4.583515 0.554655 4W 5W 6W Total Dissociation 30.44364 8 Measured Poisson 30.54045 8.132974 1.249623 30.61184 7.799039 1.324651 39.923047 10 Measured Poisson 33.34207 18.22819 3.316608 35.90991 14.29209 3.792151 54.886866 16 Measured Poisson 22.39367 25.59229 8.714336 2.705972 36.59754 16.49738 4.957775 1.117429 59.406276 22 Measured Poisson 8.657451 41.97932 8.459858 6.336702 1.553745 0.441189 36.53654 20.49198 7.662125 2.1487 0.48205 0.090121 67.428268 • Preliminary data shows that experimental values track closely with Poisson probabilities • As n increases, one photon absorption leads to loss of more than one water Difference between Free and H-Bonded OH Stretches Cs+(H2O)8 Scaled to Loss of 1 Water 1.4E-18 Free OH Bands Scaled 1.2E-18 Drop in relative cross section in hydrogen bonded region 1E-18 8E-19 6E-19 4E-19 2E-19 0 3350 3400 3450 3500 3550 3600 -1 Frequency (cm ) 3650 3700 3750 3800 Internal Energy Distribution of Cs+(H2O)22 • FWHM decreases going from 1 water loss to 6 water loss • We can now probe the coldest part of the cluster distribution Cs+(H2O)22 Loss of 1 - 6 Waters, Scaled to Loss of 2 Waters 1.2E-18 30 1E-18 25 8E-19 FWHM (cm -1) 20 6E-19 15 10 4E-19 5 2E-19 0 0 3640 1 3660 3680 2 3700 3 3720 Frequency (cm-1) 4 Waters Lost 3740 3760 5 3780 6 3800 Conclusions and Future Work • We observed Cs+(H2O)n clusters undergo multi-photon absorption • Each free OH oscillator can absorb only one photon, but more than one oscillator can be excited • Poisson statistics correctly predict the probability of multi-photon absorption • As more waters are lost, the colder part of the internal energy distribution is sampled • The branching ratio between one and two water loss subsequent to 1j absorption needs to be characterized • Previously collected spectra need to reexamined in light of these new multi-photon absorption discoveries Acknowledgements Lisy Group Members – James Lisy – Dorothy Miller – Jason Rodriguez – Amy Willmarth – Jordan Beck
© Copyright 2026 Paperzz