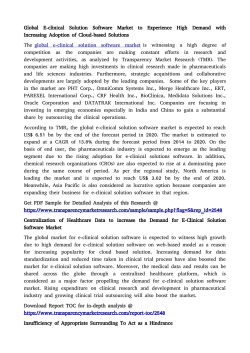
European Energy Infrastructure Georg Zachmann 27 May 2013 Agenda 1. Assessing the value of cross-border energy exchanges a) b) c) d) 2. 3. 4. Background Literature survey Simulation Empirical analysis Quantifying infrastructure need Insufficiency of current approach Proposals Market integration is a continous process with incremental benefits 1949 AT IT FR NL NO CH 2x60kV 1x70kV 1x125kV 4x150kV 1x130kV 1x140kV 1x150kV 1x70kV 1x150kV 1x130kV NL SE DE 1x220kV 1x50kV 2x220kV 9x110kV 2011 AT 1x110kV 1x150kV 2x220kV 1x220kV BE 1x80kV DK FR 3x110kV 1x220kV 1x220kV NL NO 3x380kV 3x220kV FR CH 5x220kV 6x380kV 1x110kV 1x220kV 3x380kV 1x220kV NL SE DE DK 1x65kV 1x70kV FR IT BE 1x110kV 5x220kV 5x380kV 4x380kV 2x110kV 2x380kV 20x110kV 11x220kV 2x380kV 1x110kV 2x220kV 3x380kV 2x110kV 1x220kV 4x380kV 2x220kV 3x380kV 6x380kV 5x220kV 7x380kV Growth in exchanges exceeded growth in production Note: West - Austria Belgium France Luxembourg Netherlands; East - Czech Republic Estonia Hungary Poland Romania Slovak Republic Slovenia; South -Greece Italy Portugal Spain; North -Denmark Finland Norway Sweden; British Islands - United Kingdom Ireland Annual net positions increased 1b Literature survey 1. Assessing the value of cross-border energy exchanges a) b) c) d) 2. 3. 4. Background Literature survey Simulation Empirical analysis Quantifying infrastructure need Insufficiency of current approach Proposals Benefits of competition and integration Competition Integration Static • Reduced mark-ups • Improved operation • Cross-border optimisation of operation Dynamic • Improved investment decisions • Cross-border optimisation of investment decisions • Cross-border optimisation of company structures (M&A) Integration increases competition in the European electricity market Source: own calculation based on individual companies capacities reported in their 2012 annual reports as well as total capacities reported by the national regulators Noe: the reported HHI is the sum of the squared market shares of all major electricity producers in the covered countries. In US competition law an HHI below 1500 indicates an unconcentrated market, an HHI between 1500 and 2500 indicates a moderately concentrated market and an HHI above 2500 indicates a highly concentrated market. Literature Survey In summary the reviewed literature points to the result that integration and competition can in the analysed cases reduced the cost of balancing by 44%, the cost of redispatch by more than 50%, the labour cost by 32.3% generation costs decreased by 13.5% in states affected by restructuring, and nonfuel expenses declined by roughly 9% in those states 1c Simulation 1. Assessing the value of cross-border energy exchanges a) b) c) d) 2. 3. 4. Background Literature survey Simulation Empirical analysis Quantifying infrastructure need Insufficiency of current approach Proposals Simulation exercise Two countries Four technologies Four scenarios: 1. 2. 3. 4. No trade Limited trade Full trade Reoptimisation of power plant park (excl. RES and nuclear) Assumptions Country A = Germany Centre (TenneT Zone) Country B = Germany West (Amprion Zone) Hourly wind and solar feed in (n,c,g at 100% availibility) Hourly demand (vertical load plus RES feed-in) Capital cost of gas plants = 30,000 €/MW and coal plants = 50,000€ MW Variable cost of gas = 50 €/MWh and coal = 30€/MWh Results System Cost: Preliminary!!! 1. No trade = ### 2. Limited trade = ### 3. Full trade = ### 4. Reoptimisation of power plant park = ### 4b. Reoptimisation of power plant park given double RES share = ### Interpretation: 1. 2. 3. 4. Most (static) trade benefits accrue already at limited trade Full trade has some marginal benefits Big gain is in Reoptimisation of power plant park Increasing RES share increases the value of interconnection 1d Empirical analysis 1. Assessing the value of cross-border energy exchanges a) b) c) d) 2. 3. 4. Background Literature survey Simulation Empirical analysis Quantifying infrastructure need Insufficiency of current approach Proposals Willingness to pay for interconnectors 500000 Annual auction result in 1000EUR 450000 DE CH CH DE DE NL NL DE DE FR FR DE DE D1 D1 DE BE FR FR BE BE NL NL BE AT CH CH AT IT AT AT IT IT CH CH IT IT FR FR IT IT GR GR IT IT SI SI IT DE NL 400000 DE NL 350000 300000 CH IT 250000 CH IT 200000 150000 FR IT FR IT 100000 50000 SI IT SI IT 2012 2013 0 Quantifying infrastructure need 1. 2. 3. 4. Assessing the value of cross-border energy exchanges Quantifying infrastructure need Insufficiency of current approach Proposals Determining optimal infrastructure Determining optimal infrastructure need is a challenging exercise that crucially depends on a number of assumptions. 1. 2. 3. 4. 5. Which measure should be optimised by the infrastructure investment? Which development of the energy system in the coming decades is considered? Which technical options are considered? What cost assumptions for the different options? Which market design is assumed? => Estimates are largly assumption driven and barely comparable we provide a survey Infrastructure cost studies Roland Berger’s report (2011) • distribution and transmission together will require around EUR 400 billion + EUR 200 billion for 20102020 (65% electricity, 35% gas) The European Infrastructure Priorities (2010) • 2011-2020: EUR 70 billion for transmission infrastructure, EUR 32 billion for offshore grid infrastructure and EUR 40 billion for smart grid infrastructure. 2013 OECD working paper • Grid shortage would make renewables deployment 38 billion dollars more expensive The Energy Roadmap 2050 • 2011-2050 infrastructure requirements reach EUR 1269 billion in the reference and EUR 2195 billion in the high RES scenario Infrastructure cost studies Ten Year Network Development Plan 2012 • increasing the total length of the network by 17 % over the coming ten years ECF’s study (2011) 80 Billion Euro 60 68 46 62 46 61 46 40 46 30 2020 2030 20 0 Reference Hirschhausen et al. (2012) Cross border coordination Higher demand response Higher energy efficiency • Total investment costs for transmission capacity in Europe 2011-2050 of “80% GHG reduction” scenario: EUR 57 bn Market design for reaping benefits of integration Expected change in Importance European market National market arrangement with an interface for imports/exports Purely National market arrangement Nationally administered provision Electricity has multiple dimensions that can be individually traded Frequency and voltage control Ancillary services + Balancing Intraday delivery of electricity Day-ahead delivery of electricity + + Capacity Location “greenness” Emissions + + + - Nordic Quotas Dimensions interact: => „grand design“ or complex set of interfaces ETS Insufficiency of current approach 1. 2. 3. 4. Assessing the value of cross-border energy exchanges Quantifying infrastructure need Insufficiency of current approach Proposals Historic investment figures Figure 14: Length of 400kV circuit in km at the end of the year Figure 13: Length of 220kV circuit in km at the end of the year 28000 22000 26000 20000 24000 22000 18000 20000 16000 18000 16000 14000 14000 12000 12000 10000 10000 2006 2007 2008 Visegrad4 (-3%) 2009 2010 DE (-10%) ES (+9%) 2011 2012 2006 2007 Visegrad4 (+5%) FR (+1%) 2008 2009 DE (+4%) 2010 2011 ES (+18%) FR (+2%) Figure 15: Investments in electricity networks by TSOs 1600 1400 Million euro 1200 1000 800 600 400 DE (+8%) ES (+9%) 200 FR (+86%) UK(+1%) 0 2006 2007 2008 2009 2010 2011 2012 2012 Insufficiency of infrastructure planing No joint plan No binding plan (stakeholder not legally accountable) Planing by one non-neutral actor (ENTSO) non-transparent Complex/unclear target function – certainly not EU social welfare Insufficiency of infrastructure operation Only weakly coordinated operation NTC ignores physical network FB Market coupling treats domestic and cross-border congestion differently Insufficiency of infrastructure financing Merchant: underbuilds CEF: only ~5 bn and politically selected projects RAB: lack of int’l CBA Proposals 1. 2. 3. 4. Assessing the value of cross-border energy exchanges Quantifying infrastructure need Insufficiency of current approach Proposals Add a European system management layer European control centre (See flight control ) Internalise redistribution Nodal pricing Day-to-day responsibility with national fall-back 27 Establish a stringent planning process Upgrade the TYNDP: national regulators can only approve projects proposed by European planning Make the TYNDP welfare-maximising: ACER should be requested and enabled to thoroughly check that the TYNDP maximises the welfare of current and future European citizens. • Build an European open-source reference energy infrastructure model • Structure a process in which all relevant stakeholders can contribute to the assumptions and the modelling • Make stakeholders liable to claims for damages from other stakeholders if they deviate from their predictions Democratically legitimise the TYNDP : to reach conclusion on distributional consequences 28 Phase in European cost-benefit sharing Deep connection charges Harmonized grid tariff structure (distribution between network users) An approximate beneficiary pays component A socialization component 29 Discussion: Who should propose a market design Different regional settings EU 27+ (ENTSO, ACER, EU) NWE Penta-lateral • Merger of TSOs • Merger of PX • Joint regulator Bilateral (FR-DE) • Merger of TSOs • Merger of PX (already happened) • Joint regulator 30
© Copyright 2026 Paperzz