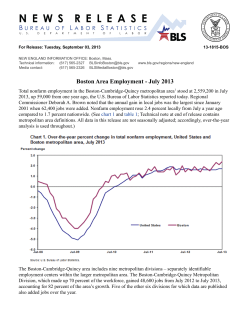
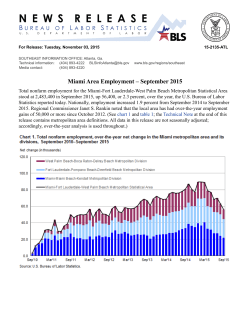
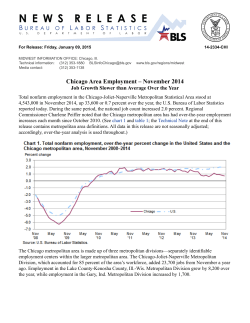
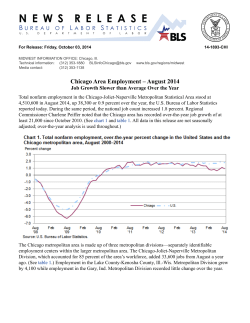
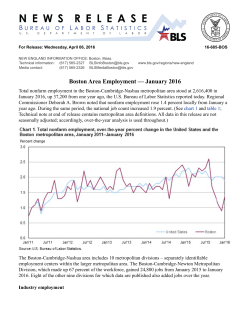
For Release: Wednesday, November 12, 2014
MIDWEST INFORMATION OFFICE: Chicago, Ill.
Technical information: (312) 353-1880 [email protected]
Media contact:
(312) 353-1138
14-2073-CHI
www.bls.gov/regions/midwest
Detroit Area Employment – September 2014
Total nonfarm employment for the Detroit-Warren-Livonia Metropolitan Statistical Area stood at 1,879,900
in September 2014, up 4,700 or 0.3 percent over the year, the U.S. Bureau of Labor Statistics reported
today. During this same period, the national job count increased 2.0 percent. Regional Commissioner
Charlene Peiffer noted that the increase in Detroit area employment followed a gain of 32,000 (1.7 percent)
in the previous 12-month period ended in September 2013. (See chart 1 and table 1; the Technical Note at
the end of this release contains metropolitan area definitions. All data in this release are not seasonally
adjusted; accordingly, over-the-year analysis is used throughout.)
The Detroit metropolitan area is made up of two metropolitan divisions—separately identifiable
employment centers within the larger metropolitan area. The Warren-Troy-Farmington Hills division, which
accounted for 62 percent of the metropolitan area's employment, added 7,500 jobs from September a year
ago, a gain of 0.7 percent. The Detroit-Livonia-Dearborn Metropolitan Division, the area’s other
employment center, experienced a decline of 2,800 jobs over the 12-month period, a 0.4 percent drop. (See
table 1.)
Industry employment
Professional and business services gained the largest number of jobs in the Detroit metropolitan area over
the year, up 7,000 or 1.9 percent from last September. Both Warren-Troy-Farmington Hills (up 5,100 or 2.1
percent) and Detroit-Livonia-Dearborn (up 1,900 or 1.6 percent) experienced annual increases in this
supersector. Nationwide, professional and business services rose 3.8 percent over the previous year in
September. (See chart 2 and table 1.)
Employment in the trade, transportation, and utilities supersector increased by 4,400 from September 2013September 2014, a 1.3-percent gain. The bulk of this increase occurred in the Warren-Troy-Farmington Hills
area where employment grew by 3,800 (1.8 percent) over the year. Nationwide, employment in this
supersector increased 1.9 percent.
Manufacturing, the only other supersector in Detroit to record a measurable increase in employment,
gained 2,500 jobs, up 1.1 percent in the year ended September 2014. The employment gain in this
supersector was concentrated in the Warren division which added 6,000 jobs. Nationally, manufacturing
payrolls rose 1.3 percent in the same period.
2
In the Detroit metropolitan area, financial activities experienced the largest employment decrease from
September 2013-September 2014, down 5,300 or 5.2 percent. In contrast, employment in financial activities
increased 1.2 percent nationally over the year.
Leisure and hospitality employment in Detroit fell by 3,300 or 1.8 percent from September a year ago. The
Warren division shed 3,900 jobs in this supersector over the year. Nationally, leisure and hospitality posted a
2.6 percent rate of job growth from September 2013.
Government payrolls declined 3,100 or 1.7 percent compared to last September in the Detroit metropolitan
area. The Detroit-Livonia-Dearborn division was responsible for the loss with a decline of 3,200 jobs in
government over the year. Nationwide, government payrolls were little changed over the year.
Employment in the 12 largest metropolitan areas
Detroit was 1 of the nation’s 12 largest metropolitan statistical areas in September 2014. All of these areas
experienced over-the-year job growth during the period, with 5 exceeding the national average of 2.0
percent.. (See chart 3 and table 2.) The fastest rate of job growth was registered in Houston-Sugar LandBaytown, up 4.3 percent, followed by Dallas-Fort Worth-Arlington, up 3.2 percent. The slowest rate of
expansion, 0.3 percent, was experienced in both Detroit and Washington-Arlington-Alexandria.
New York-Northern New Jersey-Long Island added the largest number of jobs from the previous
September, up 130,500. Three other areas added more than 100,000 jobs over the year–Houston, Los
Angeles-Long Beach-Santa Ana, and Dallas. Five areas had employment increases ranging from 69,200 to
45,000. Detroit registered the smallest 12-month increase, up 4,700 during the period.
Professional and business services led employment growth in 5 of the 12 metropolitan areas—ChicagoJoliet-Naperville, Dallas, Detroit, Los Angeles, and San Francisco-Oakland-Fremont. (See table 2.)
Education and health services recorded the largest gains in three areas—Boston-Cambridge-Quincy,
Houston, and New York.
Over the year, manufacturing recorded the largest loss of jobs in three areas–Chicago, Dallas, and Los
Angeles. The Boston, Houston, and Miami-Fort Lauderdale-Pompano Beach areas experienced no annual
job loss in any supersector.
3
4
Technical Note
This release presents nonfarm payroll employment estimates from the Current Employment Statistics (CES)
program. The CES survey is a Federal-State cooperative endeavor between State employment security
agencies and the Bureau of Labor Statistics. Industry employment data for all states and metropolitan areas
from the CES program are also available on the Internet at www.bls.gov/sae.
Definitions. Employment data refer to persons on establishment payrolls who receive pay for any part of
the pay period that includes the 12th of the month. Persons are counted at their place of work rather than at
their place of residence; those appearing on more than one payroll are counted on each payroll. Industries
are classified on the basis of their principal activity in accordance with the 2007 version of the North
American Industry Classification System.
Method of estimation. The employment data are estimated using a "link relative" technique in which a
ratio (link relative) of current-month employment to that of the previous month is computed from a sample
of establishments reporting for both months. The estimates of employment for the current month are
obtained by multiplying the estimates for the previous month by these ratios. Small-domain models are used
as the official estimators for the approximately 39 percent of CES published series which have insufficient
sample for direct sample-based estimates. More complete information on the technical procedures used to
develop these estimates and additional data appear in Employment and Earnings, which is available on line
at www.bls.gov/opub/ee/home.htm.
Annual revisions. Employment estimates are adjusted annually to a complete count of jobs, called
benchmarks, derived principally from tax reports that are submitted by employers who are covered under
state unemployment insurance (UI) laws. The benchmark information is used to adjust the monthly
estimates between the new benchmark and the preceding one and also to establish the level of employment
for the new benchmark month. Thus, the benchmarking process establishes the level of employment, and
the sample is used to measure the month-to-month changes in the level for the subsequent months.
Reliability of the estimates. The estimates presented in this release are based on sample survey,
administrative data, and modeling and, thus, are subject to sampling and other types of errors. Sampling
error is a measure of sampling variability—that is, variation that occurs by chance because a sample rather
than the entire population is surveyed. Survey data also are subject to nonsampling errors, such as those
which can be introduced into the data collection and processing operations. Estimates not directly derived
from sample surveys are subject to additional errors resulting from the specific estimation processes used.
The sums of individual items may not always equal the totals shown in the same tables because of rounding.
Employment estimates. Measures of sampling error are available for state CES data at the total nonfarm
and supersector level and for metropolitan area CES data. Information on recent benchmark revisions for
states is available on the BLS Web site at www.bls.gov/sae.
Area definitions. The substate area data published in this release reflect the standards and definitions
established by the U.S. Office of Management and Budget dated December 1, 2009. A detailed list of the
geographic definitions is available at www.bls.gov/lau/lausmsa.htm.
The Detroit-Warren-Livonia, Mich. Metropolitan Statistical Area (MSA) includes Lapeer, Livingston,
Macomb, Oakland, St. Clair, and Wayne Counties in Michigan.
5
• The The Detroit-Livonia-Dearborn, Mich. Metropolitan Division (MD) includes Wayne County in
Michigan.
• The The Warren-Troy-Farmington Hills, Mich. Metropolitan Division (MD) includes Lapeer,
Livingston, Macomb, Oakland, and St. Clair Counties in Michigan.
Information in this release will be made available to sensory impaired individuals upon request. Voice
phone: (202) 691-5200; Federal Relay Service: (800) 877-8339.
6
Table 1. Employees on nonfarm payrolls by industry supersector, the United States and the Detroit
metropolitan area and its components, not seasonally adjusted (numbers in thousands)
Area and Industry
United States
Total nonfarm................................................
Mining and logging ...................................
Construction .............................................
Manufacturing...........................................
Trade, transportation, and utilities ............
Information ...............................................
Financial activities ....................................
Professional and business services .........
Education and health services .................
Leisure and hospitality..............................
Other services ..........................................
Government..............................................
Detroit-Warren-Livonia, MI Metropolitan
Statistical Area
Total nonfarm................................................
Mining, logging, and construction.............
Manufacturing...........................................
Trade, transportation, and utilities ............
Information ...............................................
Financial activities ....................................
Professional and business Services.........
Education and health services .................
Leisure and hospitality..............................
Other services ..........................................
Government..............................................
Detroit-Livonia-Dearborn, MI Metropolitan
Division
Total nonfarm................................................
Mining, logging, and construction.............
Manufacturing...........................................
Trade, transportation, and utilities ............
Information ...............................................
Financial activities ....................................
Professional and business services .........
Education and health services .................
Leisure and hospitality..............................
Other services ..........................................
Government..............................................
Warren-Troy-Farmington Hills, MI
Metropolitan Division
Total nonfarm................................................
Mining, logging, and construction.............
Manufacturing...........................................
Trade, transportation, and utilities ............
Information ...............................................
Financial activities ....................................
Professional and business services .........
Education and health services .................
Leisure and hospitality..............................
Other services ..........................................
Government..............................................
Sept
2013
July
2014
Aug
2014
Sept
2014 (p)
Change from Sept
2013 to Sept 2014
Number
Percent
137,069
886
6,081
12,065
25,908
2,665
7,897
18,773
21,086
14,498
5,463
21,747
138,669
931
6,316
12,218
26,444
2,689
8,031
19,362
21,163
15,337
5,574
20,604
139,051
935
6,350
12,249
26,432
2,697
8,031
19,460
21,229
15,300
5,559
20,809
139,752
939
6,316
12,222
26,411
2,685
7,993
19,492
21,497
14,874
5,511
21,812
2,683
53
235
157
503
20
96
719
411
376
48
65
2.0
6.0
3.9
1.3
1.9
0.8
1.2
3.8
1.9
2.6
0.9
0.3
1,875.2
61.6
233.0
347.9
26.8
102.1
362.0
296.1
180.7
77.7
187.3
1,865.1
64.5
230.8
354.2
27.4
98.1
359.3
297.4
185.7
76.5
171.2
1,866.8
65.6
233.3
353.3
27.5
98.1
365.8
294.0
182.6
76.3
170.3
1,879.9
66.7
235.5
352.3
27.2
96.8
369.0
294.4
177.4
76.4
184.2
4.7
5.1
2.5
4.4
0.4
-5.3
7.0
-1.7
-3.3
-1.3
-3.1
0.3
8.3
1.1
1.3
1.5
-5.2
1.9
-0.6
-1.8
-1.7
-1.7
721.4
19.2
83.6
136.5
7.4
33.3
120.4
128.8
73.6
30.6
88.0
708.2
20.3
79.2
137.6
7.5
33.0
116.7
127.8
75.8
30.3
80.0
711.0
20.4
80.6
137.3
7.5
32.9
120.1
128.0
74.9
30.3
79.0
718.6
20.8
80.1
137.1
7.4
32.6
122.3
129.0
74.2
30.3
84.8
-2.8
1.6
-3.5
0.6
0.0
-0.7
1.9
0.2
0.6
-0.3
-3.2
-0.4
8.3
-4.2
0.4
0.0
-2.1
1.6
0.2
0.8
-1.0
-3.6
1,153.8
42.4
149.4
211.4
19.4
68.8
241.6
167.3
107.1
47.1
99.3
1,156.9
44.2
151.6
216.6
19.9
65.1
242.6
169.6
109.9
46.2
91.2
1,155.8
45.2
152.7
216.0
20.0
65.2
245.7
166.0
107.7
46.0
91.3
1,161.3
45.9
155.4
215.2
19.8
64.2
246.7
165.4
103.2
46.1
99.4
7.5
3.5
6.0
3.8
0.4
-4.6
5.1
-1.9
-3.9
-1.0
0.1
0.7
8.3
4.0
1.8
2.1
-6.7
2.1
-1.1
-3.6
-2.1
0.1
Footnotes
(P) Preliminary
7
Table 2. Employees on nonfarm payrolls by industry supersector, 12 largest metropolitan areas, not
seasonally adjusted (numbers in thousands)
Area and Industry
Atlanta-Sandy Springs-Marietta, GA
Total nonfarm................................................
Mining and logging ...................................
Construction .............................................
Manufacturing...........................................
Trade, transportation, and utilities ............
Information ...............................................
Financial activities ....................................
Professional and business services .........
Education and health services .................
Leisure and hospitality..............................
Other services ..........................................
Government..............................................
Boston-Cambridge-Quincy, MA-NH
Total nonfarm................................................
Mining and logging ...................................
Construction .............................................
Manufacturing...........................................
Trade, transportation, and utilities ............
Information ...............................................
Financial activities ....................................
Professional and business services .........
Education and health services .................
Leisure and hospitality..............................
Other services ..........................................
Government..............................................
Chicago-Joliet-Naperville, IL-IN-WI
Total nonfarm................................................
Mining and logging ...................................
Construction .............................................
Manufacturing...........................................
Trade, transportation, and utilities ............
Information ...............................................
Financial activities ....................................
Professional and business services .........
Education and health services .................
Leisure and hospitality..............................
Other services ..........................................
Government..............................................
Dallas-Fort Worth-Arlington, TX
Total nonfarm................................................
Mining, logging, and construction.............
Manufacturing...........................................
Trade, transportation, and utilities ............
Information ...............................................
Financial activities ....................................
Professional and business services .........
Education and health services .................
Leisure and hospitality..............................
Other services ..........................................
Government..............................................
Detroit-Warren-Livonia, MI
Total nonfarm................................................
Mining, logging, and construction.............
Sept
2013
July
2014
Aug
2014
Sept
2014 (p)
Change from Sept
2013 to Sept 2014
Number
Percent
2,416.7
1.2
94.6
149.6
536.3
84.9
157.0
439.5
295.4
247.9
93.7
316.6
2,464.7
1.2
97.7
153.7
551.0
87.4
162.3
458.2
291.8
264.4
92.2
304.8
2,472.6
1.2
98.0
154.3
550.2
86.9
161.0
457.8
295.9
261.0
93.1
313.2
2,468.6
1.2
98.5
154.2
550.7
86.2
160.5
452.7
298.1
256.5
91.4
318.6
51.9
0.0
3.9
4.6
14.4
1.3
3.5
13.2
2.7
8.6
-2.3
2.0
2.1
0.0
4.1
3.1
2.7
1.5
2.2
3.0
0.9
3.5
-2.5
0.6
2,568.1
0.6
94.4
193.4
408.2
74.3
172.3
437.2
536.5
251.0
98.5
301.7
2,610.8
0.6
96.5
195.2
418.9
79.4
176.1
450.9
543.8
265.0
104.7
279.7
2,592.2
0.6
96.2
195.1
405.5
79.8
176.2
451.3
541.4
266.8
103.9
275.4
2,613.4
0.6
95.0
193.9
416.2
79.6
174.0
448.5
549.1
254.6
99.6
302.3
45.3
0.0
0.6
0.5
8.0
5.3
1.7
11.3
12.6
3.6
1.1
0.6
1.8
0.0
0.6
0.3
2.0
7.1
1.0
2.6
2.3
1.4
1.1
0.2
4,473.6
1.5
159.7
409.3
897.1
79.5
290.5
780.1
678.3
436.1
191.9
549.6
4,505.7
1.4
167.0
407.8
903.0
80.9
291.7
794.5
673.7
449.0
194.5
542.2
4,511.1
1.4
167.7
408.7
903.7
80.6
290.6
799.1
675.3
451.2
193.5
539.3
4,518.6
1.4
166.1
405.8
909.2
79.8
288.6
800.0
680.8
439.9
193.4
553.6
45.0
-0.1
6.4
-3.5
12.1
0.3
-1.9
19.9
2.5
3.8
1.5
4.0
1.0
-6.7
4.0
-0.9
1.3
0.4
-0.7
2.6
0.4
0.9
0.8
0.7
3,118.9
180.2
258.5
643.1
79.3
255.8
491.5
386.5
320.8
112.5
390.7
3,202.8
191.2
258.6
664.3
80.5
256.3
525.4
389.9
337.1
115.1
384.4
3,214.3
193.3
258.5
666.6
79.7
258.5
530.2
390.1
334.5
115.0
387.9
3,219.1
192.7
255.9
666.3
79.3
257.0
526.5
392.4
332.9
114.9
401.2
100.2
12.5
-2.6
23.2
0.0
1.2
35.0
5.9
12.1
2.4
10.5
3.2
6.9
-1.0
3.6
0.0
0.5
7.1
1.5
3.8
2.1
2.7
1,875.2
61.6
1,865.1
64.5
1,866.8
65.6
1,879.9
66.7
4.7
5.1
0.3
8.3
Note: See footnotes at end of table.
8
Table 2. Employees on nonfarm payrolls by industry supersector, 12 largest metropolitan areas, not
seasonally adjusted (numbers in thousands) - Continued
Area and Industry
Manufacturing...........................................
Trade, transportation, and utilities ............
Information ...............................................
Financial activities ....................................
Professional and business services .........
Education and health services .................
Leisure and hospitality..............................
Other services ..........................................
Government..............................................
Houston-Sugar Land-Baytown, TX
Total nonfarm................................................
Mining and logging ...................................
Construction .............................................
Manufacturing...........................................
Trade, transportation, and utilities ............
Information ...............................................
Financial activities ....................................
Professional and business services .........
Education and health services .................
Leisure and hospitality..............................
Other services ..........................................
Government..............................................
Los Angeles-Long Beach-Santa Ana, CA
Total nonfarm................................................
Mining and logging ...................................
Construction .............................................
Manufacturing...........................................
Trade, transportation, and utilities ............
Information ...............................................
Financial activities ....................................
Professional and business services .........
Education and health services .................
Leisure and hospitality..............................
Other services ..........................................
Government..............................................
Miami-Fort Lauderdale-Pompano Beach, FL
Total nonfarm................................................
Mining and logging ...................................
Construction .............................................
Manufacturing...........................................
Trade, transportation, and utilities ............
Information ...............................................
Financial activities ....................................
Professional and business services .........
Education and health services .................
Leisure and hospitality..............................
Other services ..........................................
Government..............................................
New York-Northern New Jersey-Long
Island, NY-NJ-PA
Total nonfarm................................................
Mining, logging, and constructionn...........
Manufacturing...........................................
Trade, transportation, and utilities ............
Sept
2013
July
2014
Aug
2014
Sept
2014 (p)
Change from Sept
2013 to Sept 2014
Number
Percent
233.0
347.9
26.8
102.1
362.0
296.1
180.7
77.7
187.3
230.8
354.2
27.4
98.1
359.3
297.4
185.7
76.5
171.2
233.3
353.3
27.5
98.1
365.8
294.0
182.6
76.3
170.3
235.5
352.3
27.2
96.8
369.0
294.4
177.4
76.4
184.2
2.5
4.4
0.4
-5.3
7.0
-1.7
-3.3
-1.3
-3.1
1.1
1.3
1.5
-5.2
1.9
-0.6
-1.8
-1.7
-1.7
2,802.3
108.3
189.6
252.9
567.0
32.4
144.1
430.0
336.4
273.4
99.0
369.2
2,892.7
116.4
195.7
261.5
585.4
33.3
146.5
446.1
348.5
291.3
103.5
364.5
2,898.1
117.6
201.4
262.1
585.4
33.2
147.5
447.4
354.5
287.5
102.6
358.9
2,921.7
118.1
203.1
261.4
583.2
33.0
146.7
449.3
357.7
282.8
102.6
383.8
119.4
9.8
13.5
8.5
16.2
0.6
2.6
19.3
21.3
9.4
3.6
14.6
4.3
9.0
7.1
3.4
2.9
1.9
1.8
4.5
6.3
3.4
3.6
4.0
5,577.1
5.2
197.0
525.6
1,030.3
226.5
323.4
859.1
901.6
633.8
191.7
682.9
5,622.8
5.5
207.8
511.0
1,041.7
229.0
321.2
887.9
909.8
650.3
196.5
662.1
5,639.1
5.6
210.2
510.1
1,041.5
236.5
322.4
892.4
914.8
649.2
196.6
659.8
5,679.1
5.6
214.4
508.6
1,044.0
235.8
321.3
897.6
923.9
647.0
195.0
685.9
102.0
0.4
17.4
-17.0
13.7
9.3
-2.1
38.5
22.3
13.2
3.3
3.0
1.8
7.7
8.8
-3.2
1.3
4.1
-0.6
4.5
2.5
2.1
1.7
0.4
2,346.3
0.6
96.7
78.0
546.7
46.1
165.8
371.5
346.6
280.0
110.7
303.6
2,379.5
0.6
101.0
78.4
563.9
46.5
169.3
382.9
349.3
291.7
115.6
280.3
2,402.7
0.6
102.9
78.9
564.6
46.7
168.8
384.7
350.2
288.8
115.0
301.5
2,415.5
0.6
104.6
80.1
567.0
46.7
169.1
384.4
354.1
287.6
114.9
306.4
69.2
0.0
7.9
2.1
20.3
0.6
3.3
12.9
7.5
7.6
4.2
2.8
2.9
0.0
8.2
2.7
3.7
1.3
2.0
3.5
2.2
2.7
3.8
0.9
8,710.1
333.1
357.6
1,608.5
8,873.8
334.8
354.3
1,632.9
8,839.9
333.5
356.6
1,633.4
8,840.6
332.2
356.0
1,643.3
130.5
-0.9
-1.6
34.8
1.5
-0.3
-0.4
2.2
Note: See footnotes at end of table.
9
Table 2. Employees on nonfarm payrolls by industry supersector, 12 largest metropolitan areas, not
seasonally adjusted (numbers in thousands) - Continued
Area and Industry
Information ...............................................
Financial activities ....................................
Professional and business services .........
Education and health services .................
Leisure and hospitality..............................
Other services ..........................................
Government..............................................
Philadelphia-Camden-Wilmington, PA-NJDE-MD
Total nonfarm................................................
Mining, logging, and construction.............
Manufacturing...........................................
Trade, transportation, and utilities ............
Information ...............................................
Financial activities ....................................
Professional and business services .........
Education and health services .................
Leisure and hospitality..............................
Other services ..........................................
Government..............................................
San Francisco-Oakland-Fremont, CA
Total nonfarm................................................
Mining and logging ...................................
Construction .............................................
Manufacturing...........................................
Trade, transportation, and utilities ............
Information ...............................................
Financial activities ....................................
Professional and business services .........
Education and health services .................
Leisure and hospitality..............................
Other services ..........................................
Government..............................................
Washington-Arlington-Alexandria, DC-VAMD-WV
Total nonfarm................................................
Mining, logging, and construction.............
Manufacturing...........................................
Trade, transportation, and utilities ............
Information ...............................................
Financial activities ....................................
Professional and business services .........
Education and health services .................
Leisure and hospitality..............................
Other services ..........................................
Government..............................................
Sept
2013
July
2014
Aug
2014
Sept
2014 (p)
Change from Sept
2013 to Sept 2014
Number
Percent
277.8
738.5
1,397.9
1,608.8
801.6
380.6
1,205.7
275.4
747.8
1,430.2
1,636.7
854.6
390.7
1,216.4
276.5
747.8
1,436.2
1,631.9
847.6
388.9
1,187.5
271.7
741.7
1,430.2
1,658.1
818.0
385.0
1,204.4
-6.1
3.2
32.3
49.3
16.4
4.4
-1.3
-2.2
0.4
2.3
3.1
2.0
1.2
-0.1
2,751.8
105.8
180.0
507.1
47.0
202.8
437.5
573.0
245.8
120.8
332.0
2,763.9
115.3
179.8
512.5
46.2
206.4
447.9
571.2
256.3
120.7
307.6
2,752.2
114.7
179.3
512.7
46.2
206.5
444.9
567.3
254.0
120.4
306.2
2,765.8
113.1
179.5
512.3
45.9
204.4
443.6
576.9
243.9
120.9
325.3
14.0
7.3
-0.5
5.2
-1.1
1.6
6.1
3.9
-1.9
0.1
-6.7
0.5
6.9
-0.3
1.0
-2.3
0.8
1.4
0.7
-0.8
0.1
-2.0
2,114.6
1.3
96.9
117.4
345.0
73.4
126.3
420.4
315.1
244.6
79.9
294.3
2,160.7
1.2
103.1
118.5
352.2
76.9
127.3
436.3
321.9
251.7
80.3
291.3
2,166.1
1.2
104.9
118.1
351.7
77.2
127.1
436.3
321.8
254.4
80.9
292.5
2,175.5
1.2
104.4
118.3
353.7
76.6
126.0
440.5
324.2
252.2
80.2
298.2
60.9
-0.1
7.5
0.9
8.7
3.2
-0.3
20.1
9.1
7.6
0.3
3.9
2.9
-7.7
7.7
0.8
2.5
4.4
-0.2
4.8
2.9
3.1
0.4
1.3
3,080.4
149.2
47.9
387.5
75.6
151.1
703.5
396.7
294.2
189.5
685.2
3,108.0
150.5
45.8
397.5
74.0
156.8
713.3
390.6
312.9
193.6
673.0
3,081.6
151.8
46.4
394.7
73.5
156.7
708.5
385.5
309.4
192.9
662.2
3,091.1
150.7
45.5
392.6
73.1
156.2
700.9
393.5
302.7
190.9
685.0
10.7
1.5
-2.4
5.1
-2.5
5.1
-2.6
-3.2
8.5
1.4
-0.2
0.3
1.0
-5.0
1.3
-3.3
3.4
-0.4
-0.8
2.9
0.7
0.0
Footnotes
(P) Preliminary
10
© Copyright 2026 Paperzz