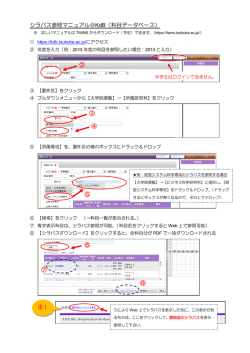
Total Edition
Partner Report
Universitat Pompeu Fabra
Partner Report: Universitat Pompeu Fabra
Introduction
The trendence Graduate Barometer 2010 - Total Edition
Prepared for Universitat Pompeu Fabra
Welcome to the trendence Graduate Barometer 2010.
First of all we would like to thank you for your participation in the trendence Graduate Barometer 2010. Through
cooperation with institutions like yours, this year has been our most successful yet, with 220 000 students taking part
in the survey: about 25 000 participants more than we had in the previous survey.
Over the years, trendence has become Europe’s leading research institute conducting online student surveys. The
results of these surveys are used by employers and universities to learn more about students, making our data an
important bridge between higher education and the labour market. We look forward to many more years of
cooperation with your institution.
We hope you find this report interesting and useful, and welcome any comments or requests you may have.
Yours sincerely
Ulrike Heyne
Research Manager - Europe
2
The trendence Graduate Barometer 2010 - Total Edition © trendence 2010
Contents
Partner Report: Universitat Pompeu Fabra
Contents
Introduction ......................................................................................................................................................................................2
Contents ............................................................................................................................................................................................3
About the Survey...............................................................................................................................................................................4
Europe-wide participation in the trendence Graduate Barometer 2010 ..........................................................................................5
Sample groups...................................................................................................................................................................................6
Chapter I: Education and university evaluation..............................................................................7
Important factors when choosing a university course ..............................................................................................................8
Evaluation of university performance .......................................................................................................................................9
Importance vs. evaluation .......................................................................................................................................................10
Evaluation of university performance - overall satisfaction in Europe....................................................................................11
Views on university course and university careers fair ...........................................................................................................12
Interest in studying a masters course abroad .........................................................................................................................13
Desired masters course destination ........................................................................................................................................14
Students wanting to study a masters course in Spain .............................................................................................................15
Chapter II: Career ..........................................................................................................................16
Opinions - future career ..........................................................................................................................................................17
Job application process ...........................................................................................................................................................18
Estimated timeframe to find first position (months)...........................................................................................................18
Estimated number of applications to find first position ......................................................................................................19
Expectations of first position...................................................................................................................................................20
Expected gross annual salary ..............................................................................................................................................20
Desired weekly working hour and desired time in first position .........................................................................................21
Mobility ...................................................................................................................................................................................22
Chapter III: Employer attractiveness.............................................................................................23
Employer attractiveness(Business and Engineering)...............................................................................................................24
Chapter IV: The students...............................................................................................................25
Student sample profile ............................................................................................................................................................26
Age ......................................................................................................................................................................................26
Gender.................................................................................................................................................................................26
Subject.................................................................................................................................................................................27
Expected length of higher education and academic achievement .....................................................................................28
Experience and highly advanced English language skills .........................................................................................................29
English language skills (according to students) ...................................................................................................................30
Opinions - student fees ...........................................................................................................................................................31
About trendence .............................................................................................................................................................................32
The trendence Graduate Barometer 2010 - Total Edition© trendence 2010
3
Partner Report: Universitat Pompeu Fabra
About the Survey
About the Survey
trendence Graduate Barometer has grown to be the largest survey on career, education and employer topics in
Europe. More than 850 institutions in 24 countries took part and about 220 000 students answered the survey.
The survey was conducted in the following countries: Austria, Belgium, Czech Republic, Denmark, Finland, France,
Germany, Greece, Hungary, Ireland, Italy, the Netherlands, Norway, Poland, Portugal, Romania, Russia, Slovakia,
Spain, Sweden, Switzerland, the United Kingdom and in two new countries: Bulgaria and Turkey.
The field phase of the survey took place from 01.09.2009 – 11.01.2010. The students were asked about their
preferences and expectations in their future career, their satisfaction with their university, and the attractiveness
of future employers.
The main target group for the survey was business/economics and engineering/IT/natural science students;
however, we are of course interested in hearing the opinions of all students. Therefore we have three editions of
the trendence Graduate Barometer Partner Report: business, engineering and total (including students of all fields
of study).
The survey was conducted online and the students were invited by the universities by email, newsletter or web
page banner.
Your report is divided into four chapters: Education and university evaluation, Career, Employer attractiveness and
The Students.
4
The trendence Graduate Barometer 2010 - Total Edition© trendence 2010
Contents
Participating countries
Europe-wide participation in the trendence Graduate Barometer 2010
Country
Answers
Country
Answers
Aus tria
3 964
Netherla nds
4 832
Be lgium
8 692
Norwa y
1 840
6 672
Pola nd
Bulga ria
Czech Republic
9 534
13 785
Portuga l
12 873
2 832
Roma nia
6 621
Finla nd
9 243
Russ ia
2 257
Fra nce
21 264
Denma rk
Germa ny
3 530
Spa in
Swe de n
Gre ece
1 551
Hunga ry
26 424
Irela nd
5 608
Ita ly
Slova kia
14 308
6 421
24 366
3 436
Switze rla nd
7 158
Turke y
5 791
Unite d Kingdom
Total
The trendence Graduate Barometer 2010 - Total Edition© trendence 2010
16 788
219 790
5
Partner Report: Universitat Pompeu Fabra
Sample groups
Sample groups
Europe:
219790
Sample: Numbers of answers for the Total Edition
Spain:
24366
Sample: Numbers of answers for the Total Edition
Universitat Pompeu Fabra:
602
Sample: Numbers of answers for the Total Edition
6
The trendence Graduate Barometer 2010 - Total Edition© trendence 2010
Chapter I:
Education and university
evaluation
Partner Report: Universitat Pompeu Fabra
Education and university evaluation
Important factors when choosing a university course
79,6%
85,4%
Tea chi ng qua l i ty
56,3%
Aca demi c reputa tion
41,7%
Reputa tion among empl oyers
74,2%
53,1%
52,7%
Uni vers i ty faci l i ti es
30,3%
Interna tiona l ori enta tion
As s i s tance wi th career pl anni ng
34,2%
Pra cti cal cours e content
34,8%
33,8%
Lecturer/tutor ava i la bi l i ty a nd hel pful nes s
24,3%
23,9%
27,9%
Campus a cti vi ti es / s tudent l i fe
19,8%
Uni vers i ty admi ni s tra ti on s ervi ce
15,5%
12,9%
Cooperati on with empl oyers
16,1%
12,5%
Chea p l oca tion
18,6%
4,5%
Accommodati on a vai l a bi l i ty
2,2%
0%
%
46,3%
28,6%
IT faci l i ti es
!
43,4%
39,3%
33,5%
Good l oca ti on
8
49,2%
39,9%
39,6%
Cours e content a nd s tructure
Europe
83,4%
10%
Spa in
11,7%
20%
30%
40%
50%
60%
70%
80%
90%
Barcel ona - Uni vers i da d Pompeu Fabra
The diagram shows the % of students who selected the factors as important when choosing a university course.
Question: Which are the most important factors for you when choosing a university/university course?
The trendence Graduate Barometer 2010 - Total Edition© trendence 2010
100%
Chapter I
Partner Report: Universitat Pompeu Fabra
Evaluation of university performance
69,4%
Aca demi c reputa tion
93,7%
71,4%
IT fa cil i ti es
79,2%
Uni vers i ty facil i ti es
90,2%
77,7%
82,8%
Good l oca ti on
46,1%
Interna ti ona l ori enta tion
76,0%
61,3%
Cours e content a nd s tructure
49,9%
Practi cal cours e content
57,6%
58,6%
Lecturer / tutor ava i l abil i ty and helpful nes s
58,5%
35,8%
Coopera ti on wi th employers
75,8%
62,4%
Campus a ctivi ti es / s tudent l i fe
70,9%
47,8%
51,0%
45,3%
Accommodati on a vai l a bi l i ty
As s i s tance with ca reer pla nni ng
37,3%
42,7%
Uni vers i ty admini s trati on s ervi ce
40,3%
38,5%
Chea p l oca tion
43,1%
26,9%
0%
%
90,2%
54,8%
Reputa ti on a mong employers
!
90,2%
71,8%
Tea chi ng qua l i ty
Europe
90,9%
10%
20%
30%
Spa i n
40%
50%
60%
70%
80%
90%
100%
Barcelona - Uni vers i dad Pompeu Fa bra
The diagram shows the % of students who evaluated the performance of their university as good for each of the
above factors.
Question: How does your university perform on these factors?
The trendence Graduate Barometer 2010 - Total Edition© trendence 2010
9
Partner Report: Universitat Pompeu Fabra
Education and university evaluation
Importance vs. evaluation
Academi c reputati on
IT faci l iti es
Tea chi ng qual i ty
Reputa tion among empl oyers
Uni vers i ty faci l iti es
Good l ocati on
Internati ona l ori entati on
Cours e content a nd s tructure
Pra cti ca l cours e content
Campus a cti vi ti es / s tudent l i fe
Lecturer/tutor avai l a bil i ty a nd hel pful nes s
Coopera ti on wi th empl oyers
Accommoda ti on avai l a bi l i ty
As s i s ta nce wi th ca reer pla nni ng
Univers i ty a dmi ni s tra tion s ervi ce
Cheap l ocati on
Importance (s tudents from your uni vers ity)
!
%
10
Eva l ua ti on of your uni vers i ty
The diagram compares what is important to students at your university and how they evaluate your university in
these factors.
Question Importance: Which are the most important factors for you when choosing a university/university course?
Question Evaluation: How does your university perform on these factors?
The trendence Graduate Barometer 2010 - Total Edition© trendence 2010
Chapter I
Partner Report: Universitat Pompeu Fabra
Evaluation of university performance - overall satisfaction in Europe
4.1 - 4.3
4.4 - 4.6
4.7 - 4.9
5.0 - 5.3
Europe
Average overall
satisfaction
4,8
Austria
4,1
Norway
5,1
Belgium
5,1
Poland
5,0
Bulgaria
5,1
Portugal
4,8
Czech Republic
4,5
Romania
4,9
Denm ark
4,8
Russia
5,3
Finland
4,7
Slovakia
4,5
France
5,2
Spain
4,6
Germ any
4,1
Sw eden
5,1
Greece
4,6
Sw itzerland
4,9
Hungary
4,9
Turkey
4,9
Ireland
4,9
United Kingdom
5,2
Italy
4,7
Barcelona - Universidad Pompeu Fabra
5,2
Country
!
%
Country
Netherlands
Average overall
satisfaction
5,2
The map shows overall satisfaction in their university among students in Europe.
Question: Overall how satisfied are you with your university/course? (1 = very dissatisfied and 7 = very satisfied).
The trendence Graduate Barometer 2010 - Total Edition© trendence 2010
11
Partner Report: Universitat Pompeu Fabra
Education and university evaluation
Views on university course and university careers fair
My university course provides me with the skills necessary for the labour market
Ba rcel ona - Uni vers i dad
Pompeu Fa bra
Spai n
22,2%
61,5%
37,5%
45,5%
Agree
17,0%
28,7%
54,7%
Europe
16,3%
Di s a gree
16,6%
No opi ni on
Awareness and use of careers fair at the university
Does your uni vers i ty ha ve
a careers fai r?
91,0%
Have you a ttended / do
you pl a n to a ttend thi s
ca reers fai r?
81,3%
yes
!
12
9,0%
18,7%
no
The diagram ‘Awareness and use of career fair at the university’ shows your students awareness and use of careers
fairs arranged at your university. The question ‘Have you attended to this careers fair’ was filled in by the students
answering yes to the question ‘Do your university have a careers fair’.
The trendence Graduate Barometer 2010 - Total Edition© trendence 2010
Chapter I
Partner Report: Universitat Pompeu Fabra
Interest in studying a masters course abroad
22.0% - 37.9%
38.0% - 52.9%
53.0% - 68.9%
69.0% - 84.9%
Country
%
Europe
50,2%
Netherlands
42,9%
Austria
52,6%
Norway
35,4%
Belgium
42,9%
Poland
37,2%
Bulgaria
66,6%
Portugal
43,1%
Czech Republic
27,7%
Romania
69,3%
Denm ark
53,9%
Russia
76,4%
Finland
34,1%
Slovakia
22,5%
France
50,7%
Spain
58,2%
Germ any
43,9%
Sw eden
45,6%
Greece
75,2%
Sw itzerland
48,2%
Hungary
45,6%
Turkey
84,3%
Ireland
46,9%
United Kingdom
48,4%
Italy
55,7%
Barcelona - Univer sidad Pompeu Fabra
74,7%
!
%
Country
%
The map and tables show the % of students who answered yes to this question.
Question: Are you interested in studying a master degree in a foreign country?
The trendence Graduate Barometer 2010 - Total Edition© trendence 2010
13
Partner Report: Universitat Pompeu Fabra
Education and university evaluation
Desired masters course destination
58,3%
US
63,8%
Uni ted Ki ngdom
17,0%
20,3%
Canada
France
16,8%
Aus tral i a
12,9%
16,8%
Swi tzerl and
8,1%
12,4%
Netherl ands
10,7%
12,1%
Irel and (Republ ic)
8,2%
Bel gi um
7,3%
7,9%
Norway
5,2%
7,4%
China
3,9%
6,2%
Fi nl and
6,0%
5,6%
Ital y
5,3%
Denmark
6,0%
4,1%
15,7%
20,4%
2,6%
1,2%
Aus tri a
Bulgari a
0,3%
0,9%
Portugal
4,4%
0,6%
Czech Republi c
1,5%
0,6%
Greece
2,0%
0,3%
Pol and
1,2%
0,3%
Rus s i a
0,7%
0,3%
Sl ova ki a
0,2%
0,3%
Turkey
0,6%
0,0%
0%
10%
Europe
14
24,5%
8,2%
9,1%
Sweden
%
76,2%
24,3%
24,4%
Germa ny
!
77,1%
20%
30%
40%
Spai n
50%
60%
70%
80%
90%
100%
Ba rcel ona - Univers i da d Pompeu Fa bra
The diagram shows the most desired master course destinations of students in your country.
Question: Where would you like to study this master degree?
The trendence Graduate Barometer 2010 - Total Edition© trendence 2010
Chapter I
Partner Report: Universitat Pompeu Fabra
Students wanting to study a masters course in Spain
0.0% - 7.9%
8.0% - 14.9%
15.0% - 22.9%
23.0% - 30.9%
Country
%
Austria
12,1%
Netherlands
17,4%
Belgium
16,8%
Norway
8,8%
Bulgaria
10,5%
Poland
19,5%
Czech Republic
14,0%
Portugal
30,7%
Denm ark
10,6%
Romania
15,3%
Finland
13,5%
Russia
9,6%
France
14,3%
Slovakia
8,7%
Germ any
9,8%
Spain
0,0%
Greece
13,5%
Sweden
10,0%
Hungary
14,1%
Switzerland
7,0%
Ireland
5,8%
Turkey
13,5%
Italy
24,2%
United Kingdom
9,1%
!
Country
%
The map shows the percentage of students from each country who would like to study a master course in your
country.
The trendence Graduate Barometer 2010 - Total Edition© trendence 2010
15
Chapter II:
Career
Chapter II
Partner Report: Universitat Pompeu Fabra
Opinions – future career
I am worried about my future career
Barcel ona - Uni vers i da d
Pompeu Fabra
73,8%
78,9%
Spa i n
!
%
19,3%
Europe
56,1%
Agree
Di s a gree
16,0%
34,6%
7,0%
5,1%
9,4%
No opi ni on
The diagram shows the percentage of all students in Europe, your country and at your university who worry about
their future career.
Question: I am worried about my future career
The trendence Graduate Barometer 2010 - Total Edition © trendence 2010
17
Partner Report: Universitat Pompeu Fabra
Career
Job application process
Estimated timeframe to find first position (months)
2.6 - 3.9
4.0 - 5.3
5.4 - 6.7
6.8 - 8.2
18
Country
Months
Country
Months
Europe
4,5
Netherlands
3,5
Austria
3,5
Norway
2,8
Belgium
3,7
Poland
5,2
Bulgaria
2,9
Portugal
4,1
Czech Republic
3,3
Romania
4,4
Denm ark
3,9
Russia
2,6
Finland
3,5
Slovakia
4,8
France
3,1
Spain
4,9
Germ any
3,9
Sw eden
4,5
Greece
6,2
Sw itzerland
3,1
Hungary
4,7
Turkey
8,2
Ireland
5,0
United Kingdom
4,7
Italy
6,2
Barcelona - Univer sidad Pompeu Fabra
4,1
The trendence Graduate Barometer 2010 - Total Edition© trendence 2010
Chapter II
Partner Report: Universitat Pompeu Fabra
Job application process
Estimated number of applications to find first position
7.0 - 15.9
16.0 - 24.9
25.0 - 33.9
34.0 - 42.9
Country
Applications
Europe
26,8
Netherlands
Country
12,3
Austria
27,5
Norway
12,5
Belgium
18,5
Poland
42,5
Bulgaria
19,7
Portugal
24,7
Czech Republic
17,7
Romania
33,4
Denm ark
23,7
Russia
17,2
Finland
20,2
Slovakia
31,0
France
29,4
Spain
27,3
Germ any
28,1
Sweden
22,0
Greece
21,2
Switzerland
18,9
Hungary
28,9
Turk ey
7,5
Ireland
27,4
United Kingdom
27,5
Italy
26,2
Barcelona - Universidad Pompeu Fabra
22,4
The trendence Graduate Barometer 2010 - Total Edition © trendence 2010
Applications
19
Partner Report: Universitat Pompeu Fabra
Career
Expectations of first position
Expected gross annual salary
€8000 - €19000
€19000 - €29000
€29000 - €40000
€40000 - €50000
Country
Gross annual salary €
Europe
€22 391
Netherlands
€29 226
Austria
€30 799
Norway
€46 929
Belgium
€26 485
Poland
€9 524
Bulgaria
€8 262
Portugal
€15 067
Czech Republic
€13 734
Rom ania
€10 326
Denm ark
€49 841
Russia
€15 616
Finland
€32 477
Slovakia
€12 258
France
€32 356
Spain
€20 146
Germ any
€41 744
Sweden
€32 331
Greece
€16 255
Switzerland
€46 455
Hungary
€9 946
Turkey
€14 468
Ireland
€29 094
United Kingdom
€25 993
Italy
€20 808
Bar celona - Universidad Pompeu Fabra
€21 784
20
Cou ntry
Gross annual salary €
The trendence Graduate Barometer 2010 - Total Edition© trendence 2010
Chapter II
Partner Report: Universitat Pompeu Fabra
Desired weekly working hour and desired time in first position
Desired weekly working hours
Ba rcel ona - Uni vers i dad
Pompeu Fa bra
41,6
40,8
Spai n
43,0
Europe
Desired time in first position (years)
Ba rcel ona - Uni vers i da d
Pompeu Fabra
5,7
10,1
Spa i n
Europe
The trendence Graduate Barometer 2010 - Total Edition © trendence 2010
7,0
21
Partner Report: Universitat Pompeu Fabra
Career
Mobility
After graduating I will leave my country to find a professional position abroad
Ba rcel ona - Uni vers i dad
Pompeu Fa bra
39,3%
Spai n
27,5%
Europe
26,7%
25,6%
34,8%
37,7%
40,7%
Agree
35,1%
32,6%
Di s a gree
No opi ni on
Imagine you received an attractive job offer. To what extent would you relocate? I would…
52,3%
Rel oca te worl d wi de
61,4%
18,3%
Rel oca te wi thi n Europe
22,5%
22,1%
Rel ocate withi n my country
of res i dence
10,2%
7,3%
Not rel oca te
6,0%
Europe
22
Spai n
Barcel ona - Uni vers i da d Pompeu Fabra
The trendence Graduate Barometer 2010 - Total Edition© trendence 2010
Chapter III:
Employer attractiveness
Partner Report: Universitat Pompeu Fabra
Employer attractiveness
Employer attractiveness (Business and Engineering)
Business
2010 Rank
%
24
Europe
1
Pricewa te rhous e Coope rs
6.8%
2
Google
6.3%
3
Erns t & Young
6.0%
4
L'Oréa l
5.7%
5
Deloitte
5.2%
6
Apple
5.2%
7
KPMG
4.8%
8
Coca -Cola
4.6%
9
Micros oft
4.3%
10
BMW Group
3.7%
Engineering
2010 Rank
!
Employer (top 10)
Employer (top 10)
Europe
1
Google
10.4%
2
Micros oft
8.0%
3
Apple
6.7%
4
IBM
5.8%
5
BMW Group
5.0%
6
EADS
4.9%
7
Sieme ns
4.9%
8
Nokia
3.3%
9
L'Oré a l
3.2%
10
Intel
3.1%
The two tables show the top 10 most popular employers in Europe (Business and Engineering).
Question: Which employers would you most likely apply to upon graduation?
The students could select 3 companies from a list of 120.
The trendence Graduate Barometer 2010 - Total Edition © trendence 2010
Chapter IV:
The students
Partner Report: Universitat Pompeu Fabra
The students
Student sample profile
Age (average in years)
Ba rcel ona - Uni vers i dad
Pompeu Fa bra
20,0
22,6
Spai n
22,8
Europe
Gender
26
Country
Male
Female
Europe
49,1%
50,9%
Austria
42,7%
57,3%
Belgium
50,1%
49,9%
Bulgaria
35,8%
64,2%
Czech Republic
45,9%
54,1%
Denm ark
47,7%
52,3%
Finland
39,7%
60,3%
France
60,7%
39,3%
Germ any
64,6%
35,4%
Greece
56,8%
43,2%
Hungary
44,2%
55,8%
Ireland
46,0%
54,0%
Italy
49,5%
50,5%
Netherlands
52,3%
47,7%
Norway
53,4%
46,6%
Poland
42,0%
58,0%
Portugal
51,5%
48,5%
Romania
37,6%
62,4%
Russia
48,6%
51,4%
Slovakia
39,1%
60,9%
Spain
43,2%
56,8%
Sweden
53,7%
46,3%
Switzerland
66,1%
33,9%
Turkey
59,8%
40,2%
United Kingdom
41,9%
58,1%
Barcelona - Universid ad Pompeu Fabra
46,0%
54,0%
The trendence Graduate Barometer 2010 - Total Edition © trendence 2010
Chapter IV
Partner Report: Universitat Pompeu Fabra
Student sample profile
Subject
Main course
21,5%
Bus i nes s / economi cs
76,1%
7,3%
9,3%
Computer s ci ence
Soci a l s ci ences /
humani ti es
25,7%
6,3%
4,9%
3,5%
Law
21,8%
Engi neeri ng
2,7%
6,5%
Natura l s ci ence
1,2%
Arts
1,5%
0,7%
10,2%
Hea lth s ci ence
0,3%
Mathema ti cs / s tati s ti cs
0,7%
0,0%
0%
10%
Europe
!
20%
30%
Spai n
40%
50%
60%
70%
80%
90%
100%
Barcel ona - Uni vers i dad Pompeu Fa bra
The diagram shows the main courses of the students taking part in the survey
The trendence Graduate Barometer 2010 - Total Edition © trendence 2010
27
Partner Report: Universitat Pompeu Fabra
The students
Student sample profile
Expected length of higher education and academic achievement
Expected length of education (in years)
Ba rcel ona - Uni vers ida d
Pompeu Fabra
5,0
5,9
Spa i n
5,1
Europe
Academic Achievement (Self assessed: 5 = outstanding achievement, 1 = poor achievement)
Ba rcel ona - Univers i dad
Pompeu Fabra
Spa in
Europe
28
3,6
3,5
3,7
The trendence Graduate Barometer 2010 - Total Edition © trendence 2010
Chapter IV
Partner Report: Universitat Pompeu Fabra
Experience and highly advanced English language skills
Experience and skills
67,3%
Non cours e rel a ted work
experience
76,7%
58,2%
Extra -curri cul a r a cti vi ti es
54,9%
28,5%
Hi ghl y adva nced Engl i s h
l angua ge s ki l l s
50,1%
Work, s tudy or vol unta ry
a cti vi ti es in a forei gn
country
31,0%
37,1%
48,8%
Cours e rel a ted work
experi ence
35,6%
0%
Europe
10%
20%
30%
40%
Spa i n
The trendence Graduate Barometer 2010 - Total Edition © trendence 2010
50%
60%
70%
80%
90%
100%
Ba rcel ona - Uni vers i dad Pompeu Fabra
29
Partner Report: Universitat Pompeu Fabra
The students
Experience and highly advanced English language skills
English language skills (according to students)
24.0% - 42.9%
43.0% - 61.9%
62.0% - 80.9%
81.0% - 100.0%
Country
%
Europe
59,0%
Netherlands
63,2%
Austria
81,5%
Norway
77,9%
Belgium
54,5%
Poland
49,3%
Bulgaria
40,8%
Portugal
53,9%
Czech Republic
31,6%
Romania
47,8%
Denm ark
72,5%
Russia
35,5%
Finland
74,2%
Slovakia
56,2%
France
49,6%
Spain
28,5%
Germ any
70,5%
Sw eden
65,3%
Greece
80,7%
Sw itzerland
66,2%
Hungary
24,6%
Turkey
34,6%
Ireland
100,0%
United Kingdom
100,0%
Italy
31,8%
Barcelona - Univer sidad Pompeu Fabra
50,1%
30
Country
%
The trendence Graduate Barometer 2010 - Total Edition © trendence 2010
Chapter IV
Partner Report: Universitat Pompeu Fabra
Opinions – student fees
Students should pay for their tertiary education
Ba rcel ona - Uni vers i dad
Pompeu Fa bra
Spai n
Europe
13,5%
71,3%
11,7%
15,2%
76,4%
17,2%
11,9%
70,5%
Agree
The trendence Graduate Barometer 2010 - Total Edition © trendence 2010
Di s a gree
12,3%
No opi ni on
31
Partner Report: Universitat Pompeu Fabra
About trendence
trendence is Europe’s leading research institute specialising in employer branding, personnel marketing and recruiting. Every
year, more than 300 000 school-leavers, students and young professionals from all over the world take part in our studies on
their career ambitions and employers of choice. These studies’ results are an invaluable support to organisations’ HR
departments: by providing authoritative, representative information on potential employees, they inform crucial decisions on
recruitment and marketing strategies. Furthermore, our results assist schools and higher education institutions in appraising
their performance and developing a coherently strategic approach. The ‘Top 100’ rankings of the most desirable employers,
compiled from our studies, are a particular focus of interest, acting as guides and benchmarks for the media, employers and the
employees of the future alike.
Our commitment to the quality of trendence research results is demonstrated by the fact that key members of our team hold
ESOMAR membership and by our absolute adherence to ISO 20252 and other recognised market research standards. trendence
also produces various print and online publications to support school-leavers and students in their career decision-making
process.
trendence is part of Group GTI, the world’s largest careers publisher, which has offices in Europe and Asia. As the market leader
in a dynamic environment, trendence regularly sees annual growth in double figures. Our clients are primarily organisations
with international or global operations.
trendence Institut
Markgrafenstr. 62
D - 10969 Berlin
For enquiries regarding research methodology please contact:
Ulrike Heyne, Research Manager
[email protected]
Phone +49 (0) 30 259 29 88-306
Fax +49 (0) 30 259 29 88-901
www.trendence.com
www.trendemployer.de
32
The trendence Graduate Barometer 2010 - Total Edition © trendence 2010
© Copyright 2026 Paperzz