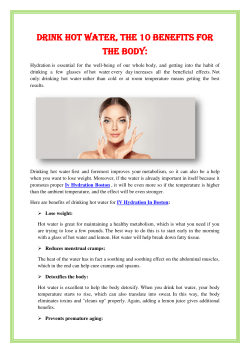
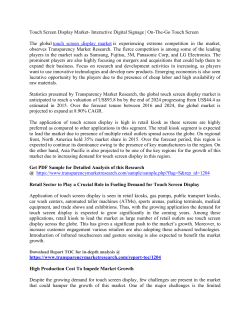
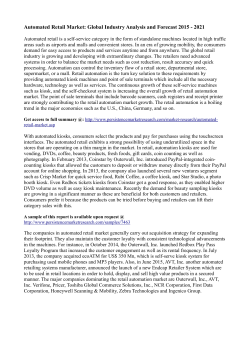
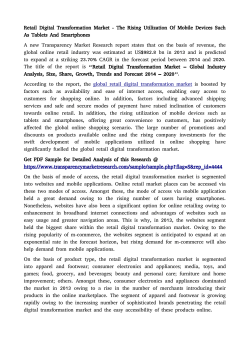
For release 10:00 a.m. (EDT) Thursday, August 6, 2015
USDL-15-1514
Technical Information: (202) 691-5618 • [email protected] • www.bls.gov/lpc
Media Contact:
(202) 691-5902 • [email protected]
PRODUCTIVITY AND COSTS BY INDUSTRY: WHOLESALE TRADE,
RETAIL TRADE, AND FOOD SERVICES AND DRINKING PLACES INDUSTRIES, 2014
Labor productivity – defined as output per hour – rose 2.6 percent in wholesale trade, 1.9 percent in
retail trade, and 0.3 percent in food services and drinking places in 2014, the U.S. Bureau of Labor
Statistics reported today. Unit labor costs, which reflect the total labor costs required to produce a unit
of output, also rose in all three sectors.
Productivity in wholesale trade rose faster in 2014 than in 2013. Both output and hours increased at a
higher rate than the previous year. In retail trade, output rose at a slightly slower rate and hours
increased after falling the previous year, leading to a smaller productivity rise than in 2013. The
productivity increase in food services and drinking places in 2014 resulted from an increase in output
that exceeded that of hours.
Chart 1. Annual percent change in labor productivity, output, and hours, 2013 and 2014
Productivity
Output
2014
2013
6
Hours
5
Percent Change
4
3
2
1
0
-1
-2
Wholesale
Trade
Retail
Trade
Food
Services and
Drinking
Places
Wholesale
Trade
Retail
Trade
Food
Services and
Drinking
Places
Labor Productivity Trends in 2014
Productivity increased in 30 of the 49 detailed 4-digit NAICS industries studied in 2014. Both output
and hours grew in 42 industries. Unit labor costs fell in 18 industries in 2014.
In wholesale trade, productivity rose 2.6 percent as output grew 4.3 percent and hours increased 1.7
percent. Productivity grew 2.4 percent in durable goods wholesalers and 3.1 percent in nondurable
goods wholesalers. Productivity increased in 16 of the 19 detailed wholesale trade industries, while
output rose in 17 industries and hours grew in 18. Productivity increased most rapidly in apparel and
piece goods and druggists’ goods, as output rose substantially in each. Unit labor costs declined in eight
industries.
In retail trade, productivity grew 1.9 percent, as output rose 3.9 percent and hours rose 2.0 percent.
Productivity increased in 13 of the 27 detailed retail trade industries, as output grew in 22 industries and
hours rose in 21. The largest productivity increases were in beer, wine, and liquor stores and electronics
and appliance stores. Output increased strongly in both of these industries. Unit labor costs fell in nine
industries.
In food services and drinking places, productivity rose 0.3 percent, as output grew 3.7 percent and
hours rose 3.3 percent. Output and hours rose in all three of the detailed industries in this sector, while
only restaurants and other eating places recorded an increase in productivity. Unit labor costs rose in two
of the industries.
Productivity increased in 11 of the 16 3-digit NAICS industries studied in 2014. Productivity gains of at
least 5 percent occurred in 2 industries where output increased strongly: electronics and appliance stores
and health and personal care stores.
Chart 2: Percent change in labor productivity, output, and hours in wholesale trade, retail trade,
and food services and drinking places industries, 2014
Productivity
Output
Hours
Electronics and appliance stores
Health and personal care stores
Motor vehicle and parts dealers
Building material and garden supply stores
Nondurable goods
General merchandise stores
Durable goods
Electronic markets and agents and brokers
Clothing and clothing accessories stores
Miscellaneous store retailers
Food services and drinking places
Furniture and home furnishings stores
Gasoline stations
Food and beverage stores
Nonstore retailers
Sports, hobby, music instruments, book stores
-4
-2
2
0
2
4
Percent Change
6
8
10
Unit labor costs fell in 5 out of 16 3-digit NAICS industries in 2014. All unit labor cost declines
occurred in industries where productivity rose. Conversely, each of the industries where productivity fell
also recorded an increase in unit labor costs. Labor compensation rose in 2014 in all 16 industries.
Chart 3. Percent change in labor productivity and unit labor costs in wholesale trade, retail trade,
and food services and drinking places industries, 2014
Productivity
Unit Labor Costs
Electronics and appliance stores
Health and personal care stores
Motor vehicle and parts dealers
Building material and garden supply stores
Nondurable goods
General merchandise stores
Durable goods
Electronic markets and agents and brokers
Clothing and clothing accessories stores
Food services and drinking places
Miscellaneous store retailers
Furniture and home furnishings stores
Gasoline stations
Food and beverage stores
Nonstore retailers
Sports, hobby, music instruments, book stores
-8
-6
-4
-2
0
2
Percent Change
4
6
8
Chart 4. Percent change in labor compensation, output, and unit labor costs in wholesale trade,
retail trade, and food services and drinking places industries, 2014
Unit Labor Costs
Output
Labor Compensation
Nonstore retailers
Miscellaneous store retailers
Electronic markets and agents and brokers
Furniture and home furnishings stores
Food and beverage stores
Motor vehicle and parts dealers
Sports, hobby, music instruments, book stores
Health and personal care stores
Nondurable goods
Food services and drinking places
Gasoline stations
Electronics and appliance stores
Durable goods
Clothing and clothing accessories stores
Building material and garden supply stores
General merchandise stores
-8
-6
3
-4
-2
0
2
4
Percent Change
6
8
10
12
Of the 12 largest detailed wholesale trade, retail trade, and food services and drinking places industries,
ranked by employment size, output rose in 10 industries and hours rose in 8. Productivity growth was
greatest in health and personal care stores, where output grew and hours declined. Productivity fell the
most in special food services, where strong growth in hours outpaced the increase in output.
Chart 5. Percent change in labor productivity, output, and hours in the largest (by employment)
wholesale trade, retail trade, and food services and drinking places industries, 2014
10
Industries with increasing productivity
Industries with decreasing productivity
8
4.4
Other general
merchandise stores
6
Percent Change in Output
Automobile dealers
Electronic markets and
agents and brokers
Building material and
supplies dealers
Health and personal
care stores
4
5.0
Special food services
2.6
4.4
-4.7
0.9
2.4
Restaurants and
other eating places
2.3
2
4.7
Grocery and
related products
-2.0
Clothing stores
0
-0.4
1.2
-2
Grocery
stores
Gasoline stations
Department
stores
Note: Bubble size represents industry
employment. Value in the bubble indicates
percent change in labor productivity.
-4
-4
-2
0
2
4
Percent Change in Hours
6
8
10
Labor Productivity Trends in Selected Time Periods
From 1987 to 2014, productivity increased at an average annual rate of 3.1 percent in wholesale trade,
2.8 percent in retail trade, and 0.4 percent in food services and drinking places. Unit labor costs rose in
wholesale trade and in food services and drinking places, and were unchanged in retail trade from 1987
to 2014. (See Table 2 and Chart 6.)
Among the detailed 4-digit NAICS industries, productivity rose in approximately 89 percent of
wholesale trade industries, 100 percent of retail trade industries, and 67 percent of food services and
drinking places industries from 1987 to 2014. Median productivity growth among these industries was
2.2 percent per year. Productivity growth over the long term was associated with rising output in many
industries, while hours increased in slightly more than half.
4
Productivity also increased in about two-thirds of the detailed industries studied between 2007 and 2014,
despite the fact that the period encompassed a recession. However, only 55 percent of the industries saw
increases in output, while 37 percent experienced growth in hours.
Chart 6. Percent of industries with increases in labor productivity, output, and hours, 1987-2014,
2007-2014
Productivity
Output
1987-2014
100
Hours
2007-2014
Percent of Industries
90
80
70
60
50
40
30
20
10
0
Wholesale
Trade
Retail
Trade
Food
Services and
Drinking
Places
5
Wholesale
Trade
Retail
Trade
Food
Services and
Drinking
Places
Additional Information
The trade and food services and drinking places measures in this release incorporate preliminary data
from the Census Bureau’s Annual Wholesale Trade Report (February 2015), Monthly Wholesale Trade
Survey (May 2015), Annual Retail Trade Survey (March 2015), and the Annual Revision of the
Monthly Retail and Food Services: Sales and Inventories (May 2015), as well as data from the Census
Bureau’s Nonemployer Statistics (May 2015). The labor productivity and output series for all industries
have been revised for 2013 and earlier years as a result. This news release also incorporates the annual
benchmark revision of the BLS Current Employment Statistics (CES) survey published in February
2015. In addition, the unit labor cost measures incorporate preliminary data from the BLS Quarterly
Census of Employment and Wages (June 2015). All of the measures for 2014 in this release are
preliminary and subject to revision.
For the first time, the industries included in this news release are classified according to the 2012
NAICS. Indexes have been rebased from 2002=100 to 2007=100 starting with this release. While the
rates of change reported by BLS in this release are rounded to one decimal place, all percent changes are
calculated using index numbers rounded to three decimal places.
Year-to-year movements in industry productivity may be erratic, particularly in smaller industries. The
annual measures based on sample data may differ from measures generated by a census of
establishments in the industry. Annual changes in an industry’s output and use of labor may reflect
cyclical changes in the economy as well as long-term trends. As a result, long-term productivity trends
tend to be more reliable indicators of industry performance than year-to-year changes.
Want to know more?
Find more detailed data at www.bls.gov/lpc for:
-Additional industries and sectors
-Additional data series: indexes of productivity and related measures; rates of
change; and levels of industry employment, hours, nominal value of production,
and labor compensation.
-Additional years and long term data
Questions?
Additional information can be obtained by calling the industry productivity program (202) 6915618 or by sending a message via http://data.bls.gov/cgi-bin/forms/ips?/lpc/contact.htm
Information in this report will be made available to sensory-impaired individuals upon request.
TDD message referral phone number: 1-800-877-8339.
Subscribe to Newsletter
Customers can subscribe to the industry productivity program’s news releases on the BLS website
at https://subscriptions.bls.gov/accounts/USDOLBLS/subscriber/new.
6
Technical Note
Labor Productivity: The industry labor productivity measures describe the relationship between
industry output and the labor time involved in its production. They show the changes from period to
period in the amount of goods and services produced per hour. Although the labor productivity measures
relate output to hours of all persons in an industry, they do not measure the specific contribution of labor
or any other factor of production. Rather, they reflect the joint effects of many influences, including:
changes in technology; capital investment; utilization of capacity, energy, and materials; the use of
purchased services inputs, including contract employment services; the organization of production; the
characteristics and effort of the workforce; and managerial skill.
Output: Industry output is measured as an annual-weighted index of the changes in the various products
or services (in real terms) provided for sale outside the industry. Real industry output for data in this
release is derived by deflating nominal sales or values of production using BLS price indexes. Industry
output measures are constructed primarily using data from the economic censuses and annual surveys of
the U.S. Census Bureau, U.S. Department of Commerce, together with information on price changes
primarily from BLS.
Labor Hours: Labor hours reflect annual hours worked by all employed persons in an industry. Data on
industry employment and hours come primarily from the BLS Current Employment Statistics (CES)
survey and the Current Population Survey (CPS). CES data on the number of total and nonsupervisory
worker jobs held by wage and salary workers in nonfarm establishments are supplemented with CPS
self-employed and unpaid family worker data to estimate industry employment. Hours worked estimates
are derived using CES and CPS employment, CES data on average weekly hours paid of nonsupervisory
workers, CPS data on hours of supervisory, self-employed, and unpaid family workers, and ratios of
hours-worked to hours-paid based on data from the BLS National Compensation Survey (NCS). For
some industries, employment and hours data are supplemented or further disaggregated using data from
the BLS Quarterly Census of Employment and Wages (QCEW), the Census Bureau, or other sources.
Hours worked are estimated separately for different types of workers and then are directly aggregated;
no adjustments for labor composition are made.
Unit Labor Costs: Unit labor costs represent the cost of labor required to produce one unit of output.
The unit labor cost indexes are computed by dividing an index of nominal labor compensation by an
index of real industry output. Unit labor costs also describe the relationship between compensation per
hour and real output per hour (labor productivity). Increases in hourly compensation increase unit labor
costs; increases in labor productivity offset hourly compensation increases and lower unit labor costs.
Labor Compensation: Labor compensation, defined as payroll plus supplemental payments, is a
measure of the cost to the employer of securing the services of labor. Payroll includes salaries, wages,
commissions, dismissal pay, bonuses, vacation and sick leave pay, and compensation in kind.
Supplemental payments include both legally required expenditures and payments for voluntary
programs. The legally required portion consists primarily of Federal old age and survivors’ insurance,
unemployment compensation, and workers’ compensation. Payments for voluntary programs include all
programs not specifically required by legislation, such as the employer portion of private health
insurance and pension plans. Industry compensation measures are constructed primarily using data from
the BLS QCEW and the economic censuses of the Census Bureau, U.S. Department of Commerce.
7
Table 1. Percent change in labor productivity, unit labor costs, and related data, 2013-2014
2012
NAICS
code
Industry
2014
Employment
(thousands)
Wholesale Trade
Wholesale trade. . . . . . . . . . . . . . . . . . . . . . . . . . . . . . . . . . . . . . . . . . . . . . . . . . . 42
Percent change, 2013-2014
Labor
productivity
Output
Hours
Labor
compensation
Unit labor
costs
5,983.0
2.6
4.3
1.7
4.9
0.5
Durable goods. . . . . . . . . . . . . . . . . . . . . . . . . . . . . . . . . . . . . . . . . . . . . . . . . .
Motor vehicles and parts. . . . . . . . . . . . . . . . . . . . . . . . . . . . . . . . . . . .
Furniture and furnishings. . . . . . . . . . . . . . . . . . . . . . . . . . . . . . . . . . . .
Lumber and construction supplies. . . . . . . . . . . . . . . . . . . . . . . . . .
Commercial equipment. . . . . . . . . . . . . . . . . . . . . . . . . . . . . . . . . . . . . .
Metals and minerals. . . . . . . . . . . . . . . . . . . . . . . . . . . . . . . . . . . . . . . . .
Appliances and electric goods. . . . . . . . . . . . . . . . . . . . . . . . . . . . . .
Hardware and plumbing. . . . . . . . . . . . . . . . . . . . . . . . . . . . . . . . . . . . .
Machinery and supplies. . . . . . . . . . . . . . . . . . . . . . . . . . . . . . . . . . . . .
Miscellaneous durable goods. . . . . . . . . . . . . . . . . . . . . . . . . . . . . . .
423
4231
4232
4233
4234
4235
4236
4237
4238
4239
2,986.5
337.7
104.0
203.9
636.5
129.2
327.5
238.7
685.2
323.8
2.4
2.6
0.7
1.4
3.1
2.7
1.8
1.1
3.6
-1.5
4.7
3.0
3.3
1.8
5.4
8.6
7.9
3.2
6.1
-1.4
2.3
0.4
2.6
0.4
2.2
5.7
6.0
2.0
2.4
0.1
4.5
8.4
3.2
5.8
3.8
7.0
3.9
3.9
4.9
2.0
-0.2
5.2
-0.1
3.9
-1.5
-1.4
-3.7
0.7
-1.2
3.4
Nondurable goods. . . . . . . . . . . . . . . . . . . . . . . . . . . . . . . . . . . . . . . . . . . . . .
Paper and paper products. . . . . . . . . . . . . . . . . . . . . . . . . . . . . . . . . .
Druggists’ goods. . . . . . . . . . . . . . . . . . . . . . . . . . . . . . . . . . . . . . . . . . . . .
Apparel and piece goods. . . . . . . . . . . . . . . . . . . . . . . . . . . . . . . . . . . .
Grocery and related products. . . . . . . . . . . . . . . . . . . . . . . . . . . . . . .
Farm product raw materials. . . . . . . . . . . . . . . . . . . . . . . . . . . . . . . . .
Chemicals. . . . . . . . . . . . . . . . . . . . . . . . . . . . . . . . . . . . . . . . . . . . . . . . . . . . .
Petroleum. . . . . . . . . . . . . . . . . . . . . . . . . . . . . . . . . . . . . . . . . . . . . . . . . . . . .
Alcoholic beverages. . . . . . . . . . . . . . . . . . . . . . . . . . . . . . . . . . . . . . . . .
Miscellaneous nondurable goods. . . . . . . . . . . . . . . . . . . . . . . . . . .
424
4241
4242
4243
4244
4245
4246
4247
4248
4249
2,090.2
125.7
196.1
151.4
773.2
81.7
132.8
100.9
187.1
341.3
3.1
2.4
6.6
9.7
2.3
6.2
3.1
-3.6
2.0
-2.1
4.1
3.7
7.0
8.4
2.9
11.7
4.9
2.5
2.1
-1.5
1.0
1.3
0.3
-1.2
0.5
5.1
1.8
6.3
0.1
0.7
5.3
2.8
9.2
1.9
6.0
-0.4
5.8
6.7
5.2
2.9
1.2
-0.9
2.1
-6.0
3.1
-10.8
0.9
4.1
3.0
4.5
Electronic markets and agents and brokers. . . . . . . . . . . . . . . . . 425
Electronic markets and agents and brokers. . . . . . . . . . . . . . . 4251
906.3
906.3
2.4
2.4
3.6
3.6
1.2
1.2
5.2
5.2
1.6
1.6
Retail Trade
Retail trade. . . . . . . . . . . . . . . . . . . . . . . . . . . . . . . . . . . . . . . . . . . . . . . . . . . . . . . . . 44-45
16,196.5
1.9
3.9
2.0
4.8
0.8
441
4411
4412
4413
1,921.7
1,219.2
143.0
559.5
3.7
4.4
3.8
-2.4
7.5
8.1
8.4
1.1
3.7
3.6
4.5
3.6
6.3
7.4
5.3
2.9
-1.1
-0.6
-2.8
1.8
Furniture and home furnishings stores. . . . . . . . . . . . . . . . . . . . . . . 442
Furniture stores. . . . . . . . . . . . . . . . . . . . . . . . . . . . . . . . . . . . . . . . . . . . . . 4421
Home furnishings stores. . . . . . . . . . . . . . . . . . . . . . . . . . . . . . . . . . . . . 4422
491.2
229.5
261.7
-0.2
1.7
-2.4
6.1
7.5
4.5
6.4
5.8
7.0
7.2
6.5
8.0
1.0
-1.0
3.3
Electronics and appliance stores. . . . . . . . . . . . . . . . . . . . . . . . . . . . . . 443
Electronics and appliance stores. . . . . . . . . . . . . . . . . . . . . . . . . . . 4431
516.2
516.2
5.7
5.7
9.3
9.3
3.5
3.5
2.2
2.2
-6.5
-6.5
Building material and garden supply stores. . . . . . . . . . . . . . . . . . 444
Building material and supplies dealers. . . . . . . . . . . . . . . . . . . . . 4441
Lawn and garden equipment and supplies stores. . . . . . . . 4442
1,278.5
1,106.9
171.6
3.6
4.4
-1.1
4.6
4.0
8.1
0.9
-0.4
9.4
4.0
2.9
12.5
-0.5
-1.1
4.0
Food and beverage stores. . . . . . . . . . . . . . . . . . . . . . . . . . . . . . . . . . . . .
Grocery stores. . . . . . . . . . . . . . . . . . . . . . . . . . . . . . . . . . . . . . . . . . . . . . . .
Specialty food stores. . . . . . . . . . . . . . . . . . . . . . . . . . . . . . . . . . . . . . . .
Beer, wine and liquor stores. . . . . . . . . . . . . . . . . . . . . . . . . . . . . . . .
445
4451
4452
4453
3,090.1
2,671.6
255.4
163.1
-1.3
-2.0
3.0
6.7
1.3
0.9
6.7
3.7
2.7
2.9
3.5
-2.9
4.4
4.4
7.3
-0.2
3.1
3.5
0.6
-3.8
Health and personal care stores. . . . . . . . . . . . . . . . . . . . . . . . . . . . . . 446
Health and personal care stores. . . . . . . . . . . . . . . . . . . . . . . . . . . 4461
1,065.7
1,065.7
5.0
5.0
3.9
3.9
-1.0
-1.0
3.2
3.2
-0.8
-0.8
Gasoline stations. . . . . . . . . . . . . . . . . . . . . . . . . . . . . . . . . . . . . . . . . . . . . . . 447
Gasoline stations. . . . . . . . . . . . . . . . . . . . . . . . . . . . . . . . . . . . . . . . . . . . . 4471
889.6
889.6
-0.4
-0.4
-0.1
-0.1
0.3
0.3
4.0
4.0
4.1
4.1
448
4481
4482
4483
1,468.9
1,079.9
206.2
182.8
1.5
4.7
-7.2
-2.9
2.3
2.0
2.9
3.4
0.8
-2.6
10.8
6.5
3.2
1.4
5.4
7.9
0.8
-0.6
2.4
4.4
Sports, hobby, music instruments, book stores. . . . . . . . . . . . . 451
Sporting goods and musical instrument stores. . . . . . . . . . . 4511
Book stores and news dealers. . . . . . . . . . . . . . . . . . . . . . . . . . . . . 4512
676.4
578.3
98.1
-2.1
-1.0
-8.2
1.3
1.7
-1.0
3.4
2.7
7.8
3.9
4.6
0.0
2.6
2.8
1.0
Motor vehicle and parts dealers. . . . . . . . . . . . . . . . . . . . . . . . . . . . . . .
Automobile dealers. . . . . . . . . . . . . . . . . . . . . . . . . . . . . . . . . . . . . . . . . .
Other motor vehicle dealers. . . . . . . . . . . . . . . . . . . . . . . . . . . . . . . .
Auto parts, accessories, and tire stores. . . . . . . . . . . . . . . . . . .
Clothing and clothing accessories stores. . . . . . . . . . . . . . . . . . . .
Clothing stores. . . . . . . . . . . . . . . . . . . . . . . . . . . . . . . . . . . . . . . . . . . . . . .
Shoe stores. . . . . . . . . . . . . . . . . . . . . . . . . . . . . . . . . . . . . . . . . . . . . . . . . . .
Jewelry, luggage, and leather goods stores. . . . . . . . . . . . . . .
8
Table 1. Percent change in labor productivity, unit labor costs, and related data, 2013-2014 — Continued
Industry
2012
NAICS
code
2014
Employment
(thousands)
General merchandise stores. . . . . . . . . . . . . . . . . . . . . . . . . . . . . . . . . . . 452
Department stores. . . . . . . . . . . . . . . . . . . . . . . . . . . . . . . . . . . . . . . . . . . 4521
Other general merchandise stores. . . . . . . . . . . . . . . . . . . . . . . . . 4529
Percent change, 2013-2014
Labor
productivity
Output
Hours
Labor
compensation
Unit labor
costs
3,123.5
1,349.5
1,774.0
2.8
1.2
2.6
2.6
-0.8
3.8
-0.2
-2.0
1.2
3.1
1.1
4.4
0.5
2.0
0.6
Miscellaneous store retailers. . . . . . . . . . . . . . . . . . . . . . . . . . . . . . . . . .
Florists. . . . . . . . . . . . . . . . . . . . . . . . . . . . . . . . . . . . . . . . . . . . . . . . . . . . . . . .
Office supplies, stationery and gift stores. . . . . . . . . . . . . . . . .
Used merchandise stores. . . . . . . . . . . . . . . . . . . . . . . . . . . . . . . . . . .
Other miscellaneous store retailers. . . . . . . . . . . . . . . . . . . . . . . .
453
4531
4532
4533
4539
976.4
88.7
307.9
219.6
360.2
0.3
-11.7
3.7
2.8
-0.5
2.6
4.4
0.9
4.0
3.0
2.3
18.2
-2.7
1.2
3.4
5.1
14.0
-1.9
6.9
8.3
2.5
9.2
-2.8
2.8
5.2
Nonstore retailers. . . . . . . . . . . . . . . . . . . . . . . . . . . . . . . . . . . . . . . . . . . . . . .
Electronic shopping and mail-order houses. . . . . . . . . . . . . . .
Vending machine operators. . . . . . . . . . . . . . . . . . . . . . . . . . . . . . . . .
Direct selling establishments. . . . . . . . . . . . . . . . . . . . . . . . . . . . . . . .
454
4541
4542
4543
698.3
387.6
46.9
263.8
-1.8
-1.3
-6.8
-8.2
6.3
8.5
-1.7
-2.7
8.2
9.9
5.5
6.1
11.1
15.3
3.6
4.1
4.6
6.3
5.4
6.9
10,932.9
774.1
371.3
9,787.5
9,787.5
5,091.1
4,696.4
0.3
-4.7
0.0
0.9
0.9
2.5
-0.8
3.7
4.0
1.3
3.8
3.8
4.9
2.6
3.3
9.0
1.4
2.9
2.9
2.4
3.4
5.4
2.3
3.6
5.8
5.8
5.8
5.8
1.6
-1.6
2.2
2.0
2.0
0.9
3.0
Food Services and Drinking Places
Food services and drinking places. . . . . . . . . . . . . . . . . . . . . . . . . . . .
Special food services. . . . . . . . . . . . . . . . . . . . . . . . . . . . . . . . . . . . . . . .
Drinking places, alcoholic beverages. . . . . . . . . . . . . . . . . . . . . .
Restaurants and other eating places. . . . . . . . . . . . . . . . . . . . . . .
Restaurants and other eating places. . . . . . . . . . . . . . . . . . . .
Full-service restaurants. . . . . . . . . . . . . . . . . . . . . . . . . . . . . . . .
Limited-service eating places. . . . . . . . . . . . . . . . . . . . . . . . . .
722
7223
7224
7225
72251
722511
722513,4,5
9
Table 2. Average annual percent change in labor productivity, unit labor costs, and related data, 1987-2014
2012
NAICS
code
Industry
Wholesale Trade
Wholesale trade. . . . . . . . . . . . . . . . . . . . . . . . . . . . . . . . . . . . . . . . . . . . . . . . . . . . . . . . . . . . . . . . . . . . . . 42
Average annual percent change, 1987-2014
Labor
productivity
Output
Hours
Labor
compensation
Unit labor
costs
3.1
3.5
0.3
4.2
0.7
Durable goods. . . . . . . . . . . . . . . . . . . . . . . . . . . . . . . . . . . . . . . . . . . . . . . . . . . . . . . . . . . . . . . . . . . . .
Motor vehicles and parts. . . . . . . . . . . . . . . . . . . . . . . . . . . . . . . . . . . . . . . . . . . . . . . . . . . . . . .
Furniture and furnishings. . . . . . . . . . . . . . . . . . . . . . . . . . . . . . . . . . . . . . . . . . . . . . . . . . . . . . .
Lumber and construction supplies. . . . . . . . . . . . . . . . . . . . . . . . . . . . . . . . . . . . . . . . . . . .
Commercial equipment. . . . . . . . . . . . . . . . . . . . . . . . . . . . . . . . . . . . . . . . . . . . . . . . . . . . . . . . .
Metals and minerals. . . . . . . . . . . . . . . . . . . . . . . . . . . . . . . . . . . . . . . . . . . . . . . . . . . . . . . . . . . .
Appliances and electric goods. . . . . . . . . . . . . . . . . . . . . . . . . . . . . . . . . . . . . . . . . . . . . . . . .
Hardware and plumbing. . . . . . . . . . . . . . . . . . . . . . . . . . . . . . . . . . . . . . . . . . . . . . . . . . . . . . . .
Machinery and supplies. . . . . . . . . . . . . . . . . . . . . . . . . . . . . . . . . . . . . . . . . . . . . . . . . . . . . . . .
Miscellaneous durable goods. . . . . . . . . . . . . . . . . . . . . . . . . . . . . . . . . . . . . . . . . . . . . . . . . .
423
4231
4232
4233
4234
4235
4236
4237
4238
4239
4.9
3.9
2.1
1.4
12.7
-0.2
8.3
1.8
2.3
1.3
4.9
3.5
1.6
1.5
12.9
0.1
7.8
2.3
2.3
2.0
0.0
-0.4
-0.5
0.1
0.2
0.3
-0.5
0.5
0.0
0.7
4.1
3.5
3.7
2.8
4.4
3.7
4.2
4.2
4.2
4.5
-0.8
0.0
2.0
1.3
-7.5
3.7
-3.4
1.8
1.8
2.4
Nondurable goods. . . . . . . . . . . . . . . . . . . . . . . . . . . . . . . . . . . . . . . . . . . . . . . . . . . . . . . . . . . . . . . . .
Paper and paper products. . . . . . . . . . . . . . . . . . . . . . . . . . . . . . . . . . . . . . . . . . . . . . . . . . . . .
Druggists’ goods. . . . . . . . . . . . . . . . . . . . . . . . . . . . . . . . . . . . . . . . . . . . . . . . . . . . . . . . . . . . . . . .
Apparel and piece goods. . . . . . . . . . . . . . . . . . . . . . . . . . . . . . . . . . . . . . . . . . . . . . . . . . . . . . .
Grocery and related products. . . . . . . . . . . . . . . . . . . . . . . . . . . . . . . . . . . . . . . . . . . . . . . . . .
Farm product raw materials. . . . . . . . . . . . . . . . . . . . . . . . . . . . . . . . . . . . . . . . . . . . . . . . . . . .
Chemicals. . . . . . . . . . . . . . . . . . . . . . . . . . . . . . . . . . . . . . . . . . . . . . . . . . . . . . . . . . . . . . . . . . . . . . . .
Petroleum. . . . . . . . . . . . . . . . . . . . . . . . . . . . . . . . . . . . . . . . . . . . . . . . . . . . . . . . . . . . . . . . . . . . . . . .
Alcoholic beverages. . . . . . . . . . . . . . . . . . . . . . . . . . . . . . . . . . . . . . . . . . . . . . . . . . . . . . . . . . . .
Miscellaneous nondurable goods. . . . . . . . . . . . . . . . . . . . . . . . . . . . . . . . . . . . . . . . . . . . .
424
4241
4242
4243
4244
4245
4246
4247
4248
4249
1.7
1.3
4.1
2.8
1.2
1.8
0.8
2.8
-0.1
0.3
1.8
0.6
5.2
2.3
1.9
0.1
1.1
1.2
1.8
-0.1
0.1
-0.7
1.1
-0.4
0.6
-1.6
0.3
-1.5
1.9
-0.4
4.3
2.8
8.2
3.2
4.3
3.9
4.2
3.2
5.1
3.0
2.4
2.2
2.8
0.9
2.4
3.8
3.0
2.0
3.2
3.1
Electronic markets and agents and brokers. . . . . . . . . . . . . . . . . . . . . . . . . . . . . . . . . . . . 425
Electronic markets and agents and brokers. . . . . . . . . . . . . . . . . . . . . . . . . . . . . . . . . . 4251
0.7
0.7
3.0
3.0
2.3
2.3
4.7
4.7
1.7
1.7
Retail Trade
Retail trade. . . . . . . . . . . . . . . . . . . . . . . . . . . . . . . . . . . . . . . . . . . . . . . . . . . . . . . . . . . . . . . . . . . . . . . . . . . . 44-45
2.8
3.2
0.4
3.3
0.0
441
4411
4412
4413
2.1
2.2
2.7
1.0
2.9
2.9
3.5
1.8
0.7
0.7
0.7
0.8
3.5
3.6
4.3
3.2
0.7
0.6
0.8
1.3
Furniture and home furnishings stores. . . . . . . . . . . . . . . . . . . . . . . . . . . . . . . . . . . . . . . . . . 442
Furniture stores. . . . . . . . . . . . . . . . . . . . . . . . . . . . . . . . . . . . . . . . . . . . . . . . . . . . . . . . . . . . . . . . . 4421
Home furnishings stores. . . . . . . . . . . . . . . . . . . . . . . . . . . . . . . . . . . . . . . . . . . . . . . . . . . . . . . 4422
3.7
3.3
4.3
3.5
3.0
4.2
-0.2
-0.3
-0.2
2.6
2.3
2.9
-0.9
-0.6
-1.2
Electronics and appliance stores. . . . . . . . . . . . . . . . . . . . . . . . . . . . . . . . . . . . . . . . . . . . . . . . . 443
Electronics and appliance stores. . . . . . . . . . . . . . . . . . . . . . . . . . . . . . . . . . . . . . . . . . . . . . 4431
11.3
11.3
12.1
12.1
0.7
0.7
3.3
3.3
-7.8
-7.8
Building material and garden supply stores. . . . . . . . . . . . . . . . . . . . . . . . . . . . . . . . . . . . . 444
Building material and supplies dealers. . . . . . . . . . . . . . . . . . . . . . . . . . . . . . . . . . . . . . . 4441
Lawn and garden equipment and supplies stores. . . . . . . . . . . . . . . . . . . . . . . . . . . 4442
2.5
2.4
3.4
3.2
3.1
3.4
0.6
0.8
0.0
3.3
3.4
2.5
0.1
0.2
-0.9
Food and beverage stores. . . . . . . . . . . . . . . . . . . . . . . . . . . . . . . . . . . . . . . . . . . . . . . . . . . . . . . .
Grocery stores. . . . . . . . . . . . . . . . . . . . . . . . . . . . . . . . . . . . . . . . . . . . . . . . . . . . . . . . . . . . . . . . . . .
Specialty food stores. . . . . . . . . . . . . . . . . . . . . . . . . . . . . . . . . . . . . . . . . . . . . . . . . . . . . . . . . . .
Beer, wine and liquor stores. . . . . . . . . . . . . . . . . . . . . . . . . . . . . . . . . . . . . . . . . . . . . . . . . . .
445
4451
4452
4453
0.3
0.2
0.2
2.2
0.3
0.3
-0.3
1.2
0.0
0.1
-0.5
-1.0
2.9
3.1
1.8
1.7
2.5
2.8
2.1
0.6
Health and personal care stores. . . . . . . . . . . . . . . . . . . . . . . . . . . . . . . . . . . . . . . . . . . . . . . . . 446
Health and personal care stores. . . . . . . . . . . . . . . . . . . . . . . . . . . . . . . . . . . . . . . . . . . . . . 4461
2.2
2.2
3.2
3.2
1.0
1.0
4.6
4.6
1.3
1.3
Gasoline stations. . . . . . . . . . . . . . . . . . . . . . . . . . . . . . . . . . . . . . . . . . . . . . . . . . . . . . . . . . . . . . . . . . 447
Gasoline stations. . . . . . . . . . . . . . . . . . . . . . . . . . . . . . . . . . . . . . . . . . . . . . . . . . . . . . . . . . . . . . . . 4471
1.5
1.5
1.0
1.0
-0.5
-0.5
2.3
2.3
1.3
1.3
Clothing and clothing accessories stores. . . . . . . . . . . . . . . . . . . . . . . . . . . . . . . . . . . . . . .
Clothing stores. . . . . . . . . . . . . . . . . . . . . . . . . . . . . . . . . . . . . . . . . . . . . . . . . . . . . . . . . . . . . . . . . .
Shoe stores. . . . . . . . . . . . . . . . . . . . . . . . . . . . . . . . . . . . . . . . . . . . . . . . . . . . . . . . . . . . . . . . . . . . . .
Jewelry, luggage, and leather goods stores. . . . . . . . . . . . . . . . . . . . . . . . . . . . . . . . .
448
4481
4482
4483
4.1
4.5
3.0
3.2
3.8
4.3
2.6
2.8
-0.3
-0.2
-0.4
-0.4
2.7
2.8
1.9
2.9
-1.1
-1.5
-0.7
0.1
Sports, hobby, music instruments, book stores. . . . . . . . . . . . . . . . . . . . . . . . . . . . . . . . 451
Sporting goods and musical instrument stores. . . . . . . . . . . . . . . . . . . . . . . . . . . . . . 4511
Book stores and news dealers. . . . . . . . . . . . . . . . . . . . . . . . . . . . . . . . . . . . . . . . . . . . . . . . 4512
3.5
4.1
1.7
4.0
4.8
0.9
0.4
0.7
-0.9
3.3
3.7
1.7
-0.6
-1.1
0.9
Motor vehicle and parts dealers. . . . . . . . . . . . . . . . . . . . . . . . . . . . . . . . . . . . . . . . . . . . . . . . . .
Automobile dealers. . . . . . . . . . . . . . . . . . . . . . . . . . . . . . . . . . . . . . . . . . . . . . . . . . . . . . . . . . . . .
Other motor vehicle dealers. . . . . . . . . . . . . . . . . . . . . . . . . . . . . . . . . . . . . . . . . . . . . . . . . . .
Auto parts, accessories, and tire stores. . . . . . . . . . . . . . . . . . . . . . . . . . . . . . . . . . . . . .
10
Table 2. Average annual percent change in labor productivity, unit labor costs, and related data,
1987-2014 — Continued
2012
NAICS
code
Industry
Average annual percent change, 1987-2014
Labor
productivity
Output
Hours
Labor
compensation
Unit labor
costs
General merchandise stores. . . . . . . . . . . . . . . . . . . . . . . . . . . . . . . . . . . . . . . . . . . . . . . . . . . . . 452
Department stores. . . . . . . . . . . . . . . . . . . . . . . . . . . . . . . . . . . . . . . . . . . . . . . . . . . . . . . . . . . . . . 4521
Other general merchandise stores. . . . . . . . . . . . . . . . . . . . . . . . . . . . . . . . . . . . . . . . . . . . 4529
3.1
0.7
5.4
4.5
1.0
7.9
1.3
0.3
2.4
3.6
1.8
5.5
-0.9
0.8
-2.3
Miscellaneous store retailers. . . . . . . . . . . . . . . . . . . . . . . . . . . . . . . . . . . . . . . . . . . . . . . . . . . . .
Florists. . . . . . . . . . . . . . . . . . . . . . . . . . . . . . . . . . . . . . . . . . . . . . . . . . . . . . . . . . . . . . . . . . . . . . . . . . .
Office supplies, stationery and gift stores. . . . . . . . . . . . . . . . . . . . . . . . . . . . . . . . . . . .
Used merchandise stores. . . . . . . . . . . . . . . . . . . . . . . . . . . . . . . . . . . . . . . . . . . . . . . . . . . . . .
Other miscellaneous store retailers. . . . . . . . . . . . . . . . . . . . . . . . . . . . . . . . . . . . . . . . . . .
453
4531
4532
4533
4539
3.2
2.3
5.2
4.8
1.1
3.2
-0.1
4.2
6.3
2.2
-0.1
-2.3
-1.0
1.4
1.1
2.2
0.3
1.6
3.9
2.5
-1.0
0.3
-2.5
-2.2
0.3
Nonstore retailers. . . . . . . . . . . . . . . . . . . . . . . . . . . . . . . . . . . . . . . . . . . . . . . . . . . . . . . . . . . . . . . . . .
Electronic shopping and mail-order houses. . . . . . . . . . . . . . . . . . . . . . . . . . . . . . . . . .
Vending machine operators. . . . . . . . . . . . . . . . . . . . . . . . . . . . . . . . . . . . . . . . . . . . . . . . . . . .
Direct selling establishments. . . . . . . . . . . . . . . . . . . . . . . . . . . . . . . . . . . . . . . . . . . . . . . . . . .
454
4541
4542
4543
7.9
9.9
0.2
2.3
8.6
14.2
-2.3
0.9
0.7
3.9
-2.6
-1.4
4.2
8.1
0.5
1.3
-4.1
-5.4
3.0
0.4
0.4
1.1
-0.3
0.4
0.4
0.5
0.3
2.0
2.4
-0.7
2.2
2.2
2.2
2.1
1.6
1.3
-0.3
1.8
1.8
1.7
1.9
5.1
3.6
2.6
5.5
5.5
5.9
5.0
3.1
1.2
3.2
3.3
3.3
3.7
2.8
Food Services and Drinking Places
Food services and drinking places. . . . . . . . . . . . . . . . . . . . . . . . . . . . . . . . . . . . . . . . . . . . . .
Special food services. . . . . . . . . . . . . . . . . . . . . . . . . . . . . . . . . . . . . . . . . . . . . . . . . . . . . . . . . . .
Drinking places, alcoholic beverages. . . . . . . . . . . . . . . . . . . . . . . . . . . . . . . . . . . . . . . . .
Restaurants and other eating places. . . . . . . . . . . . . . . . . . . . . . . . . . . . . . . . . . . . . . . . .
Restaurants and other eating places. . . . . . . . . . . . . . . . . . . . . . . . . . . . . . . . . . . . . . .
Full-service restaurants. . . . . . . . . . . . . . . . . . . . . . . . . . . . . . . . . . . . . . . . . . . . . . . . . . .
Limited-service eating places. . . . . . . . . . . . . . . . . . . . . . . . . . . . . . . . . . . . . . . . . . . . .
11
722
7223
7224
7225
72251
722511
722513,4,5
© Copyright 2026 Paperzz