POLITECNICO DI MILANO Scuola di Ingegneria Industriale e dell’Informazione Corso di Laurea Specialistica in Ingegneria Nucleare LONG TERM PERFORMANCES OF NON-EVAPORABLE GETTER FILMS IN THE LARGE HADRON COLLIDER Relatore: Prof. Marco BEGHI Correlatore: Dott. Giuseppe BREGLIOZZI Tesi di Laurea di: Vittorio BENCINI Matr. 801011 Anno Accademico 2014 / 2015 Acknowledgements First of all I would like to thank Giuseppe Bregliozzi, my supervisor at CERN, who guided me during this year, teaching me everything I know about NEG and supporting me in every moment. Thank to Prof. Marco Beghi, who informed me about the opportunity to write my thesis at CERN and followed me, as supervisor at Politecnico di Milano. A special acknowledgement goes to Gregory Cattenoz, and to all the persons of building 113, for their continuous help, their patience and, most of all, their friendship. I am also grateful to Paolo Chiggiato, the Vacuum Surfaces and Coatings group leader, and to all the colleagues of the Beam Vacuum Operation section. I want to thank all the guys of the Open Space, the oce where I worked this year, for their company and their friendship. Between them a really special acknowledgement goes to Roberto Salemme, who helped me to grow up as a professional and as a person, being, at the same time, a friend. Thanks to my parents and my brothers, who supported me during all of these years, sharing with me the successes and the failures, with innite patience. At last I would like to thank my friends, for being always by my side and for all the smiles, the laughs and the incredible experiences leaved together. 2 Abstract To provide Ultra High Vacuum conditions in the Long Straight Sections (LSS) of the Large Hadron Collider (LHC) the internal surface of the room temperature sectors is coated with a Non-Evaporable Getter thin lm. This material is highly reactive, thus when a molecule impinges on its surface it is rstly chemically trapped and then desorbed into the bulk of the material itself. If the gas load on the surface is too high the NEG surface is saturated, having no more free site to host the impinging molecules. In order to restore its pumping properties the oxide layer formed on the surface has to be removed. For this reason the NEG material is heated allowing the diusion of the oxide layer into the bulk: this process is called activation. In 2013, the LHC operation was stopped for a 20 months period called Long Shutdown 1 in order to allow consolidation, maintenance and upgrade. During this period about 80% of the room temperature NEG coated sectors were vented, baked and then re-activated. This study was focused on the analysis of the vacuum performances of this NEG thin lm when subjected to a considerable number of venting and activation cycles. The rst step of this study was to collect and analyse the ultimate pressure values on all the sectors of the LHC after each venting and activation cycle. In parallel an experimental study was carried out in laboratory. Here fteen venting and activation cycles were performed on a NEG coated chamber in order to determine the evolution of the pumping speed,transmission factor and capture probability. Finally the data collected in the LHC and the experimental results were matched in order to explain the measured ultimate pressure trend in the machine and foresee the vacuum performances in the next twenty years of operations of the LHC accelerator. 4 Chapter 1 introduces the CERN accelerator complex, the LHC machine and more in detail the Long Straight Sections, where NEG materials are employed. In Chapter 2 all the quantities, the instruments and the tool used for this study are presented and described, giving basic notions of vacuum physics and technology. Chapter 3 is focused on the description of NEG materials, on their general properties and on the parameters aecting their performances. The Long Shutdown 1 and so the main purposes of this study are presented in Chapter 4; here an analysis of the ultimate pressures in the LHC is carried out. Chapters 5 and 6 are dedicated to the description of the experimental techniques employed for this study and of the obtained results. Finally in Chapter 7 is presented a summary of the conclusions. Sommario Per raggiungere le condizioni di Ultra High Vacuum (UHV) nelle Long Straight Sections (LSS) del Large Hadron Collider le superci interne dei settori a temperatura ambiente vengono rivestite con un lm sottile di materiale appartenente all categoria dei Non-Evaporable Getter (NEG). Quando una molecola impatta sulla superce di un NEG, essa viene intrappolata, grazie all'alta reattivita' chimica di questi materiali, e poi diusa all' interno del bulk. Se la supercie reattiva viene esposta alla pressione atmosferica o a una pressione troppo alta essa viene istantaneamente saturata, riempiendo tutti i siti liberi di reazione e annullando le proprieta' di pompaggio. Per ristabilire le proprieta' di assorbimento e' necessario che il layer di ossido formato sulla supercie sia rimosso. Per questa ragione il NEG viene riscaldato a una temperatura suciente da permettere la difusione dello strato di ossido all'interno del bulk : questo processo e' chiamato attivazione. Questo studio si pone come scopo quello analizzare l'evoluzione delle prestazioni dei NEG thin lms, quando sottoposti a un numero consistente di cicli di venting e attivazione. Nel 2013 le operazioni in LHC sono state interrotte per un periodo di venti mesi chiamato Long Shutdown 1, per sottoporre la macchina a interventi di manutenzione a aggiornamento. Durante questo periodo circa l'80% dei settori a temperatura ambiente, rivestiti da lm di NEG, sono stati ventilati per consentire gli interventi, richiedendo quindi una nuova attivazione. Nella prima fase di questo studio i valori di pressione misurati in tutti i settori di LHC dopo ogni ciclo di attivazione sono stati raccolti e analizzati. Questa fase di analisi e' stata aancata da uno studio sperimentale. In questo ambito una camera rivestita da un lm NEG e' stata sottoposta a quindici cicli di venting e attivazione per studiare l'evoluzione della velocita' 6 di pompaggio, dei valori di trasmissione e della capture probability. Nella fase nale, combinando i dati ottenuti in laboratorio con quelli raccolti in LHC, e' stato possibile comprendere il comportamento dell pressioni nella macchina e dunque fare una stima sull'evoluzione delle prestazioni del sistema a vuoto dell'LHC negli anni a venire. Il Capitolo 1 da' una panoramica sul CERN, sugli acceleratori che ospita e in particolare sull'LHC e le LSS, che assumono un ruolo centrale in questo studio. Nel Capitolo 2 vengono introdotte le nozioni fondamentali di sica e tecnologia del vuoto, dando una posizione di rilievo alla descrizione delle grandezze e degli strumenti utilizzati. Il Capitolo 3 e' integralmente dedicato ai materiali NEG partendo dalla denizione delle grandezze che li caratterizzano no ad arrivare alla descrizione dei parametri che ne inuenzano le caratteristiche. Il Long Shutdown 1 e l'analisi delle pressioni in LHC vengono trattate dettagliatmante nel Capitolo 4. Nei Capitolo 5 e 6 vengono presentati le tecniche e i materiali utilizzati per l'analisi sperimentale e i risultati da essa derivati. Inne nel Capitolo 7 sono raccolte le conclusioni di questo studio. Contents 1 CERN 9 1.1 CERN accelerator complex . . . . . . . . . . . . . . . . . . . . 9 1.2 The Large Hadron Collider . . . . . . . . . . . . . . . . . . . . 10 1.3 Vacuum in the LHC . . . . . . . . . . . . . . . . . . . . . . . 12 1.4 Long Straight Sections . . . . . . . . . . . . . . . . . . . . . . 12 2 Vacuum technology 2.1 2.2 2.3 17 Basic notions . . . . . . . . . . . . . . . . . . . . . . . . . . . 17 2.1.1 Gas kinetics . . . . . . . . . . . . . . . . . . . . . . . . 18 2.1.2 Flow regimes . . . . . . . . . . . . . . . . . . . . . . . 19 2.1.3 Conductance and gas ow . . . . . . . . . . . . . . . . 20 2.1.4 Pumping speed . . . . . . . . . . . . . . . . . . . . . . 24 2.1.5 Gas loads in UHV systems . . . . . . . . . . . . . . . . 25 Vacuum instrumentation . . . . . . . . . . . . . . . . . . . . . 29 2.2.1 Vacuum pumps . . . . . . . . . . . . . . . . . . . . . . 29 2.2.2 Vacuum gauges . . . . . . . . . . . . . . . . . . . . . . 32 Characterization methods . . . . . . . . . . . . . . . . . . . . 38 2.3.1 Transmission method . . . . . . . . . . . . . . . . . . . 38 2.3.2 Numerical simulations for pressure distribution analysis 42 2.3.3 Bake-out and NEG activation . . . . . . . . . . . . . . 44 3 Non-Evaporable Getters 47 3.1 Getter materials . . . . . . . . . . . . . . . . . . . . . . . . . . 47 3.2 Getter technology for particle accelerator . . . . . . . . . . . . 51 3.3 Selection of getter materials . . . . . . . . . . . . . . . . . . . 53 8 CONTENTS 3.4 TiZrV lms . . . . . . . . . . . . . . . . . . . . . . . . . . . . 54 4 Long Shutdown 1 4.1 Interventions in the LSS . . . . . . . . . . . . . . . . . . . . . 60 4.1.1 4.2 59 Vacuum system . . . . . . . . . . . . . . . . . . . . . . 62 Ultimate pressure analysis . . . . . . . . . . . . . . . . . . . . 63 5 Experimental techniques 67 5.1 Ageing Test Bench . . . . . . . . . . . . . . . . . . . . . . . . 68 5.2 NEG Pilot Sector . . . . . . . . . . . . . . . . . . . . . . . . . 76 6 Results 6.1 6.2 81 Ageing Test Bench . . . . . . . . . . . . . . . . . . . . . . . . 81 6.1.1 Sticking factor analysis . . . . . . . . . . . . . . . . . . 81 6.1.2 Pumping speed . . . . . . . . . . . . . . . . . . . . . . 86 6.1.3 LHC pressure long term analysis . . . . . . . . . . . . 88 NEG Pilot Sector . . . . . . . . . . . . . . . . . . . . . . . . . 92 7 Conclusions 93 Bibliography 95 List of gures 102 List of tables 103 Chapter 1 CERN 1.1 CERN accelerator complex The accelerator complex at CERN is a succession of machines that accelerate particles to increasingly higher energies. Each machine boosts the energy of a beam of particles, before injecting it into the next machine in the sequence. In the Large Hadron Collider (LHC, 27 km long), the last element in this chain, particles are accelerated up to the record energy of 7 TeV per beam. Most of the other accelerators in the chain have their own experimental halls where beams are used for experiments at lower energies. The source protons are produced by a simple bottle of hydrogen gas. An electric eld is used to strip hydrogen atoms of their electrons to yield protons. Linac 2, the rst accelerator in the chain, linearly accelerates the protons to the energy of 50 MeV. The beam is then injected into the 157 meters long Proton Synchrotron Booster (PSB), which accelerates the protons to 1.4 GeV, followed by the Proton Synchrotron (PS, 628 meters long), which pushes the beam to 25 GeV. Protons are then sent to the Super Proton Synchrotron (SPS, 7 km long) where they are accelerated to 450 GeV. The protons are nally transferred to the two beam pipes of the LHC. The beam in one pipe circulates clockwise while the beam in the other pipe circulates anticlockwise. It takes 4 minutes and 20 seconds to ll each LHC ring, and 20 minutes for the protons to reach their maximum energy of 7 TeV. Beams circulate for many hours inside the LHC beam pipes under normal operating conditions. The two beams 10 CERN Figure 1.1: CERN accelerator facility (courtesy of CERN). are brought into collision inside four detectors (ALICE, ATLAS, CMS and LHCb) where the total energy at the collision point is equal to 14 TeV. [1]. 1.2 The Large Hadron Collider The Large Hadron Collider (LHC) is the world's largest and most powerful particle accelerator. It rst started up on 10 September 2008, and remains the latest addition to CERN's accelerator complex. The LHC consists of a 27 km ring of superconducting magnets with a number of accelerating structures to boost the energy of the particles along the way. The beams are kept into their orbit by strong magnetic eld provided by superconducting magnets. To reach superconductivity regime the magnets are cooled down to the temperature of 1.9 K. To achieve this temperature the superconducting parts of the accelerator are connected to a liquid helium distribution system. To direct the beam about 1500 magnets (quadrupoles and dipoles) are installed on the machine. Other kind of magnets have the specic purpose to defocus and than focus the beam before the collisions points to full the 1.2 The Large Hadron Collider 11 parameters required for the collisions. The collision between the proton beams generate many secondary particles that can just exist at so high energies. The main purposes of the studied physics in the LHC is recreate the conditions just after the big bang to understand how the universe developed. A lot of other physics investigations are carried out in the four experiments. A brief description of the four experiments installed in the LHC and their purposes is given below: ATLAS: A Toroidal LHC ApparatuS is a particle physics experiment that searches for new particles and processes using head-on collisions of protons of extraordinarily high energy and luminosity. It was designed to investigate a wide range of physics, from the search for the Higgs boson to extra dimensions and particles that could make up dark matter. With its 46 metres length a diameter of 25 metres ATLAS is the larger experiment installed in the LHC. [1] CMS: The Compact Muon Solenoid has the same scientic goals as the ATLAS experiment, but it uses dierent technical solutions and a dierent magnet-system design. [1] ALICE: A Large Ion Collider Experiment is a heavy ion detector built to study nucleus-nucleus collisions at high energy. The aim of the experiment is to study the physics of strongly interacting matter at extreme energy densities, where the formation of a new phase of matter, the quark-gluon plasma, is expected. [1] LHCb: The Large Hadron Collider beauty is an experiment set up to study b-physics and it is measuring the parameters of CP violation in the interactions of b-hadrons (heavy particles containing a bottom quark). Such studies can help to explain the Matter-Antimatter asymmetry of the Universe and thus the evolution of matter that constituted the universe in the big bang. [1] 12 CERN 1.3 Vacuum in the LHC The vacuum system of LHC consists of two main parts which are kept entirely separated in terms of vacuum since they must meet rather dierent requirements: the cryogenic insulation vacuum necessary to avoid heat load by gas conduction requires a pressure of only about 10−6 mbar, while the beam vacuum, which must provide a good beam lifetime and low background for the experiments, requires several orders of magnitude of better vacuum for the operation with beam. In the arcs, the ultra-high vacuum is maintained by cryogenic pumping of 9000 cubic metres of gas. As the beam pipes are cooled to extremely low temperatures, the gases condense and adhere to the walls of the beam pipe by adsorption. Just under two weeks of pumping are required to bring the pressures down below 10−13. Two important design features maintain the ultra-high vacuum in the room-temperature sections. Firstly, these sections make widespread use of a non-evaporable "getter coating", developed and industrialized at CERN, that absorbs residual molecules when vacuum activated. The coating consists of a thin liner of titanium-zirconiumvanadium alloy deposited inside the beam pipes. It acts as a distributed pumping system, eective for removing all gases except methane and the noble gases. These residual gases are removed by 780 ion pumps uniformly distributed along the ring. Secondly, the room-temperature sections allow "bake-out" of all components at 300 °C. Bake-out is a procedure in which the vacuum chambers are heated from the outside in order to improve quickly the quality of the vacuum. 1.4 Long Straight Sections The LHC Long Straight Sections (LSS) are linear sections serving as experimental or utilities insertions. There is a total of 8 LSS covering 5.8 km of the 27 km constituting the LHC ring total length. Here follows a brief description of the LSS and of the components that they host. Figure 1.2 shows a schematic of the LSS. 1.4 Long Straight Sections 13 Figure 1.2: Schematic of LHC Long Straight Sections. - LSS 1, LSS 2, LSS 5, LSS 8: the experiments [2] In LSS 1, LSS 2, LSS 5, LSS 8 are located ATLAS, ALICE, CMS and LHCb, respectively the four experiments (previously described) and thus the four collision points present in the LHC. LSS 2 and LSS 8 also house the beam injection system from the SPS (TI2 and TI8). - LSS 4: Radio Frequency accelerating cavities [2] The RF cavities are used to accelerate the protons. They are molded to a specic size and shape so that electromagnetic waves become resonant and build up inside the cavity. Charged particles passing through the cavity feel the overall force and direction of the resulting electromagnetic eld, which transfers energy to push them forwards along the accelerator. 14 CERN - LSS 3, LSS 7: Momentum and betatron beam cleaning [2] The tight control of beam losses is the main purpose of the collimation system. Movable collimators dene aperture restrictions for the circulating beam and should intercept particles on large-amplitude trajectories that could otherwise be lost in the superconducting magnets. - LSS 6: Beam dump [2] The function of the beam dumping system is to fast-extract the beam in a loss-free way from each ring of the collider and to transport it to an external absorber, positioned suciently far away to allow for appropriate beam dilution in order not to overheat the absorber material. The LSS are mainly constituted by vacuum beam pipes at room temperature, alternated with stand-alone cryostats. The LSS vacuum chambers are made of several materials: bare or copper plated stainless steel, oxygen-free (OFC) and oxygen-free electronic grade (OFE) copper, aluminium, beryllium, copper plated mu-metal (a mainly nickel-iron alloy with high magnetic permeability). OFC refers to a group of special copper alloys ensuring a high electrical conductivity and a small release of oxygen inside the vacuum chambers. OFE copper, in particular, is characterised by only 0.0005% oxygen content. In addition, these vacuum chambers have disparate lengths (ranging from 20 cm to 7 m), diameters (between 30 mm and 450 mm) and geometries (cylindrical and conical symmetry, circular or elliptical cross-section). However the baseline for the room temperature beam vacuum system is to use 7 m long OFC copper chambers, with an inner diameter of 80 mm, a wall thickness of 2 mm and tted with standard DN100 Conat anges. All these chambers are connected by means of stainless steel bellows equipped with RF copper screens in order to reduce the longitudinal impedance seen by the beam. The chambers are internally coated with a TiZrV non-evaporable getter (NEG) coating, which after having been vacuum activated provides distributed pumping and low outgassing to maintain a low residual gas pressure. Bakeout and NEG vacuum activation must be performed in order to 1.4 Long Straight Sections (a) 15 (b) Figure 1.3: A room temperature sector (a) and a warm-cold transition(b). In gure (b) is possible to see the end of the room temperature chamber and the beginning of the cryostat. ensure the required pressure conditions [5]. Reliable residual gas composition and pressure measurements in the 10−11 mbar range are required in the room temperature part of the beam vacuum system, in order to eciently check the background conditions for the adjacent experiments and to have early detection of leaks or saturation of the NEG coating. Sector valves are employed to separate the cryogenic and the room temperature sections. The modules housing the sector valves are equipped with bellows, to allow the thermal expansion, and sputter-ion pumps. The maximum distance between two sputter-ion pumps is xed at about 28 m, to avoid ion-induced pressure instabilities [7]. One Pirani gauge per sector monitors the pressure evolution during the initial pump down from atmospheric pressure. Moreover, every sector is equipped with two cold-cathode ionisation gauges, installed next to the sector valves. Hot cathode ionisation gauges are permanently installed on the central bellow of the sector or available on mobile diagnostic stations. In the centre of each vacuum sector are installed the pumping ports housing the all-metal roughing valves, necessary for the initial pump-down and for the pumping during the bake-out of each sector. Finally, residual gas analysers mounted on mobile stations allow to characterise the residual gas composition after bake-out and NEG vacuum activation. Chapter 2 Vacuum technology 2.1 Basic notions If a gas behaves obeying to the ideal gas equation of state it can be dened as ideal. The ideal gas equation of state is P V = Nmoles RT (2.1) Nmoles the number of moles present in the vol−1 −1 temperature and R the ideal gas constant ( 8.314K mol where P is the pressure, ume V, T is the in SI units). In a rst approximation the ideal gas equation of state can be considered valid for gas being at atmospheric pressure or below, thus it can be always applied in the framework of vacuum systems in particle accelerators, being the needed pressure some order of magnitude lower than the atmospheric one. Equation 2.1 can be rewritten in terms of the total number on molecules N in the system: P V = N kb T being kb the Boltzmann constant ( 1.38 · 10−23 JK −1 (2.2) in SI units). 18 Vacuum technology 2.1.1 Gas kinetics Consider N molecules of mass m in a volume V each of them having a dierent velocity c, with three components cx,cy and cz on the three space axis x,y,z . Assuming that: - c ranges from 0 to ∞. - particles are seen as point masses. - if two particles are separated by a distance r < R a repulsion is exerted between them and they behave like perfectly elastic spheres of radius R/2. - collision between particles produces a change both in velocity and direction of the particles themselves. and considering that particles undergo frequent collisions, thus not having a constant velocity and specic directions, it is possible to demonstrate that particle velocity distribution can be described by Maxwell-Boltzmann distribution. The average particle speed can thus be written as follows: v = 8kb T = πm 8RT πM (2.3) where M is the molar mass. Some typical values of cryogenic temperature are shown in Table 2.1. v at room and Table 2.1: Average molecular speed for dierent gases and temperature. H2 v v H2 CH4 N2 Ar at 293 K [ ] 1761 1244 622 470 394 at 4.3 K [ ] 213 151 75 57 48 m s m s The Maxwell-Boltzmann theory allows to dene the impingement rate, namely the rate at which gas molecules collide with a unit surface area. Assuming the molecule density n uniform in the considered volume and v the average molecular speed dened above, it is possible to write 2.1 Basic notions 19 1 1 ϕ = nv = n 4 4 8RT πM (2.4) 2.1.2 Flow regimes Mean free path The mean free path is dened as the average distance covered by a molecule between two collisions. In a dened volume these collisions can occur with another molecule or with the wall of the system. The mean free path can be written as λ= √ where n = P kb T 1 2nσc (2.5) n is the molecule density and σ is the collision cross section. Being and δ the molecular diameter, the denition of mean free path becomes λ= √ kb T 2πδ 2 P (2.6) Knudsen number When the typical dimension of the system is of the same order of the mean free path the molecule-wall collisions becomes dominant. For even longer λ the molecule-molecule collisions can be neglected and only the molecule- wall ones are considered. In order to describe the dierent cases above, the Knudsen number is introduced. This adimensional quantity is dened as: Kn = λ D (2.7) where D is the characteristic dimension of the system (the pipe diameter for accelerators). The Knudsen number denes three dierent ow regimes with the properties listed in Table 2.2 In UHV systems the assumption of free molecular ow can always be considered true. 20 Vacuum technology Table 2.2: Gas dynamics regime described by Knudsen number. Kn range Kn < 0.01 0.01 < Kn < 0.5 Kn > 0.5 Regime Description Continuous Gas dynamic dominated by Flow intermolecular collisions Transitional Transition between molecular Flow and viscous ow Free Molecule-wall collisions Molecular dominate Flow 2.1.3 Conductance and gas ow In molecular ow it is possible to dene the gas ow rate. In vacuum technology this quantity is usually expressed in terms of pressure-volume (or P V -throughput) and expresses the number of molecules owing into a xed volume V at pressure P at a temperature T . Q = P V̇ = P dV dt (2.8) This quantity is proportional to the pressure dierence between two points of the considered system. Figure 2.1: Schematic drawing of two volumes communicating through a thin and small wall slot If we consider, for instance, the system in Figure 2.1, the gas ow rate between the two communicating volumes can be written as follow: Q = C(P1 − P2 ) (2.9) 2.1 Basic notions 21 C is called conductance and it depends only on the geometry of the system −1 ] and on the molecular speed inside it. Since Q is expressed in [ mbar · · s −1 ]. the conductance take the form of a volumetric ow rate, thus [ · s The net ow rate between the two volumes can be calculated using the impingement rate described in section 2.1.1. It is given by the dierence between the number of molecules passing trough the orice of surface A from left to right and from right to left. Considering thus 1 ϕ1−→2 = An1 v 4 (2.10) 1 ϕ2−→1 = An2 v 4 (2.11) and the net ow will result as 1 1 v ϕ = ϕ1−→2 − ϕ2−→1 = A(n1 − n2 )v = A (P1 − P2 ) 4 4 kb T Multiplying then the rst and the last term of Equation 2.12 for expressing ϕ in terms of (2.12) kb T and PV : 1 Q = Av(P1 − P2 ) 4 (2.13) and thus 1 C = Av ∝ 4 T m (2.14) As shown in Equation 2.14 the conductance is inversely proportional to the square root of the molecular mass of the gas, so the smaller is the mass of the gas the higher is the conductance. The ratio between the conductances for two dierent gas is C1 = C2 C N2 m2 m1 (2.15) N2 and H2 it is possible to see that the conduc = CH2 × 28\2 = 3.74×CH2 . In Table 2.3 are reported Considering for instance tance of nitrogen Vacuum technology 22 the conductances per unit area (expressed in cm2 ) for the main gases present in typical accelerators vacuum systems. Table 2.3: Unit surface area conductances for common gas species in two dierent units. C at 293 K [ cm2 s ] H2 He CH4 H2 O N2 44 31.1 15.5 14.7 11.7 Ar 9.15 Series and parallel conductances In analogy with electric circuits, it is possible to calculate the conductance resulting by the connection of more conductances. In the electrical analogy we can consider the ow rate as a current and the pressure dierence as the potential dierence. Thus the conductance can be considered as the inverse of the resistance in an electric circuit (following the relations Q = CΔP and ΔV = RI ). Figure 2.2 shows an example of series and parallel conductances. Figure 2.2: Parallel and series connection of conductances. If two pipes are connected in parallel the resulting conductance is: Ctot = i Ci (2.16) 2.1 Basic notions 23 For a series connection of i conductance is valid the relationship: 1 1 = Ctot Ci i (2.17) Conductance of an aperture In free molecular ow regime intermolecular collisions can be neglected. If we consider a thin-wall orice, no collisions between the molecules and the radial wall of the aperture will take place. It implies that all the particles passing through the aperture cannot be backscattered, leading to a transmission equal to one. Therefore the conductance of an aperture can be written as: CAp = vx A 4 (2.18) where vx is the average x-component of velocity for a Maxwell-Boltzmann distribution and A is the cross-section of the aperture expressed in cm2 . Remembering then that vx = 4 RT 2πM (2.19) the conductance can be easily calculated knowing the thermodynamic parameters of a system. Conductance of a pipe with constant cross section In the case of a pipe the thin-wall assumption is not valid anymore. Thus backscattering occurs and not all the particles entering the system are transmitted through it. The conductance of a tube can be calculated multiplying the conductance of an aperture CAp by a proper factor, P r, representing the proportion of particles leaving the exit of the conductance: CP ipe = CAp P r (2.20) can be interpreted as the ratio between a transmitting area and an obstructing. The latter is proportional to the total surface of the pipe. Pr 24 Vacuum technology Being h the perimeter of the pipe, l its length and Atr the transmitting area P r can be expressed as: Pr = Atr Atr + lh (2.21) Introducing then some correction factors taking into account that Atr is usually larger than the actual cross-section A and that the obstructing area is smaller than lh we obtain the nal formula for the conductance of a pipe CP ipe = CAp (1 + 3 lh ) 16 A (2.22) 2.1.4 Pumping speed Pumping speed S is namely dened as the ratio between the gas ow entering the pump Qp and the pump-inlet pressure P and is usually expressed in s−1 . S= Qp P (2.23) The pump throughput can be written as the gas ow ϕ through the cross section of the pump inlet (surface area Ap ) multiplied by the sticking probability s, i.e. the probability for a molecule that enters the pump to be denitely removed and never more reappear in the gas phase of the vacuum system. 1 Qp = ϕAp σ = Ap nvs 4 (2.24) Remembering the denition of the conductance C and the molecule density n we can write Qp = sAp C p kb T (2.25) Converting now the the throughput in PV-units and applying the denition of pumping speed we obtain S = sAp C (2.26) 2.1 Basic notions 25 Therefore, the pumping speed is equal to the conductance of the pump inlet cross section multiplied by the capture probability. The maximum theoretical pumping speed of any pump is obtained for s = 1 and it is equal to the conductance of the pump-inlet cross section. Figure 2.3: Schematic of a vacuum system connected to a pump. Figure 2.3 shows a schematic of a vacuum system. S0 is the pumping speed at the inlet of the pump. To take into account the resistance to the gas ow of pipes and valves the eective pumping speed SEf f is introduced. This quantity represents the pumping speed as seen at the entrance of the vacuum system and is given by: 1 SEf f = 1 1 + S0 Ctot (2.27) For very low conductance values ( C << S0) SEf f = Ctot. 2.1.5 Gas loads in UHV systems The lower limit to the pressure that can be reached in a vacuum system is imposed by the gas load coming out from dierent sources. Three main sources of gas load can be identied: outgassing, leaks, permeation. 26 Vacuum technology Vacuum systems are made of many components connected by mean of anges of dierent typology. Leaks can be dened as a ow of gas passing through the connections between two anges [11] . They are due to the pressure dierence between the atmosphere and the insight of the vacuum system. Even if it is impossible to totally eliminate leaks, they can be limited enough to allow the achievement and maintenance of the required vacuum performances. In the LSS of LHC the leak tightness of the system is provided using CF (ConFlat) anges. CF (ConFlat) anges use a copper gasket and knife-edge ange to achieve an ultrahigh vacuum seal. A schematic of a CF ange is shown in Figure 2.4. Leaks Figure 2.4: ConFlat ange schematic. During the manufacturing of a material or its exposure to air gas is absorbed in the bulk or on the surface of the material itself. The re-emission of this gas in a vacuum system is called outgassing. The outgassing rate of a material strongly depends on the microscopic structure of the surface, thus a good modelling of this phenomenon results dicult. To face up this problem, measurement of the outgassing rate has been performed Outgassing 2.1 Basic notions 27 on many materials [9]. By the measured data it was developed a model to describe the outgassing for dierent materials. q̇outgassing = a1h A (t/1h)α (2.28) where A is the geometrical surface area, a1h is a t parameter identied as the specic outgassing after 1 h and α is the negative slope of the outgassing curve presented in Figure 2.5 [11]. Figure 2.5: Time-dependence of the outgassing ow rate for dierent materials [11]. Permeation Permeation occurs when a gas is adsorbed on high-pressure side of a material, diused through it and eventually desorbed on the low pressure side. Materials used in the construction of UHV systems can be considered impermeable to air even at high temperature. Permeability is usually observed for H2 , considering the high diusivity in metals even at room temperature. 28 Vacuum technology Bake-out eects on outgassing When a metal is exposed to air its surface is covered by a homogeneous oxide layer, by a mix of hydroxide and hydrocarbons and, above all, by water molecules. While at atmospheric pressure, due to its polar nature, water is strongly bonded to the metallic surface, in vacuum conditions water desorption dominates the degassing of metals, according to Equation 2.29. The frequency ν of molecules desorption from a surface corresponds to the probability of desorption per adsorbed species per unit time and it is given by: ν = ν0 e (2.29) − kET b The desorption frequency depends on the binding energy E between a molecule and the surface, thus on the type of gas and surface material, and on the temperature T . In order to reduce the outgassing of a surface during operations vacuum systems undergo a procedure called bake-out [9]. After the mechanical pumpdown of the vacuum system, the metal components are heated up in order to accelerate the desorption of water molecules from the surface. During bake-out the system is connected to the pumping group, which remove the desorbed water molecules. Figure 2.6 shows the pressure evolution during bake-out. During the bake-out of a vacuum system, pressure drastically increases of several orders of magnitude, due to the enhanced desorption from the inner metallic surfaces. Once the bake-out is over and all the water has been desorbed and pumped, the degassing of a vacuum system becomes dominated by hydrogen, which does not come from the surface but rather from the bulk of the metallic components, where this gas is usually included during metallurgic processes. In addition to H , the other main residual gases generally present in a vacuum system after a bake-out are CO, CO and hydrocarbons (in particular CH ). 2 2 4 2.2 Vacuum instrumentation 29 Figure 2.6: Pressure prole during bake-out of a vacuum system. 2.2 Vacuum instrumentation 2.2.1 Vacuum pumps Mechanical pumps These are volumetric pumps used to provide the rst pumping stage, reaching a minimum ultimate pressure in the order of 10−3 . The most used are oil sealed rotary pumps, dry pumps and piston pumps. Primary pump A turbomolecular pump is a multi-stage, bladed turbine in which the rotor is driven at high rotational speeds, so that the peripheral speed of the blades is of the same order of magnitude of the thermal velocity v of the gas molecules to be pumped. A pumping stage is composed of a rotor, which transfers the momentum to the particles, and a stator, whose function is to randomize the angular distribution of the velocities between a stage and the next one. In Figure 2.7 it is possible to see the multiple-stages structure. The most important parameters of a TMP are the pumping speed and the compression ratio kg for a particular gas g. kg is dened as: Turbomolecular pump 30 Vacuum technology Figure 2.7: Section of a turbomolecular pump (TMP). kg = pg,f orevac pg,inlet (2.30) where pg,f orevac and pg,inlet are the pressure at the rst and the last pumping stage respectively. TMP pumps can reach pressures in the order of 10−9 . Capture pumps Gas binding pumps are vacuum pumps that removes gas particles from the system by sorption eects such as chemisorption or implantation. These kind of pumps are used in UHV systems, where the contamination by lubricants and pump uids, for instance, must be avoided. Sputter-ion pumps The pumping eect of sputter-ion pumps is produced by sorption processes, which are released by ionised gas particles. The pumping speed is achieved by parallel connection of many individual Penning cells. A sputter-ion pump consists basically of two electrodes, anode and cathode, and a magnet. The anode is usually cylindrical and made of stainless steel. The cathode plates positioned on both sides of the anode tube are made of titanium, which serves as gettering material (Figure 2.8). The magnetic eld is oriented along the axis of the anode. Electrons are emitted from the 2.2 Vacuum instrumentation 31 cathode due to the action of an electric eld and, due to the presence of the magnetic eld, they move in long helical trajectories which improve the chances of collision with the gas molecules inside the Penning cell. The usual result of a collision with the electron is the creation of a positive ion that is accelerated to some kV by the anode voltage and moves almost directly to the cathode. The inuence of the magnetic eld is small because of the ion's relatively large atomic mass compared to the electron mass. Figure 2.8: Schematic drawing depicting the pumping mechanism of sputter ion pumps in the diode conguration. Ions impacting on the titanium cathode surface sputter titanium away from the cathode, forming a getter lm on the neighbouring surfaces and stable chemical compounds with the reactive or "getterable" gas particles (e.g. CO , CO2 , H2 , N2 , O2 ). This pumping eect is very selective for the dierent types of gas and is the dominating eect with sputter ion pumps. The number of sputtered titanium molecules is proportional to the pressure inside the pump. The sputtering rate depends on the ratio of the mass of the bombarding molecules and the mass of the cathode material. The higher this ratio, the higher is the sputtering rate. For hydrogen, the lightest gas molecule, the sputtering rate of titanium is negligible. In addition to the sputtering process a second important eect can be observed. The energy of the ionised gas particles allows some of the impacting ions to penetrate deeply (order of magnitude 10 atomic layers) into the cathode material. This sorption process pumps all kinds of ions, in particular ions of noble gases which do not react chemically with the titanium layer formed by sputtering. However, this pumping eect is not permanent since, due to the erosion of the I− 2.2 Vacuum instrumentation 33 negatively biased, and the ion current I + is measured. Consider now N − electrons passing from cathode to anode, travelling a length l, through a gas of particle number density n and collision cross-section σ (dependent on the type of gas and the electron energy). If ΔN − ionizing collisions take place then: ΔN − = N − nσl (2.31) Any successful electron collision will form a positive ion, so it results that ΔN − = ΔN + . The number of ion pairs formed per electron per unit of path length through the gas of particle density n is given by: ΔN − = nσ N −l (2.32) Dividing by time Equation (2.31) the ion current I + is obtained as a function of the electronic current ( I − ) between the cathode and the anode. I+ = ΔN + ΔN − N− = = nσl = I − nσl t t t (2.33) Since n = P/kb T we can nally write: I+ = I− σlP = I − KP kb T (2.34) where K is the gauge constant. It depends on the gauge geometry, the type of gas and other several factors. Dierent gases have dierent collision cross section for a certain electron energy (Figure 2.10). The gauges are thus calibrated using N2 as reference gas and a correction factor γ has to be applied if the actual pressure for a dierent gas is needed: Pactual = Pread · γ (2.35) Table 2.4 reports the values of γ for some dierent gases. The electron energy is typically of 100 eV. It is possible to see in Figure 2.10 that it corresponds to the maximum collision cross section for N2 , but not for the other gases and that some gas have lower cross section and some 34 Vacuum technology Gas γ Table 2.4: Correction factors γ for dierent gases. Kr CO2 CH4 Ar CO N2 H2 He 0.59 0.69 0.7-0.8 0.83 0.92-0.95 1 2.4 6.9-7.1 other have higher. Figure 2.10: Ionization cross section as a function of electron energy. There are two eects aecting BA gauge measurement, namely the X-ray eect and the gas-ion desorption that are described below: When the electrons collide with the anode, x-rays are emitted. The so created photons impinge on the cathode generating new electrons from photoelectric eect and increasing the measured current. It implies that the pressure read by the gauge will be higher than the real one. The X-ray eect limits the lower measurable pressure value to 10−12mbar. X-ray eect When the BA gauge is switched on the current starts to ow in the lament. The joule eect induces the heating up of the lament, Gas-ion desorption m/z m/z S m/z + IM/Z PM/Z SRGA = + IM/Z PM/Z 36 Vacuum technology RGA has dierent sensitivities for dierent gases, considering, as in the case of hot ionization gauge, that every gas has dierent ionization crosssection. To face up with this problem the RGA sensitivity is established for one reference gas (N2 for instance). The sensitivities for other gases can be found multiplying the reference sensitivity by appropriate correction factors. During ionization gas molecules can fragment, so it is possible to have different m/z associated with the same species. To take it into account, the cracking (or fragmentation) pattern is introduced. As an example Table 2.5 show cracking pattern values for H2O. Table 2.5: Cracking pattern f measured for H2O for ionizing electron energy of 102 eV. Ion M/Z % of major peak f H2 O 18 100 0.74 + OH 17 25 0.185 + O 16 2 0.015 + H2 2 2 0.015 H+ 1 6 0.044 TOT 135 0.99 Almost all gases fragment during ionization. Two dierent methods can be used for the determination of partial pressure values: - To sum all the ion currents associated with the fragments belonging to a species. To use this method all the mass fragments ( M1,M2, etc.) related to a species have to be identied. The partial pressure for the gas G, pG is than given by: pG = + IM iG i=1 SRGAG = IT+otG SRGAG (2.37) - To select one unambiguous mass fragment ( MG) with its related ion current IM+ and dividing it for the appropriate fragmentation factor fM in order to obtain the total ion current related to the selected species. In this case the partial pressure is given by: g G 2.2 Vacuum instrumentation 37 PG = + IM g (2.38) f M G SG RGA allows to know the gas composition into a system. All the m/z values are progressively selected by the mass separator. The current collected for each in the system. m/z values is proportional to the amount of species The result of measurement is a spectrum of all the currents related to each m/z (Figure 2.12). Figure 2.12: Example of spectrum taken by RGA on an unbaked stainless steel system. It is possible to observe in Figure 2.12 the peaks on 16, 17 and 18 related to the dierent ionized fragments of H2 O . The cracking pattern is calculated considering the maximum intensity of the peak related to each species. 38 Vacuum technology 2.3 Characterization methods To quantify the pumping performance of a NEG coated chamber we use the sticking factor s, dened as the probability for a molecule to be permanently adsorbed on a surface. The main problem to face up is to experimentally evaluate s. For this purpose in the following sections we will describe in detail how the sticking factor can be obtained combining an experimental and a computational approach. In this section the transmission method will be introduced and discussed, while in the next one we will see how the obtained results can be used for the calculation of s. 2.3.1 Transmission method Total pressure The conguration for the characterization of a NEG coated chamber is schematically shown in Figure 2.13. Figure 2.13: Example of conguration for the transmission method. The transmission is dened as the ratio between the variation of pressure on BA gauge 1 and the variation on BA gauge 2 while injecting gas in the system. The injected gas are H2, N2 and CO, which are those pumped by NEG .The transmission for a certain gas G is thus given by: T rP,totG = ΔPBA1 ,G ΔPBA2 ,G (2.39) H2 H2 H2 40 Vacuum technology Partial pressure More accurate transmission values can be obtained using the ratio between the partial pressures instead of the ratio between total pressures. To evaluate the partial pressure two RGAs are installed in front of the BA gauges. A schematic of the modied system is shown in Figure 2.16. As explained in 2.2.2 knowing the current related to a species and the sensitivity of the RGA for that species it is possible to calculate the partial pressure of the considered gas. Figure 2.16: Schematic of partial pressure transmission measurement conguration. The partial pressure transmission for a certain gas G will be then: T rP,parG = ΔPpar,1G ΔPpar,2G (2.40) Figure 2.17 and Figure 2.18 show the evolution of the currents related to dierent m/z values during an H injection. It is possible to notice that not only the current related to the injected gas increases. It means that other species (usually He and CH , m/z = 4 and m/z = 16 respectively) are injected or produced during the injections. 2 4 2.3 Characterization methods 41 Figure 2.17: Evolution of ion currents during an H2 injection on the RGA 1. Figure 2.18: Evolution of ion currents during an H2 injection on the RGA 2. 42 Vacuum technology 2.3.2 Numerical simulations for pressure distribution analysis In a particle accelerator the estimation of residual gas density proles is indispensable to properly design the components and guarantee vacuum stability. Moreover, in the experimental insertion regions, density proles are extremely important to estimate machine background eects in the detectors generated by proton or ion-gas scattering. In a hadron collider, beam induced dynamic eects such as ion, electron and photon-stimulated gas desorption are the main source of residual gas. In order to estimate the pressure proles two dierent numerical simulation software were developed at CERN, namely Molow+ and VASCO. Molow+ Molow+ is a C++ code which implements test-particle Monte Carlo (TPMC) method to describe the residual gas ow into an arbitrary three-dimensional geometry [16]. CAD drawings can be imported in Molow+, that re-elaborate the geometry dividing it in planar facets. For each facet it is possible to set the parameters typically characterizing a vacuum system, such as surface outgassing, sticking probability and pumping speed. Pressure proles on every facet composing the system can be plotted, allowing the evaluation, for instance, the transmission between two gauge for a given sticking factor value or the eective pumping speed. In this study Molow+ was used to create T r-s curves, which allow to calculate, given the transmission experimentally measure on a test bench, the sticking factor of the NEG thin lm. Figure 2.19 shows the typical Molow+ interface. The coloured part is a texture in which every colour corresponds to a specic pressure values, while the box on the right of the screen is the pressure prole along the considered system. For a detailed description the theoretical basics of (TPMC) see [16]and [18]. 2.3 Characterization methods 43 Figure 2.19: Example of Molow+ interface with the main functions. VASCO code The VAcuum Stability COde (VASCO) allows the estimation of residual gas density proles. The code treats the vacuum system as a sequence of elements linked with boundary conditions. It was used to verify the vacuum stability and beam life time during the LHC design. In the calculation of the rate of change of molecules density per unit volume, four parameters are taken into account: - Molecular diusion along the chamber due to pressure gradient. - Beam induced dynamic eects (ion, electron and photon-stimulated desorption) - Distributed pumping along the pipe (cryopumping, NEG pumping) - Gas lumped pumping (sputter-ion pumps) VASCO is a nite elements code, which divides the vacuum system in several elements, each one characterised by a dierent set of parameters; Vacuum technology 44 boundary conditions must be properly set in order to ensure the continuity of gas density and ux between each pair of elements. The model uses cylindrical geometries allowing for one-dimensional approximation along the beam axis. Moreover, the parameters are assumed to be time invariant, it means that the gas density is estimated as relevant to a specic moment in time. The set of equations describing the gas density takes into account the inuence that one species has on the desorption of the others. Thus the equations for each gas are linked to the ones for the other species. VASCO code is implemented in Matlab, so the input le must be a rectangular matrix without empty spaces. The input le is prepared in Excel, than saved as text le [23]. An example of an input le is given in Figure 2.20 Figure 2.20: Example of VASCO input le. 2.3.3 Bake-out and NEG activation As seen in 2.1.5, bake-out allows to remove water molecules from the surface of metal components of a vacuum system. In this section the bake-out and activation procedure will be presented. - The system is pumped down for at least 12 hours. - Leak detection is done connecting a leak detector [13], a mass spectrometer which detects helium, downstream the TMP. Then the outer 2.3 Characterization methods 45 surface of the ange to be tested is sprayed with a localized stream of helium. If a leak is encountered the helium molecules will penetrate in the vacuum system and will be detected by the mass spectrometer. - If the system is leak tight the bake-out can be started. The components are heated by mean of dedicated heating collars, jackets or tapes depending on the geometry of the component. Figure 2.21 shows the bake-out and activation steps. Figure 2.21: Bake-out and activation procedure. As it is possible to notice dierent components are heated at dierent temperatures (a detailed description will be given in Chapter 5). - In the rst step of bake-out all the non-NEG coated components are heated up to the maximum temperature for 24 h in order to allow the desorption of all water molecules from the surface, while the NEG coated parts are kept at 120 °C in order to avoid water molecules condensation on the surface. - In step two the baked components are cooled down to 120-180 °C (depending on the kind of component) and a spectrum is taken with the RGA to check the composition of residual gas in the system. Then the NEG coated parts are heated up to 230 °C in order to al- 46 Vacuum technology low NEG activation. Pressure evolution during activation is shown in Figure 2.22. Figure 2.22: Pressure evolution during NEG activation. The degas of the instrumentation is performed again at the end of the activation cycle. - In the third step the system is cooled down to room temperature. - After 12 hours the pressure values in the chamber are checked in order to conrm that the activation took place properly. Chapter 3 Non-Evaporable Getters 3.1 Getter materials Getter materials are dened as materials that can chemically pump gas molecules by xing them on an internal surface. Those materials, which can be considered as chemical pumps, are employed in Ultra High Vacuum applications, providing pressure values in a range between ∼ 10−7mbar and ∼ 10−12 mbar. Chemical pumps are generally characterized by a quantity called mean sojourn time, namely the time spent by a captured molecule on the pumping surface. The mean sojourn time is dened as Eb τ = τ0 ·e RT (3.1) where τ0 is the vibrational period of the absorbed molecule, T is the temperature, E is the binding energy and R is the universal gas constant. The molecule can be considered permanently adsorbed by the chemical pump if τ is big enough in comparison with the duration of the experiment. While for physiosorption the bond between gas and surface molecules is due to Van der Waals forces, which provide a binding energy lower than 50Kj·mol−1, for chemisorption a chemical reaction is implied. Covalent, ionic or metallic bonds are in this case involved, providing binding energies even much higher than 50Kj·mol−1. NEG materials can be used at room temperature, having a sojourn time that could be reached just at cryogenic temperature in case 48 Non-Evaporable Getters of physiosorbing materials. In order to allow the reaction between the gas molecules and the surface getter layer, it has to be free of contamination and, more precisely, the native oxide layer has to be removed. The removal of the oxide layer is provided by heating the material; this process is called activation. As a consequence of the fact that in chemisorption mechanism a chemical reaction is implied, inert gases like noble gases cannot be pumped by getter materials. All the other gases, (except H2 which can diuse in the bulk and CH4 that is not pumped by getters) remain on the getter surface when adsorbed, progressively occupying the surface free sites and reducing the pumping speed of the getter itself. Depending on the production process adopted for the active surface production, getter materials are divided in two families: - Evaporable getters : the active layer is obtained under vacuum by sub- limation of a fresh metallic lm. - Non-Evaporable Getters (NEG) : the active surface is produced by thermal diusion of the contaminants present on the layer into the bulk of the getter itself. For most of the baked vacuum systems the main residual gas is H2 . The mechanism of H2 solution in a getter material takes place in three main steps. The rst step consists in the molecule dissociation at the gas surface interface. Afterwards the dissociated particles create chemical bonds with the free sites on the surface. At last the atoms diuse in the bulk of the getter material. Unlike all other gases, H2 sorption in the getter material is thermally reversible. The dissociation pressure PH2 , which describes the equilibrium between the ux of thermal desorption and the ux of pumping of H2 , is dened, according to Sievert's law, as: ΔH PH 2 = A · c 2 · e k b T (3.2) where ΔH is the reaction enthalpy, A is a constant which includes the entropic contribution towards the dissociation reaction of H2 , c2 is the concentration of mono-atomic hydrogen solid solution, kb is the Boltzmann constant and T the temperature of the getter. In UHV conditions the dissolution 3.1 Getter materials 49 pressure has to be very low, in order to have a solid solution thermodynamically stable. [22]. The thermodynamic description of the activation mechanism of a getter material can be obtained considering the Gibbs free energy variation of the oxide ΔGox and of the solid solution ΔGss per oxygen atom. ΔGox = ΔHox − T · ΔSox (3.3) ΔGss = ΔHss − T · ΔSss (3.4) where ΔH and ΔS are the variation of enthalpy and of entropy of the two states respectively. The Gibbs free energy has to be negative to allow the dissolution of the oxide in the solid solution: ΔGtot = ΔGss − ΔGox < 0 (3.5) ΔHss − ΔHox < T (ΔSss − ΔSox ) (3.6) and thus, The entropic term is always negative. Thus there are two ways in which the dissolution can occur. ΔHss > ΔHox (3.7) The dissolution is allowed at all temperatures. This is the case of the metals of the IV group such as T i, Zr, Hf . ΔHss < ΔHox (3.8) In this case Equation 3.6 is satised just if T becomes high enough. So there is a threshold temperature for which the dissolution of the oxide 50 Non-Evaporable Getters is allowed. This is the case of metals of the V group such as V , N b, T a. The concentration x0 in the solid solution for which the oxide and the solid solution phase are in equilibrium and thus solubility limit. ΔGss = ΔGox , is called To take into account the reaction kinetics aspects in the pumping mechanism, the diusivity has to be considered. Diusion is a mass transport process which takes place when a concentration gradient exist between two points. The mass ux is mathematically described by the Fick's law: J = −D∇C where C coecient. (3.9) D is the diusion the temperature T is the concentration of the diusing species and D of the system. is expressed in D 2 [m/s ] and is a function of is dened by the Arrhenius equation: Ei D(T ) = Di e− RT (3.10) Di is the maximum diusion coecient and Ei the activation energy diusion of the element i. being for the By the diusion coecient it is possible to obtain another important quantity, namely the diusion length, dened as the propagation distance in a certain direction after a time t at temperature L= Depending on the value of L boundaries or within the grains. T. D(T )t (3.11) the diusion process can occur at the grain If L is lower than the grain dimension ω the diusion will occur both at the grain boundaries and within the grain, otherwise the diusion will take place mainly at the grain boundaries. 3.2 Getter technology for particle accelerator 51 3.2 Getter technology for particle accelerator For accelerators and storage rings built until the 70's the vacuum needed was provided by mean of pumps connected to the vacuum chambers. This lumped pumping approach became very impractical with the new accelerator's generation. The increase of the machine length, combined with the reduction of the diameter due to the increasing beam energy, led to the reduction of the chambers conductance. Therefore the employment of new pumping systems became essential, considering especially the degassing induced by synchrotron radiation. Integrated sputter-ion pumps were adopted in a rst moment. These pumps used the magnetic eld generated by the machine dipole magnets. However, in the case of LEP (Large Electron Positron Collider) the magnetic eld at injection energy was too close to the pump ignition threshold, making the employment of this kind of pumps dangerous. Instead of sputter-ion pumps was then adopted a linear Non-Evaporable getter (NEG) pump, that doesn't need a magnetic eld to operate and provide an higher pumping speed. Linear NEG pump consisted of 30mm wide strips (St 101, SAES-Getters) coated on both sides with a 100μm thick layer of Non-Evaporable Getter of Zr84 Al16 (weight percentage) powder [3]. These strips provided a pumping speed for H2 of about 2000·s−1 m−1 ; the ultimate pressure which they could produce was limited by the outgassing of CH4 and Ar, He, noble gas and hydrocarbons in general, gasses not pumped by NEG. A schematic of the LEP vacuum chamber cross-section si shown in Figure 3.1. In order to be vacuum activated, the strips were heated until the activation temperature of 750°C by mean of a current of 90 A for about 30 minutes. The employment of a current for heating required electrical insulation for the strips, thus limiting the maximum achievable pumping speed. The use of new NEG alloys (St 707, SAES-Getters) requiring only one hour of activation at 400°C, makes layer passivation feasible during the usual bakeout of the vacuum system. Since the electrical insulation was not anymore required, it was possible to install a larger amount of NEG strips, thus providing higher pumping speed
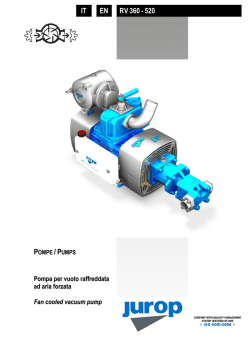
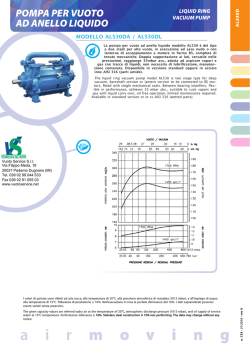
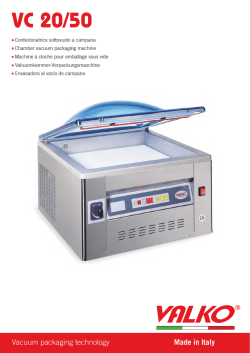
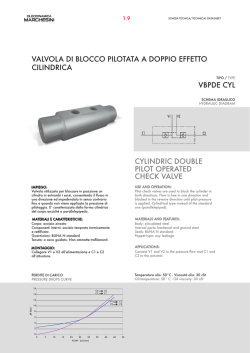
© Copyright 2026 Paperzz